


#29 | Retail Is Coming
#29 | Retail Is Coming
Bitcoin above $40K has caught the attention of retail and institutions alike. What happens next?
Issue #29 of CoinChartist (VIP) overview
Bitcoin is above $40,000. Why volatility has only just begun to unfold
Retail can’t afford BTC: The reason alts are poised to shine soon enough
Bitcoin Dominance Oscillator reaches most extreme reading ever: time to buy?
Special spotlight: Litecoin price doesn’t match fundamentals
A scary look at the S&P 500 that must be invalidated by end of the month
Explaining a possible recession timeline with wave counts in the dollar, SPX, and Bitcoin
How to use the Parabolic SAR to keep your bull run gains
Remember, a premium subscription comes with access to custom technical indicators like the Raging Bull, Trend Wrangler, and more.
Disclaimer: The information provided in this Substack newsletter is for general informational purposes only and should not be considered as financial advice. Investing involves risk, and past performance is not indicative of future results. Please conduct your own research or consult a qualified financial advisor before making any investment decisions. The newsletter disclaims any liability for losses or damages arising from the use of this information.

Bitcoin made waves this week when it blasted above $40,000. Within another 48 hours, BTCUSD added another 10% on top of that, fizzling out (for now) at around $44,000 per coin. This section on Bitcoin will specifically look at volatility and why we should expect price extremes to follow to the upside.

Based on past impulse phases and price behavior, we could finally get our first decent pullback. Still, this won’t be the pullback into the $30K levels that most are expecting. During an impulse phase, pullbacks are shallow. At most we’ll wipe out the 10% rally, then continue on cranking higher, much like we saw in the 2020 price fractal. Failure to make a new high today could create a doji candle and an opportunity for bears to strike back temporarily.

The daily on the left hand side is overextended in the near term, but the domino effect has already begun on volatility. So regardless of what happens on the daily timeframe, it means nothing compared to the weekly and monthly which are both walking the upper Bollinger Bands. This is the first 1M Bollinger Band buy signal since 2020, right before the last bull run. A close above here for December could mean there is no stopping BTC for several months to come.
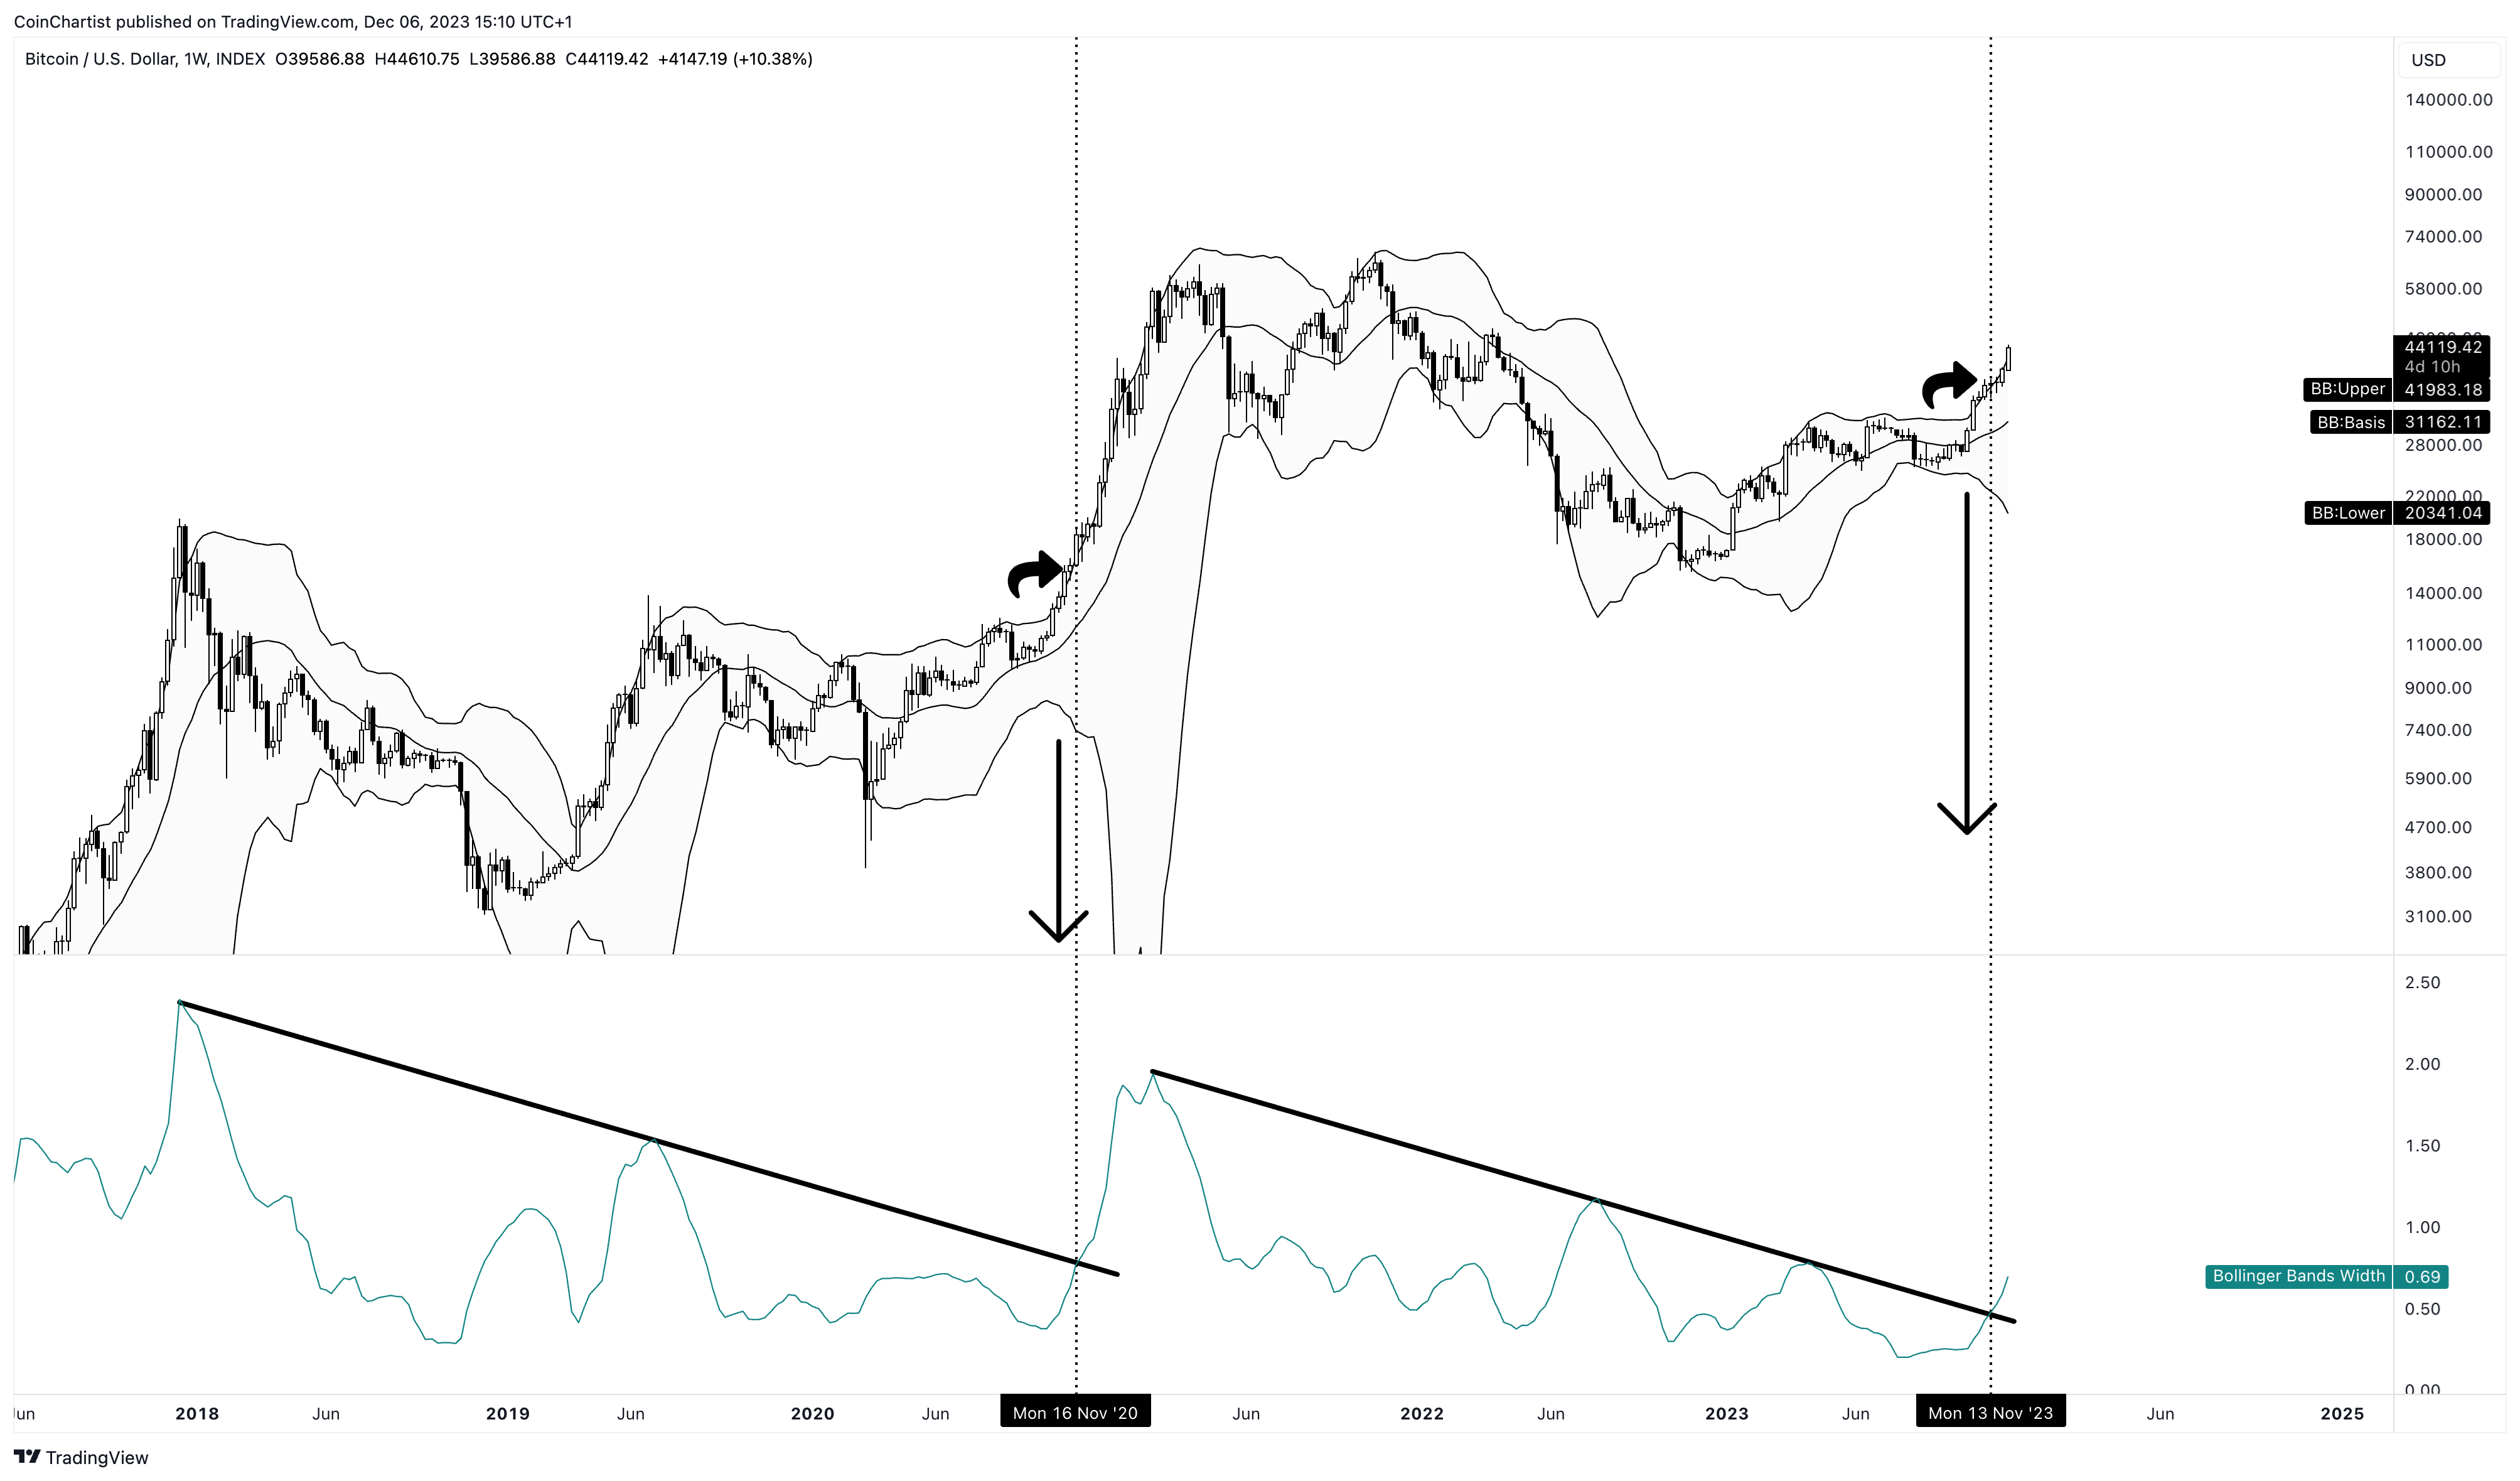
Pay strict attention to the expansion in the weekly Bollinger Bands. The upper and lower bands have begun to widen, and the bottom band should start to drop off the chart like it did in 2020. Bollinger Band Width (BBW) is breaking out from a downtrend, much like it did in 2020 also. This should produce much more of a bang than we’ve seen so far, and Bitcoin is already above $40,000 per coin.

The 1M Bollinger Bands have also started to expand, just like it did in 2020 and 2016. In 2020, the lower Band immediately dropped off the chart, while it took several months for this to happen in 2017. There are two extended downtrend lines on the BBW indicator, meaning an explosively volatile move could appear if BBW gets above either of these lines. A higher high on any indicator is significant.

Quarterly charts show that Bitcoin is working on a massive white candle with no lower or upper wick. Downtrend resistance has been broken, and only two minor horizontal levels remain overhead. Above the current level leaves very little resistance left on the quarterly chart that closes less than a month from now.

Also closing in less than 30 days will be the Bitcoin yearly chart. 12M candlesticks are at resistance now, showing no closing resistance above this very level here. This helps to explain why BTCUSD could face a pullback here. But as long as Bitcoin closes above this red line by the end of December, there won’t be any stopping a further bull run extending into 2024.

Bitcoin’s big advance finally got retail to pay attention. If you haven’t received texts from friends asking about crypto, you will soon. The big problem is that at $40,000 and higher, Bitcoin is priced at a level that the average investor simply cannot afford. Granted they could buy a fraction of a coin, but the retail investor is more than likely going to look toward altcoins. It isn’t here yet, but the change to altcoin season should be close.

Currently, the Bitcoin dominance oscillator is at the lowest extreme ever on the 2W BTC.D chart. When comparing it with the last extreme low, it was the very top in Bitcoin dominance. When the Bitcoin dominance oscillator reaches above 70, it will be time to sell altcoins again. With retail now paying attention to crypto and Bitcoin priced out of reach, altcoin season won’t be far away.

Low timeframe charts of most altcoins aren’t looking great. With Bitcoin booming, profits are flowing back into Bitcoin or even cash. This has altcoins struggling on daily charts, but looking stronger and stronger the higher the timeframe. Ethereum, for example, held a bull crossover on the LMACD and is now above the upper Bollinger Bands on the 1M scale. The last time these conditions appeared was before the 2020 bull run. Flipping this level is the last major resistance before Ether takes off. One caveat is that the signal line remains below zero, so there is still some risk of turning down. However, Bitcoin feels too bullish for this to happen.

Part of the reason for Ether’s weakness, is because other smart contract blockchains are thriving with stronger fundamentals and a fresher narrative. For example, Solana went from being the most hated coin in crypto to the coin with one of the best narratives behind it. It is light-years faster than Ether. But at some point, problems in Solana will show and Ether will show why it is the king of altcoins.

Both Solana and AVAX here are at the upper Bollinger Bands, while at the tightest visible contraction on the entire 1M chart. This is a buy signal, if the altcoins close December like this, which points to more upside and volatility.

Moving to even higher timeframes we can see that some lagging altcoins, like XRP, could be on the brink of a bigger breakout. XRP in the past broke upward out of downtrend resistance on the third major trend line touch. This is where XRP is now, coinciding with a downtrend break on the 3M Stochastic.

The most painful coin to hold is probably Litecoin, which has been the worst performer in my portfolio all 2023. To me, Litecoin has some of the best fundamentals in the space and closely mimics Bitcoin. Why this coin isn’t moving is beyond me, but I suspect its day will come eventually. Its chart looks a lot like XRP, with even more lag.
That’s it for free content. Beyond the paywall is the following content:
Special spotlight: Litecoin price doesn’t match fundamentals
A scary look at the S&P 500 that must be invalidated by end of the month
Explaining a possible recession timeline with wave counts in the dollar, SPX, and Bitcoin
How to use the Parabolic SAR to keep your bull run gains
Remember, a premium subscription comes with access to custom technical indicators like the Raging Bull, Trend Wrangler, and more.

Note: CoinChartist (VIP) Founding Member Coin NFTs are back! Sign up for the Founding Member subscription through Substack to secure your favorite. Above you’ll find a list of all currently available coins. Founding Member Coins enable access to a VIP Telegram channel, 1-on-1 TA training with Tony, and more.
Keep reading with a 7-day free trial
Subscribe to CoinChartist (VIP) to keep reading this post and get 7 days of free access to the full post archives.