


#30 | Relative Strength & ATHs
#30 | Relative Strength & ATHs
Major US stock indices and a handful of cryptocurrencies are hitting ATHs. What happens next?
Issue #30 of CoinChartist (VIP) overview
Bitcoin continues its march toward $100,000
Several altcoins show serious Relative Strength — what to look out for
Bitcoin Dominance forms a pattern with “grave” consequences
The stock market makes new ATHs, what this means for crypto
The dollar’s coming downfall to accelerate bull run
Special spotlight: A trend change in USDT dominance?
Remember, a premium subscription comes with access to custom technical indicators like the Raging Bull, Trend Wrangler, and more.
Disclaimer: The information provided in this Substack newsletter is for general informational purposes only and should not be considered as financial advice. Investing involves risk, and past performance is not indicative of future results. Please conduct your own research or consult a qualified financial advisor before making any investment decisions. The newsletter disclaims any liability for losses or damages arising from the use of this information.

Last week, we looked closely at Bitcoin’s volatility using the Bollinger Bands. As anticipated, volatility picked up during the last several days, and BTCUSD experienced a 10% pullback. This week, we are going to deep dive into Relative Strength to explain why it is unlikely the rally is done in Bitcoin.

The daily price action continues to follow a price fractal from 2020. Several traders and analysts are weary to follow the fractal, but thus far it has acted like a blueprint that keeps on working. If it continues, the Relative Strength Index will make a lower low, but price will not. This will create a bullish divergence.

Another sign the same parabolic pattern could build, is in the fact that the 1D Tenkan-sen is holding as support, driving prices higher. In 2020, the same thing happened with only wicks below it.

Bitcoin appears to be showing the same type of price behavior as 2020, right after approaching former all-time highs. Price consolidated for four weeks, then produced an over 100% rally in the following four weeks. In the BTC CME Futures chart above, Bitcoin also held above a rising window, also know as a gap. These can act as important support or resistance.
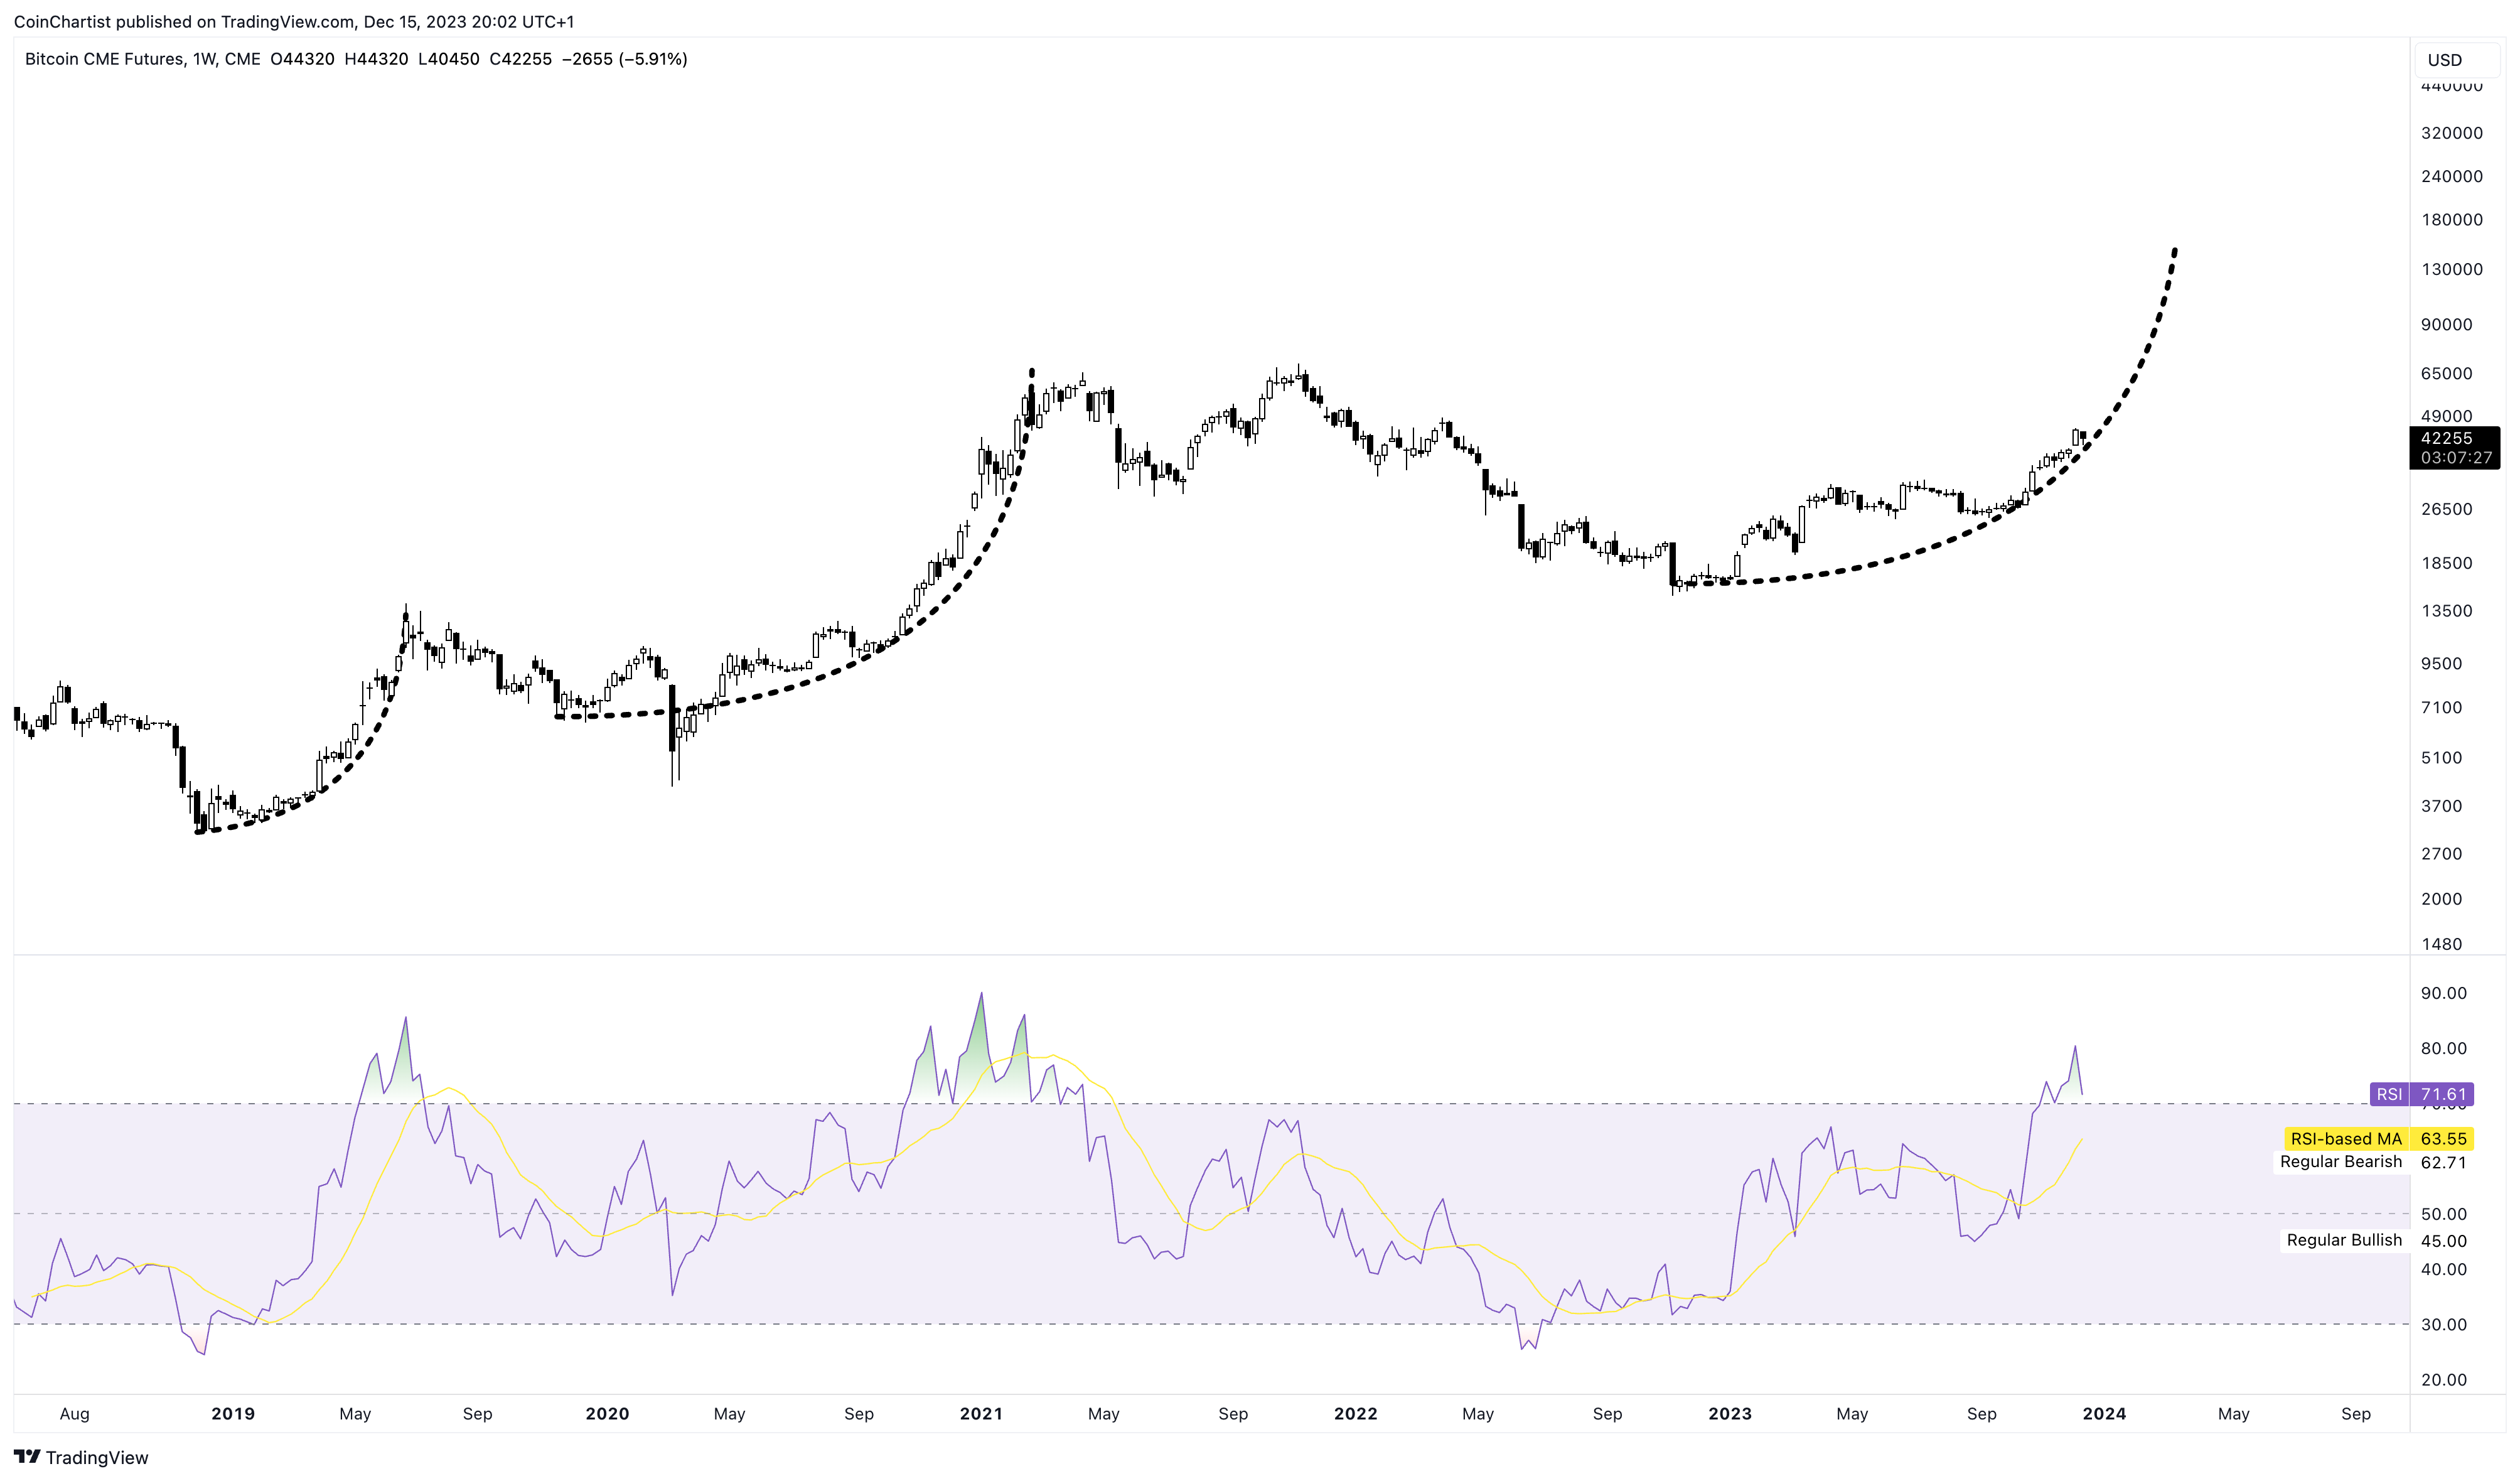
If a similar parabolic trajectory is maintained per previous rallies and RSI stays elevated, Bitcoin could approach over $100,000 per coin in early 2024. Could the Bitcoin ETF hype drive prices this high? We might find out sooner than most are expecting.

A dramatic change is occurring in the relationship between altcoins and Bitcoin, as can be seen in Bitcoin dominance, and sudden overperformance in certain altcoins. We aren’t yet at an altcoin season, but my sense is this is also coming sooner than most are ready for. With Bitcoin near $50,000, it is going to be too expensive for anyone but institutions and the wealthy. But higher prices will eventually attract retail. And with the stock market reaching new all-time highs, risk appetite is bound to return in a big way.

On the weekly timeframe, BTC.D has formed a Gravestone Doji and is working on a possible reversal. Price is also failing to reach the upper trend line in an expanding broadening diagonal. Violating the lower trend line would be notable.

A Gravestone Doji is also forming on the monthly timeframe, which is a lot stronger of a signal. It is still too early in the month to call it official, but the weekly version only has two days left to close.

Altcoins are almost guaranteed to outperform Bitcoin in the near term, as is obvious in the Relative Strength in coins like FET (pictured). Pay attention to the way price reacted the last time a higher high was made on the RSI. This is precisely where FET is, pointing to a possible monster rally from here. FET is also breaking upward out of a massive Inverse Head and Shoulders pattern, with a target of more than 900% ROI.

INJ is an example of what we might see in FET once a higher high is made on the Relative Strength Index. Injective’s RSI is at 92 on the weekly, while BTCUSD is at 75. INJ is even stronger than FET currently which is still at a reading of 82.
That’s it for free content. Beyond the paywall is the following content:
One more altcoin chart that shows the next coin to explode over 70 RSI
The stock market makes new ATHs, what this means for crypto
The dollar’s coming downfall to accelerate bull run
Special spotlight: A trend change in USDT dominance?
Remember, a premium subscription comes with access to custom technical indicators like the Raging Bull, Trend Wrangler, and more.

Note: CoinChartist (VIP) Founding Member Coin NFTs are back! Sign up for the Founding Member subscription through Substack to secure your favorite. Above you’ll find a list of all currently available coins. Founding Member Coins enable access to a VIP Telegram channel, 1-on-1 TA training with Tony, and more.
Keep reading with a 7-day free trial
Subscribe to CoinChartist (VIP) to keep reading this post and get 7 days of free access to the full post archives.