#32 | This Time It's Different
Why reallocation could be responsible for the recent pause in Bitcoin's trend
Bitcoin suffered a roughly 15% pullback from local highs set around the launch of 11 spot BTC ETFs. Because the introduction of spot ETFs were expected by many to be a catalyst for new investment and price appreciation, the contrarian selloff has left the market anxious and fearful in a flash. Is the recent uptrend in cryptocurrencies over, or is this nothing more than a bull market attempting to buck off those with less conviction?
Disclaimer: The information provided in this Substack newsletter is for general informational purposes only and should not be considered as financial advice. Investing involves risk, and past performance is not indicative of future results. Please conduct your own research or consult a financial advisor before making any investment decisions. The newsletter disclaims any liability for losses or damages arising from the use of this information.
Upon observing the technical structure following the recent selloff, it is becoming clear: This time it’s different. This is known to be the four most dangerous words in investing, but according to Hurst Cyclical Theory, variation between cycles is a guarantee – there is no such thing as cyclical perfection.
Thus far, every cycle has been slightly different than the last. Because humans are focused on learning from past patterns, mass crowd psychology ensures that these easy to spot patterns don’t reappear the same exact way. For example, recency bias caused too many to expect the BTCUSD price action in 2023 to behave a lot like 2019. Instead, Bitcoin had a much more shallow rally, but spent the entire year climbing versus only a handful of months. In 2019, the masses expected another immediately parabolic rally akin to 2016 and 2017. Instead they got just the aforementioned handful of months. This time is going to be different, but how, and perhaps more importantly, why?
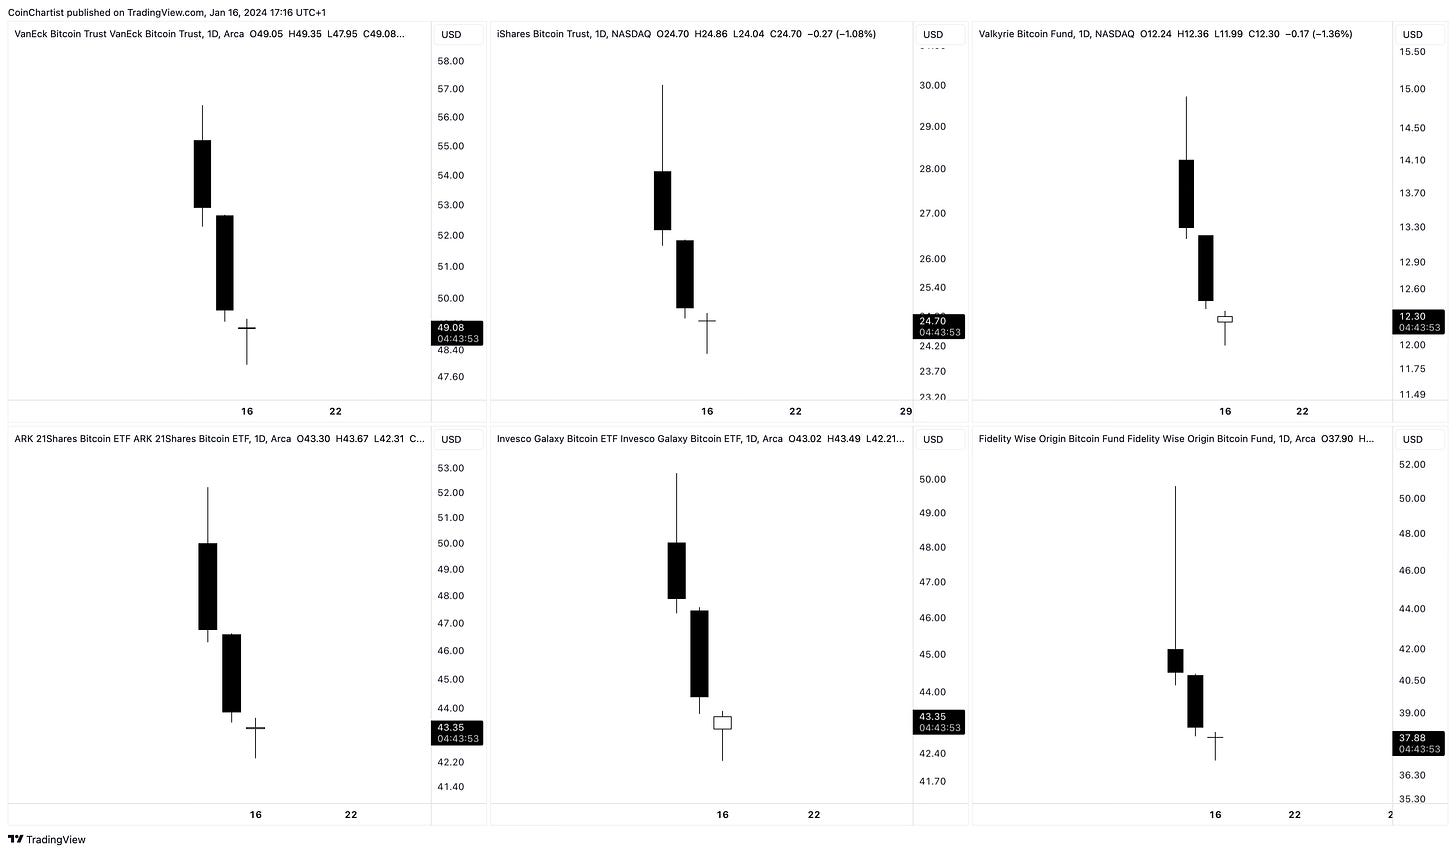
What you see above are six new Bitcoin tickers, from upper left to bottom left clockwise, there are ETFs from VanEck, BlackRock, Valkyrie, ARK, Invesco, and Fidelity. Each of these debuted with two massive down candles, but a doji is forming at what could ultimately be some kind of bottom. Notably, doji are a pause in the market that will lead to either a reversal or continuation. Now that these spot ETFs are available, the recent sell of in spot BTC could be larger entities cashing out spot BTC holdings into shares of ETFs.
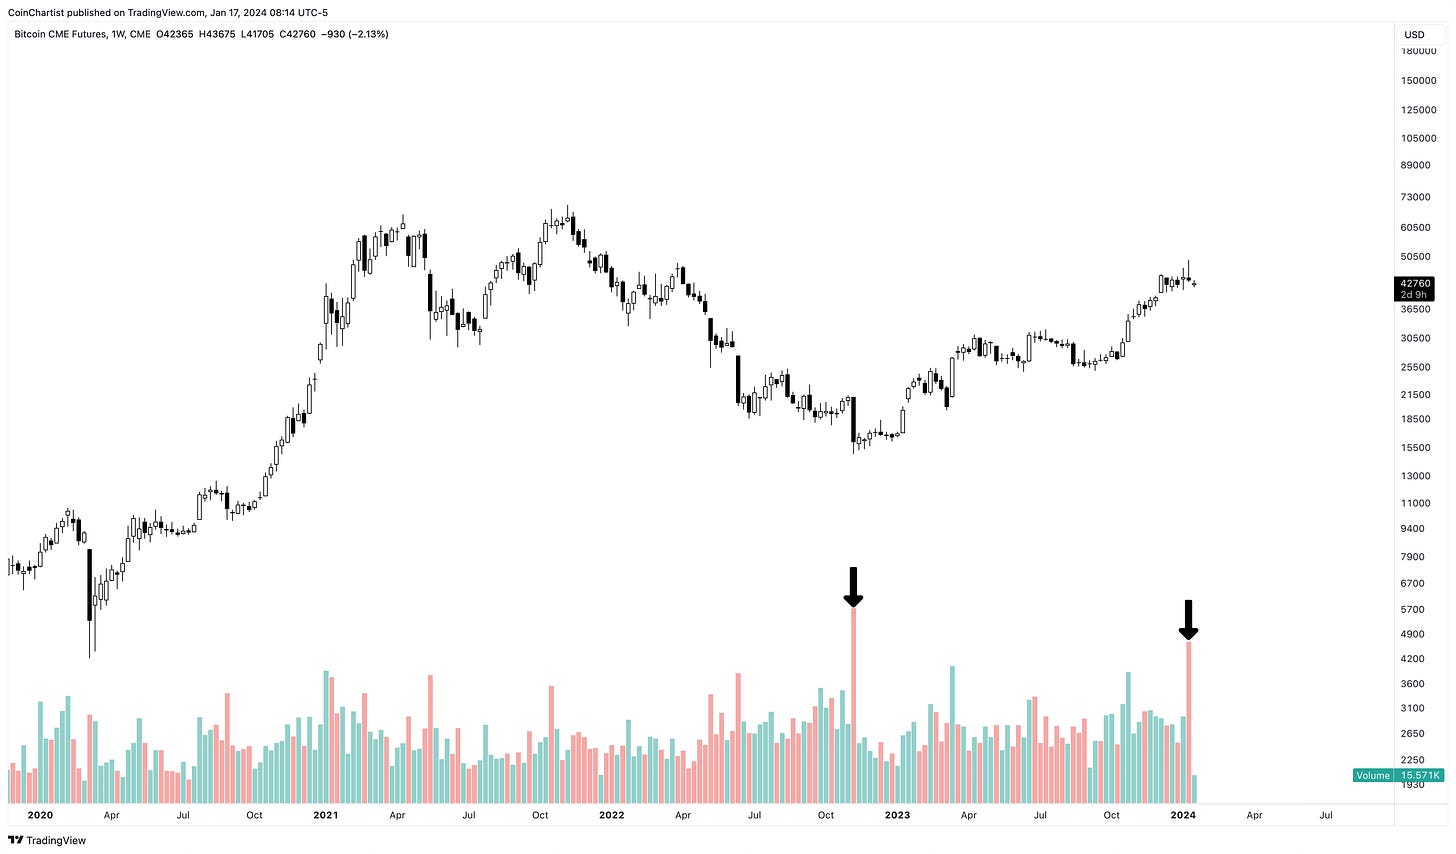
Adding to this theory is the fact that CME BTC Futures saw the second-largest weekly sell volume since the bottom of the recent bear market and during the FTX collapse. The last candle of the bear market saw BTC drop 25% in a single week after already falling nearly 70%. A 15% selloff in a week is barely a blip compared to what was seen in 2022, yet the sell volume is similar. With CME Futures once being the platform for institutions to speculate on Bitcoin price action, could institutions been closing positions to begin taking longer term positions via ETFs? Or is the speculation-driven rally simply finished?
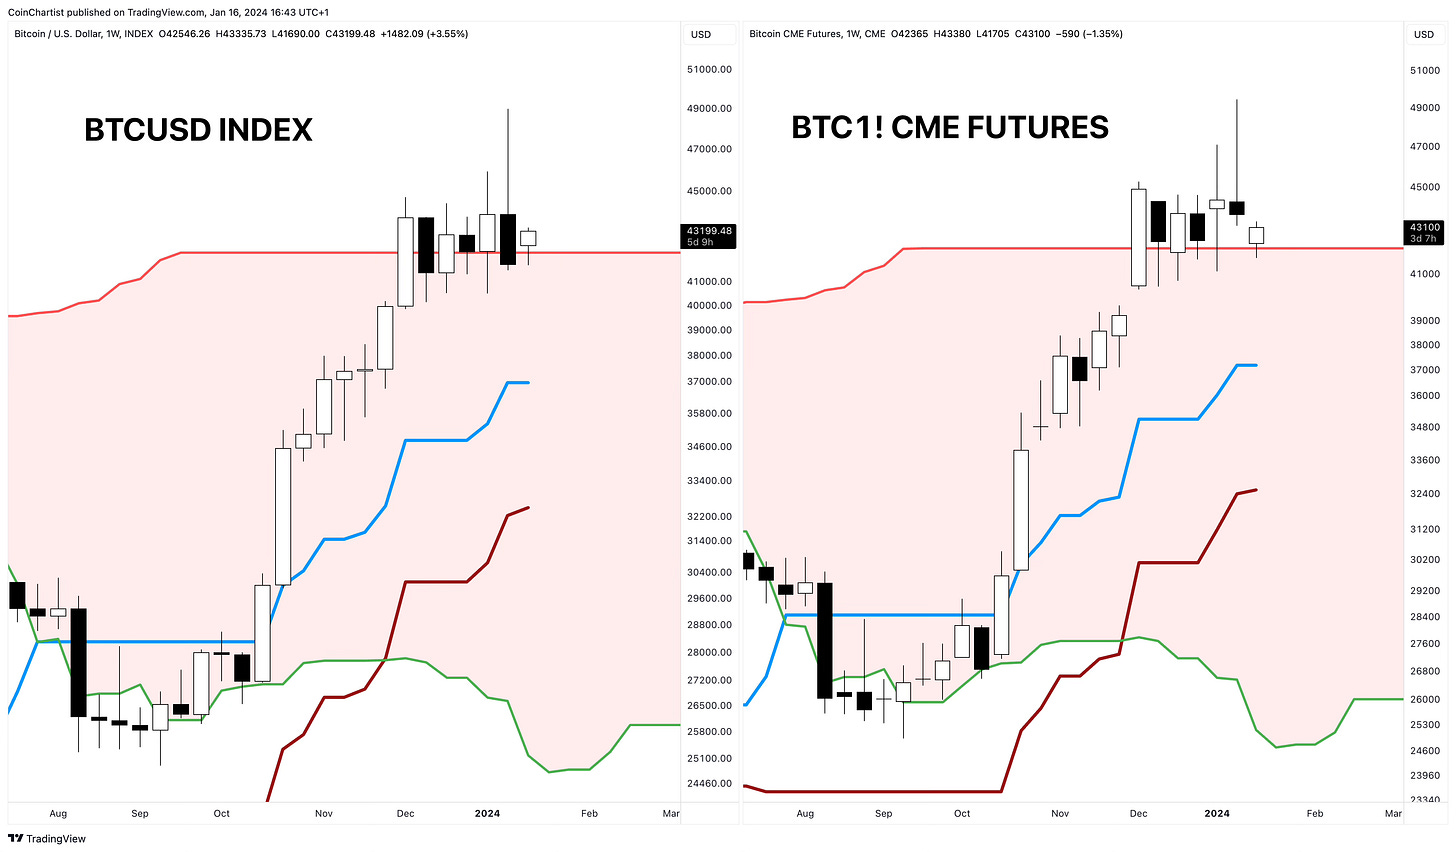
Discrepancies between spot BTCUSD and CME BTC Futures can sometimes suggest a fake move is at play. On the left, BTCUSD Index shows a bearish engulfing candle with a nasty wick at the time showing a strong rejection. Such a move can interrupt a trend and change the sentiment quickly. But this week there must be follow through by bears or bull must hold the ground and prevent any further decline. As long as the blue box highlighting a rising window in BTC CME charts isn’t filled, this uptrend should be fine. If the gap is filled or price cuts through it, concern will grow.
Currently, Bitcoin is above the weekly Ichimoku cloud. This tool was used to long the bottom retest of the cloud, riding the profits all the way from $26,000 to $42,000 per coin. So long as the top of the cloud holds as support, BTC will climb higher. Losing the top of the cloud is a sign that more correction is needed. Subtle yet important signals show that although the bearish engulfing candle on the left closed back into the cloud, price opened above the cloud the following week. BTC CME on the right shows that price has never closed back into the cloud after 6 full weeks. This increases the likelihood that support will ultimately hold.


