


#36 | Believe In The Bull Market
#36 | Believe In The Bull Market
Those sidelined will have to start to consider when to buy and FOMO could ensue.
Disclaimer: The information provided in this Substack newsletter is for general informational purposes only and should not be considered as financial advice. Investing involves risk, and past performance is not indicative of future results. Please conduct your own research or consult a financial advisor before making any investment decisions. The newsletter disclaims any liability for losses or damages arising from the use of this information.
Issue #36 overview:
Bitcoin makes bears into believers
Serious strength in BTC versus Money Supply
A meme coin makes a return
Two market leading alts ready to continue higher
A quick look at NVIDIA
Wave watch walks you though the rest of the bull market

Bitcoin’s rally continues to gain steam and strength, as the spot BTC ETF sucks up what little BTC supply is available. The rally is primarily institution-driven, as retail isn’t paying attention to crypto currently, nor can it easily afford the price of Bitcoin above $50,000 per coin. The closer the top cryptocurrency gets to former ATHs, the more attention it will begin to attract. Once again, retail will end up being sucked in during the fast and furious final stages of the bull market.
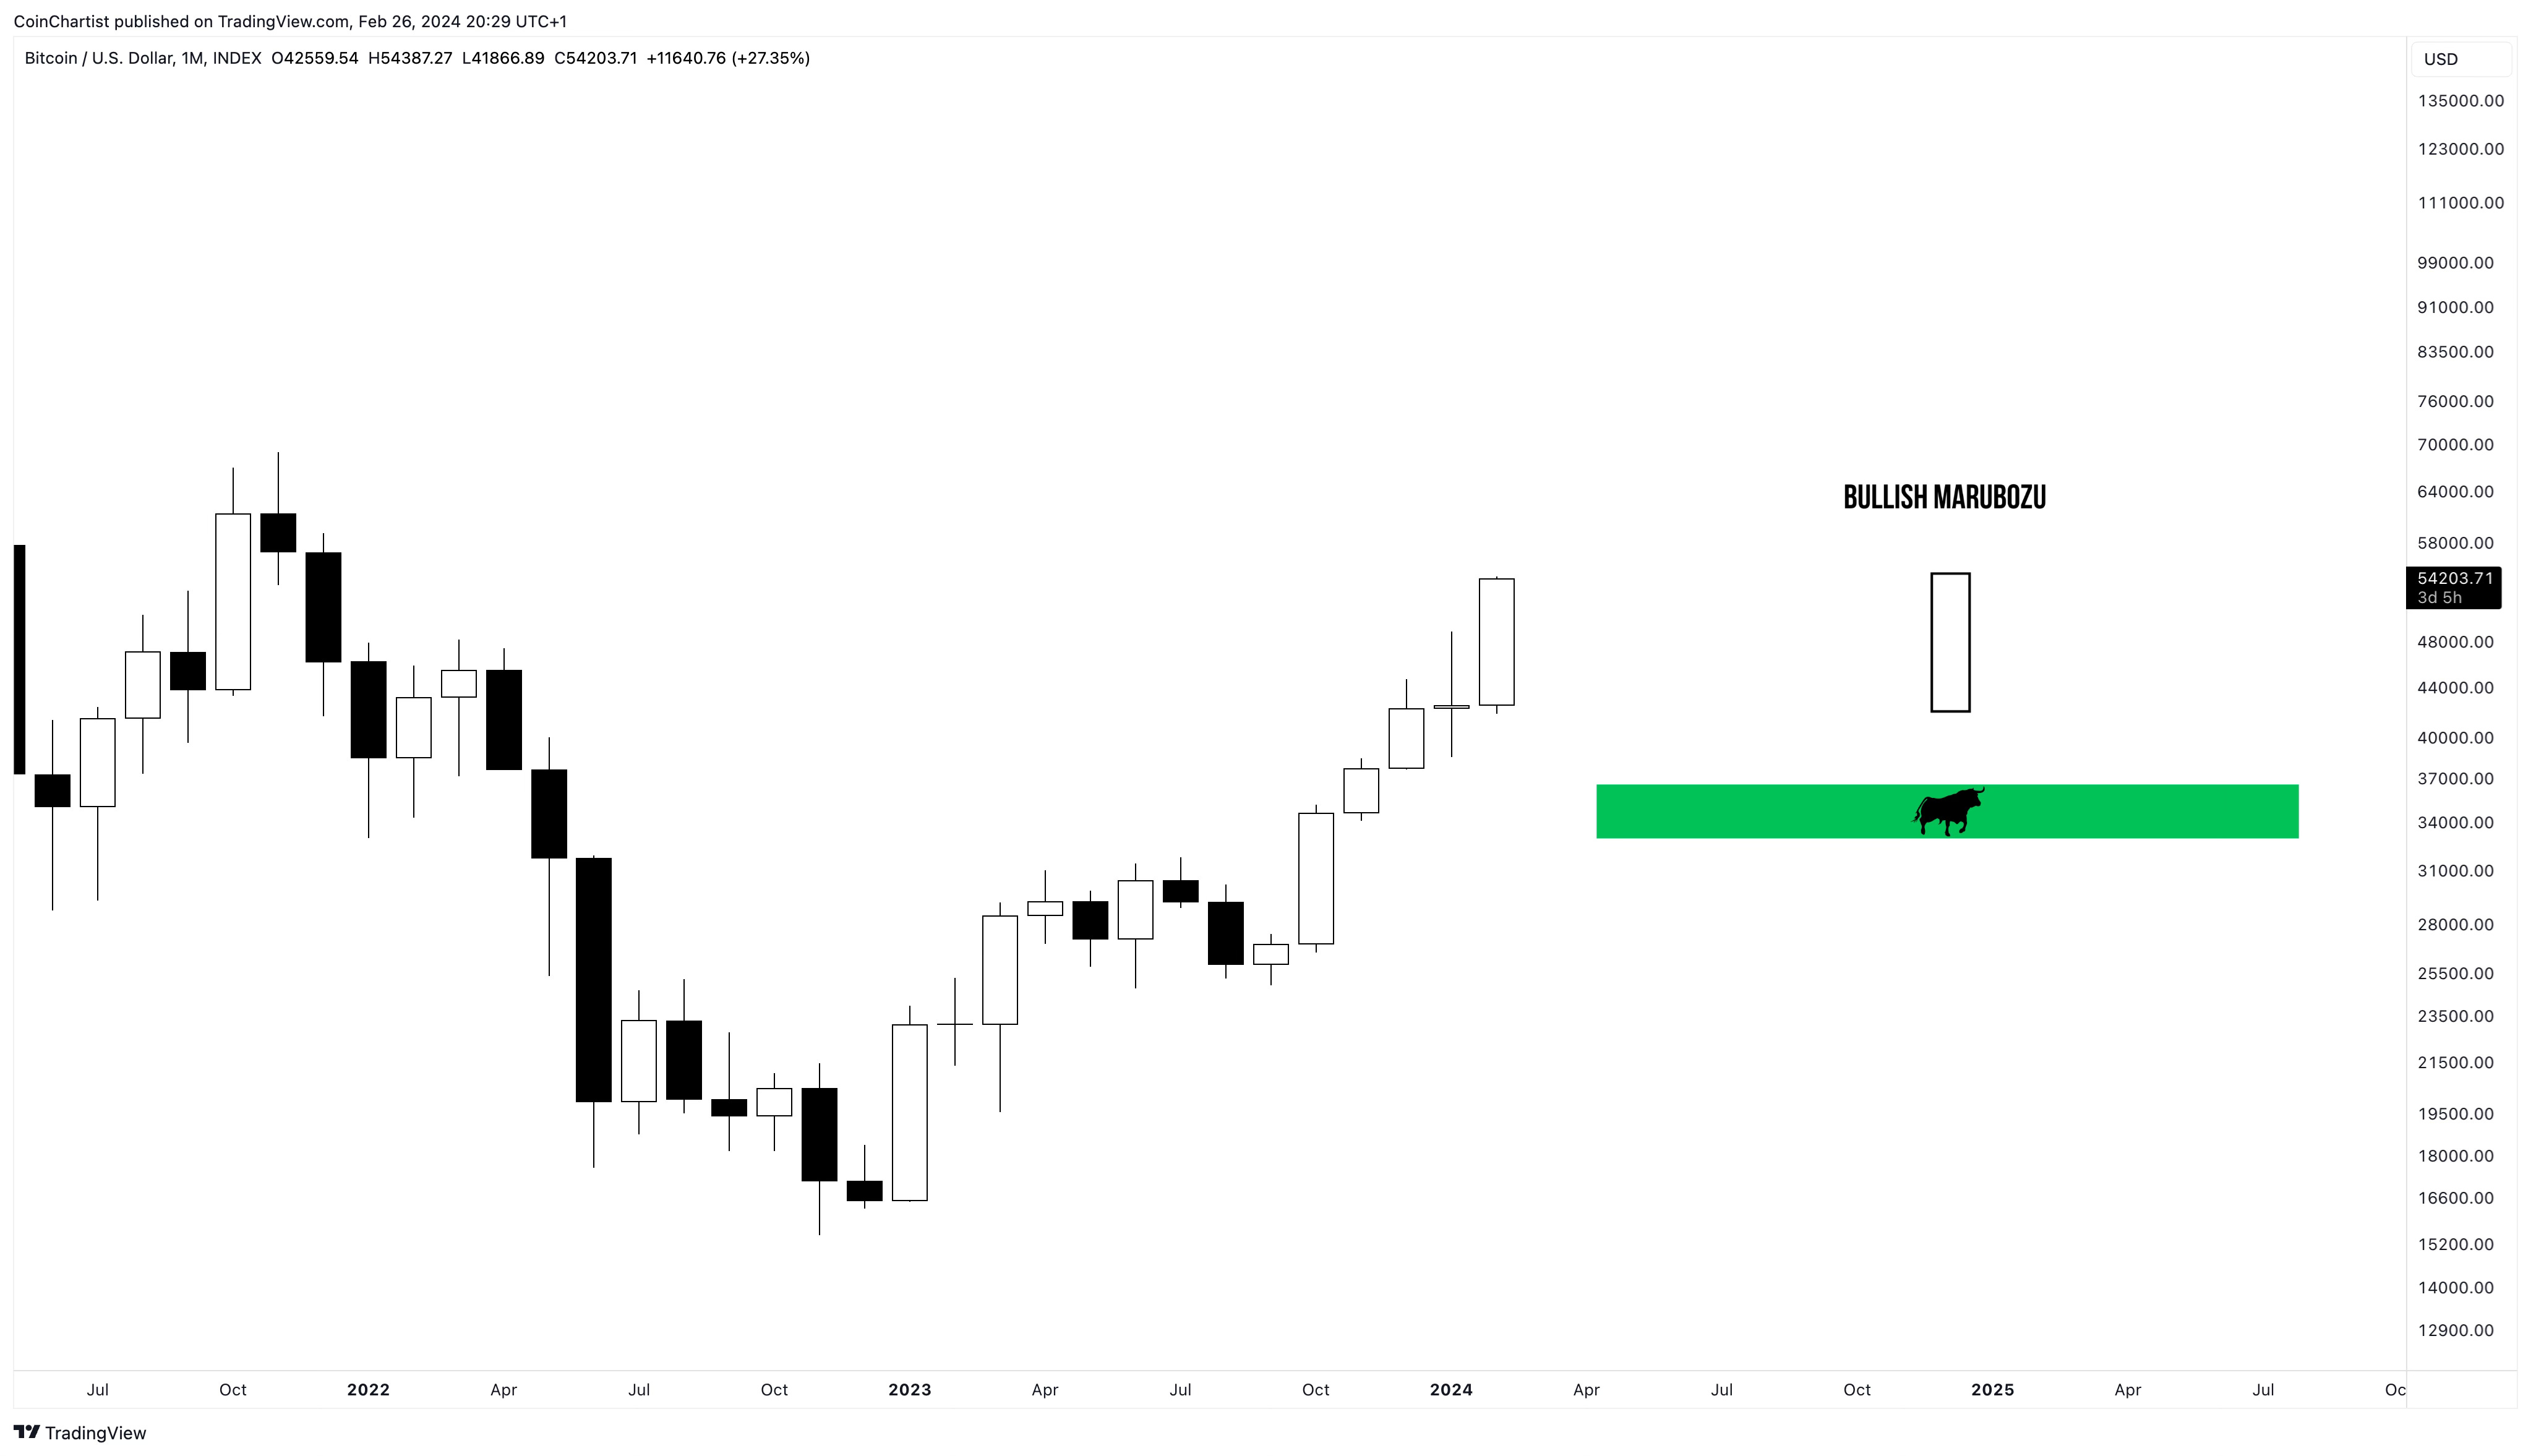
If the February monthly closes at current prices above $54,000 or higher, the candlestick could qualify as a Bullish Marabozu – which represents extremely strong buying pressure throughout a session.

Bitcoin appears to have closed above and held a retest outside of the minor uptrend channel containing price action for the last year plus. Leaving the channel could result in a sharp upward movement and take BTC closer to the $60,000 region. Once there, I don’t anticipate it acting as much resistance.

BTCUSD is well above the weekly upper Keltner channel boundary. When Bitcoin is bullish, price tends to remain elevated above the Keltner channel.

If for some reason Bitcoin does correct harder at current levels, ideally price would retrace and hold at the Bollinger Band basis, at around $42,000 per coin. These deep retraces during the 2017 bull run each returned to the mid-BB, only to rapidly rise higher and higher. During the 2019 and 2020/2021 rallies, price never touched the basis again until the uptrend had ended. Be ready for both scenarios.

Another higher high on the 1W RSI should generate a handful of fresh buy signals in BTCUSD. Momentum will increase at the RSI breaks above horizontal and downtrend resistance lines.

I rarely repeat a chart in any issue, but this in my opinion is the most important chart in all of crypto – Bitcoin’s monthly RSI. If February can close above the overbought boundary at 70, the full strength of the bull run should materialize. BTCUSD remains bullish anywhere between 6 to 14 months historically after reaching above 70.

Although overbought on the RSI is supposed to be a warning that a trend reversal could be imminent, in crypto, it often suggests the opposite – that extreme strength is unfolding.

The focus on the 1M RSI in Bitcoin was used to introduce the importance of reaching over 70. In an interesting unorthodox Bitcoin chart, I’ve plotted BTCUSD agains the M1 Money Supply. Not only is the February candle breaking out of drawn downtrend resistance, but the monthly RSI is back above 70 for the first time since February 2018. On this chart, Bitcoin hasn’t had a bull market nor new ATHs since 2017.
Keep reading with a 7-day free trial
Subscribe to CoinChartist (VIP) to keep reading this post and get 7 days of free access to the full post archives.