


#37 | All-Time High, Now What?
What to expect now that Bitcoin set a new all-time high. Hint: the direction is up!

Disclaimer: The information provided in this Substack newsletter is for general informational purposes only and should not be considered as financial advice. Investing involves risk, and past performance is not indicative of future results. Please conduct your own research or consult a financial advisor before making any investment decisions. The newsletter disclaims any liability for losses or damages arising from the use of this information.
Issue #37 overview:
A cheat code for Bitcoin price action
High timeframe charts confirm the bull run in BTC
Will we finally see altcoin season?
Golden crosses imminent in various altcoins
An update on the DXY Dollar Currency Index
Gold and Bitcoin reach a new ATH the same day
Updated Elliott Wave counts and price targets for ETH & FET

In this issue, considering the recent 10%, confusing correction in Bitcoin, we’ll begin with a Special Spotlight that compares the current price action with late 2020, early 2021’s bull run. The three charts below compare the 2020/2021 daily candlesticks with 2023/2024’s two-day candlesticks. This suggests that price action this time around is taking roughly two times as long to develop, yet somehow the technicals are shockingly the same on the different timeframes.
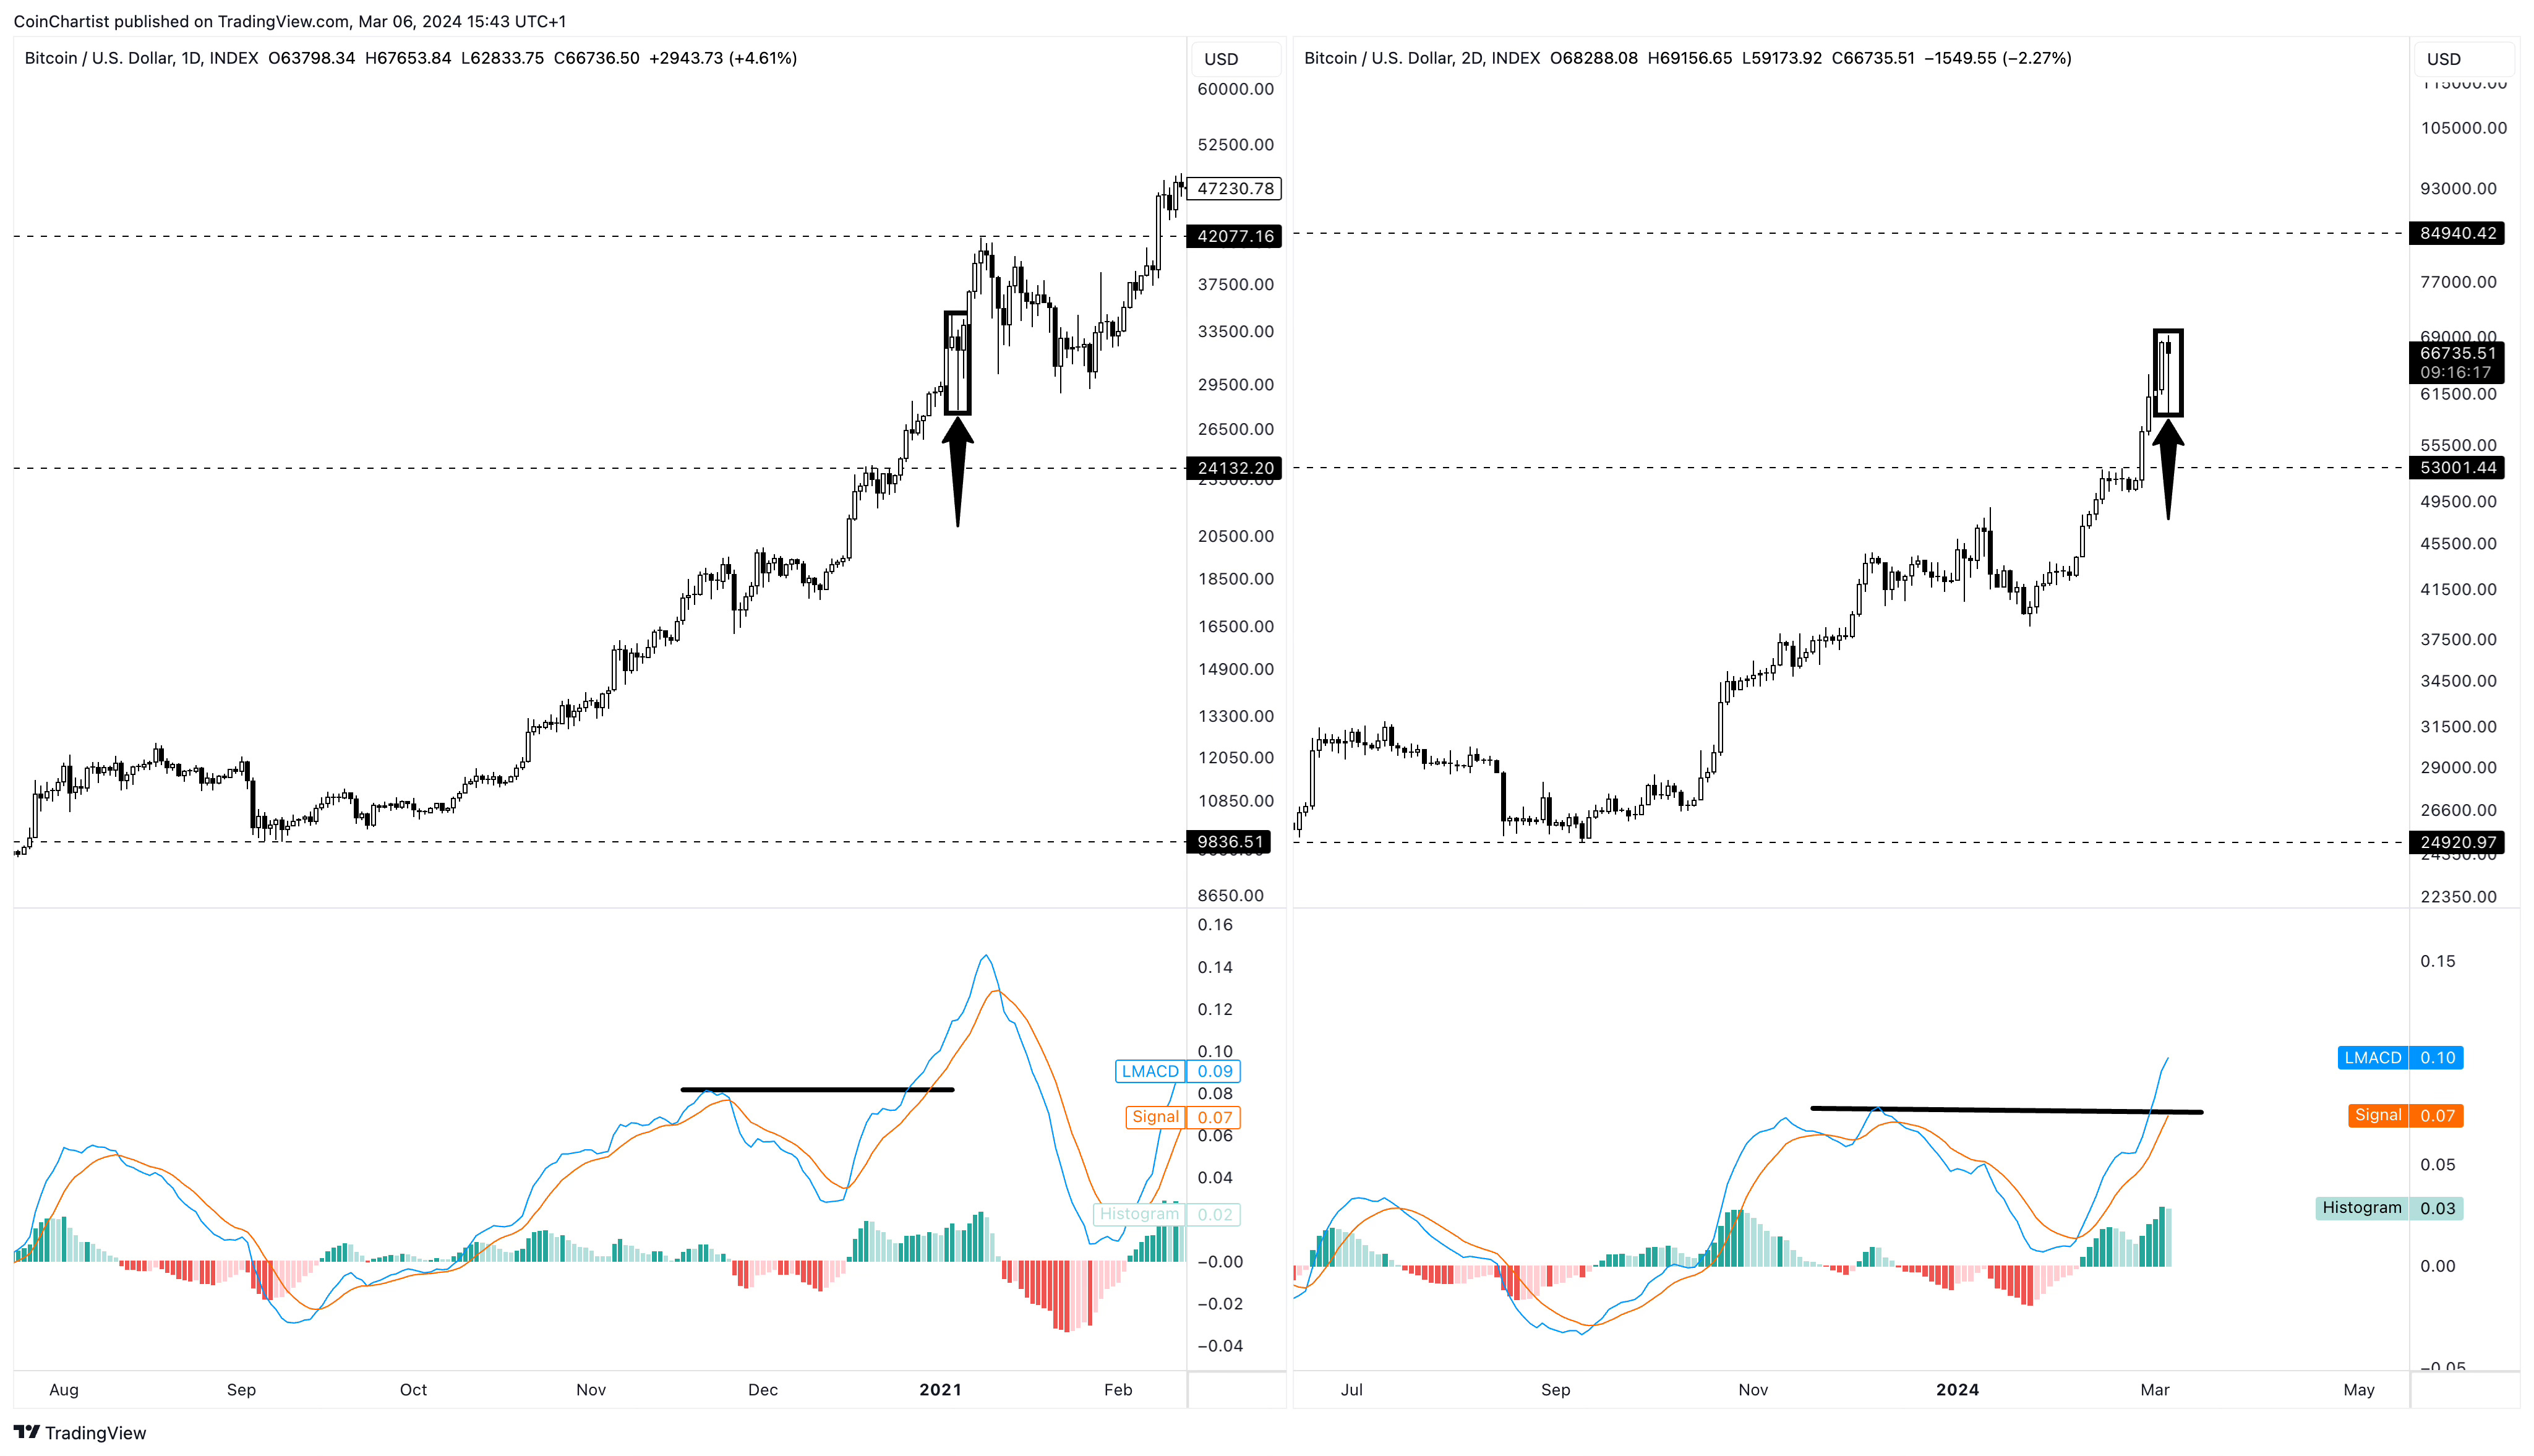
Click the chart to zoom in if you prefer, but the current two-day candlestick looks exactly like the daily candlestick from 2021. This same sort of reaction happened at precisely the same level distance between the dashed support and resistance lines. While this happened, the LMACD was also in the process of making a higher high. Even the earliest visible patterns in the LMACD match up eerily similarly.
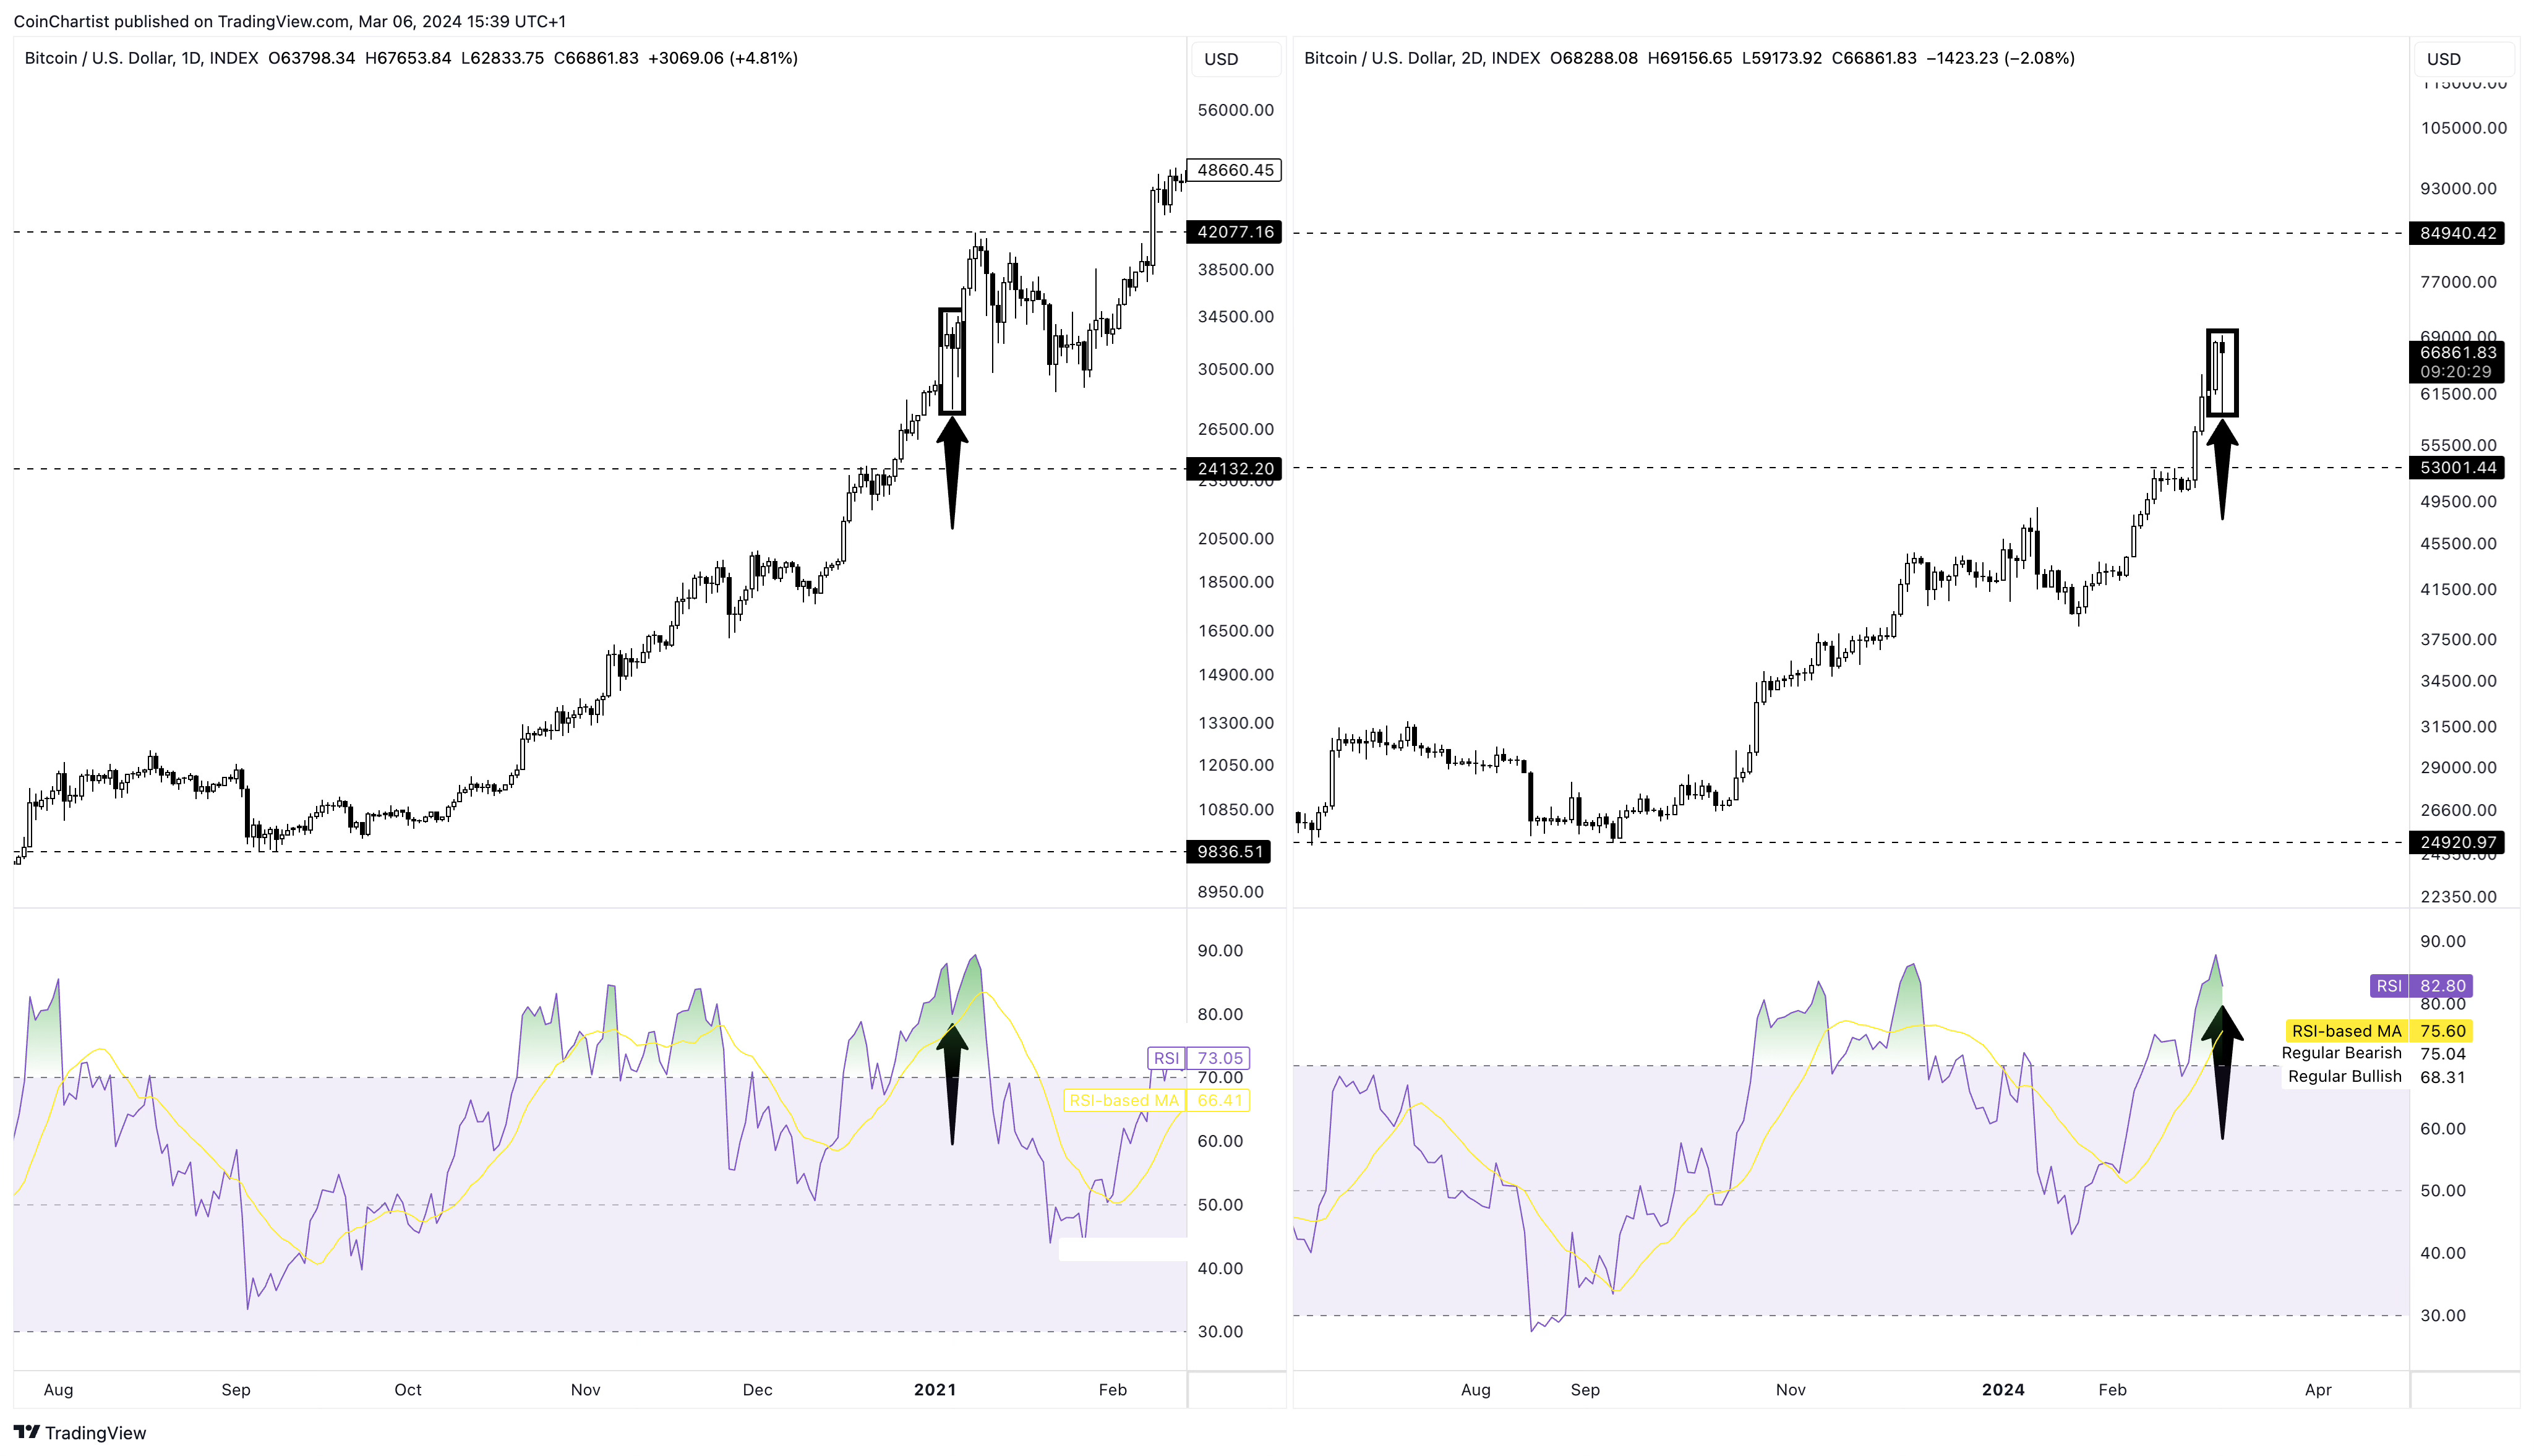
Much like the LMACD, the Relative Strength Index is also exhibiting the same exact patterns as 2021. If BTCUSD continues to follow, another correction down to $62,000 to $63,000 might provide the ideal entry before rocketing higher to $84,000. This lines up with previous analysis targeting $83,000 per coin.
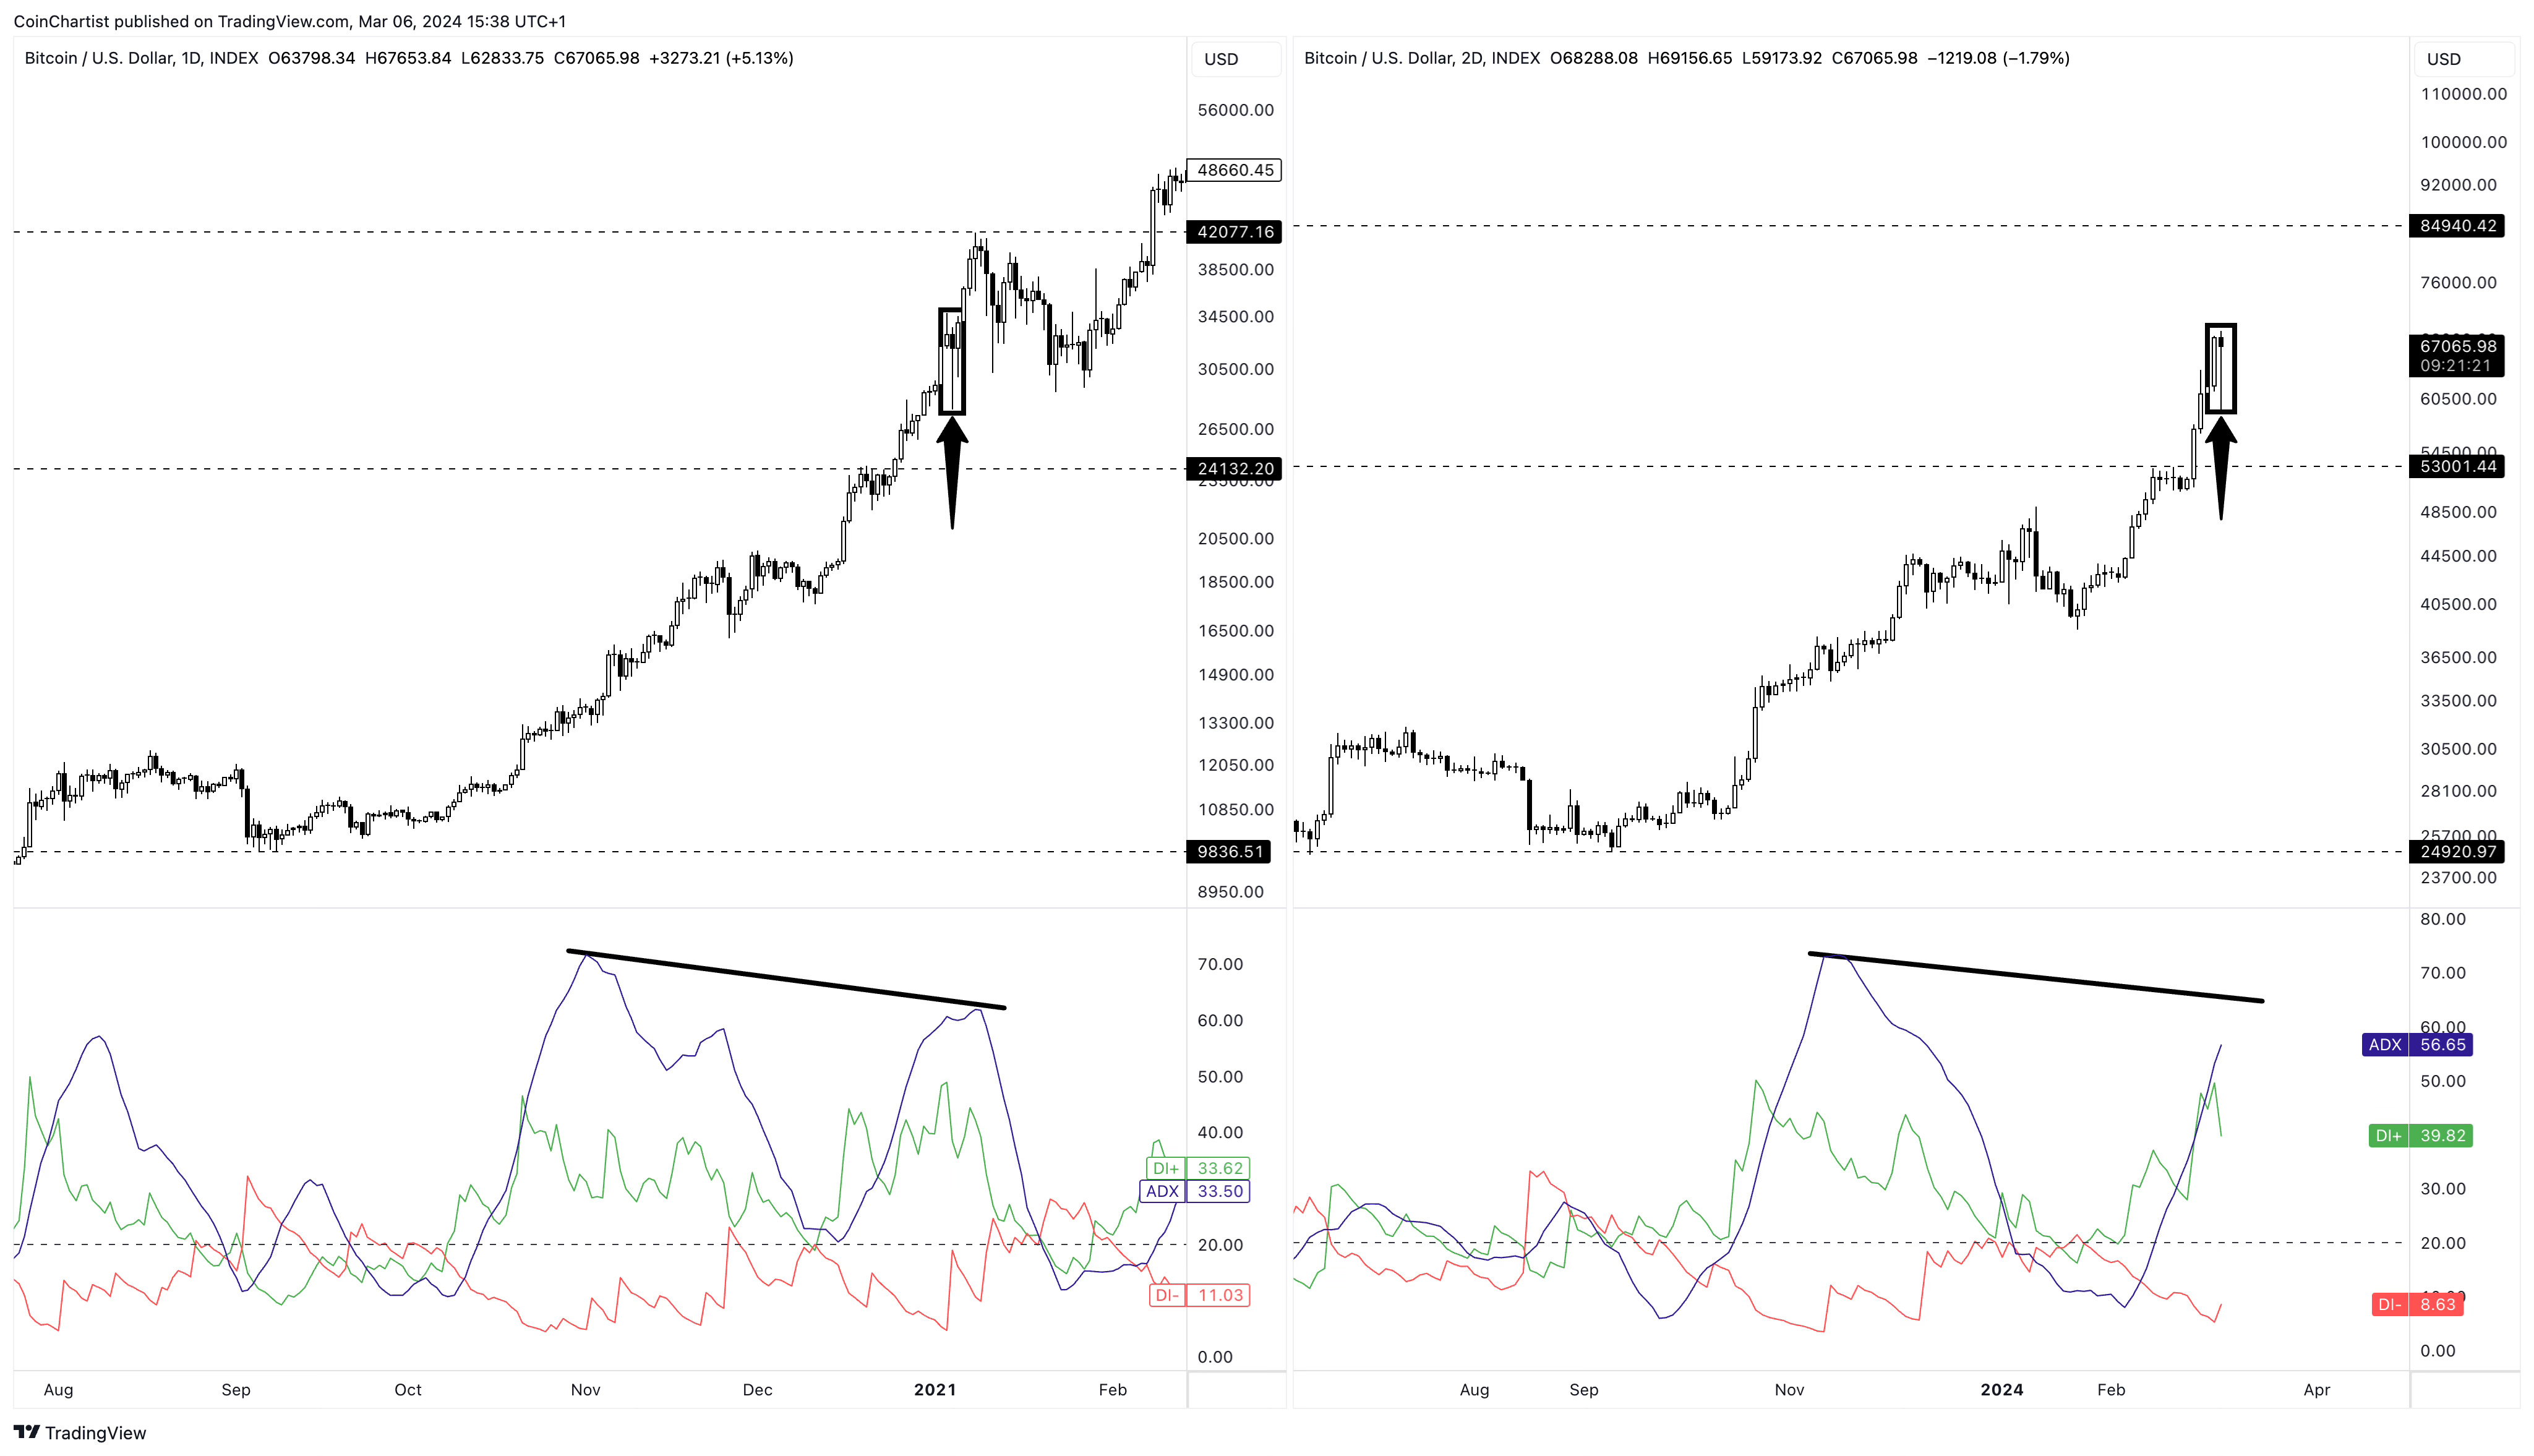
The Average Directional Index is doing the same as the LMACD and RSI. The LMACD and RSI are momentum indicators, so showing similar patterns as one another isn’t too strange. But the fact that the ADX is following suit gives more credence to the signals above. The ADX is a trend strength tool. Much like 2021, a lower high and bearish divergence will provide the ammunition necessary for a much more serious correction than we’ve seen so far. To the tune of at least 32%.

Regardless of the low timeframe correction, Bitcoin is in a clear bull market. The remainder of the focus surrounding BTC will look at higher timeframe signals that confirm continued bullish price action.
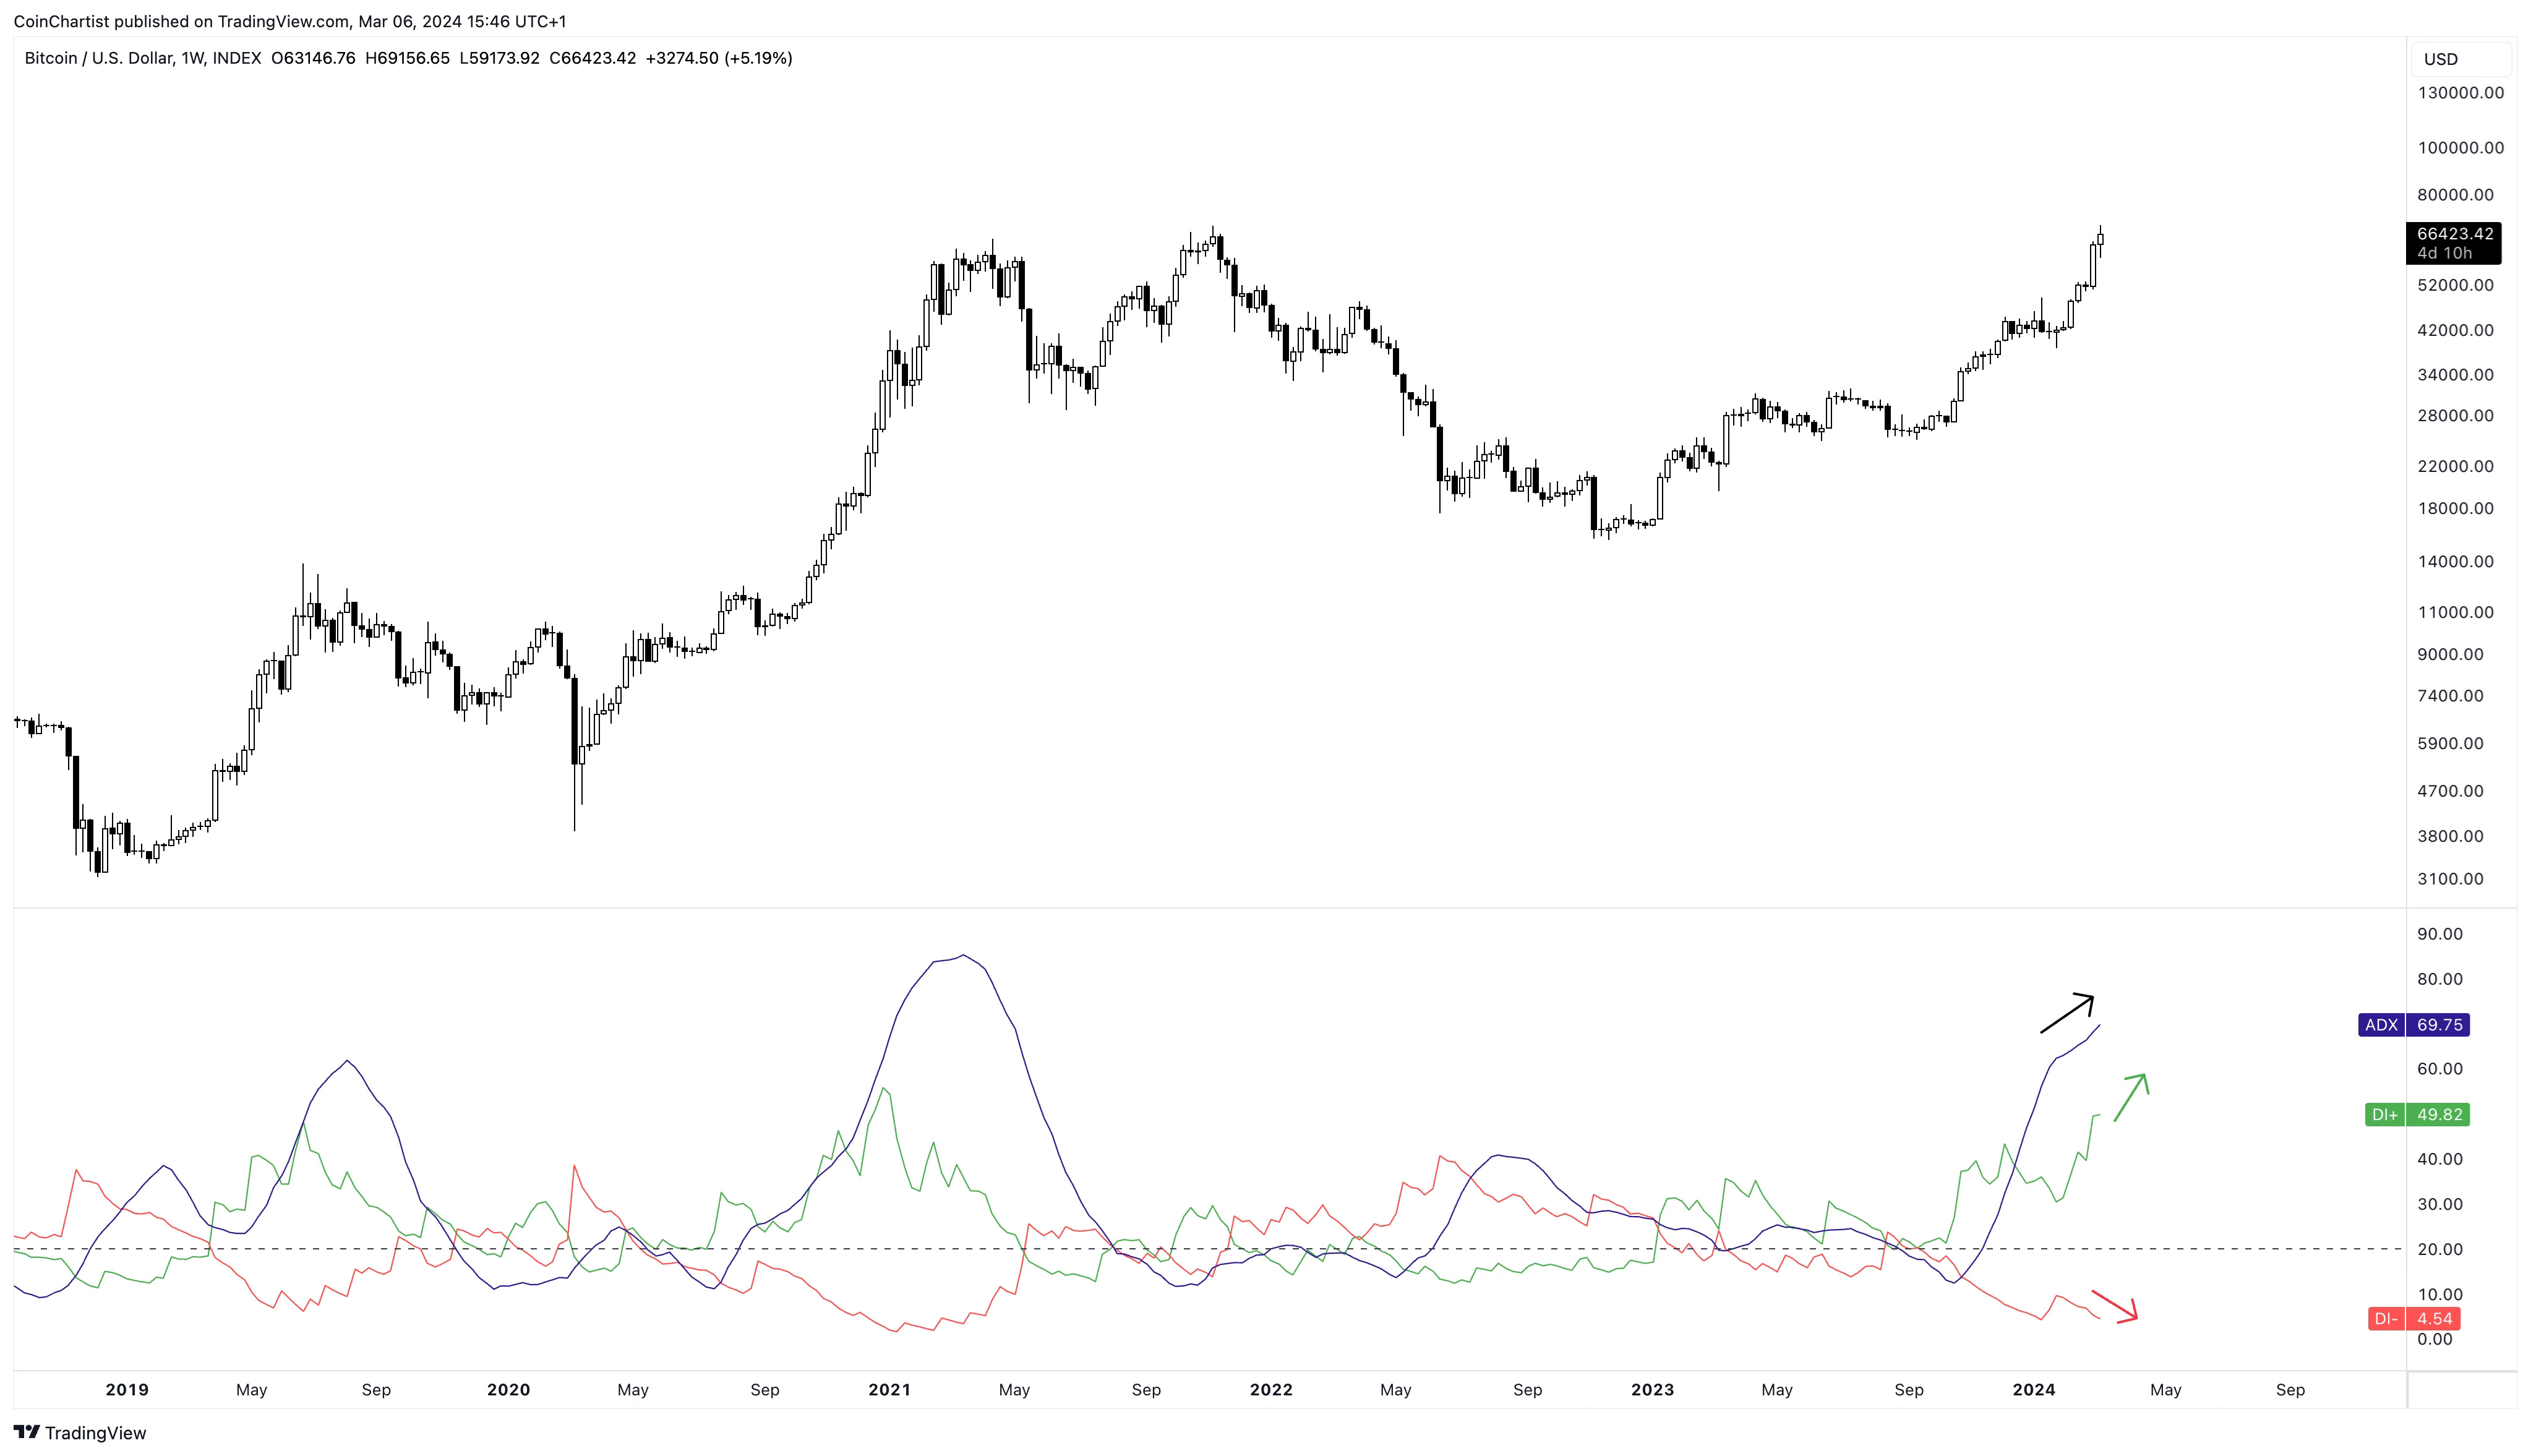
Now that you understand the ADX is for measuring trend strength, we can see that this is the second-strongest trend since the 2018 bear market bottom. I continue to believe that we are still in that primary trend from the 2018 bottom, and the 2022 “bear market” was merely a wave 4 correction. The ADX values climbing indicates that the trend is only getting stronger and stronger, despite taking longer to develop than previous uptrends. -DI in red is turning down further potentially making a lower low, while +DI is rising higher and should continue to do so.
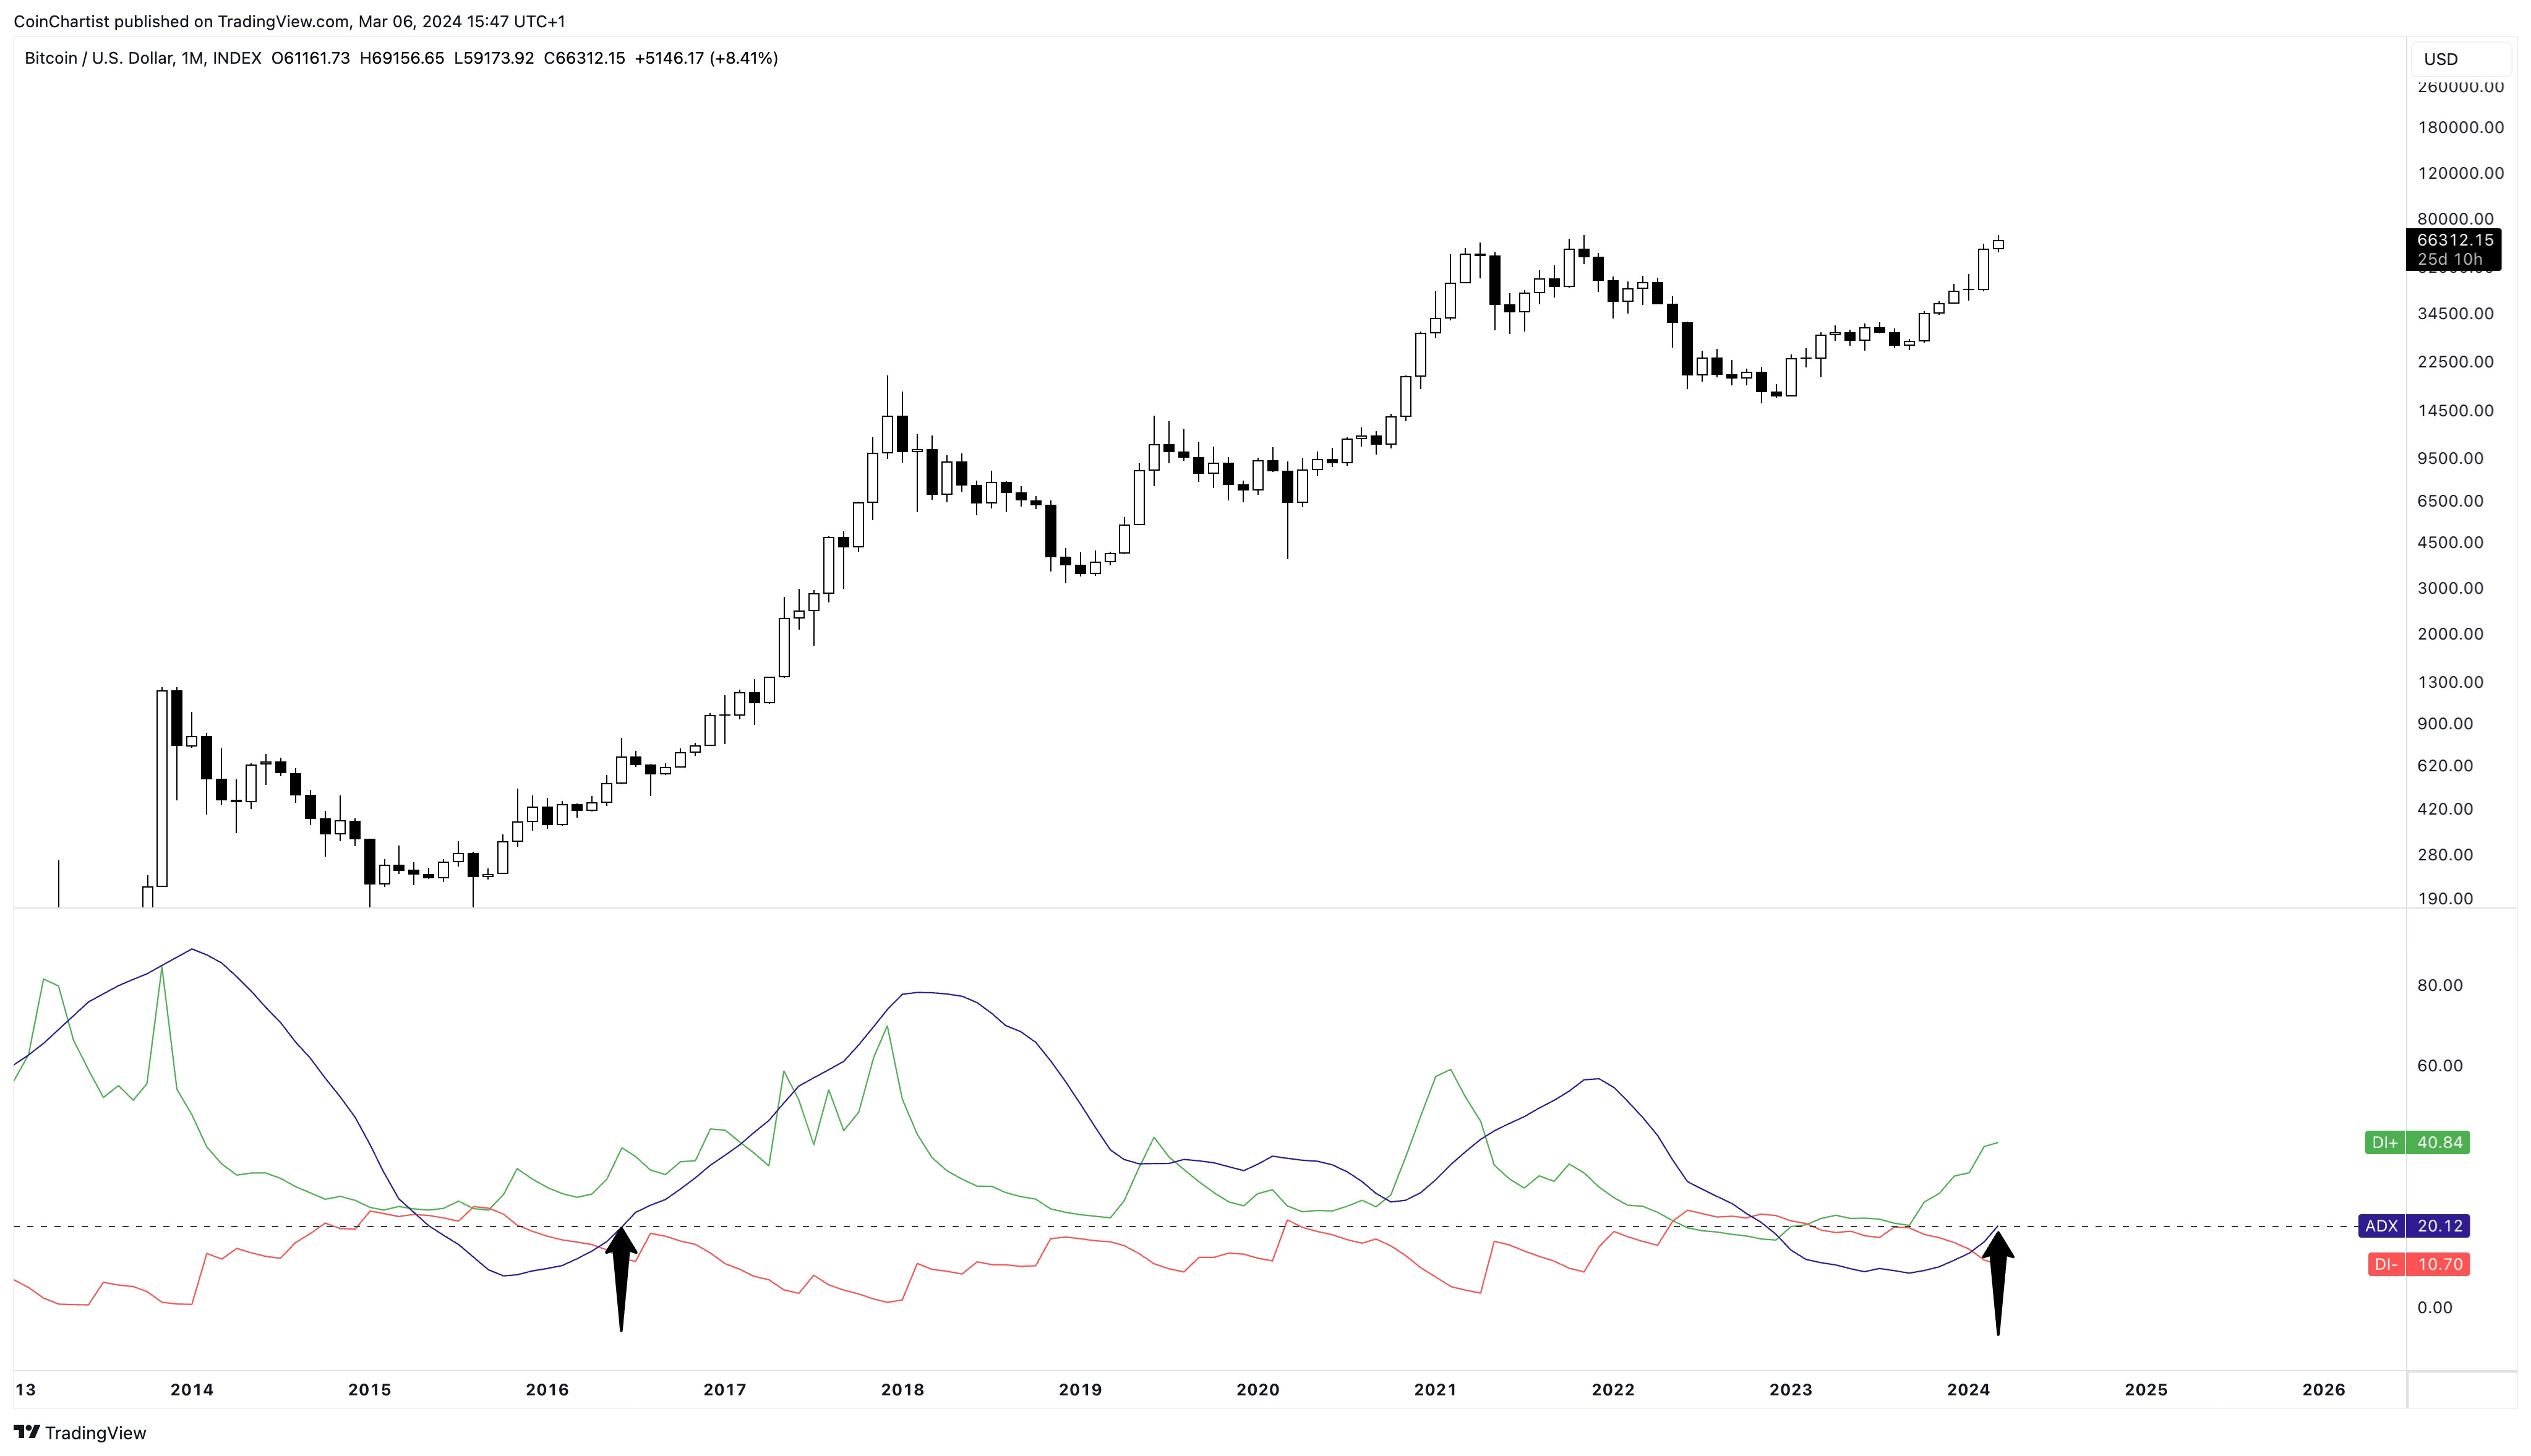
The ADX signals a trend is active with a reading above 20. BTCUSD monthly charts are showing an active trend reading of 20.17. Importantly, only the 2015 bear market took the ADX below 20, and in 2016 it surpassed 20 for the first time and stayed elevated until late 2022. A lower high is likely on the ADX, giving a bearish divergence before the top is officially in.

Not only is trend strength just kicking off on the highest timeframes, the 1M Bollinger Band Width is breaking out from a downtrend that started in 2014. While this happens, the monthly Bollinger Bands are beginning to rapidly expand, falling off the bottom of the chart. This only happens when Bitcoin is in its most volatile stages of a bull run. This recent correction should become the norm during such a volatile environment.
Keep reading with a 7-day free trial
Subscribe to CoinChartist to keep reading this post and get 7 days of free access to the full post archives.