


#39 | Mixed Signals
#39 | Mixed Signals
An Evening Star appears in Bitcoin, but there could be a few more weeks of upside.
Disclaimer: The information provided in this Substack newsletter is for general informational purposes only and should not be considered as financial advice. Investing involves risk, and past performance is not indicative of future results. Please conduct your own research or consult a financial advisor before making any investment decisions. The newsletter disclaims any liability for losses or damages arising from the use of this information.
Issue #39 overview:
Bitcoin forms an Evening Star – what now?
Why there could be more upside, despite the bearish reversal pattern
Analyzing the cost to produce BTC ahead of the halving
Breaking down Bitcoin Dominance and alt season
Wave counts for altcoins, the dollar, and the worst bear market ever
The OG altcoin (Silver) could tell us when altcoin season arrives
The past week, Bitcoin has been correcting harder than we’ve witnessed in some time. BTCUSD dropped by more than $10,000 per coin, yet still only resulted in a maximum of an 18% drawdown. By comparison, the last three proper corrections gave us a 20% drawdown. As discussed in the last issue, there is debate whether or not this is a mid-term “top” that leads to several weeks of correction and consolidation. The latest technical signals are mixed, with higher timeframes remaining bullish while lower timeframes display weakness. Let’s take a closer look.

The most bearish signal is the Evening Star pattern that was the subject of a recent video shared on X (view the video here: https://x.com/tonythebullBTC/status/1771168569180504169?s=20). Such patterns lead to a bearish reversal up to 72% of the time. This leaves a 28% chance that we continue on up, which isn’t very promising statistically. Bearish reversal patterns can appear in a cluster, so just because we have this signal doesn’t mean we can’t travel up in the next few weeks before a bigger correction ensues.
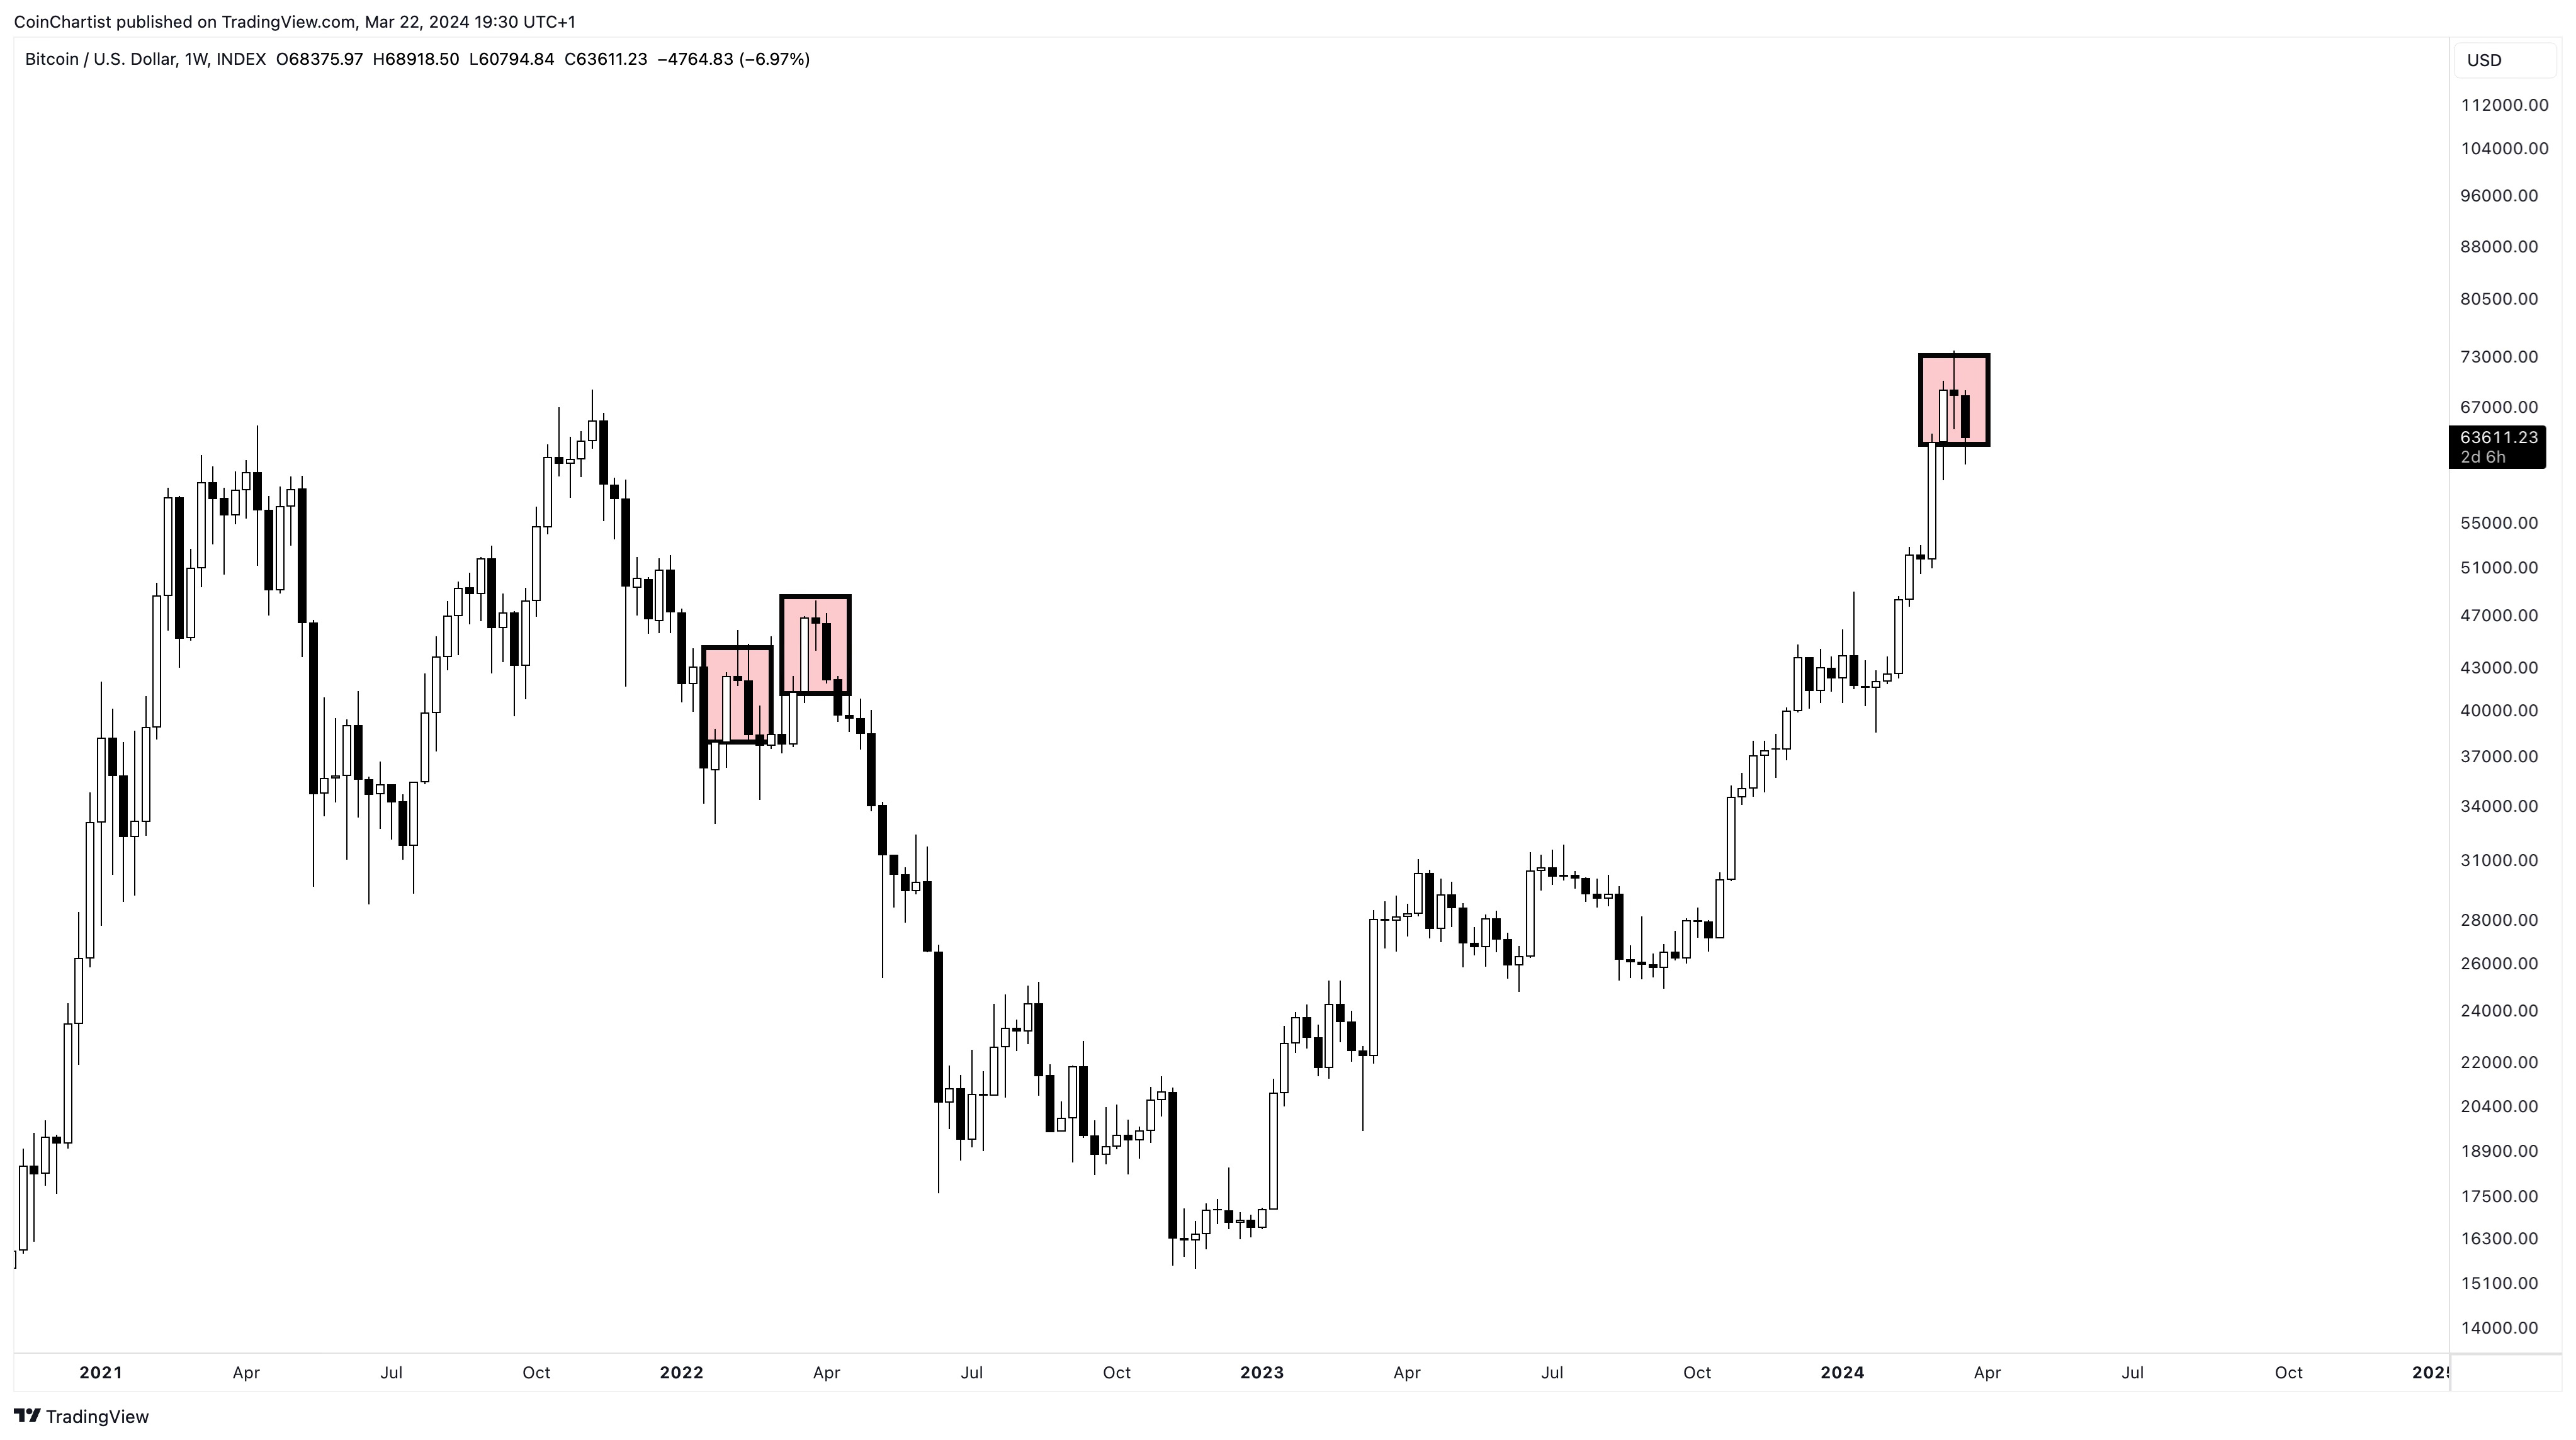
In this example, we have two Evening Star patterns in rapid succession. Although the first pattern clearly satisfied the requirements, the first candle out of the pattern was bullish, and pushed prices higher. However, the selling was too strong, and yet another Evening Star appeared, kicking off the most aggressive phase of the 2022 bear market. The goal of this chart is to point out that although BTC is looking heavy and firing bearish weekly signals, higher timeframes could continue to pull BTC up for the time being, which I’ll explore later in this issue.
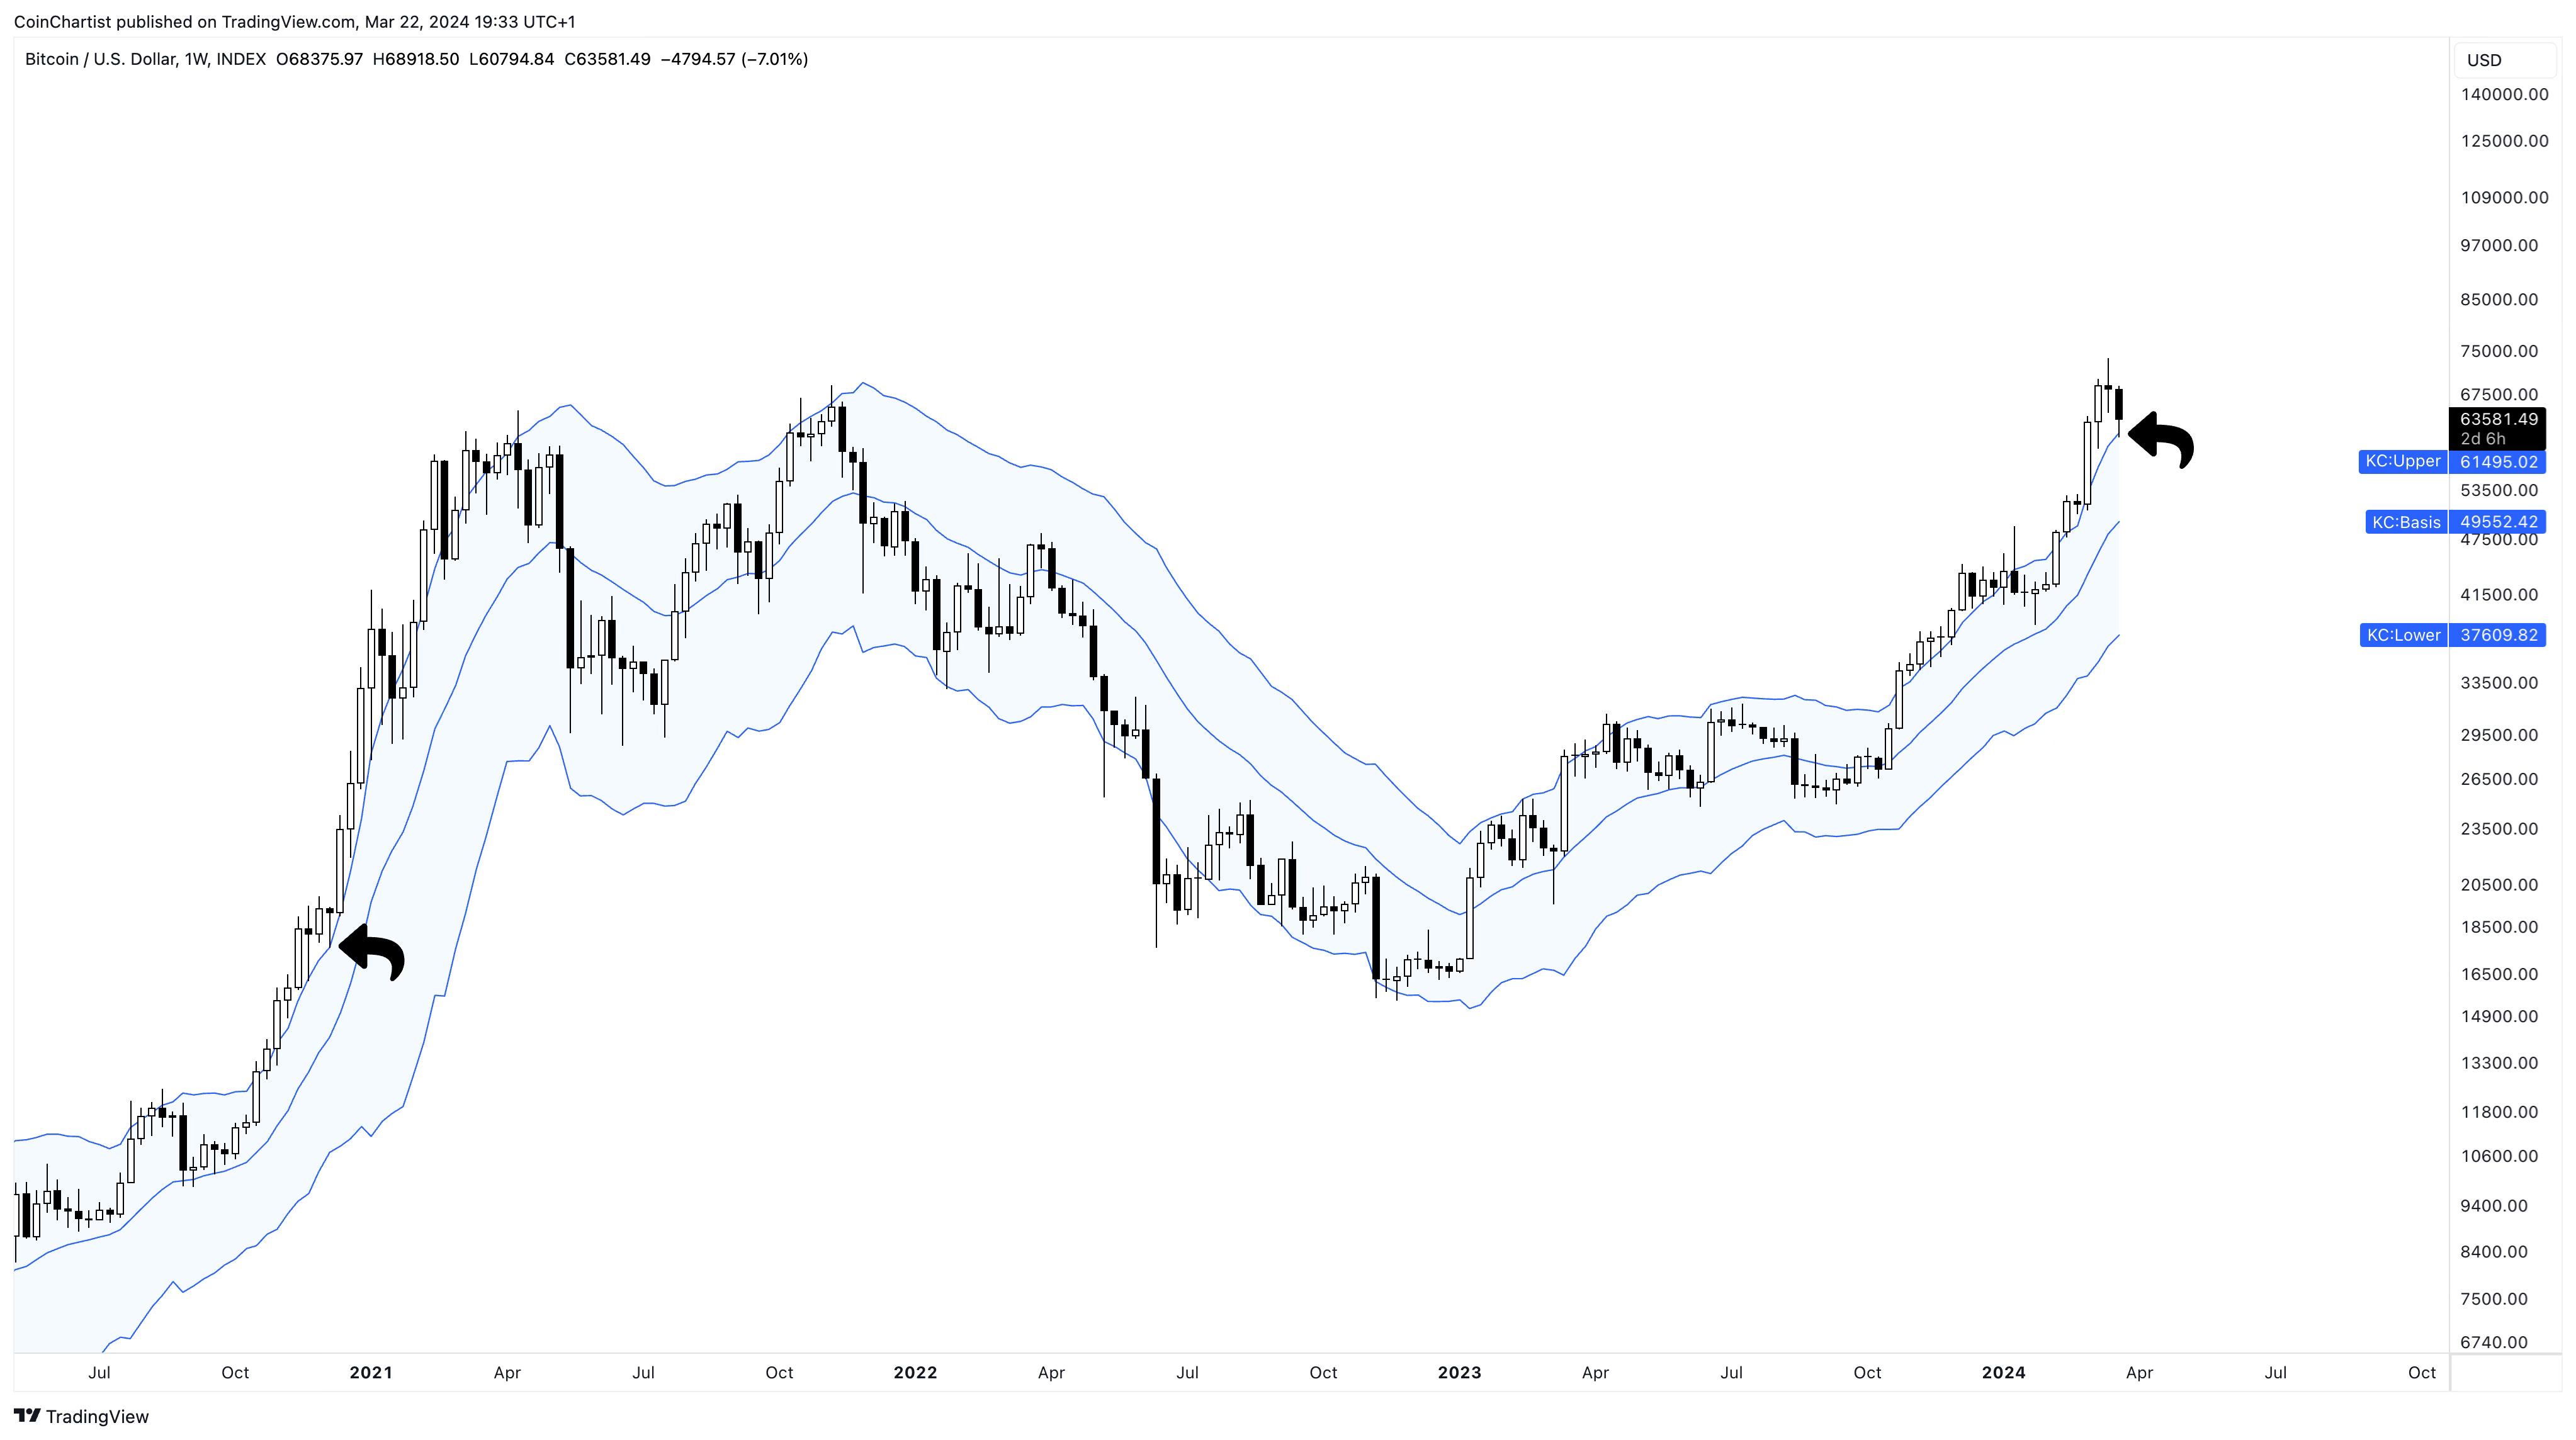
But first, let’s look at some signs that we could get continuation even on the weekly chart. Turning on the weekly Keltner Channels shows that although we had an Evening Star pattern, price hasn’t closed back into the upper band. This is similar price action and behavior as the quick pause before one more big move up in 2020. This also occurred right after touching the previous all-time high – the same conditions as we have now in 2024.

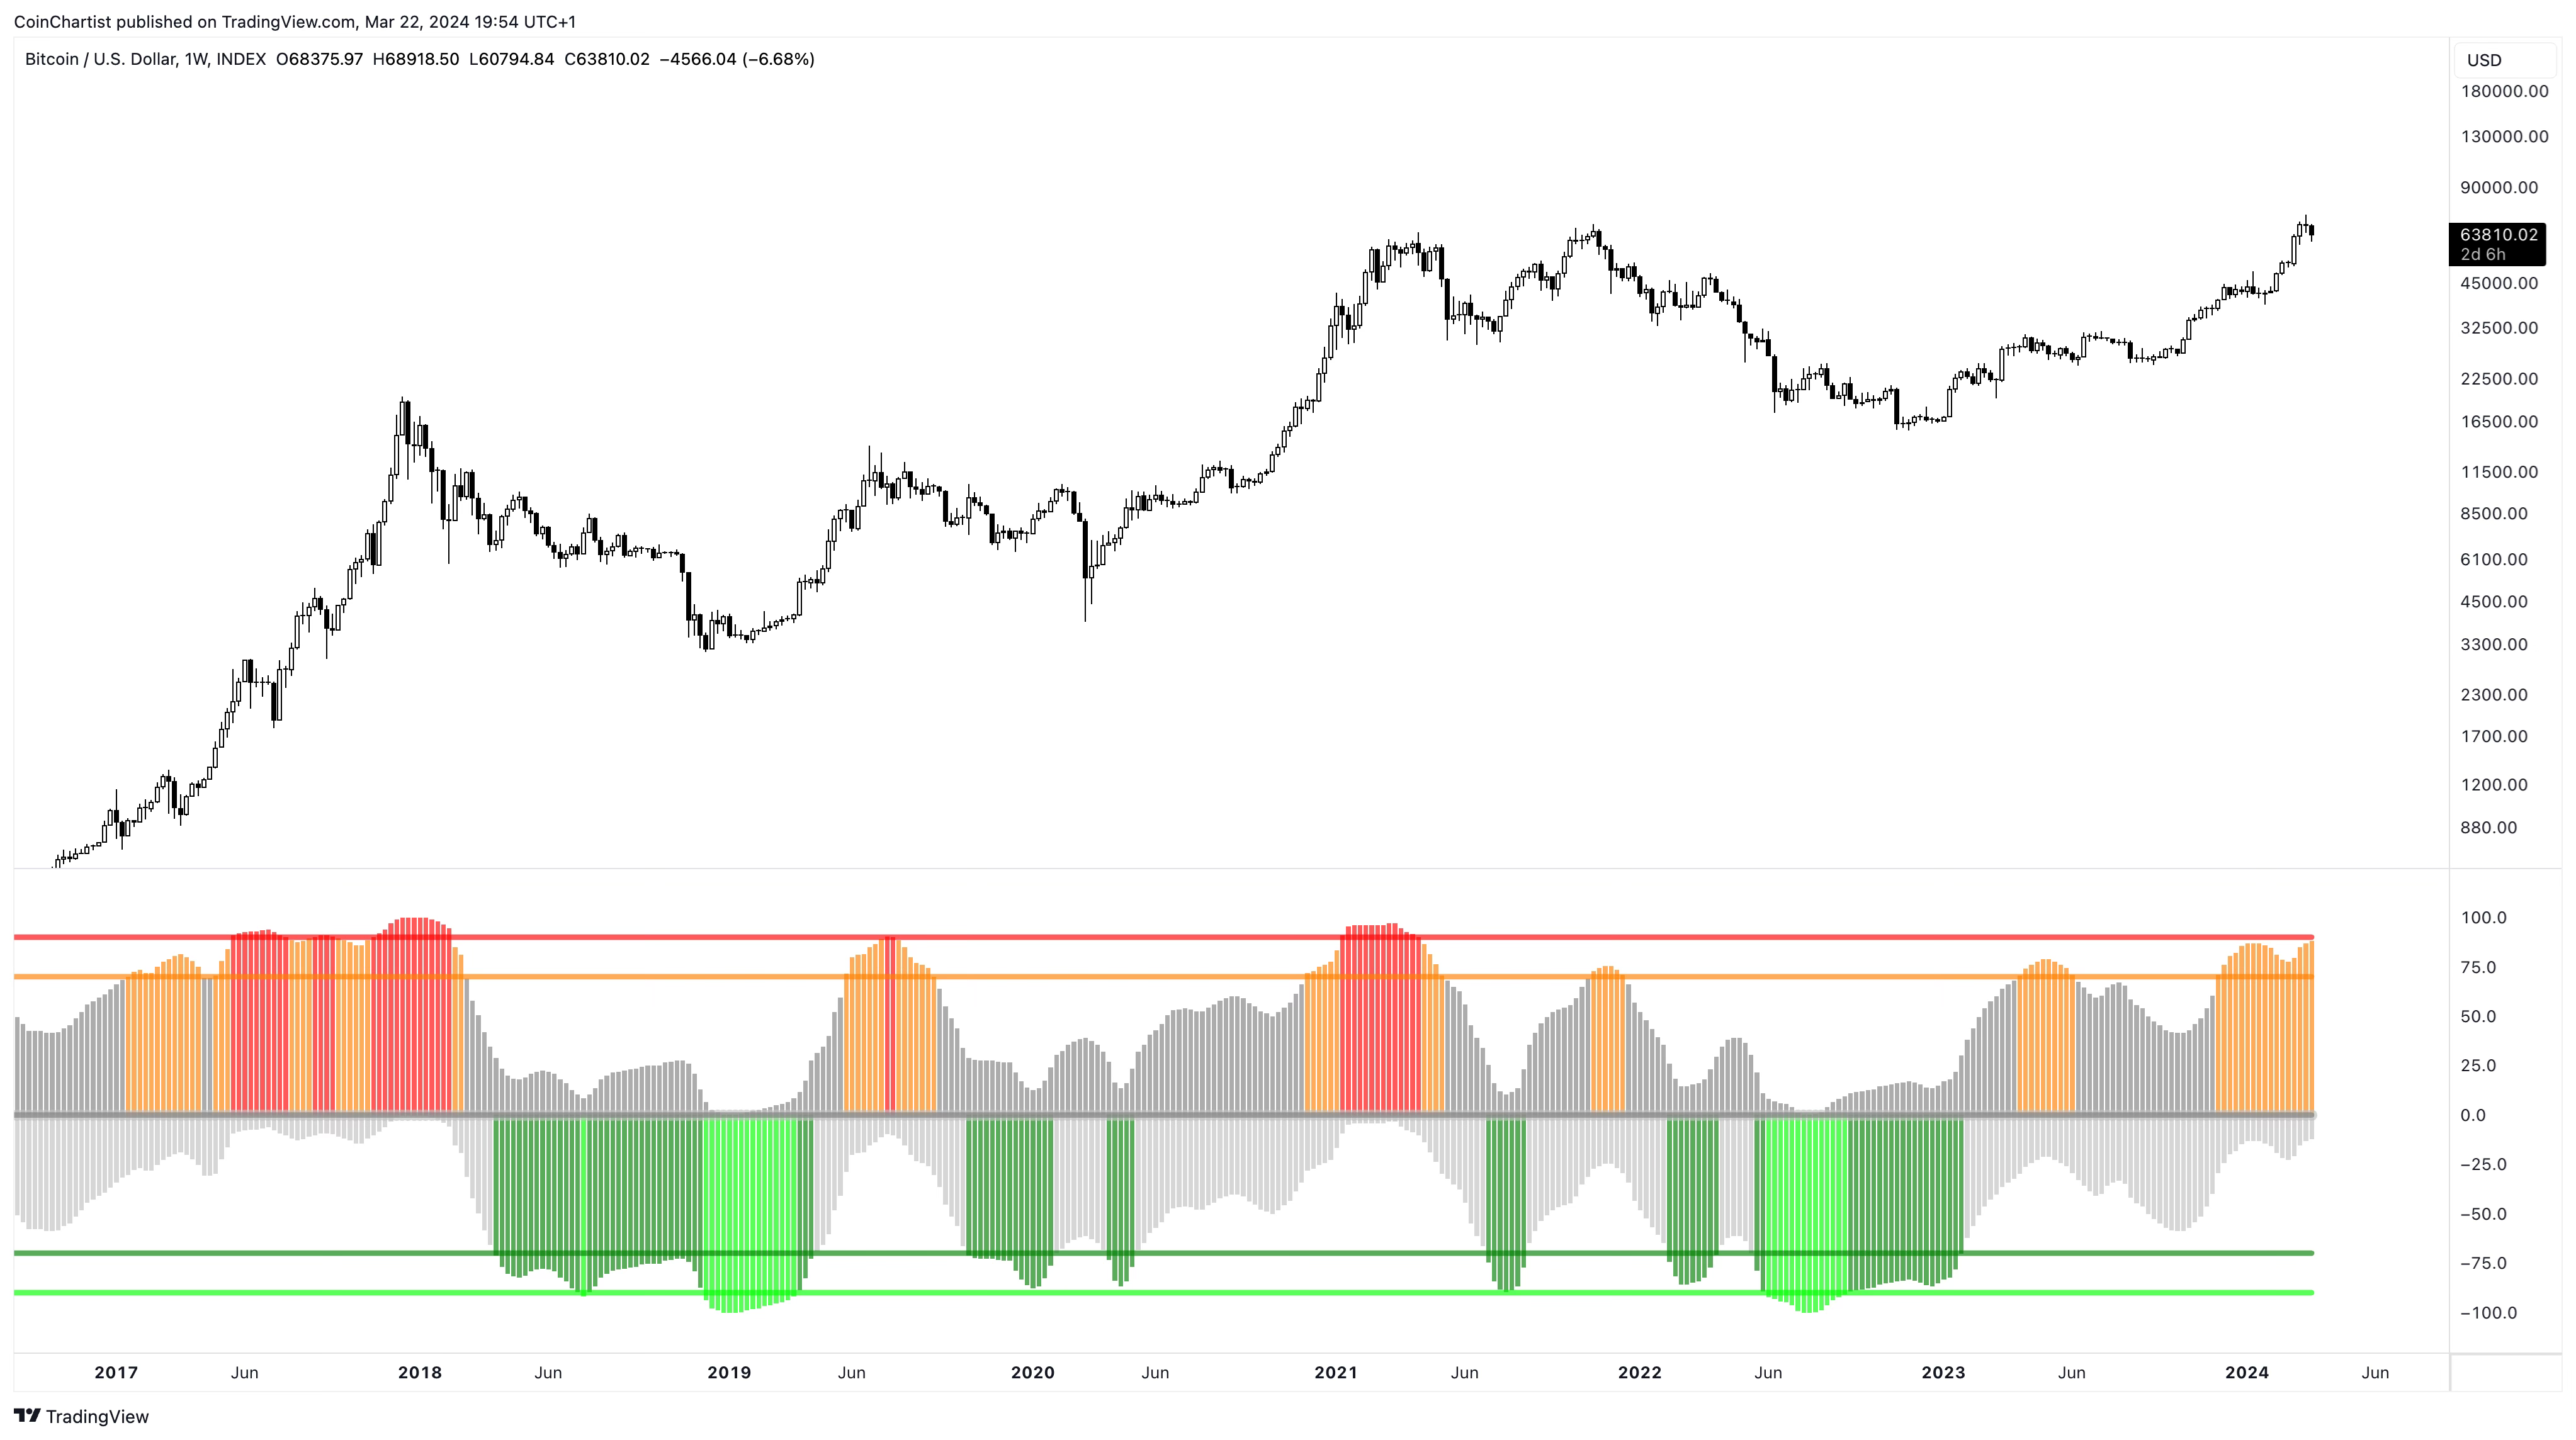
Furthermore, BTCUSD is currently on a 7-count on the TD Sequential indicator – a market timing tool used to call attention to potential tops and bottoms. A 7-count could suggest that we’ll see at least two more weeks of bullish price action, taking Bitcoin to a TD9 sell setup. Each time the sell setup appears, TDST support rises, creating the green stair-stepping line support line that is depicted in the chart. This is positive and what we want to see unfold if you’re a bull.

With two weeks remaining in the TD9 count, switching to the 2-week timeframe could give us more information on what to expect. Although the weekly chart is exhibiting bearish signals, the 2-week looks strong. The 2-week candle is retesting former all-time high resistance turned support, and is retesting the upper Bollinger Band. Holding these areas could send BTCUSD higher in the following candle, giving us two more weeks of positive price action.
Switching back to the weekly chart, and zooming out, we can also see that although BTCUSD could be losing some momentum, overall, it isn’t anywhere near overheated enough to form a significant top. According to the PPO Percentile Rank, this move is nowhere near as extreme as we’ve seen in the past, leaving plenty of room to move to the upside.
Keep reading with a 7-day free trial
Subscribe to CoinChartist (VIP) to keep reading this post and get 7 days of free access to the full post archives.