


#40 | Dino Season
So-called "Dino coins" looked primed for a pump. Also, find out what's going on with Bitcoin after a failed Evening Star pattern.

Disclaimer: The information provided in this Substack newsletter is for general informational purposes only and should not be considered as financial advice. Investing involves risk, and past performance is not indicative of future results. Please conduct your own research or consult a financial advisor before making any investment decisions. The newsletter disclaims any liability for losses or damages arising from the use of this information.
Issue #40 overview:
Why Bitcoin could consolidate sideways a few weeks longer
Using market timing tools to predict the top in Bitcoin
In-depth analysis on four “Dino coins” including LTC, XRP, XLM, and FIL.
Lower timeframe wave counts in Bitcoin
Higher timeframe wave counts in Dino coins
The OG Dino coin (Gold) and why its rally isn’t good for the economy or risk assets
AI, meme coins, and more reached euphoric levels in the last week, prompting some profit-taking and signs of capital rotation into other categories. One category in particular that looks to be ready to roar, are what the cryptocurrency community refers to as “Dino coins". This issue is dedicated to analysis of four coins I am keeping a watch on: Litecoin, XRP, Stellar, and Filecoin. Below you’ll find the regular free Bitcoin charts, while premium subscribers will get updated technical and Elliott Wave charts on the aforementioned dinosaurs. There are also several charts on the oldest dinosaur coin of all: Gold. This is a critical indicator for a potential recession on the horizon, so don’t miss it.
Last issue the focus was on an ominous-looking Evening Star pattern, that ultimately didn’t confirm this week with a follow through to the downside. The week isn’t over yet, however, and there’s still a chance to move lower. This week’s issue looks at a possible Triangle formation in Bitcoin, which could cause sideways consolidation and chop for weeks to come. I’ll also explore what happens when the Triangle breaks out, which could lead to the final stretch of this Bitcoin bull run.
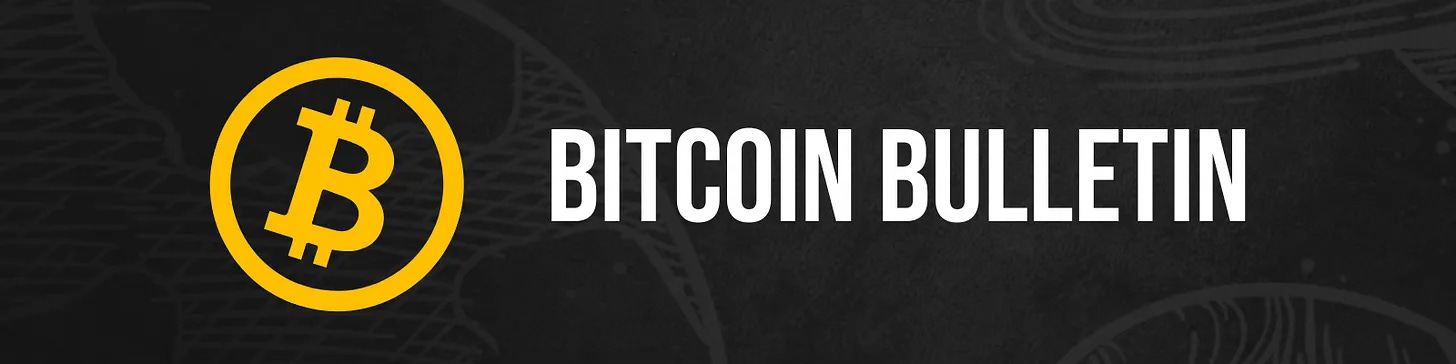
Here is a closer look at the failed Evening Star pattern. Although the black down candle closed at the lowest one-third of the white candle of the three-candlestick pattern, BTC CME opened with Bitcoin price in the upper one-third of the white candle. Unless there was strong follow through this week, the pattern has failed and could lead to a breakout higher. At the very least, I sense some shorter term consolidation as the rally stalls out for a few weeks.
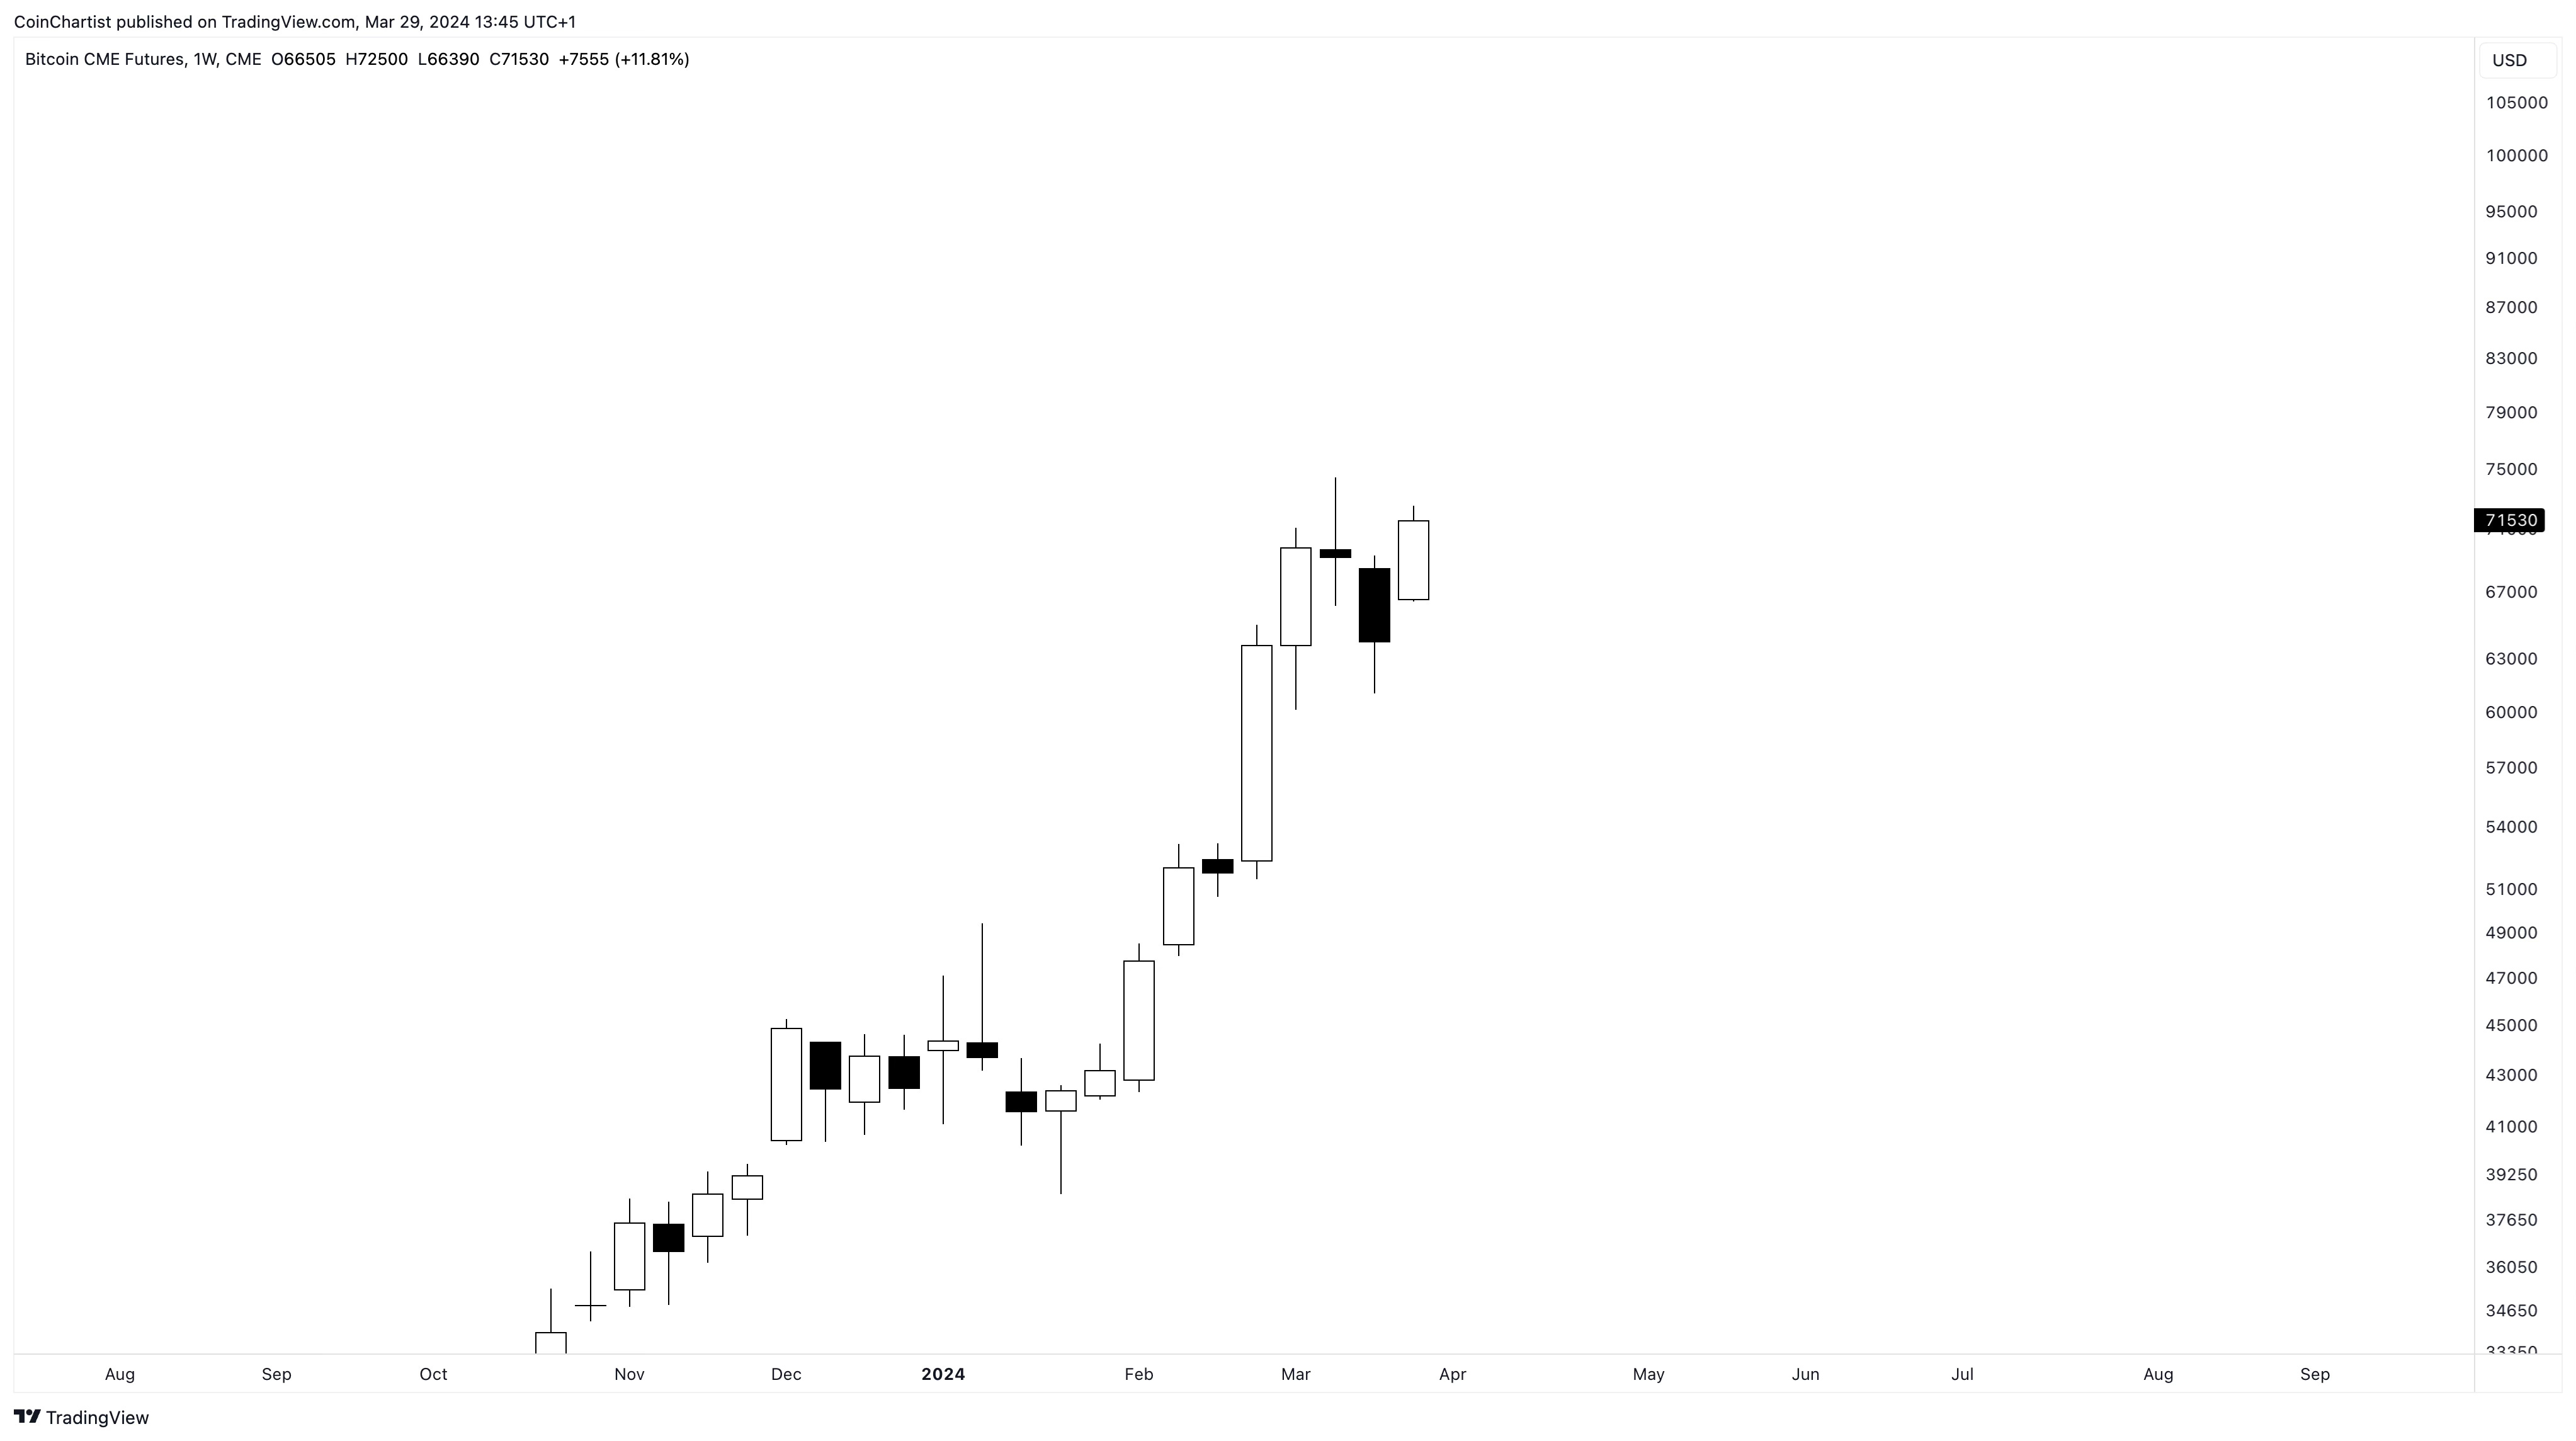
A lower high in BTCUSD could prompt the beginning of a Triangle pattern on daily and 3D charts. A Triangle pattern takes place during wave 4 in an uptrend, or wave B in a correction. In this case, the triangle would be occupying the wave 4 position. This Triangle is explored further later in this issue under the Wave Watch section for premium subscribers. In the meantime, we can presume the Triangle would last roughly halfway through April, breaking out right after the Bitcoin halving event. Trading volume should decrease during the pattern’s development, with high volume supporting a breakout of the Triangle. A breakout should occur about two-thirds of the way to the Triangle’s apex, resulting in a thrust higher out of the pattern that’s about the same width of the pattern itself. This should result in a minimum of a 20% rally to around $83,000, which has long been a near-term target of mine.
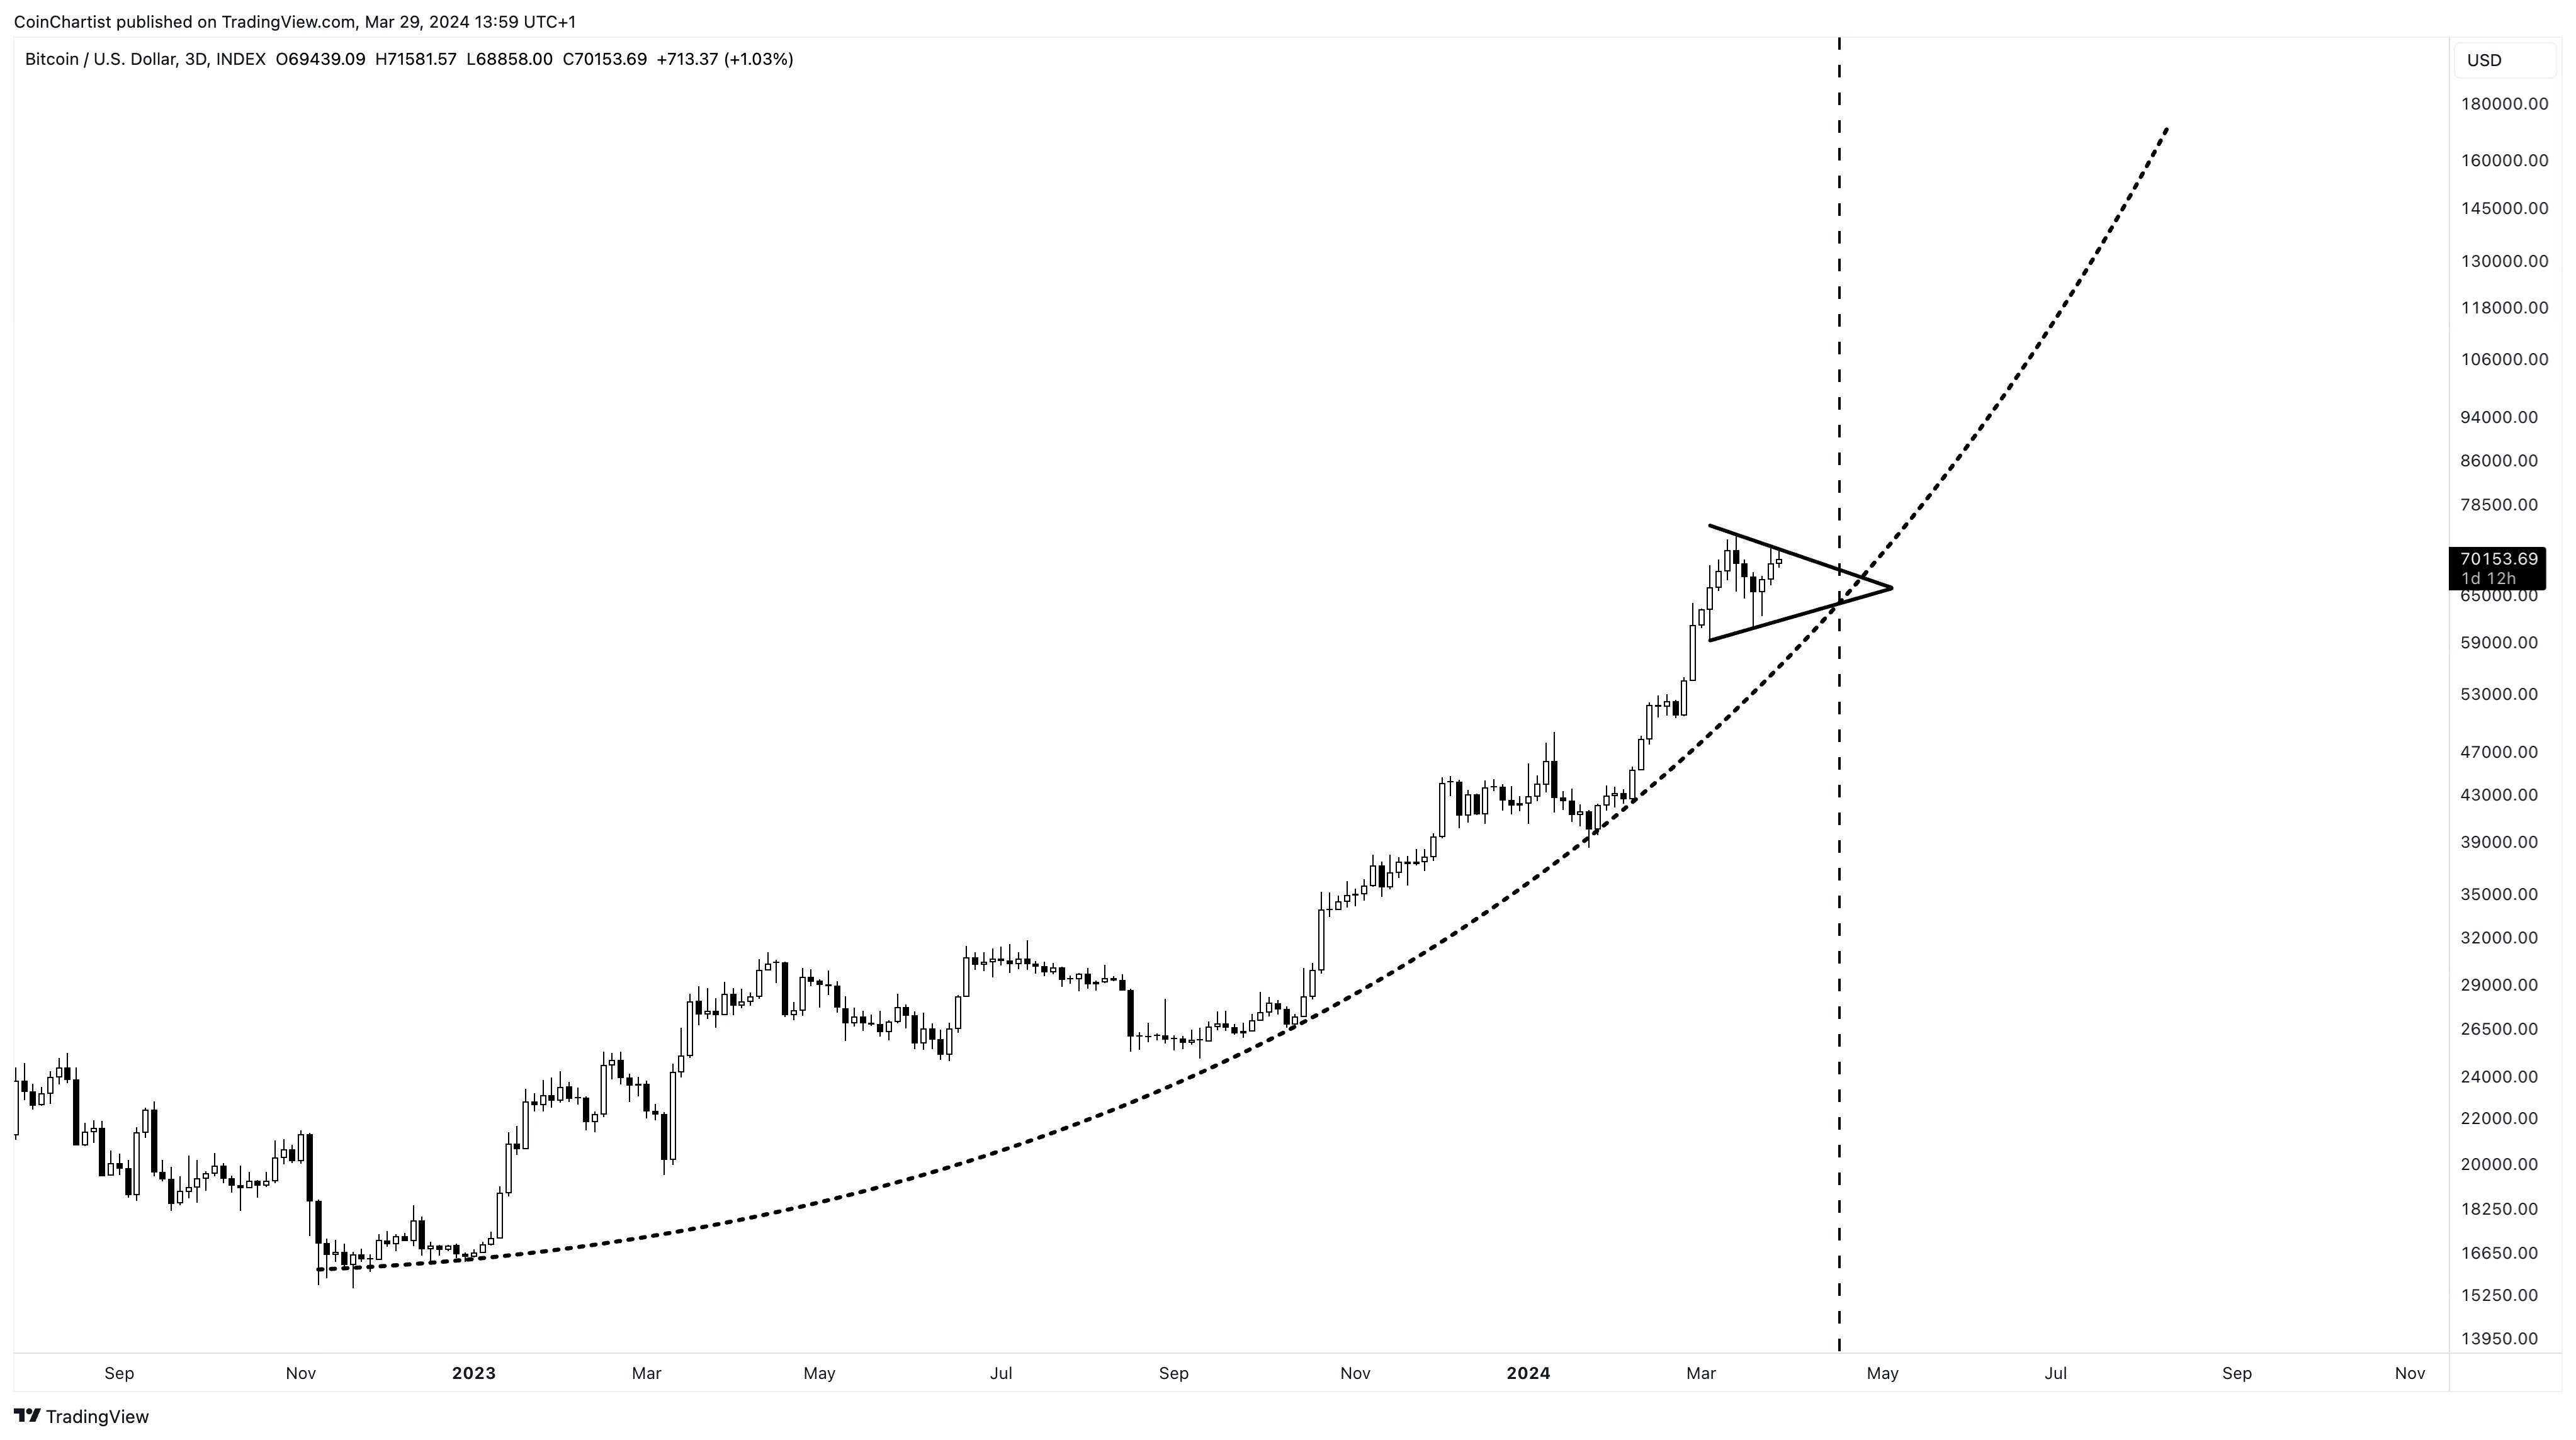
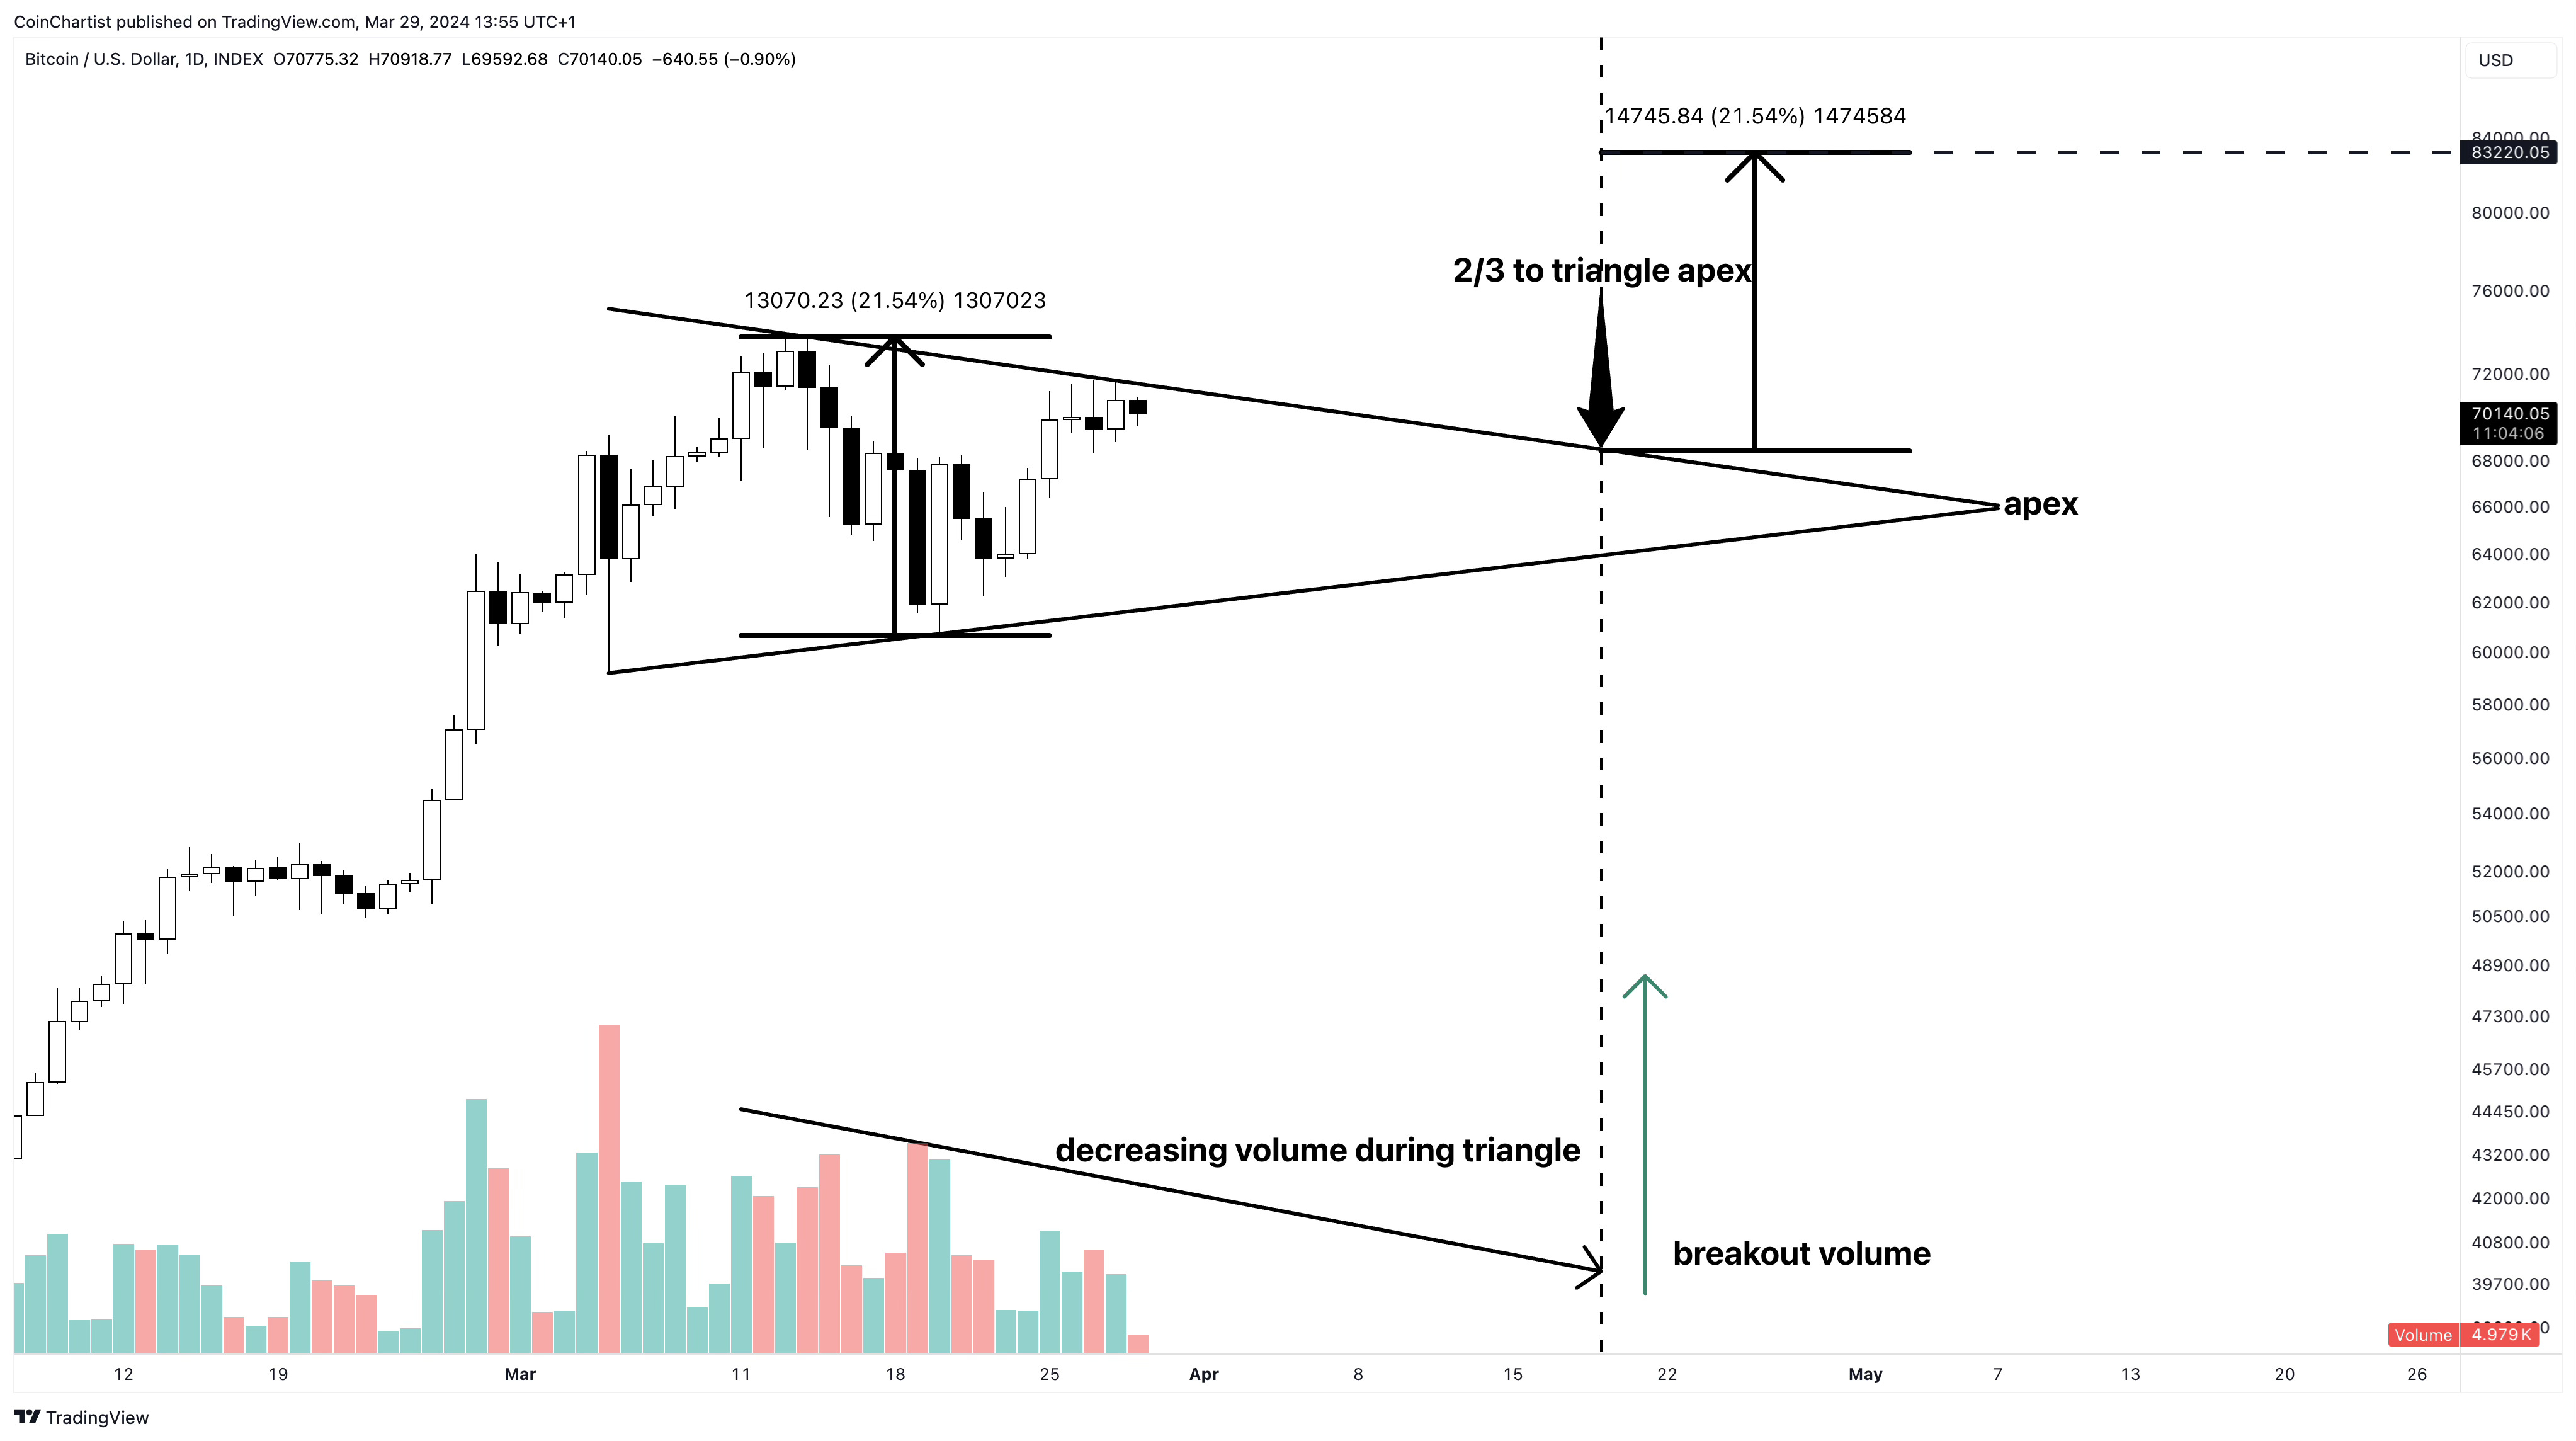
Reaching the Triangle’s apex should happen right around when price reaches the ongoing parabolic curve supporting the uptrend over the last year or more. There’s no guarantee that this curve remains support and valid, however, the fact that the apex aligns improves the probability of this pattern developing further.
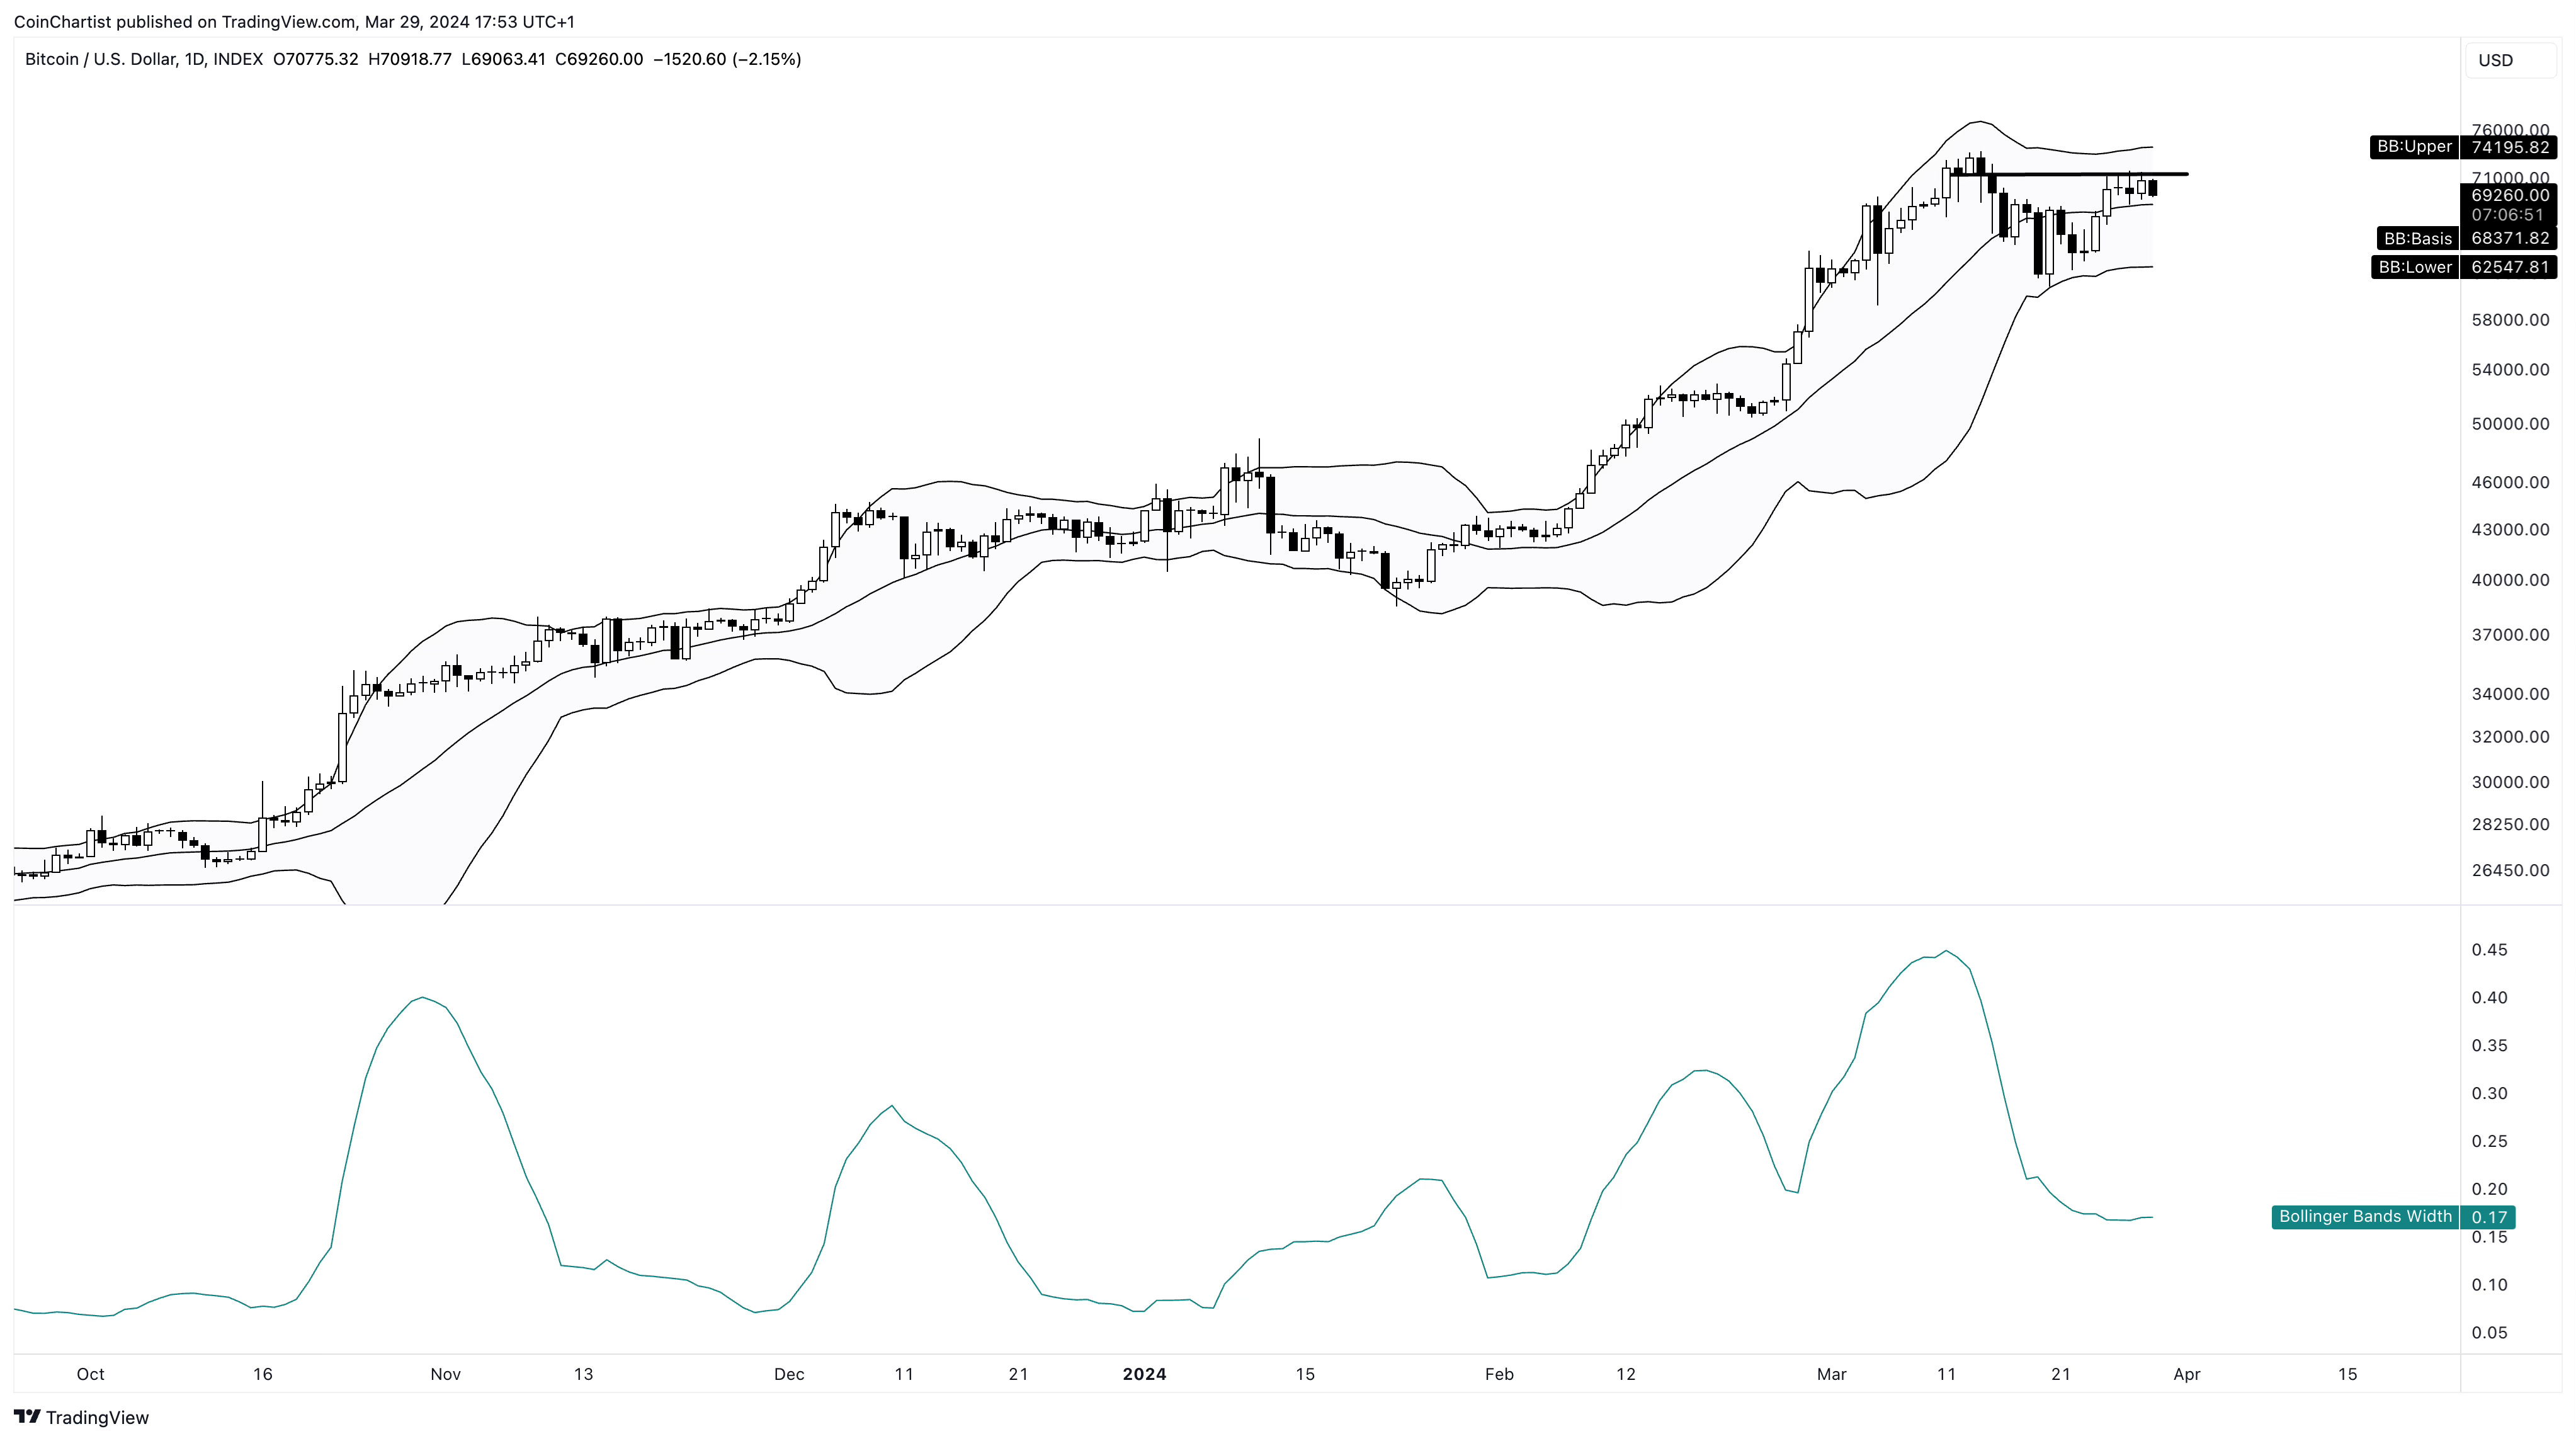
One technical indicator possibly supporting the Triangle theory, is the daily Bollinger Bands. The largest moves in Bitcoin with sustained strength occur only after the Bollinger Bands have sufficiently tightened. At the moment, according to Bollinger Band Width (the indicator below), BTCUSD is nowhere near that level of tightness.
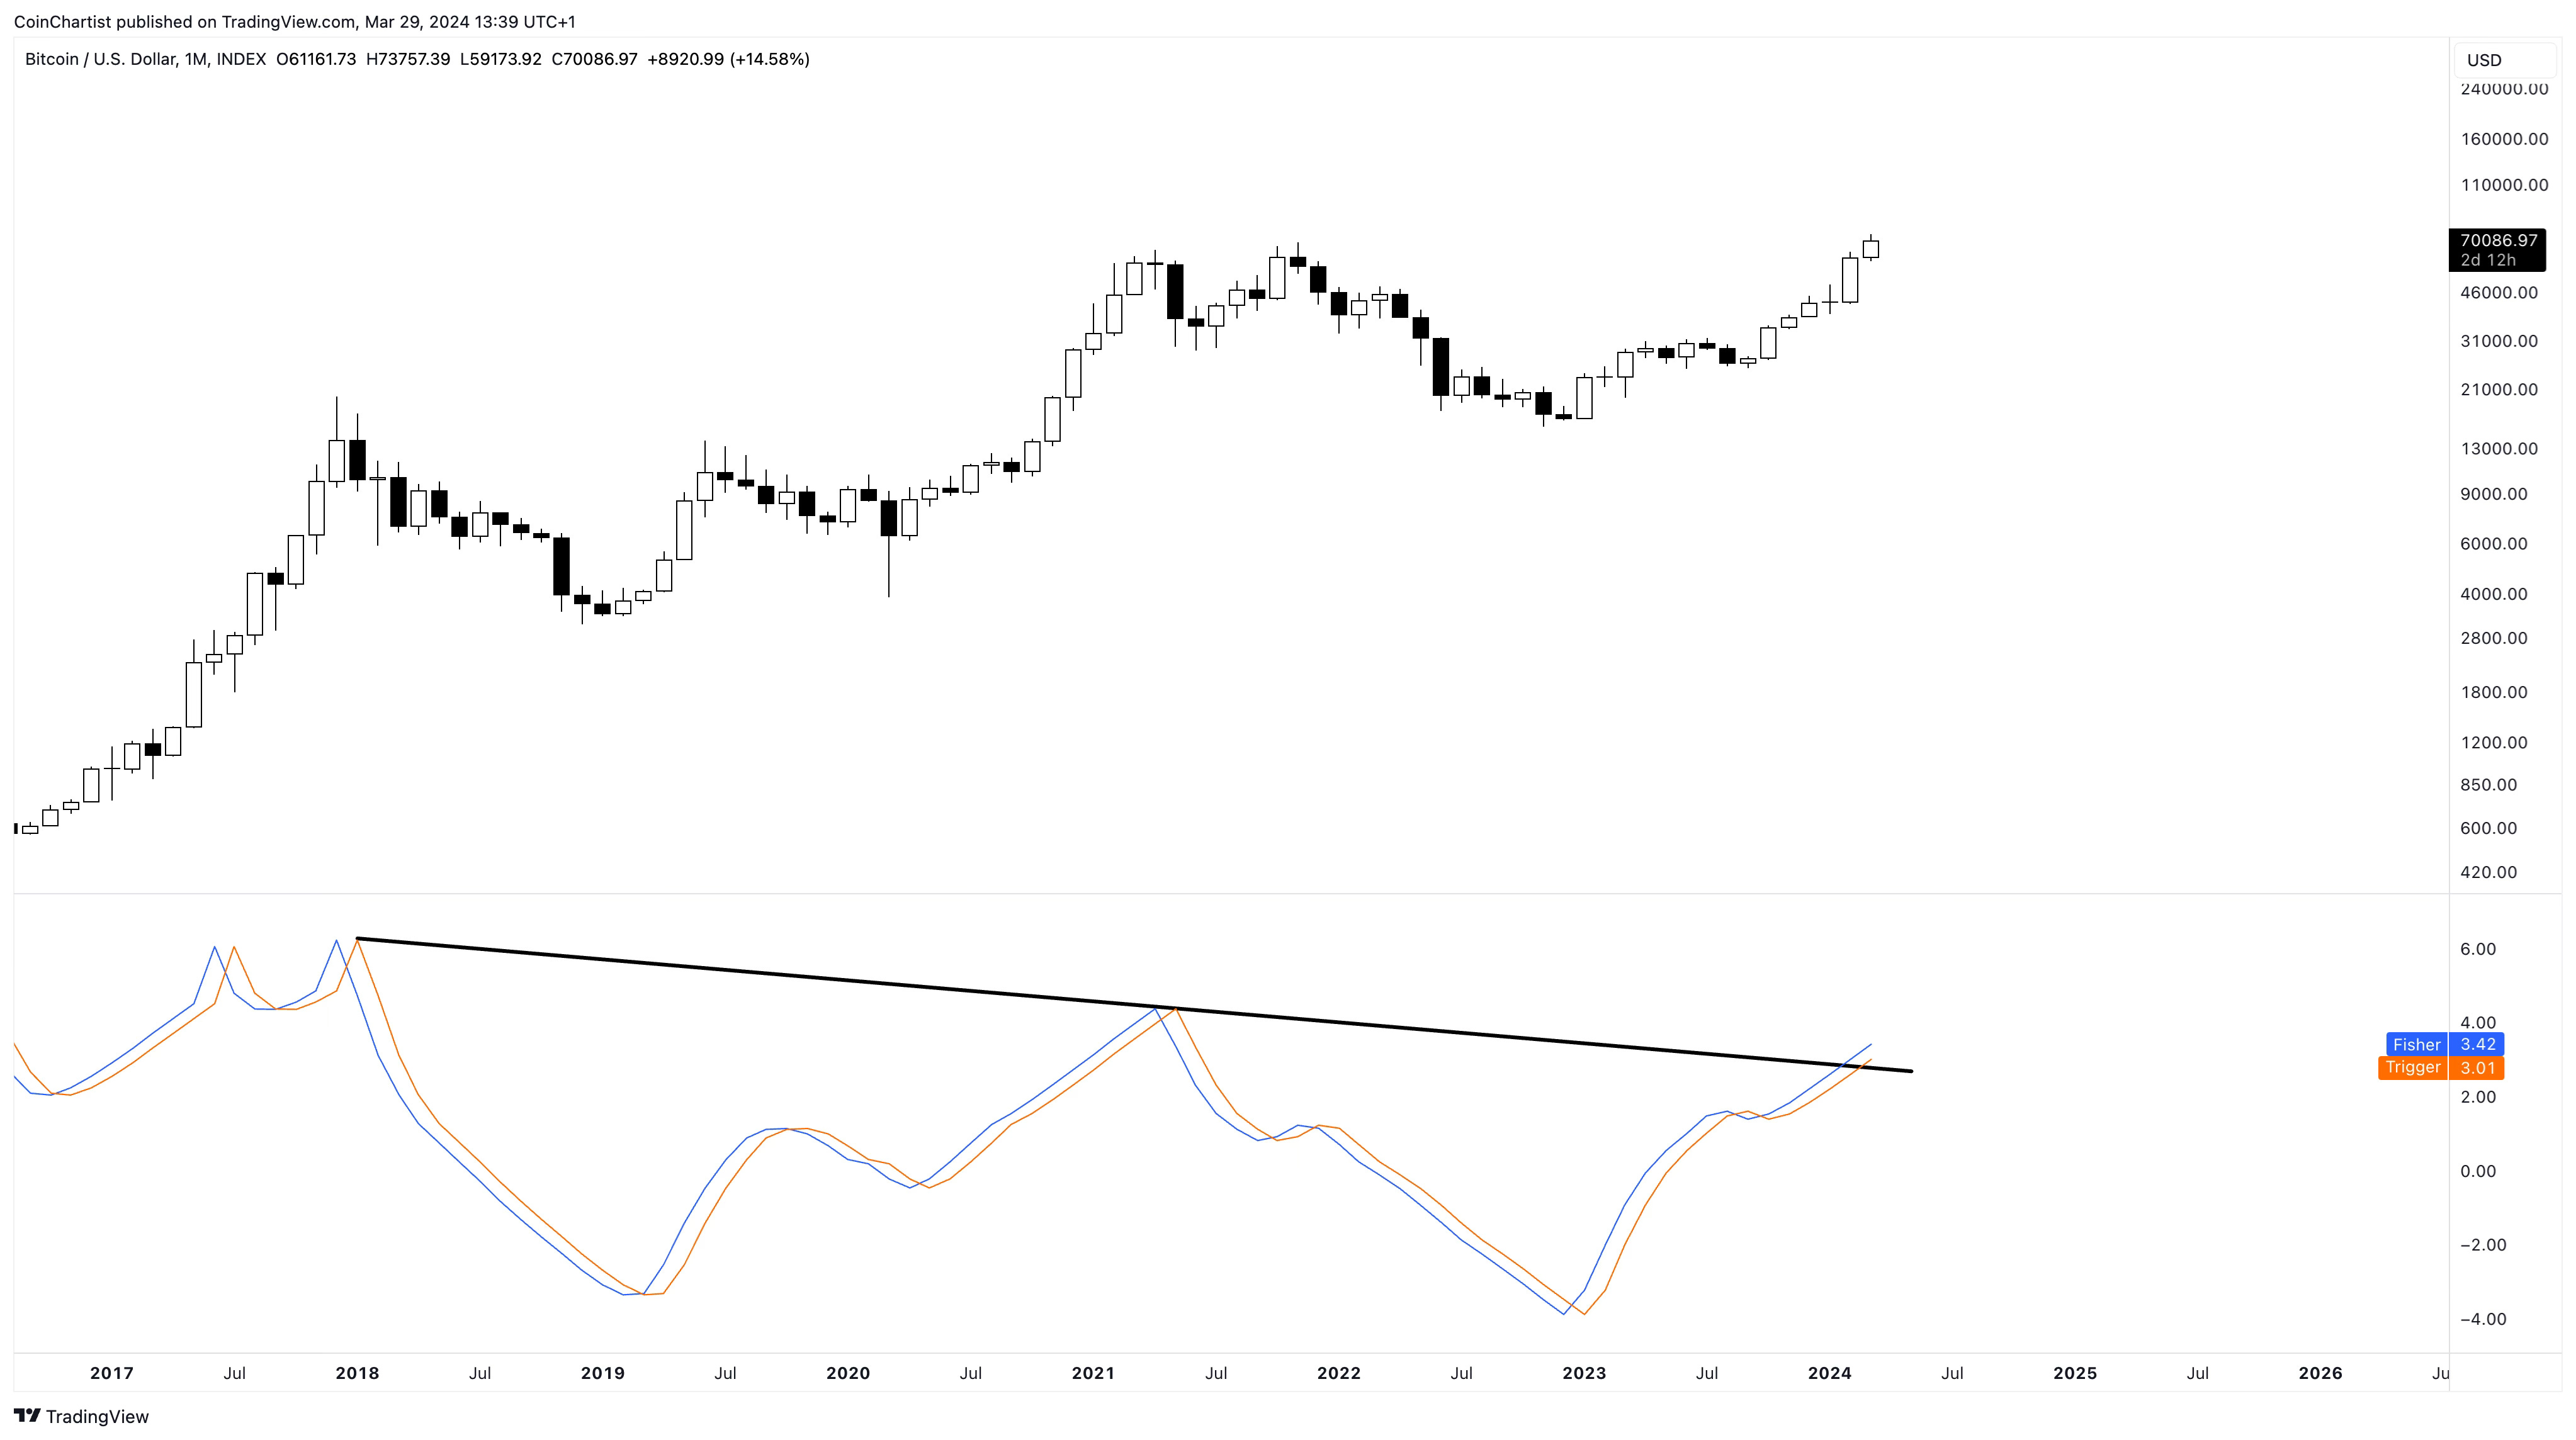
Aside from the potential sideways Triangle or even a deeper selloff for a sharp correction, there are plenty of signs that stress the fact that this uptrend isn’t over by any means. The Fisher Transform, for example, is breaking out of downtrend resistance and reaching extremes associated with bull markets. If the same tool can set a horizontal higher high above the 2021 top, we could climb substantially higher. But how high, and for how long would this continue for? Premium subscribers will find out…
Keep reading with a 7-day free trial
Subscribe to CoinChartist to keep reading this post and get 7 days of free access to the full post archives.