


#41 | Bear In Bull's Clothing
#41 | Bear In Bull's Clothing
Could the bull run already be over? A bearish chart that cannot be unseen.
Disclaimer: The information provided in this Substack newsletter is for general informational purposes only and should not be considered as financial advice. Investing involves risk, and past performance is not indicative of future results. Please conduct your own research or consult a financial advisor before making any investment decisions. The newsletter disclaims any liability for losses or damages arising from the use of this information.
Issue #41 overview:
How high timeframe Bitcoin analysis translates into low timeframe price action
The most bearish Bitcoin chart I have seen – is the bull run already over?
A closer look at BTC Dominance and altcoin charts
Justifying bullish (and bearish) Elliott Wave counts
Gold versus Bitcoin: the final showdown?

As a technical analyst, it is critical to focus on price action and what signals are derived from such price action. For example, prices increasing are what cause Moving Averages to turn up and Golden Cross. This often signals the blossoming of a new bullish trend. In this issue, I’ll be pointing out several bearish alternatives in Bitcoin and other altcoins that shouldn’t be ignored. If these bearish patterns and triggers fail by the end of April, we can expect sustained bullish price action over the next several months as BTCUSD marches higher towards $100,000 and above. If the month closes and these bearish signals remain, it will be time to be exercise extreme caution in the crypto market.

Support at $60,000 has been retested again and again over the last several weeks, yet has been thus far unbreakable. It is important that it remains that way, as BTCUSD trading below $61,000 puts a possible Bearish Engulfing pattern in play. The example given shows a white candle significantly (over)engulfed by the black candle, but for the pattern to be valid it only requires the white candle be engulfed fully. It is imperative that BTCUSD closes above this level and prevents the Bearish Engulfing pattern from confirming. This level is doubly important, as it is the highest monthly candle close of the 2020/2021 bull market. Holding above this level could ultimately prove to be a retest of former resistance turned support.

The reaction on lower timeframes is mixed, with the weekly looking overall bullish. Weekly candlesticks have yet to close even a single candle below the monthly level, which is acting as strong resistance turned support. The current weekly candlestick is the first of seven candlesticks in a row to close below the highest weekly candle close of the 2020/2021 all-time high. If this week can once again hold above the level, that could put an end to the correction. However, even closing below the weekly level in red dashed lines could form a hammer candle pattern which is still above the monthly level in dashed black lines.

Zooming in further to the daily we can see how price action is behaving around these crucial support and resistance levels. Price is finding support at the monthly dashed line, while the weekly is currently posing as resistance. The next decisive break of either level could provide some further clues about the near-term direction of Bitcoin and crypto. Make it above the weekly dashed line in red, the bull run should resume. Lose the black dashed monthly line and we could see further downside targets get hit. It’s as simple as that.

Moving onto technical indicators, we can see that BTCUSD is attempting to hold above the upper Bollinger Band. Note that throughout the entire 2020/2021 bull run price stayed above the upper BB. In 2017, Bitcoin also maintained mostly above the upper Bollinger Band, aside from some nasty retests – much worse than what we are experiencing now. As long as Bitcoin closes April above the upper Bollinger Band, we should see the bull market keep on climbing higher. Also of note, is the fact that the Bollinger Band basis is pointed upward, indicating the direction of the trend.

The Keltner Channels are another tool based on an upper and lower band and a Moving Average as a basis line. Much like the Bollinger Bands, maintaining above the upper Channel suggests continuation of the bull run. Closing back inside the Keltner Channels puts an end to any bull market and kicks off the bear market historically. Yet another reason why BTCUSD closing above $60,000 is imperative.

For added confluence, Bitcoin is also holding above TDST support drawn by the TD Sequential indicator. The TD Sequential is a market timing tool that generates a buy or sell setup with a 9 count. BTCUSD is currently on a 7 count, potentially suggesting that there are at least two more months left in the bull market, if not more.
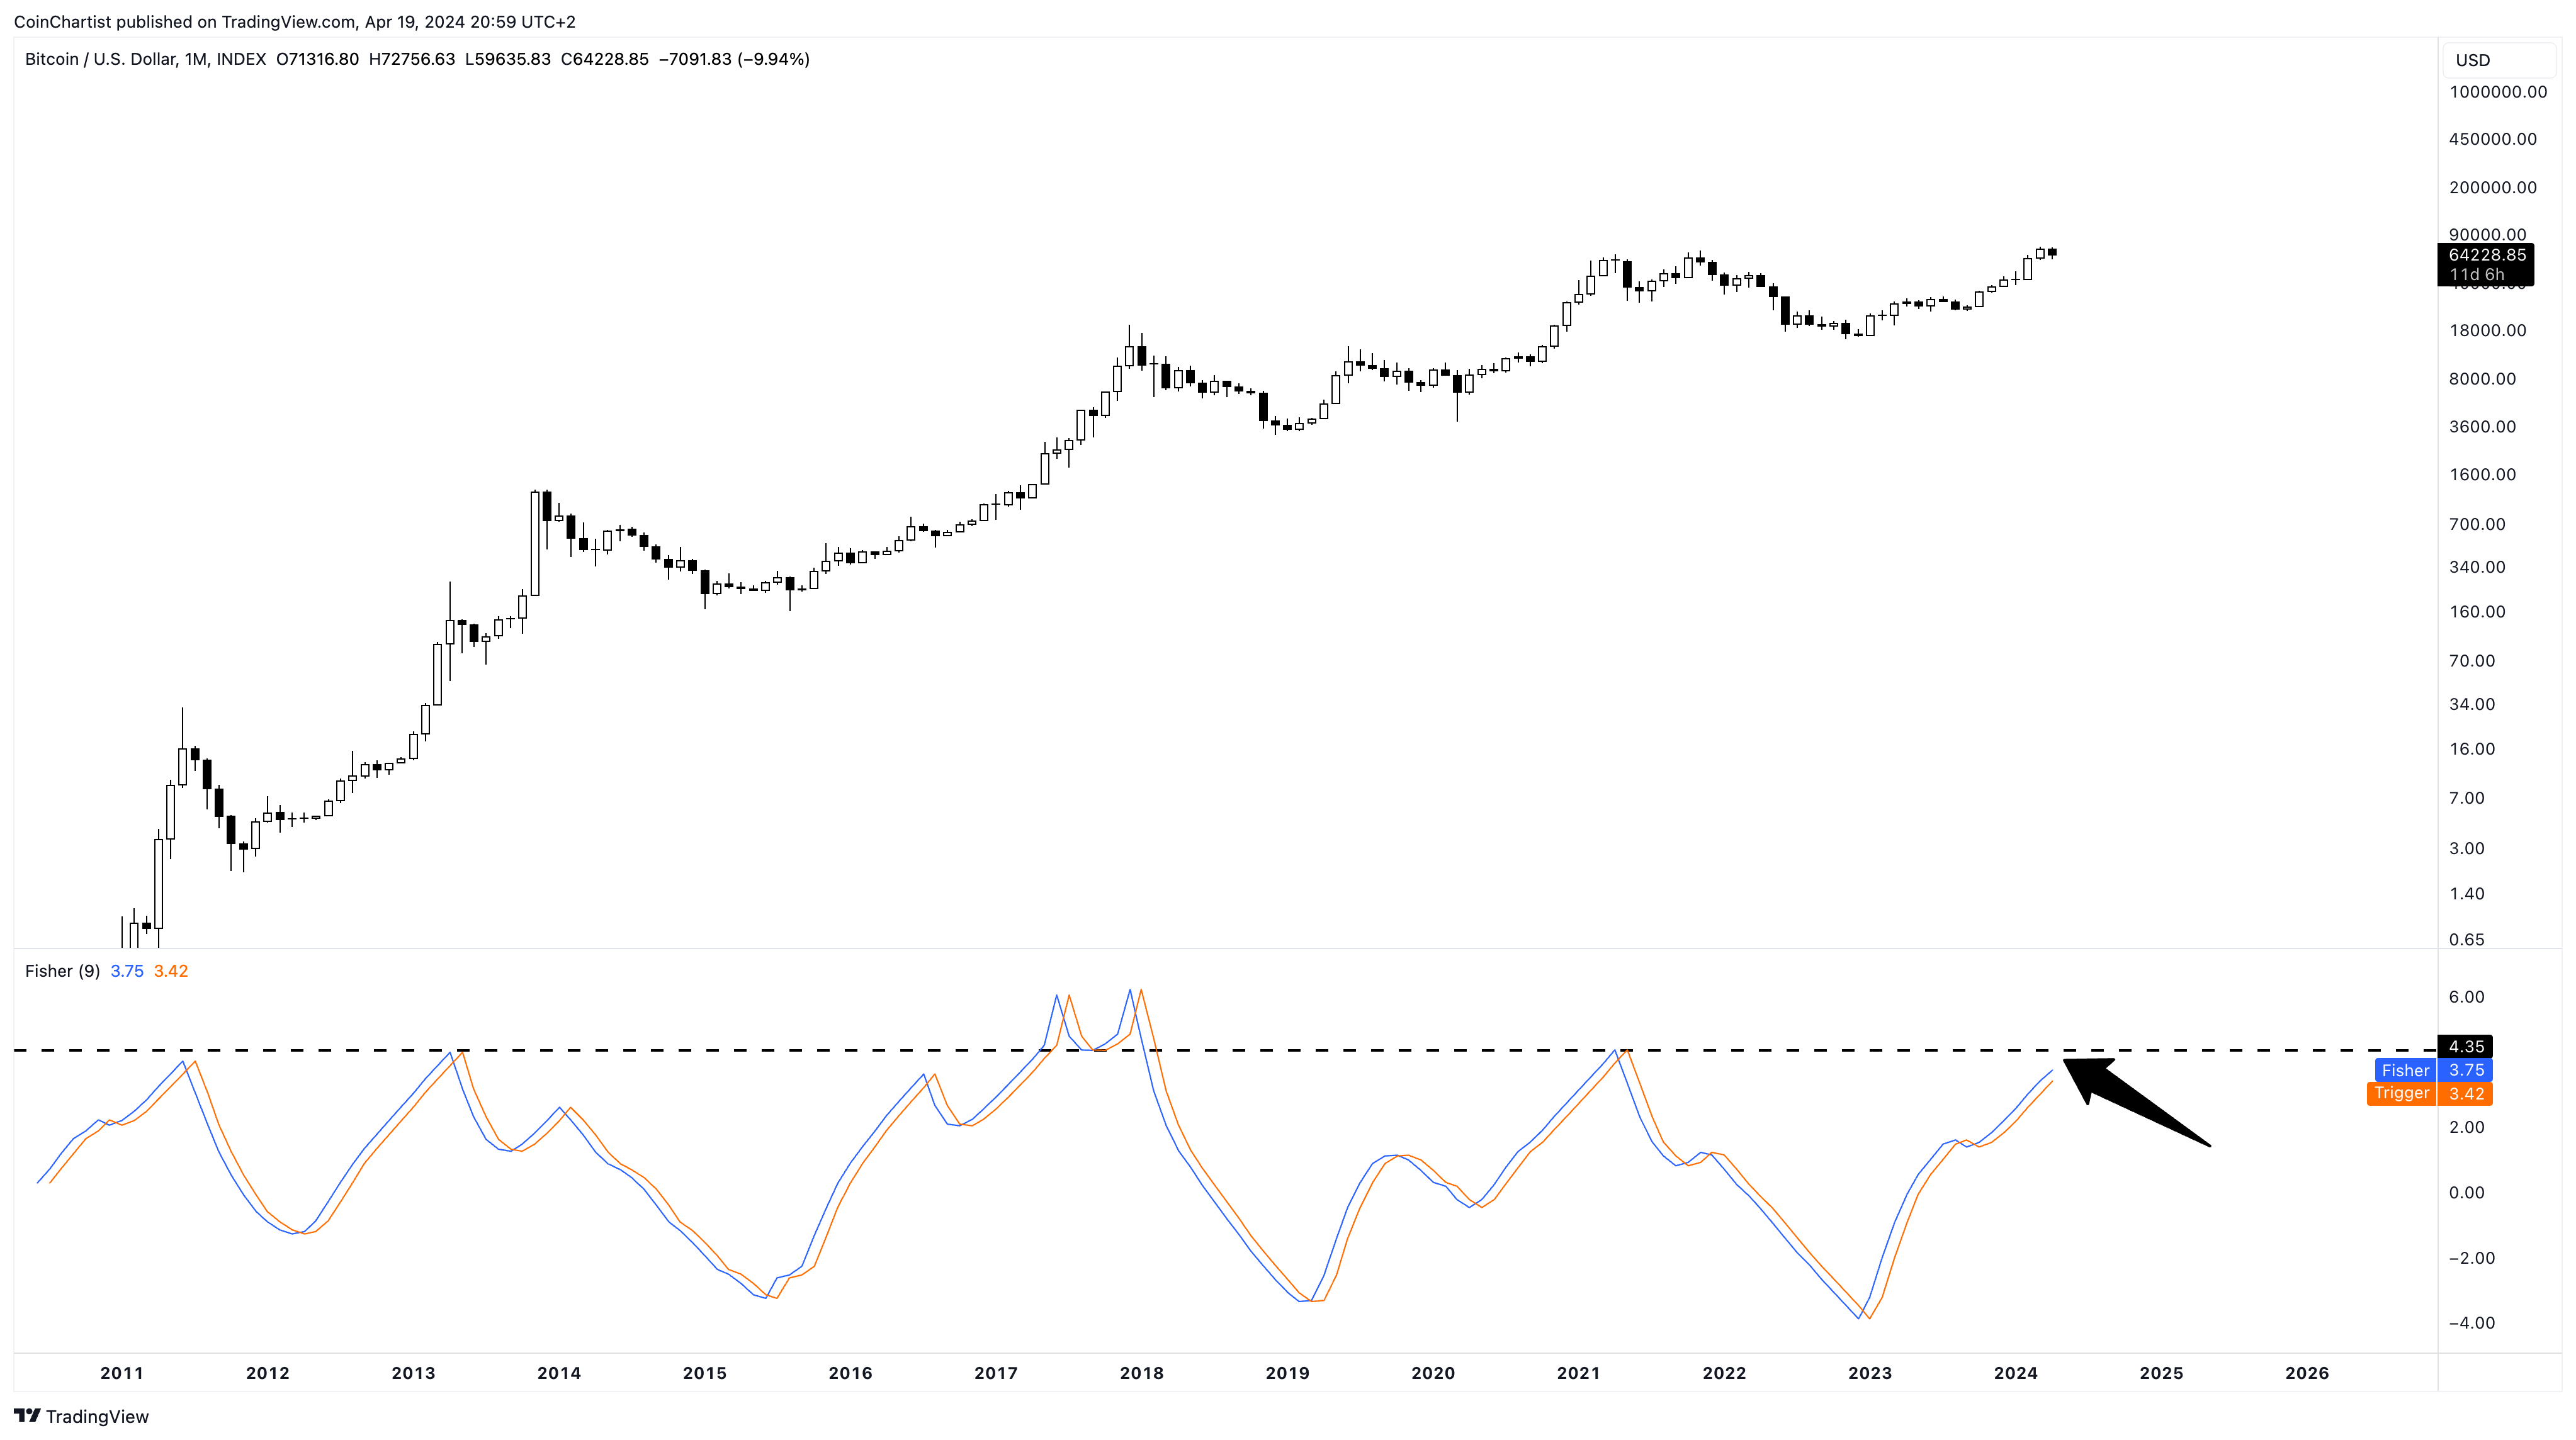
As stated, the end of the bull market could be a lot closer than many would expect. The Fisher Transform shows that BTCUSD is closing in on price extremes associated with cyclical peaks. Only one cycle – 2017 – was Bitcoin able to exceed +4.35 standard deviation on the Fisher Transform. All other cycle peaks ended at or below this metric. With only a little wiggle room remaining, this could further add validity to the fact a top of this bull market is near.

Because Bitcoin could be close to a bull market peak, I’ve increasingly switched my analysis toward seeking signals that could tip me off as to when the top is in. Unfortunately, I’ve discovered that one such topping signal is at risk of firing, potentially suggesting the bull market could be over already. All of this is contingent on how April closes, as I’ll explain.
Keep reading with a 7-day free trial
Subscribe to CoinChartist (VIP) to keep reading this post and get 7 days of free access to the full post archives.