

#47 | Sideways (or Sharp) Summer
Will the painful sideways price action continue over the summer? Or will Bitcoin and crypto succumb to a sharp correction?

Disclaimer: The information provided in this Substack newsletter is for general informational purposes only and should not be considered as financial advice. Investing involves risk, and past performance is not indicative of future results. Please conduct your own research or consult a financial advisor before making any investment decisions. The newsletter disclaims any liability for losses or damages arising from the use of this information.
Issue #47 overview:
Crypto to ramp up post-Presidential election in the US?
Bitcoin nowhere near top of log growth channel
Why the current cycle has a lot more time left
Lower timeframe Bitcoin takes a bearish turn
But medium term timeframe BTC could save the day soon
Altcoins have taken a beating, and may continue to bleed out
Unless Bitcoin Dominance finally takes a turn downward in favor of alts

This issue begins with a Special Spotlight that seeks to shed some light on why things have slowed down in the crypto market. It also could suggest that this cycle has a lot longer left to go, despite my original expectations that we would top around July or August.
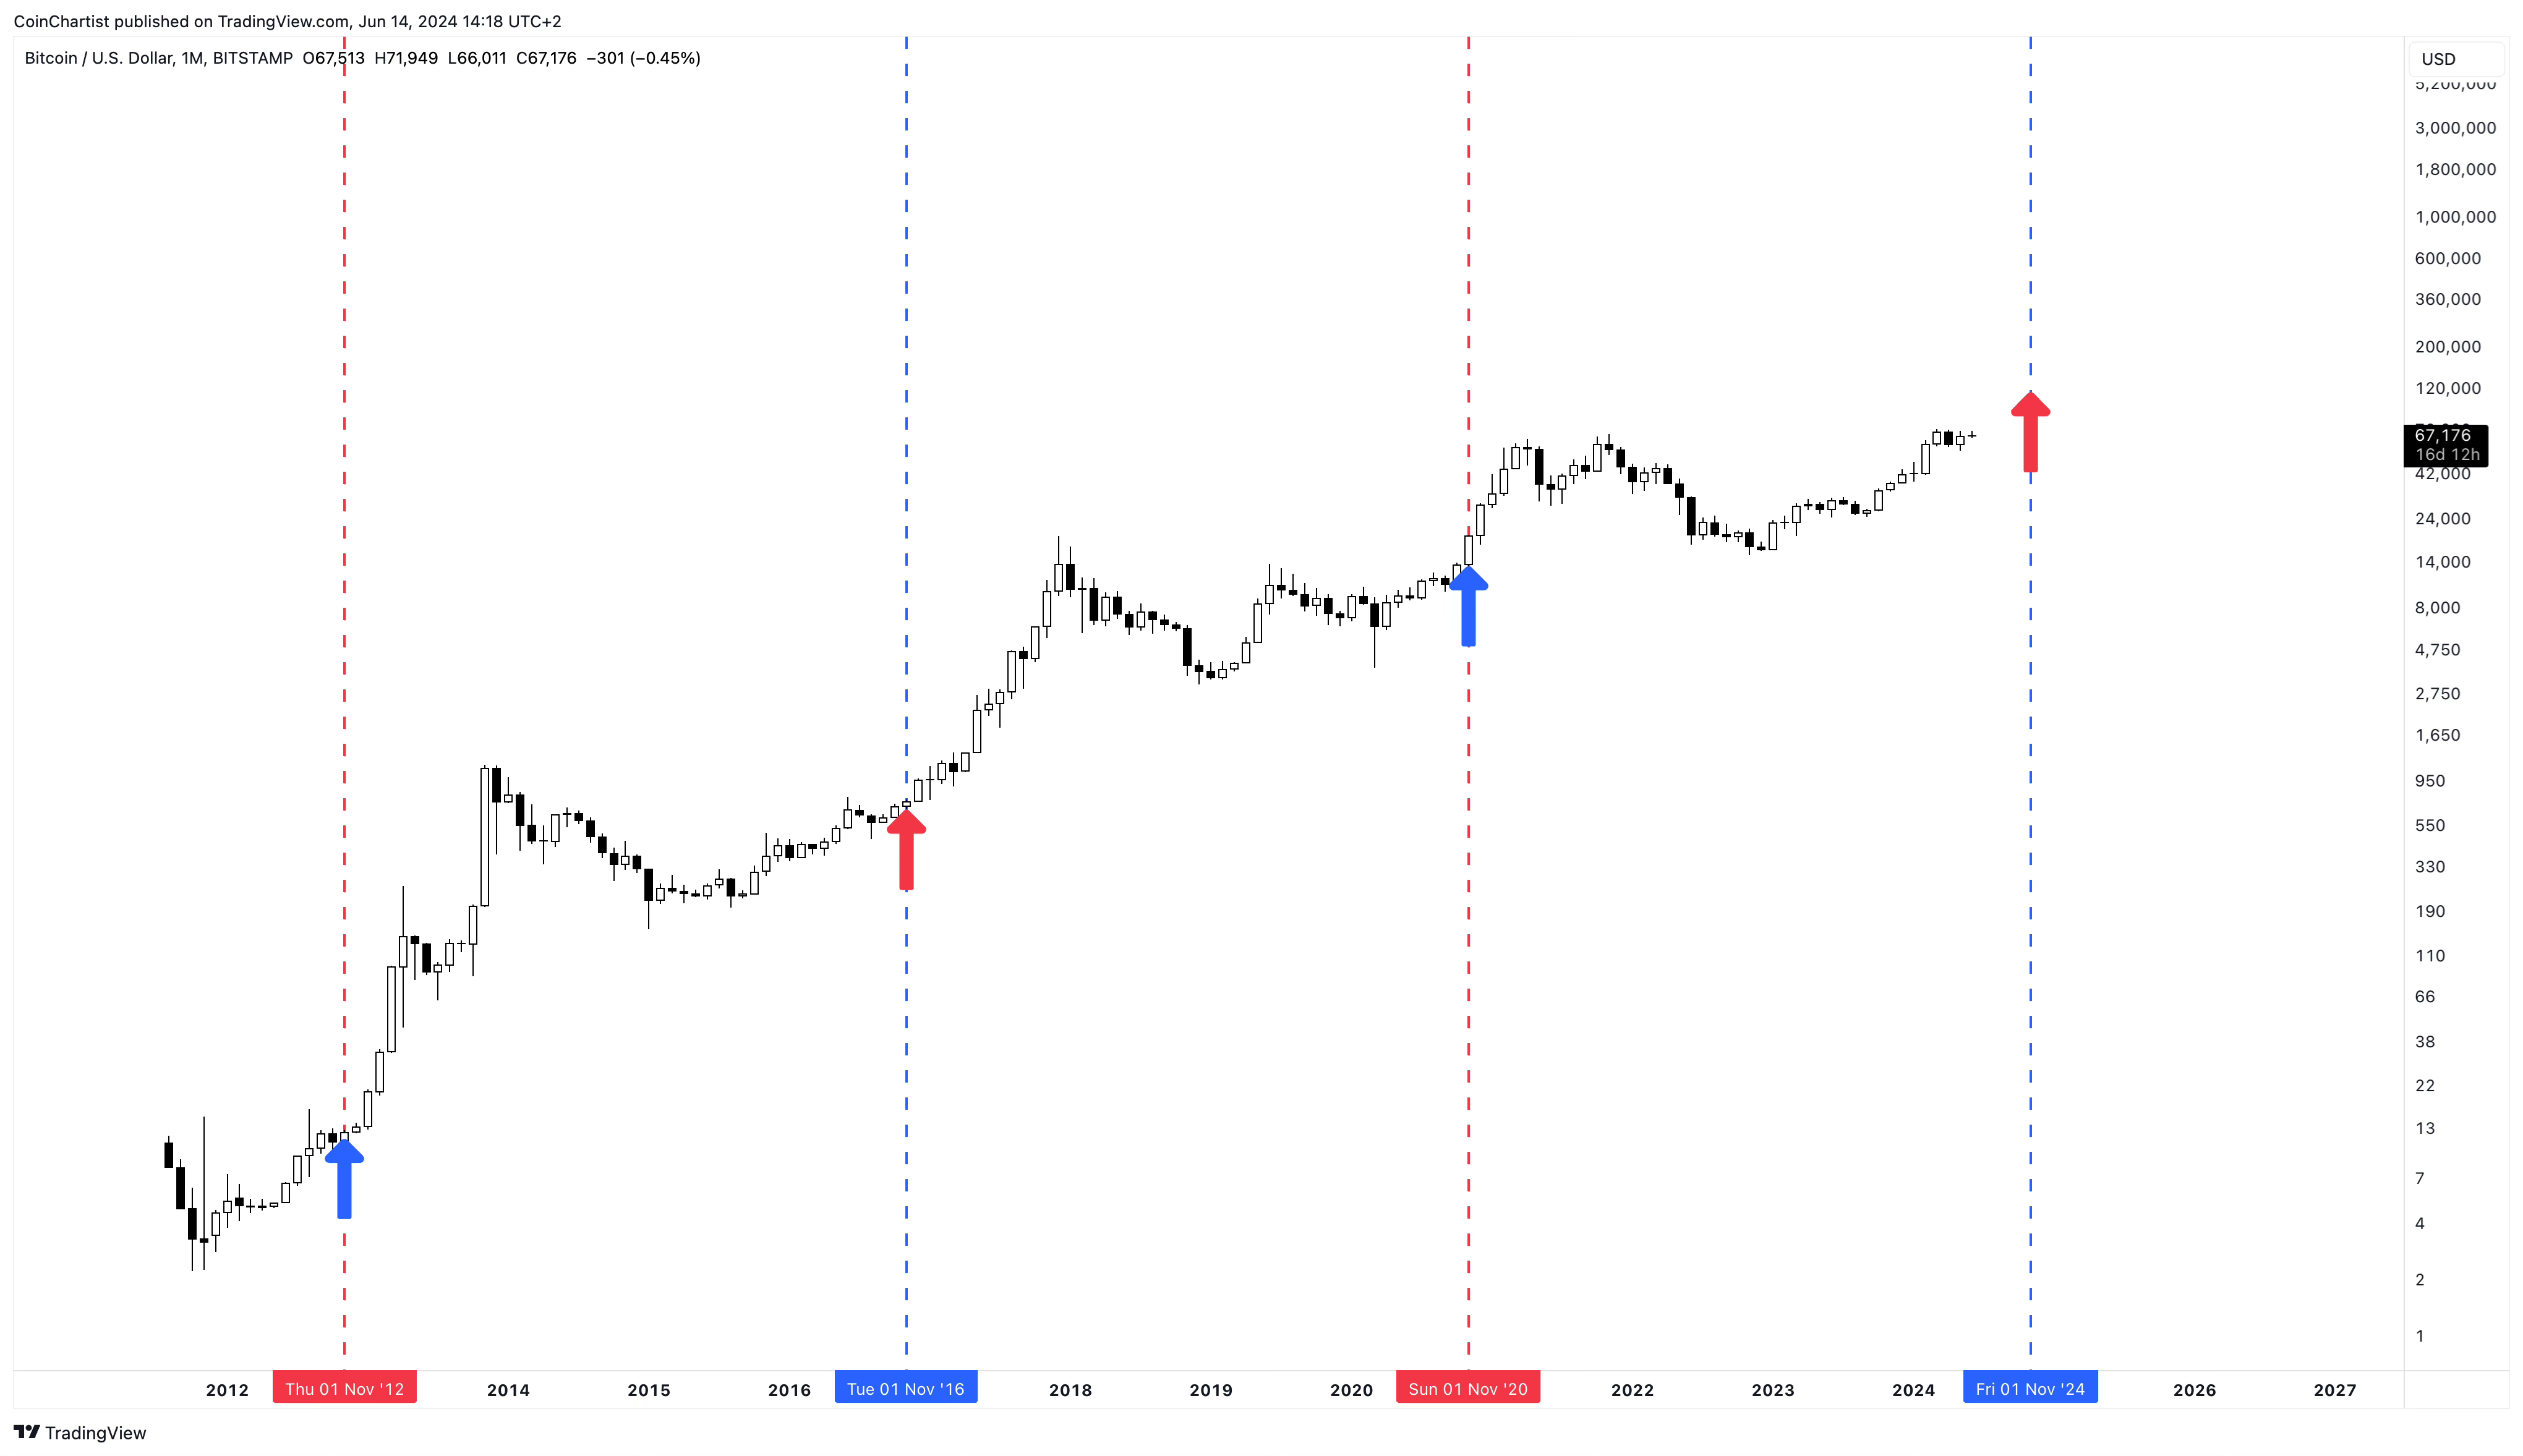
To begin, each market cycle tends to kick into overdrive after the US Presidential election takes place. Each dashed line shows the election in November every four years. As you probably know, Bitcoin is said to follow four year cycles that coincide with each halving event.
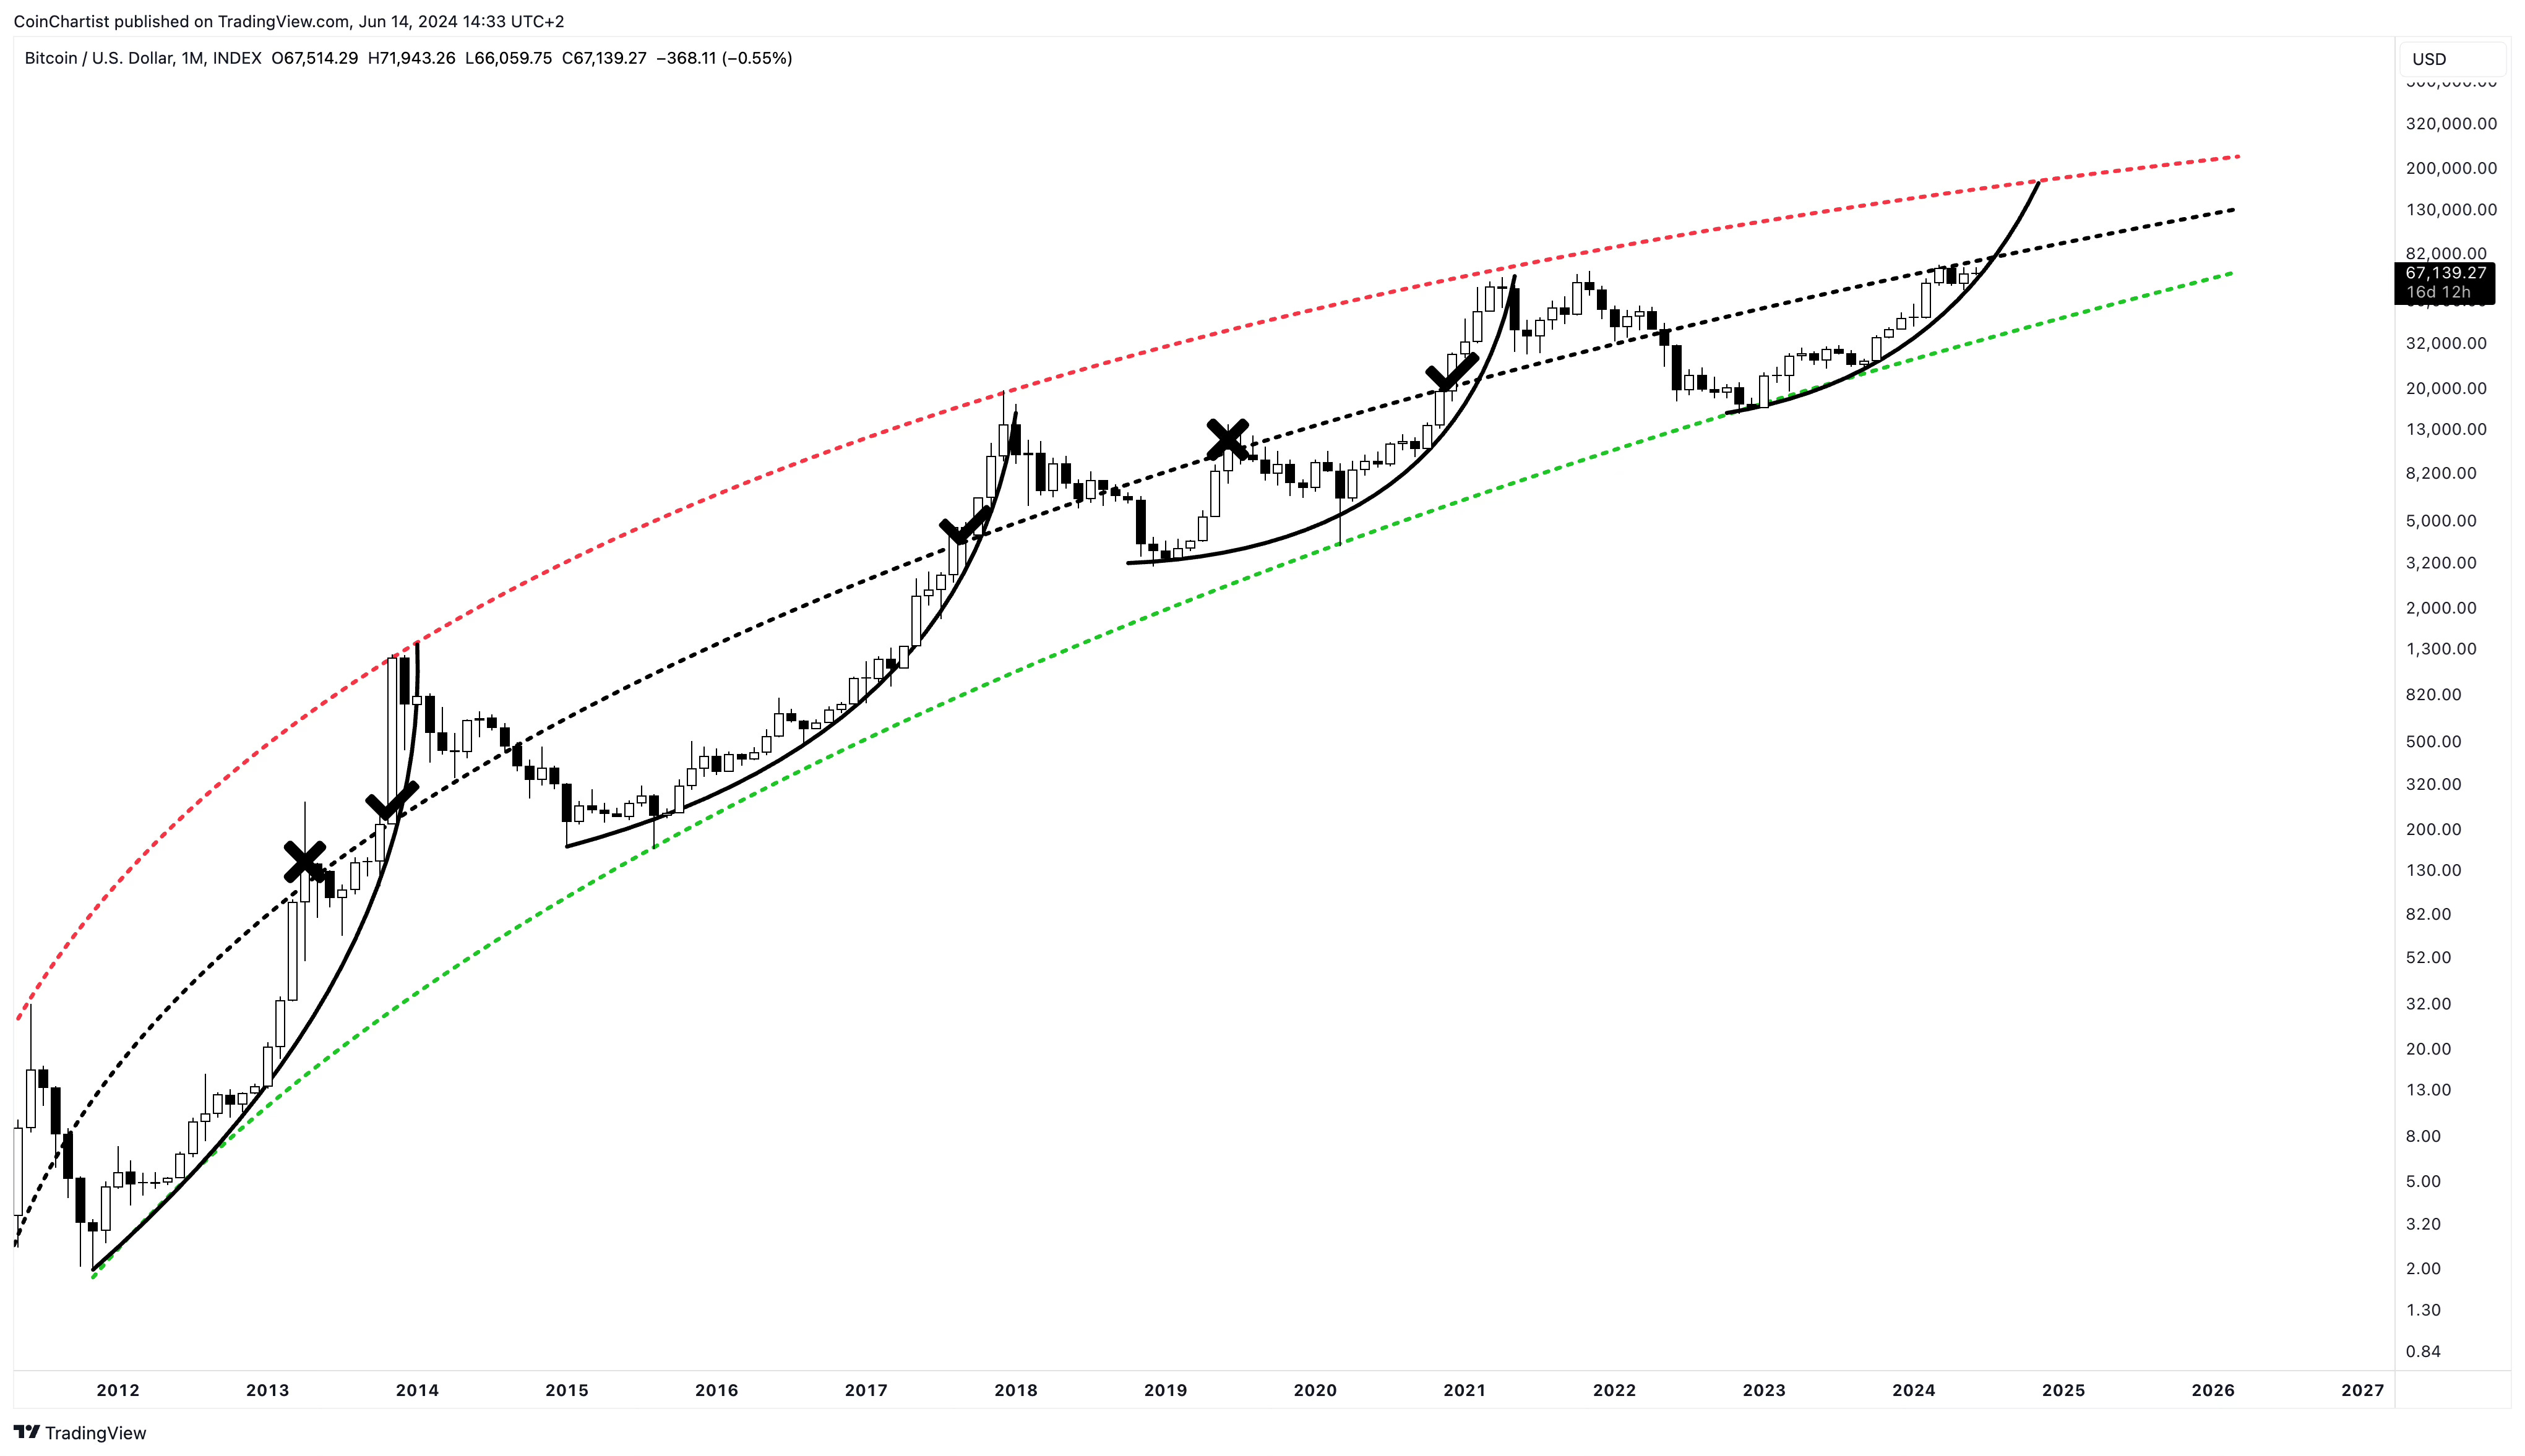
In terms of a top, we likely won’t see one until Bitcoin is a lot closer to the upper dashed red line representing the top of the logarithmic growth channel. Cycles tend to end after making it beyond the median of the log growth channel. Currently, that median is posing as resistance, which it has done so in the past.
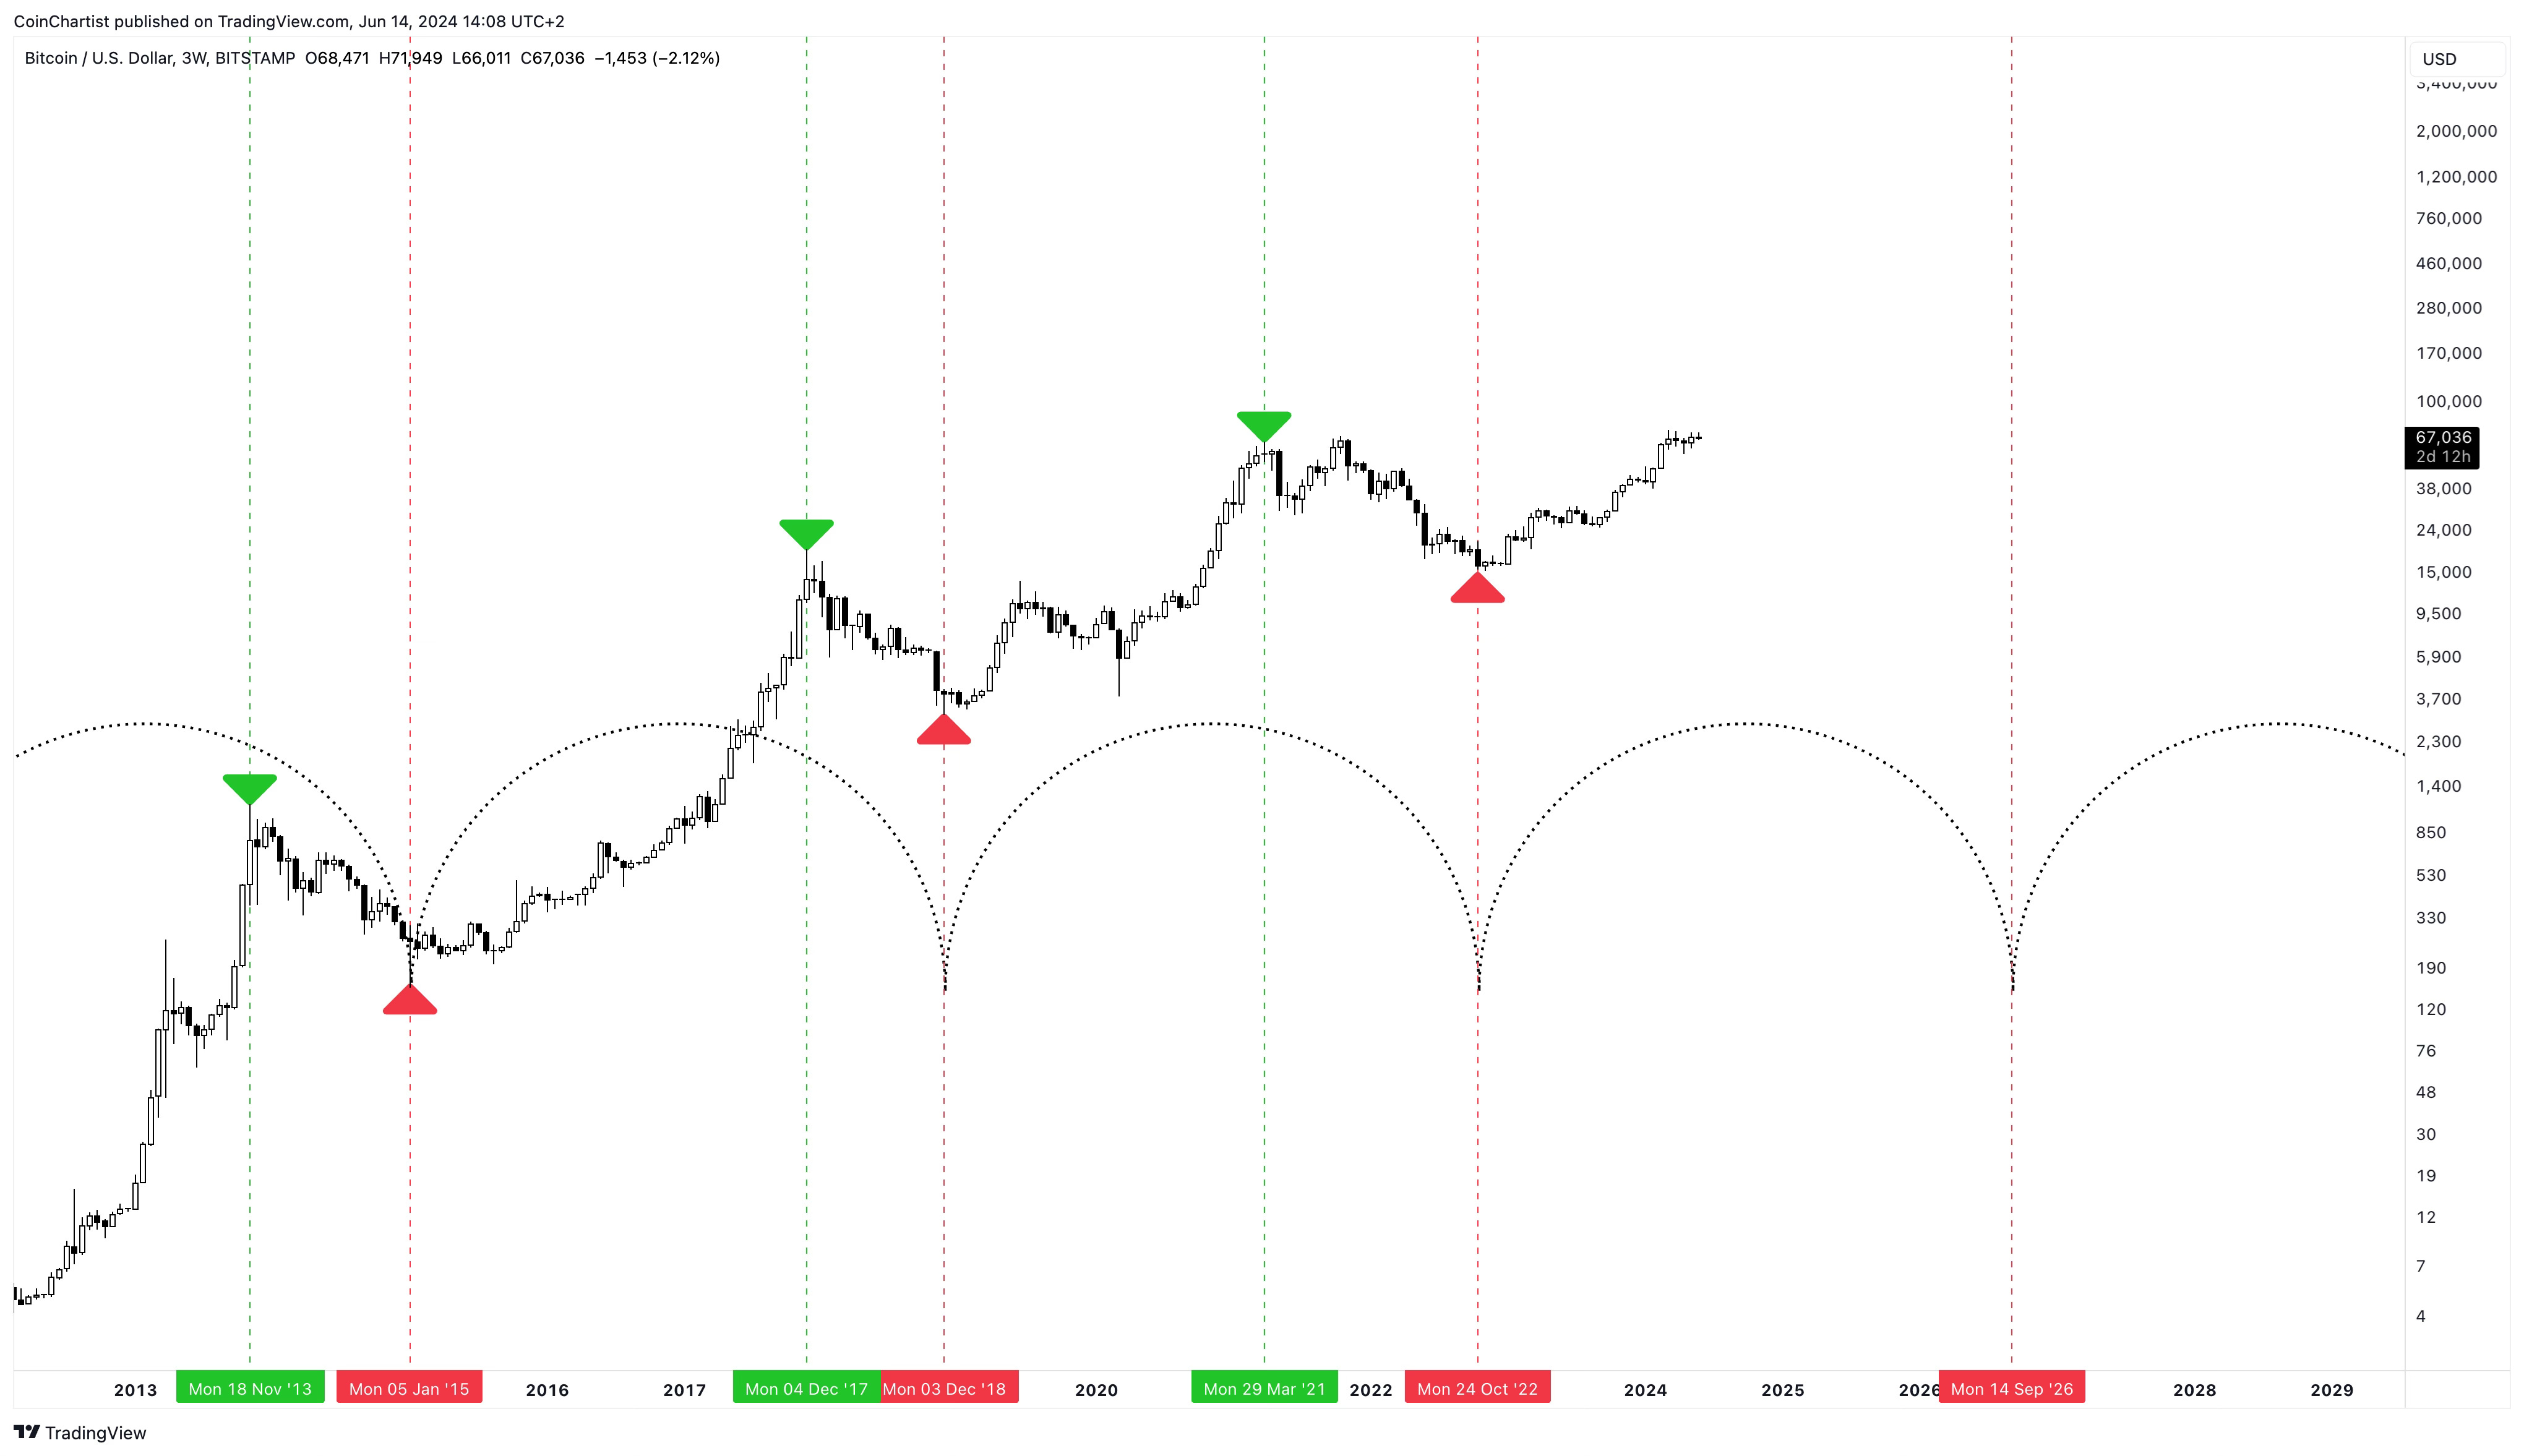
Cycle analysis also shows that most Bitcoin bull markets peak after the crest is reached time wise. The bottom is put in at each cyclical trough. This could indicate that a top of this cycle occurs closer to November or December of 2024, possibly extending into Q1 or even Q2 of 2025.

It is getting more difficult to deny that Bitcoin is turning bearish on lower timeframes, such as the daily. What we don’t want to see, is this type of negative momentum move into higher timeframes like the weekly and monthly. This section will start off showing off the low timeframe weakness, then move into medium timeframes and examining how they are at a level that could pivot back to bullish or fall further bearish.
Keep reading with a 7-day free trial
Subscribe to CoinChartist to keep reading this post and get 7 days of free access to the full post archives.