


#53 | Making the Cut
#53 | Making the Cut
Interest rates are being cut in the US just as China rolls out a stimulus package. How will crypto and risk assets respond?
Disclaimer: The information provided in this Substack newsletter is for general informational purposes only and should not be considered as financial advice. Investing involves risk, and past performance is not indicative of future results. Please conduct your own research or consult a financial advisor before making any investment decisions. The newsletter disclaims any liability for losses or damages arising from the use of this information.
#53 overview:
How will Federal Reserve rate cuts impact Bitcoin and the stock market?
What the VIX could be telling us about fear and greed
Putting BTCUSD up against interest rates for some unusual charts
An update on global liquidity and its implications
Stocks and Metals make major breakout higher
Bitcoin wave counts, top targets, and cycle peak timing
Bitcoin is potentially resuming bullish uptrend
Altcoins finally begin to outperform BTC – will the trend last?

Last week, the United States Federal Reserve cut its target interest rate by 50 basis points – the first rate cut since rates began rising in early 2022. The move is in response to easing inflation and a weakening job market and designed to “balance risks.” The market is now trying to decide if this cut is a bullish sign for the economy or if a full blown recession is near. The immediate response in risk assets appears positive, which could finally end the sideways state of cryptocurrencies with a strong move to the upside.

To start, let’s look at the potential implications of the rate cuts – which doesn’t say a lot to be honest. Bears are quick to point out two things: The start of rate cuts in 2007 was just prior to The Great Financial Crisis, and the start of rate cuts in 2019 was a mid-term top in Bitcoin. Both are correct. However, the stock market kept on climbing in 2019 until the pandemic struck in 2020. At that point, interest rates were dropped back down to zero to avoid a recession. The stock market and crypto responded with a powerful bull run. The start of the bear market began just before the most recent hiking phase. Rate increases in late 2015, however, kicked off one of Bitcoin’s largest bull runs. As you can see, there’s plenty of conflicting information and none of the data points to a clear outcome in the days ahead. This issue focuses on what technicals are telling us instead about the future of risk assets.

With TradingView, you can combine different tickers to create ratios for out-of-the-box analysis. Rather than just looking at Bitcoin or interest rates, I’ve combined BTCUSD and the Federal Reserve’s target interest rates to create a very distorted-looking Bitcoin chart. Interestingly, price is consolidating right below the 0.618 Fibonacci level. At the same level, both the 2013 and 2017 bull markets reached their tops. The level was also the last point before a massive gap up on the chart in 2020, as interest rates were abruptly dropped to zero.

Ditching the Fibonacci retracement in favor of a simple support and resistance block drawing, and we can see that Bitcoin appears to be consolidating at an important support and resistance level. Two bear markets began from this level after the 2013 and 2017 peaks, so it is important there is a breakout higher on this chart.
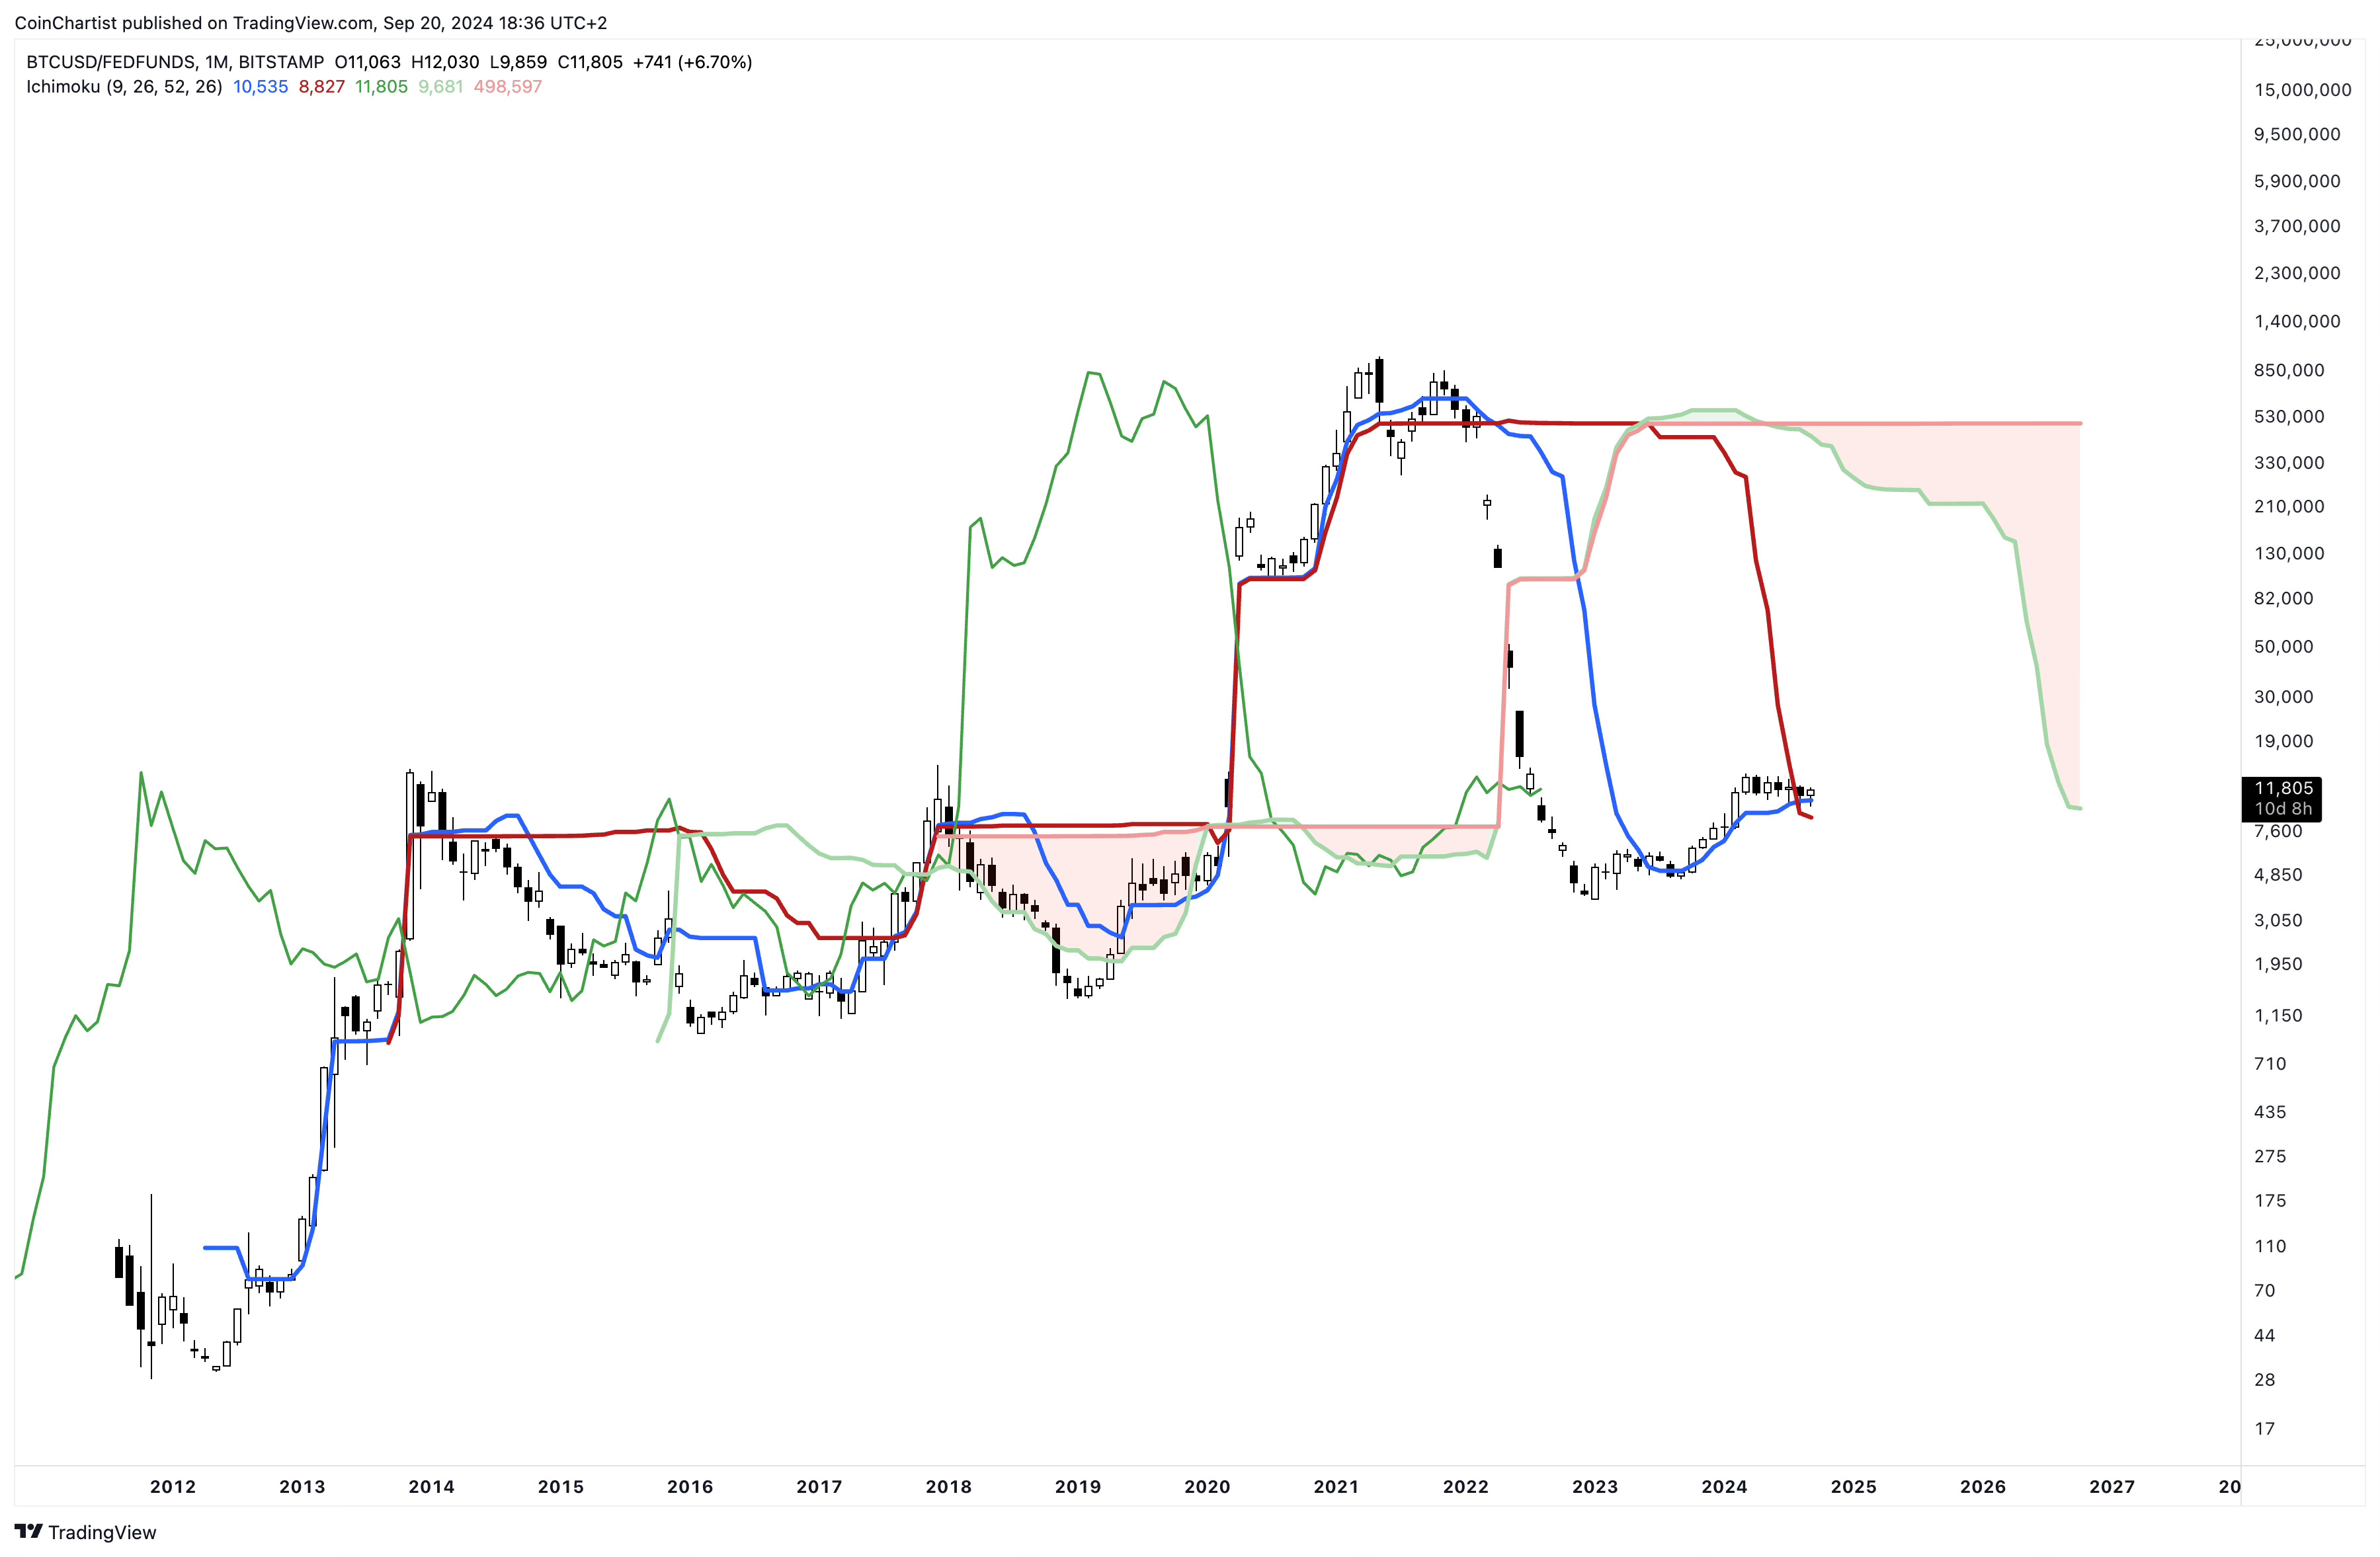
Despite being an incredibly unorthodox chart, BTCUSD/FEDFUNDS responds remarkably well to technical analysis tools. At a glance, we can see that the 2017 bull market peaked at the top of cloud resistance. The bull run in 2020 began after breaking above the same red Ichimoku cloud. As of August 2024, BTCUSD/FEDFUNDS is above both the Tenkan-sen (blue) and Kijun-sen (maroon). These two spans are currently flipped bullish. According to the cloud and Chikou span, there isn’t much resistance above current levels.

The LMACD is showing a major momentum change between the ratio of BTCUSD/FEDFUNDS. The two Moving Averages have crossed bullish, and the histogram is now green and growing. The last two instances of a green histogram represent both of Bitcoin’s most recent bull runs.

Moving away from FEDFUNDS, the chart above is the VIX monthly. The two highs on the chart represent the Black Thursday COVID crash in 2020 and the August 2024 panic following the Yen carry trade unwinding. After the largest wick visible on the VIX chart, September’s monthly candlestick also has a large upper wick, with very little candlestick body. In Japanese candlestick analysis, this is a Gravestone Doji. These candlestick patterns are relatively rare and tend to point to downside in the months ahead. A high VIX implies extreme fear in the market, and a lower VIX is associated with extreme greed. Could this candlestick be pointing to a turn toward extreme greed in financial markets?

Plotting BTCUSD against the VIX shows that this ratio wicked into the bottom touch point of an uptrend line. The LMACD is doing something important at the moment – it is about to crossover or diverge upward. The LMACD is the logarithmic version of the MACD, which stands for Moving Average Convergence/Divergence. If the LMACD line and signal line cross down, it suggests a turn to bearish momentum. If the two lines diverge upward instead, this far above the zero line, it will be a strong bullish signal instead. Finally, the current candlestick is now above former ATH horizontal resistance.

Much like the Ichimoku magically works with BTCUSD/FEDFUNDS, here on BTCUSD/VIX it works like a charm too. The current candlestick and even Augusts candlesticks held above the Tenkan-sen and Kijun-sen, which are currently crossed bullish. Staying above these two spans should keep Bitcoin climbing against the VIX.

While all the above is unfolding on interest rates and the VIX, Gold (pictured left) and the S&P 500 (right) made new all-time highs this week. Bitcoin and the rest of crypto have since rallied, but remain far below all-time highs. Capital could rotate from metals and stocks into crypto and overall risk appetite could increase. With how tiny the market cap of crypto is versus the massive size of Gold and the stock market, even a little bit of capital rotation could do a lot for crypto prices.

Global liquidity continues to grow. Increases in liquidity tend to give Bitcoin and the rest of crypto a boost. It also tends to show its effect roughly 2-3 months later on price charts. It’s been almost three months since the breakout, which could mean Bitcoin’s time is coming soon – and it could drag altcoins up with it. It is important to note that China just revealed its largest stimulus yet, which should amp up global liquidity and hasn’t been factored into this chart just yet as the data is too new.
Keep reading with a 7-day free trial
Subscribe to CoinChartist (VIP) to keep reading this post and get 7 days of free access to the full post archives.