

#54 | When Continuation?
When will this godforsaken trading range break in Bitcoin? What Gold might be telling us about BTC's next big move.

Disclaimer: The information provided in this Substack newsletter is for general informational purposes only and should not be considered as financial advice. Investing involves risk, and past performance is not indicative of future results. Please conduct your own research or consult a financial advisor before making any investment decisions. The newsletter disclaims any liability for losses or damages arising from the use of this information.
#54 overview:
Comparing Bitcoin’s 2024 correction with 2019/2020
Putting October 2023 up against October 2024
Is an uptrend in Bitcoin brewing? We review updated wave counts
Why Ethereum is still on thin ice
Is Bitcoin Dominance finally ready to reverse?
Is the dollar too big to fall?
What is Gold telling us about Bitcoin’s next move?

Markets are “fractal,” that much is clear. This means that different trends can act similarly across different time periods. The important thing to note, is the word “similar.” Even if a trend appears to mimic the price action of a past instance of price action, there is a strong probability that it will play out a little differently.
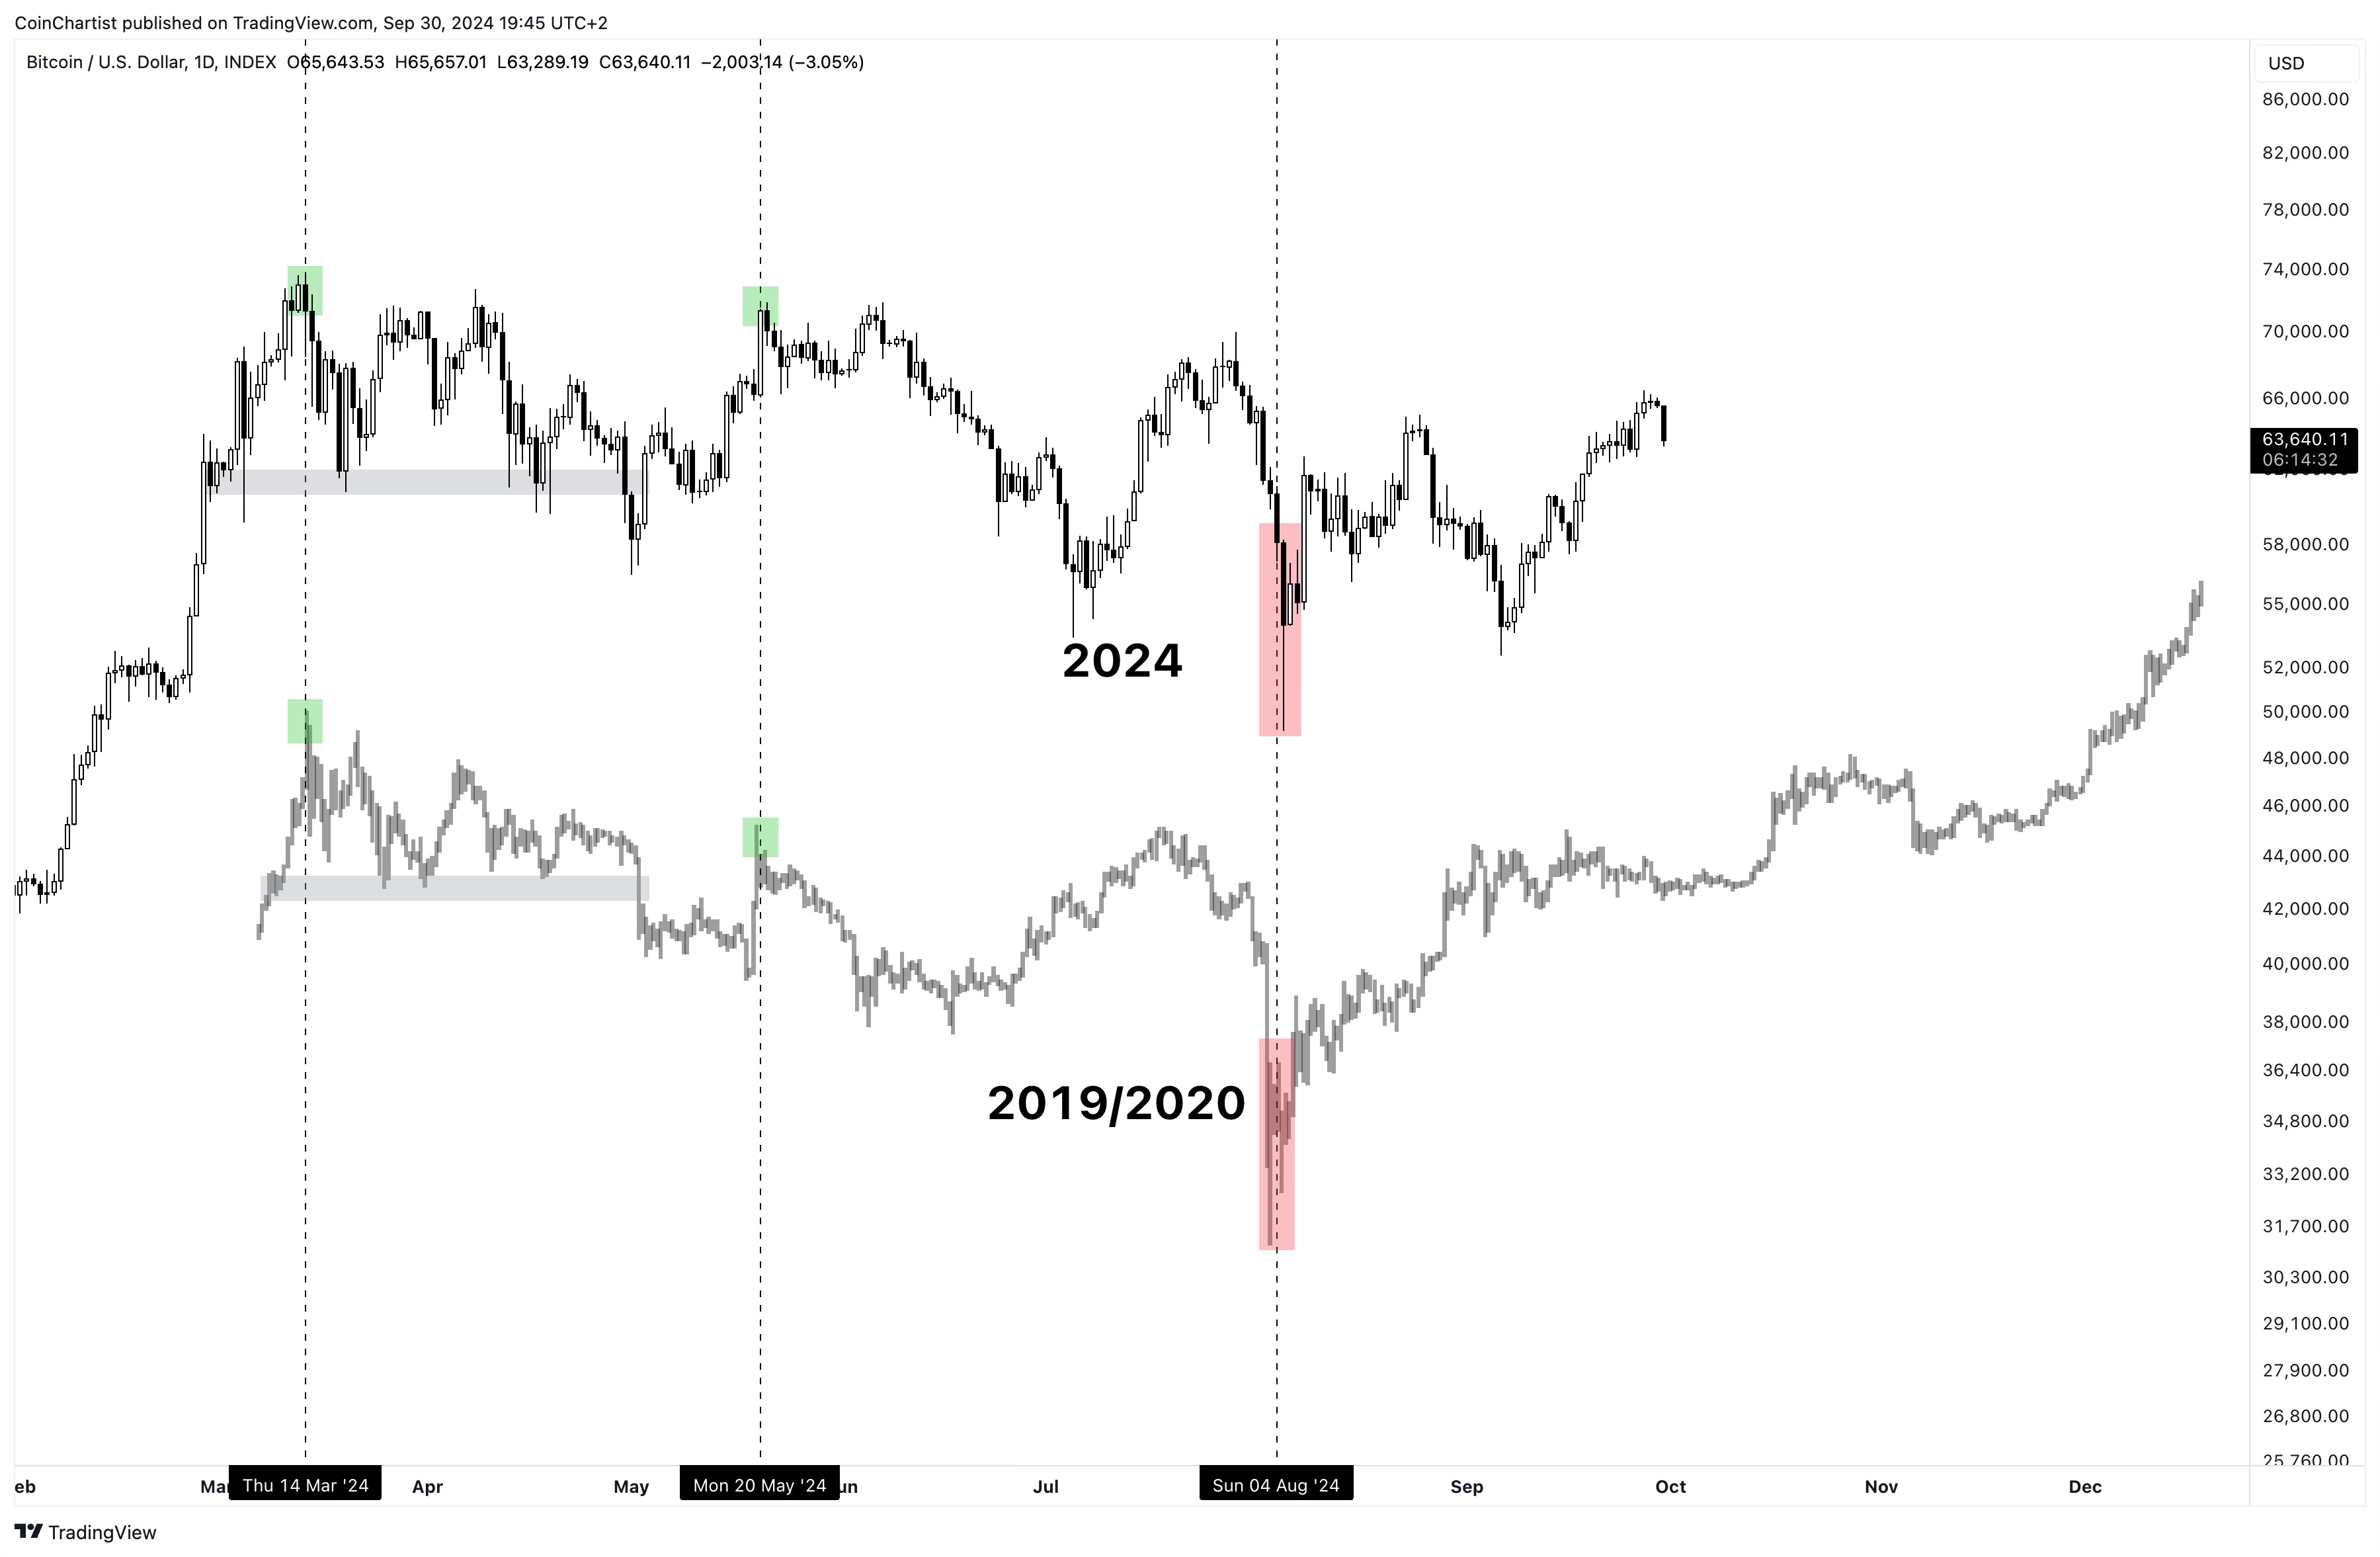
In the above price fractal, we are comparing the recent correction in Bitcoin to the 2019/2020 correction that culminated with the COVID selloff in March 2020. The fractal first began at the first green highlighted box. From there, a series of lower highs unfolded, eventually causing BTC to break down below support (grey box). A strong bounce took Bitcoin back towards local highs. At this point, the fractal begins to differ in shape slightly. However, both the Black Thursday 2020 downward spike and the August 2024 VIX-driven panic line up at the same placement. If like in 2020, the capitulation event was enough to end the correction, Bitcoin should be on its way back to a bullish trend and aiming for new all-time highs. Although this is positive, if the length of the fractal remains similar, BTC could have a full three months more of painful sideways to go before the trend resumes in early 2025.
Note: Another fractal at the end of this issue suggests Bitcoin might see $76,000 per coin within two weeks. Which fractal is right? Don’t miss it.
Keep reading with a 7-day free trial
Subscribe to CoinChartist to keep reading this post and get 7 days of free access to the full post archives.