


Altcoin Silver Lining
Silver is on the move. This issue explores how it could boost altcoins if history repeats. But even so, it could take several more months of sideways before it happens.

Disclaimer: The information provided in this Substack newsletter is for general informational purposes only and should not be considered as financial advice. Investing involves risk, and past performance is not indicative of future results. Please conduct your own research or consult a financial advisor before making any investment decisions. The newsletter disclaims any liability for losses or damages arising from the use of this information.
Altcoin Silver Lining overview:
Comparing 2021’s “Double Top” in Bitcoin versus today – and why they aren’t the same thing
Ready for new all-time highs? A bear market? Momentum says sideways could be the reality
There is a lack of strength in crypto. Is this the end of the bull market, or only the beginning?
Historically low volatility hints a big move is eventually coming – but in what direction?
Silver is finally showing strength again Gold. Are altcoins ready to do the same versus Bitcoin?
Plus, what Silver typically reveals about an altcoin season
Bitcoin continues to struggle with overhead resistance, but has yet to be rejected in a meaningful way. Yet still, the collective crypto community remains absurdly bullish, without a proper reason to be. Worse yet, so many crypto influencers and analysts are suggesting altcoins are going to take off higher at any moment. Ask yourself: aside from making a new high in BTCUSD, what has changed in terms of risk appetite that could boost altcoins? This issue will focus on the technical truth about the cryptocurrency market. There’s no narrative, no macro or fundamental focus — just pure technical signals that suggest that the cryptocurrency market will move mostly sideways at best, and is still at risk of further correction. Before you begin reading, attempt to clear your mind of any personal biases or hope, and consider only what the signals are suggesting.
Side note: In addition to this Substack newsletter, I am over at Slice where I am posting three videos per week, trade setups, and other education. I will soon be opening up 3 spots for private 1-on-1 private mentorship. Visit Slice to secure your spot.
Double Trouble
Before I dive into technicals, I want to disprove one of the strongest bearish narratives going around right now. Just like I was adamant about the technicals not support a 2017 style rally, I also want to clarify that I don’t for one second think we are in the same pattern as 2021’s “double top.”
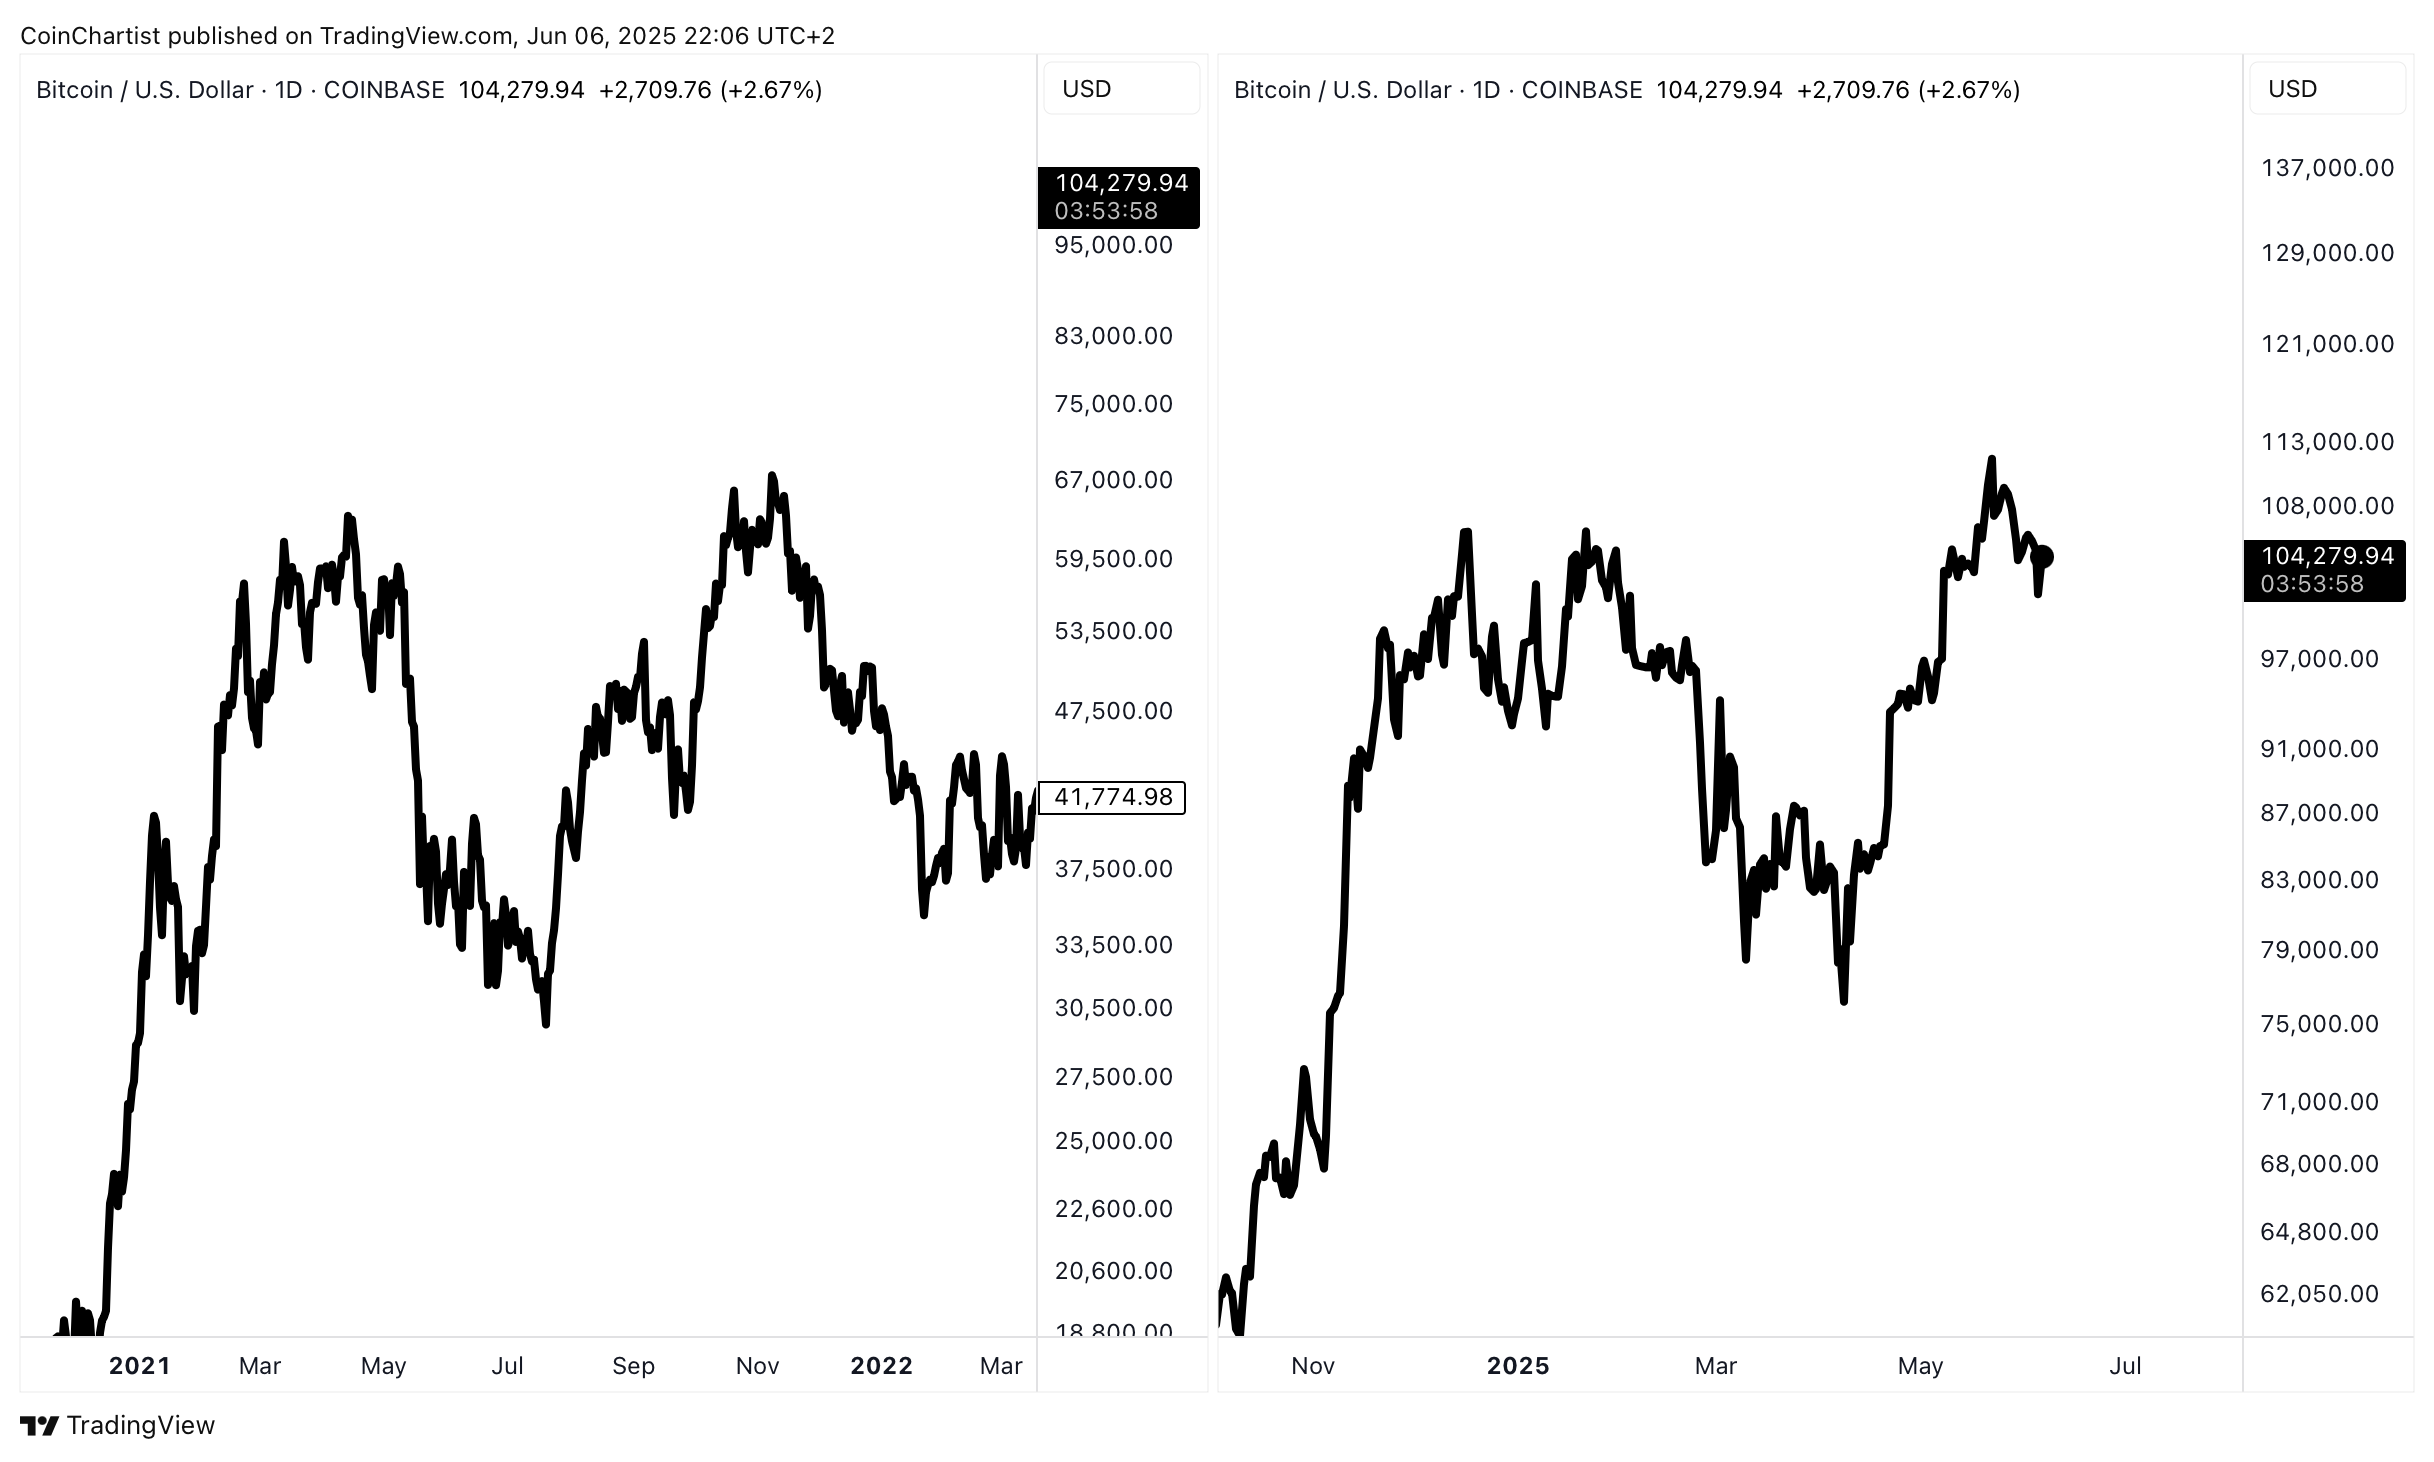
Here we can see a comparison between 2021 and today. There are some undeniable similarities, such as this latest high being only an incremental high. The first “top” also has a similarly rounded structure.
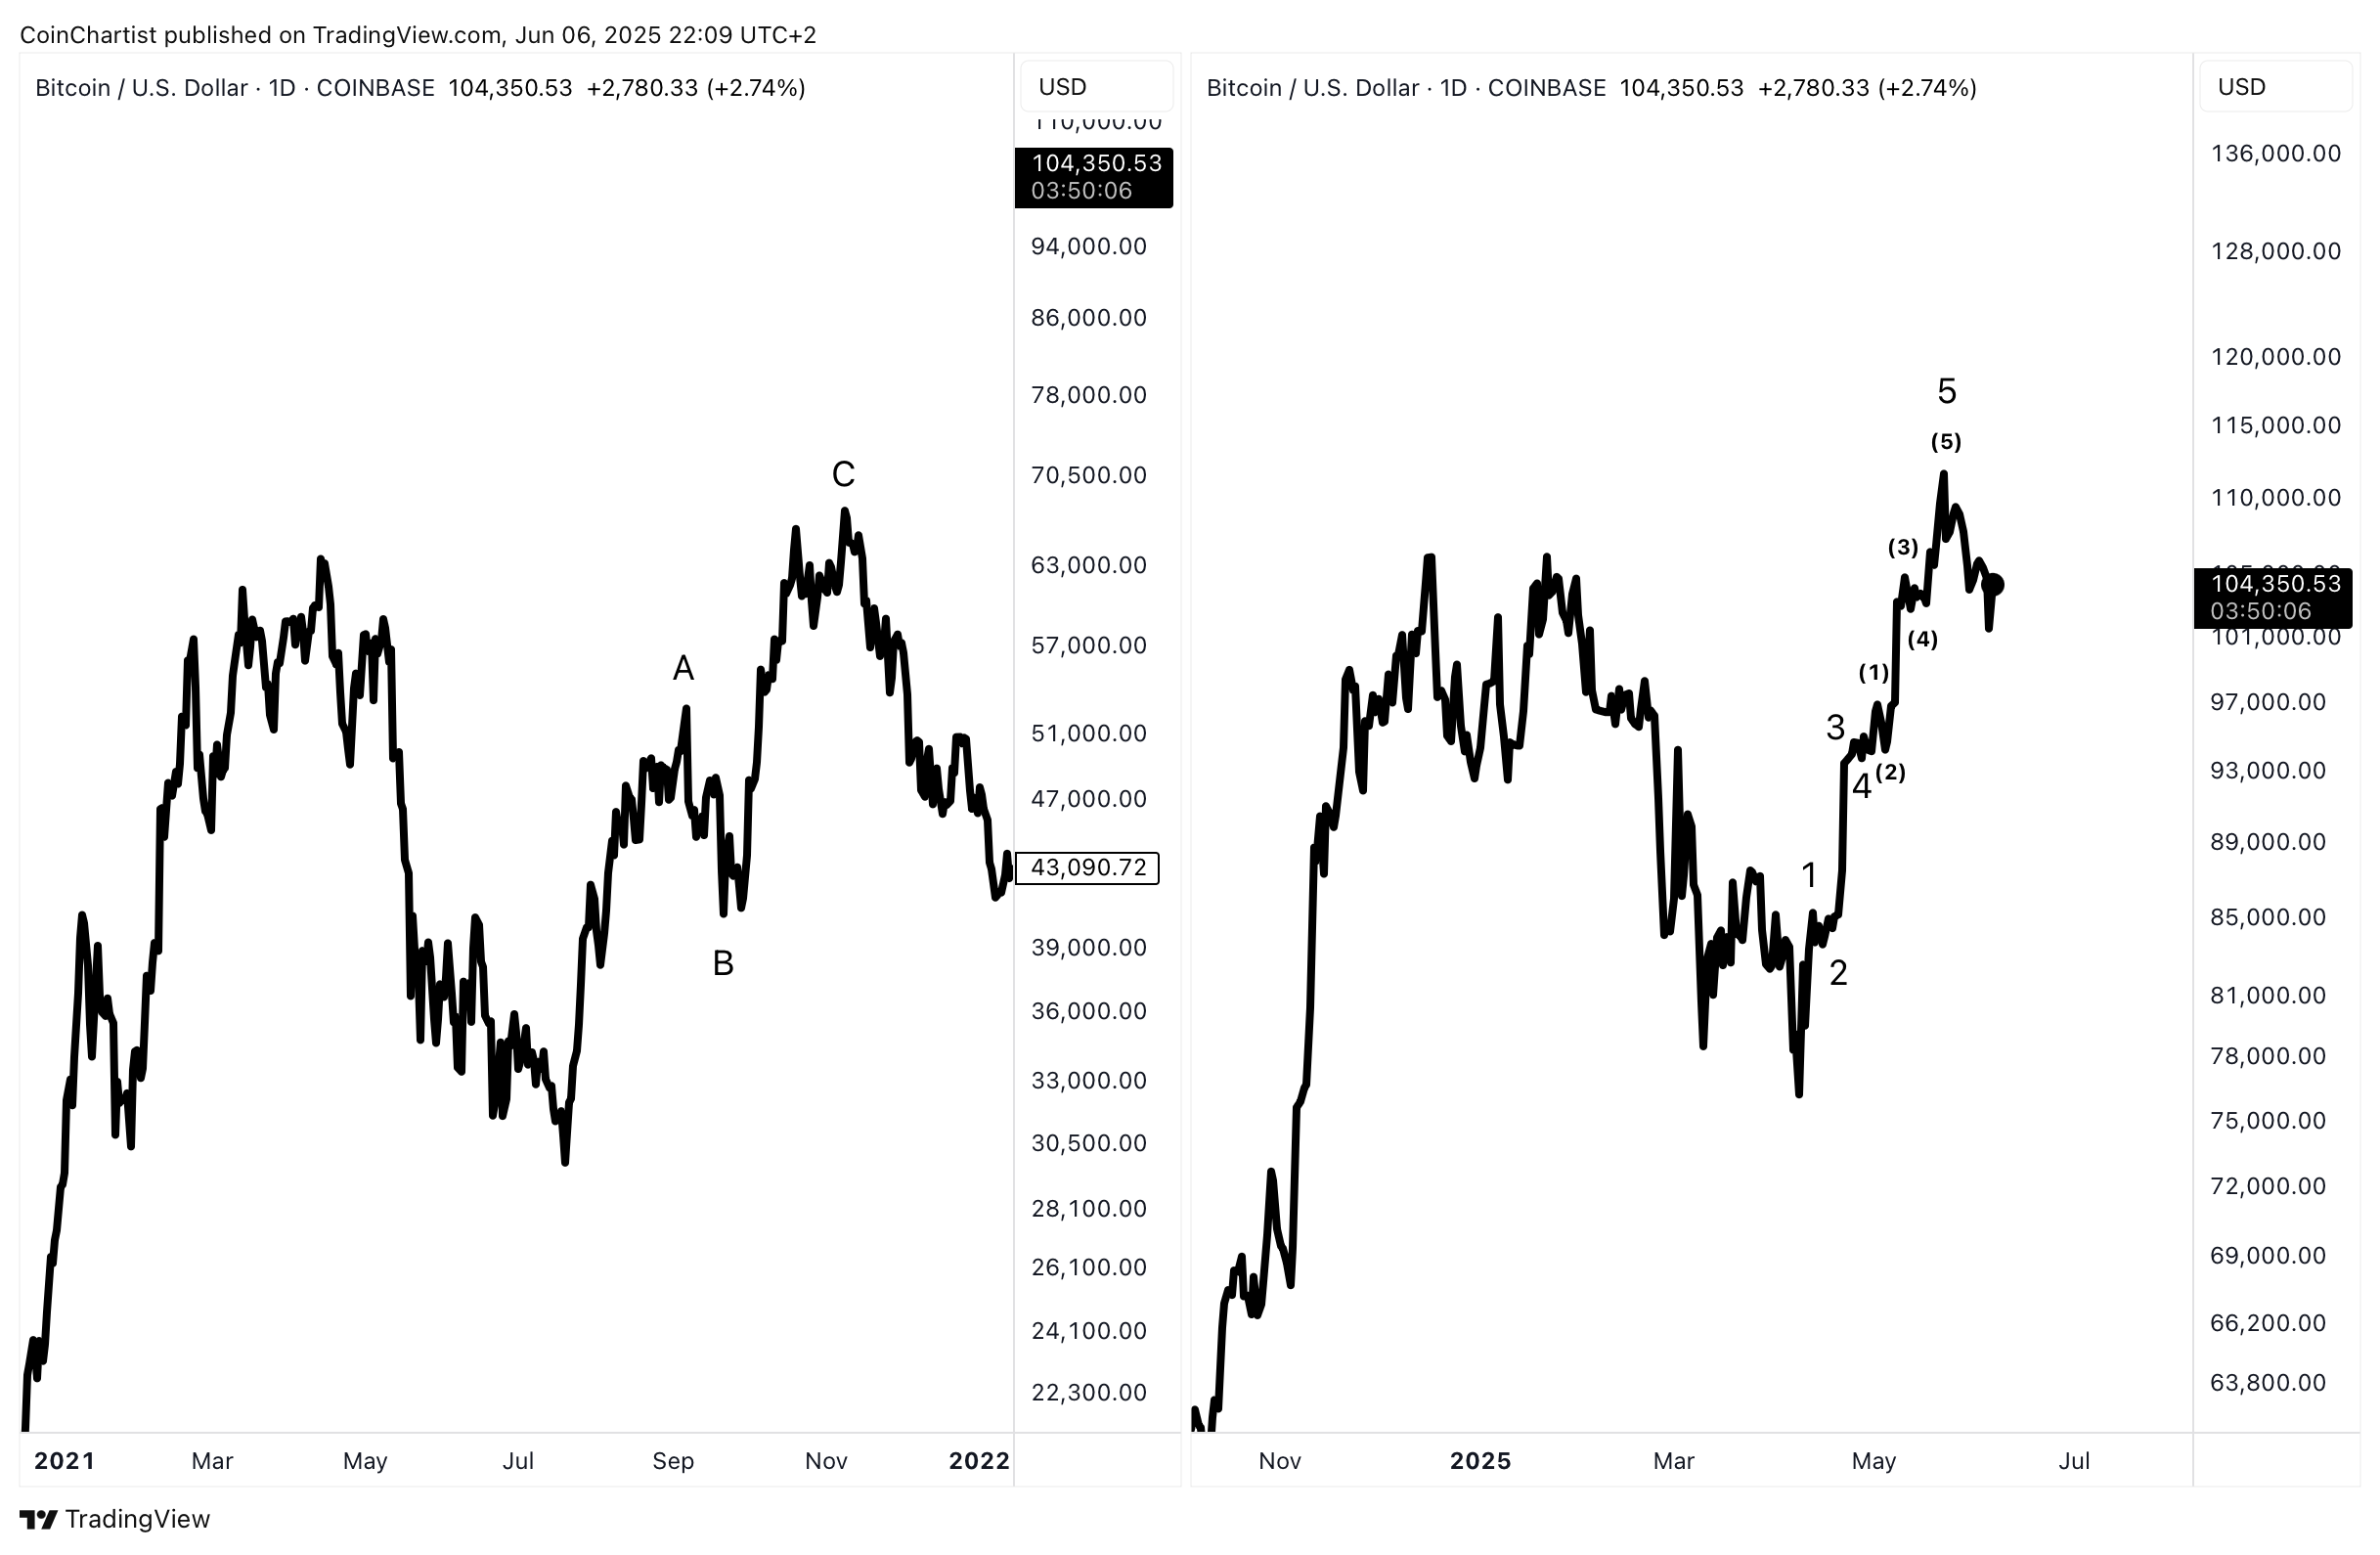
This is where Elliott Wave Principle shines. On the left, the move up to form the second “top” happened in three waves labeled ABC. This is corrective behavior. On the right, we have an impulsive structure instead. Sorry, bears, but this narrative doesn’t have legs.
Sideways Momentum
What does have some value, is a deeper look at high timeframe momentum. The charts you will see are at an inflection point. There’s potential to cross heavily down into bear market territory, and there is potential to diverge back up into a strong bull market. Since we are at such an impasse, at the very least we must consider additional sideways behavior — possibly lasting several months.
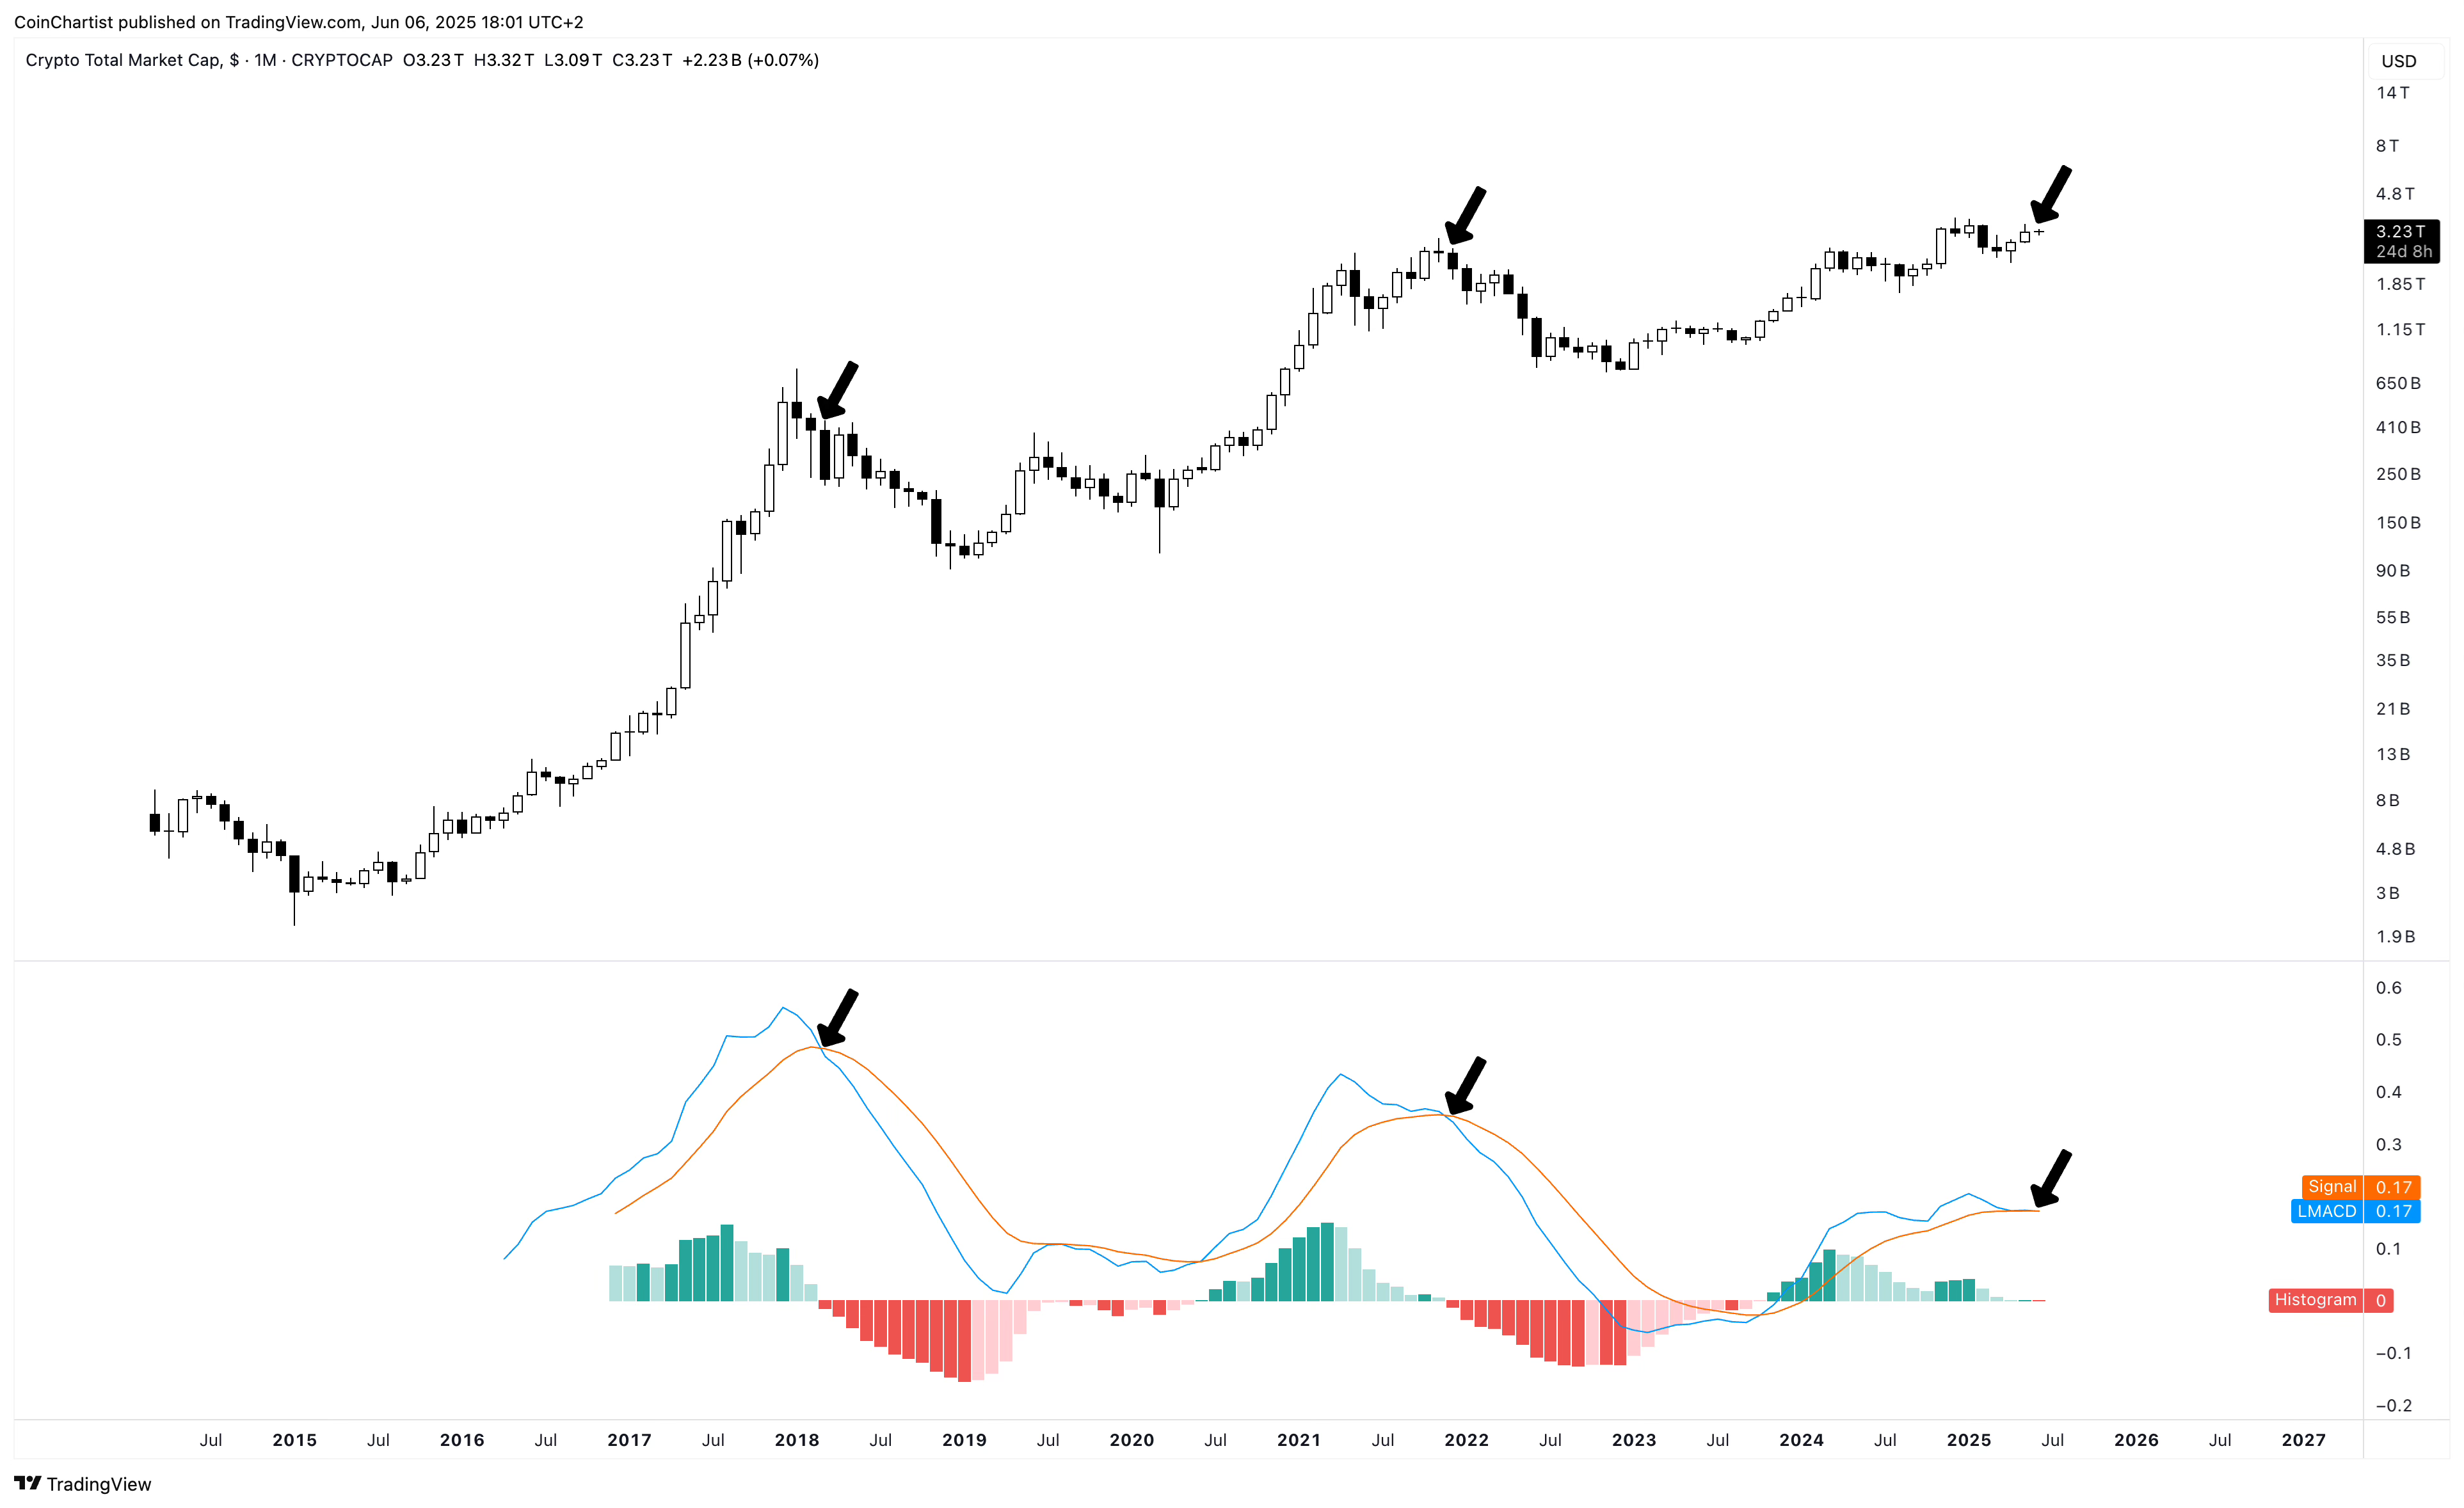
Because this issue is more focused on advising caution around altcoins, I am starting off with TOTAL — which represents the entire cryptocurrency market as a whole, BTC included. TOTAL opened June bearish on the LMACD. Momentum tends to persist — meaning that such crossovers tend to remain crossed for months, even years at a time in the same direction. These changes are notable. Momentum can turn back up at any point, but considering the current direction of momentum, turning back up with strength could take some time.
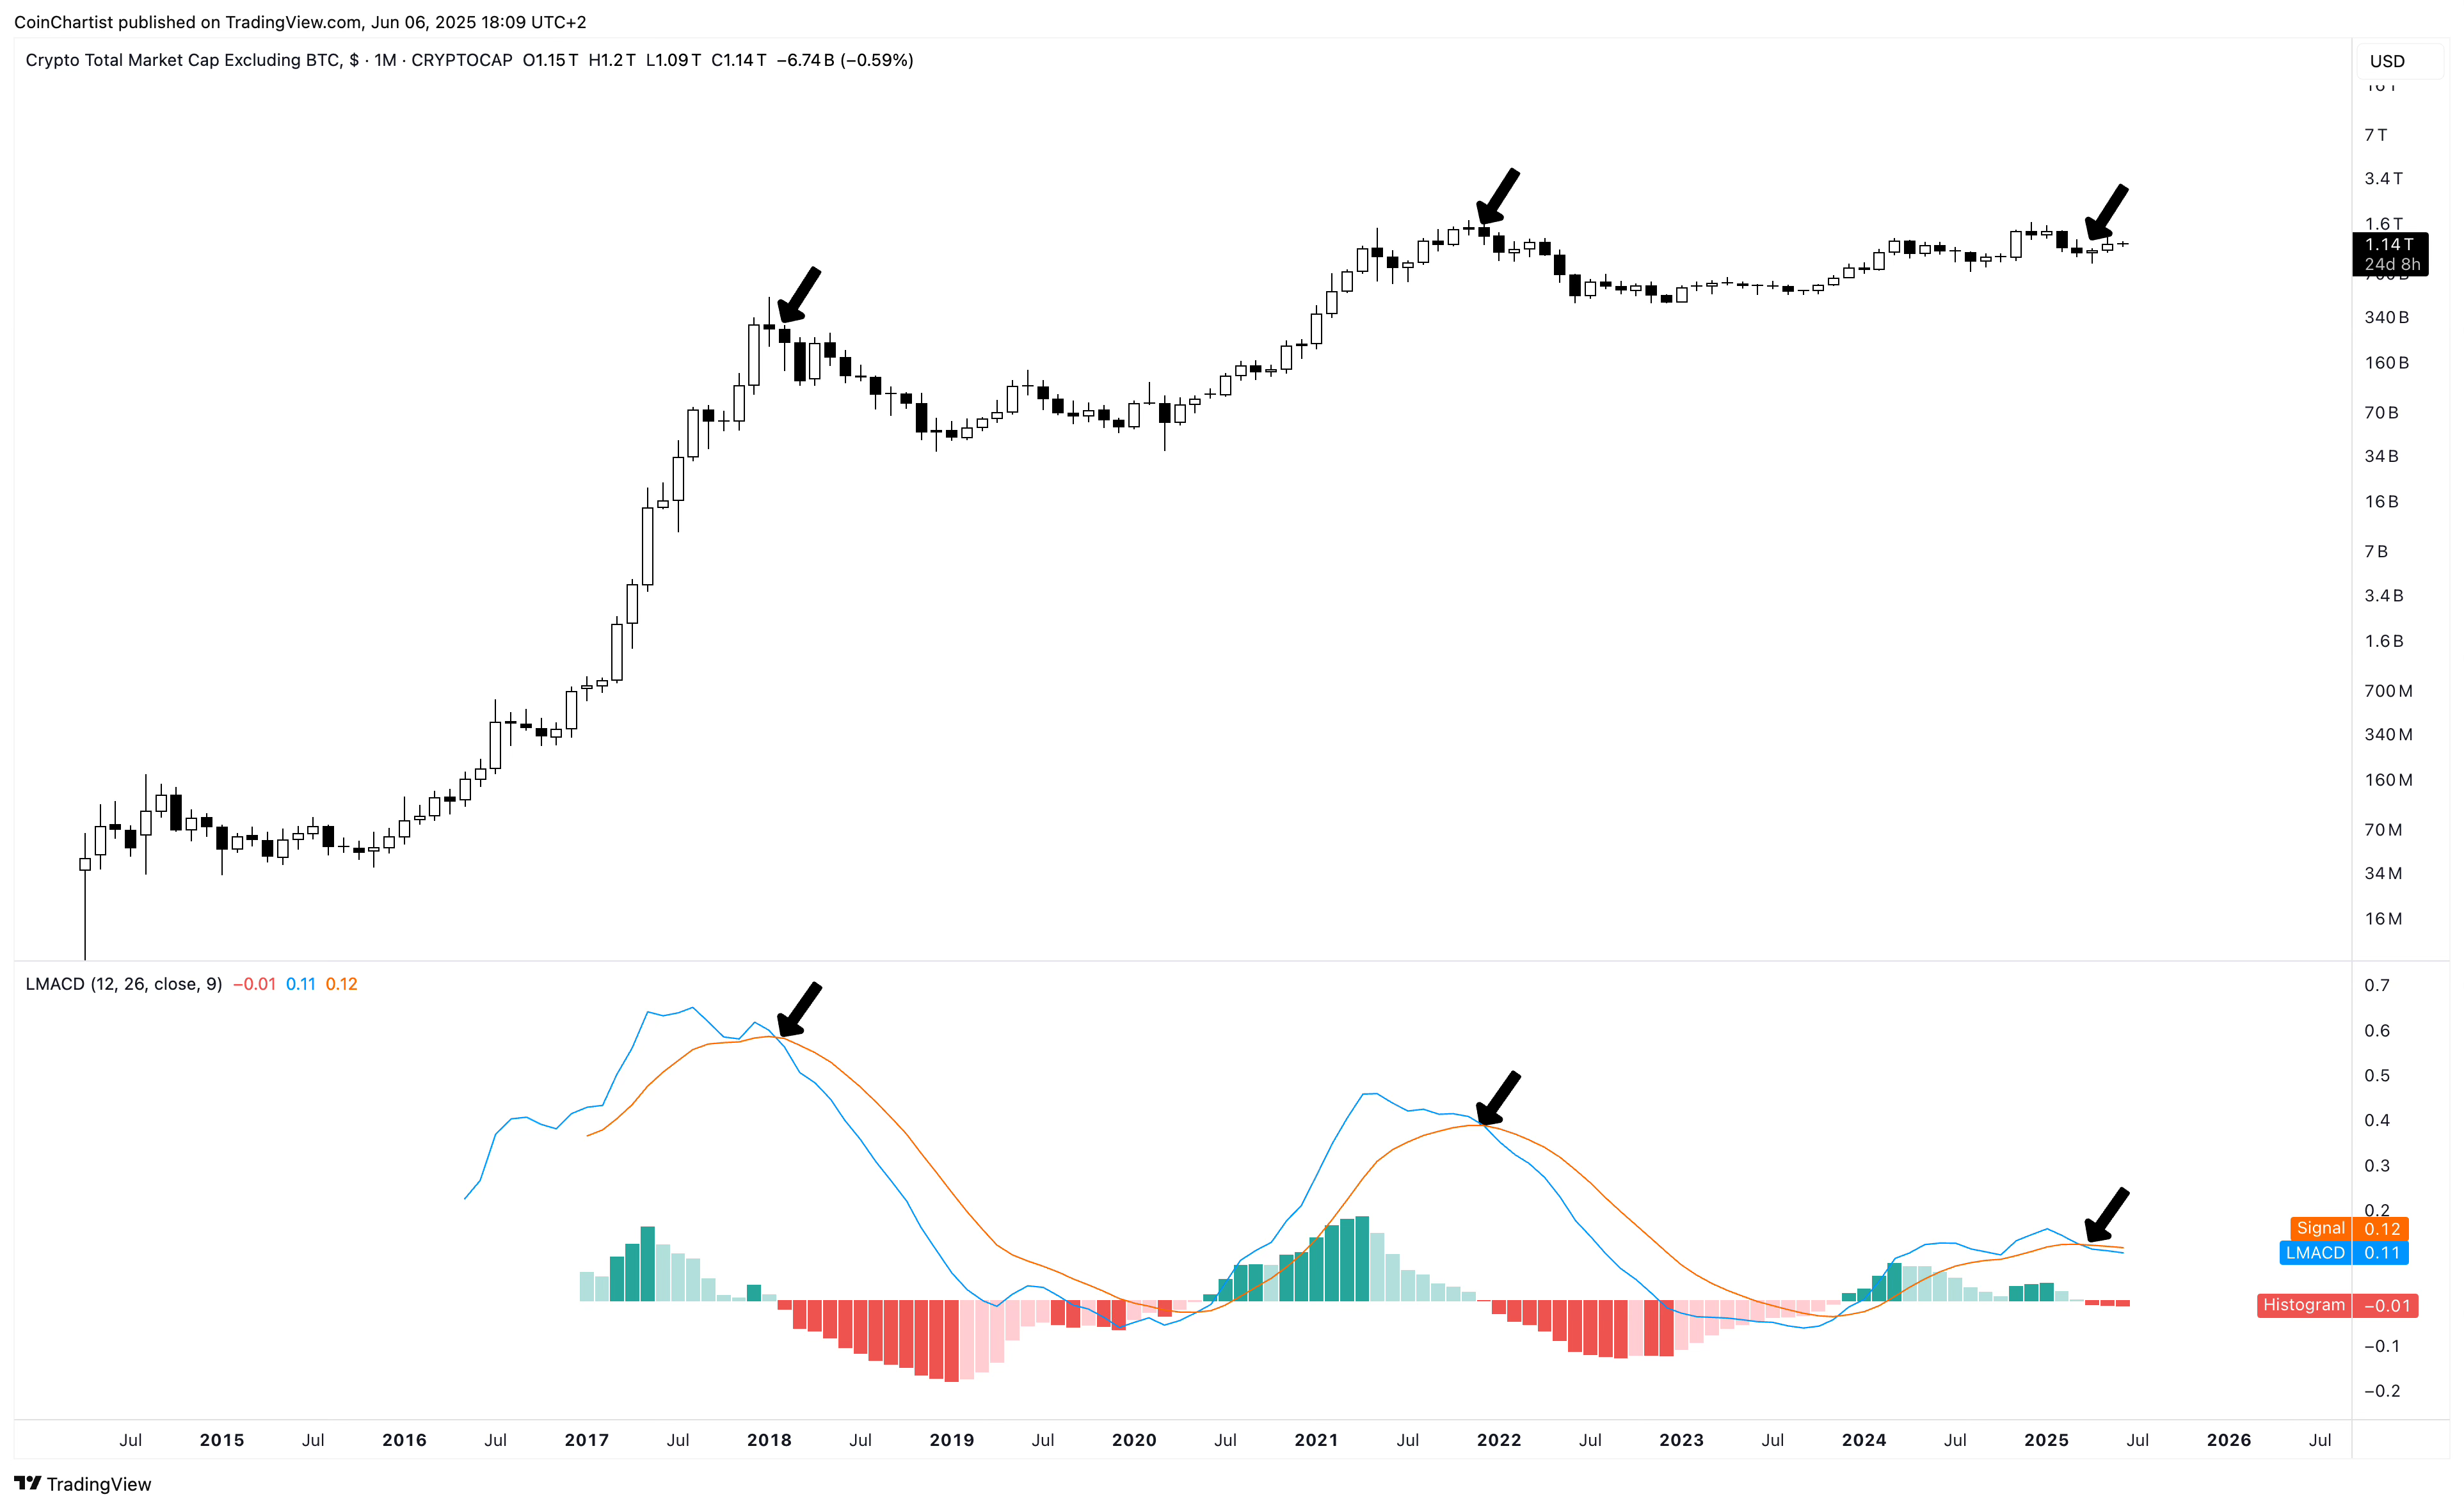
This chart is TOTAL2, which represents all altcoins and excludes BTC. Momentum here is much more bearish, with several confirmed dark red ticks on the histogram. In this example, momentum is pointed more down than sideways, which again, suggests that altcoins won’t simply blast off from here without seeing momentum start to turn back up.
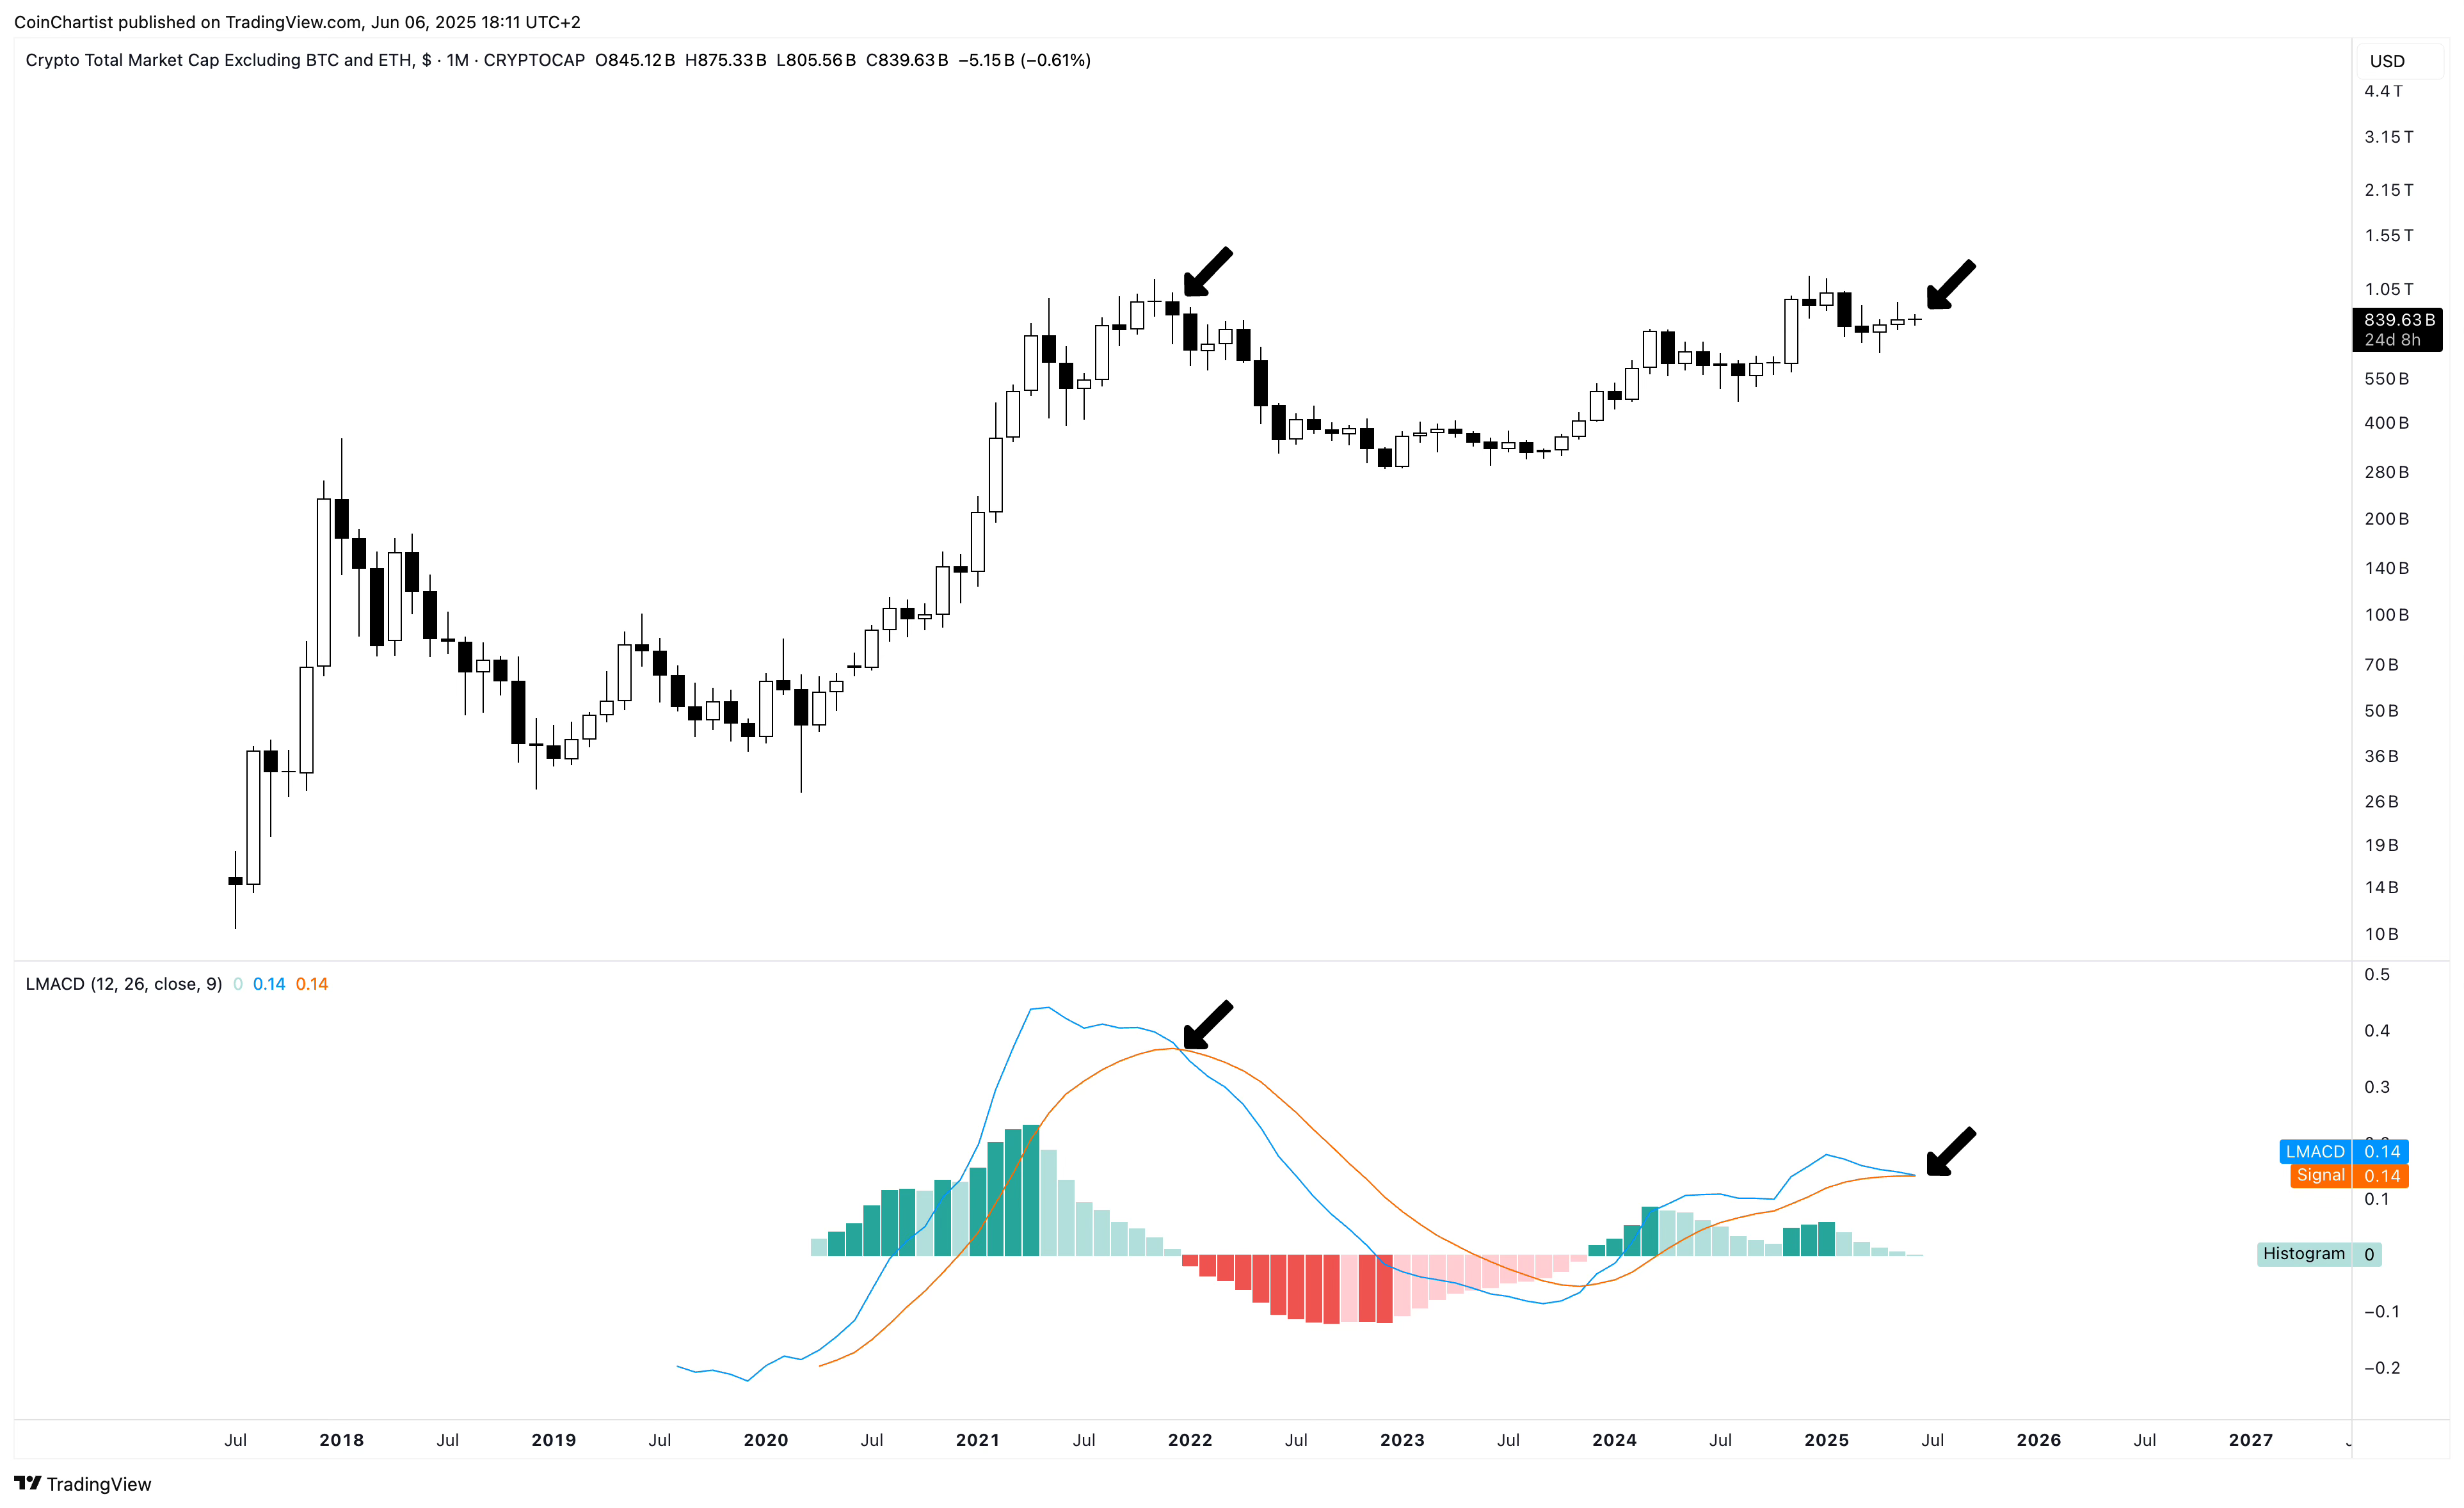
TOTAL3, which removes BTC and ETH from the equation, looks better than the first two indexes, highlighting how Ethereum was negatively influenced TOTAL and TOTAL2. TOTAL3 hasn’t crossed bearish yet, which could hint at this eventually turning upward. But even so, the sideways momentum should keep alts from taking off until toward the end of the summer the earliest, even if they do end up performing well later on.
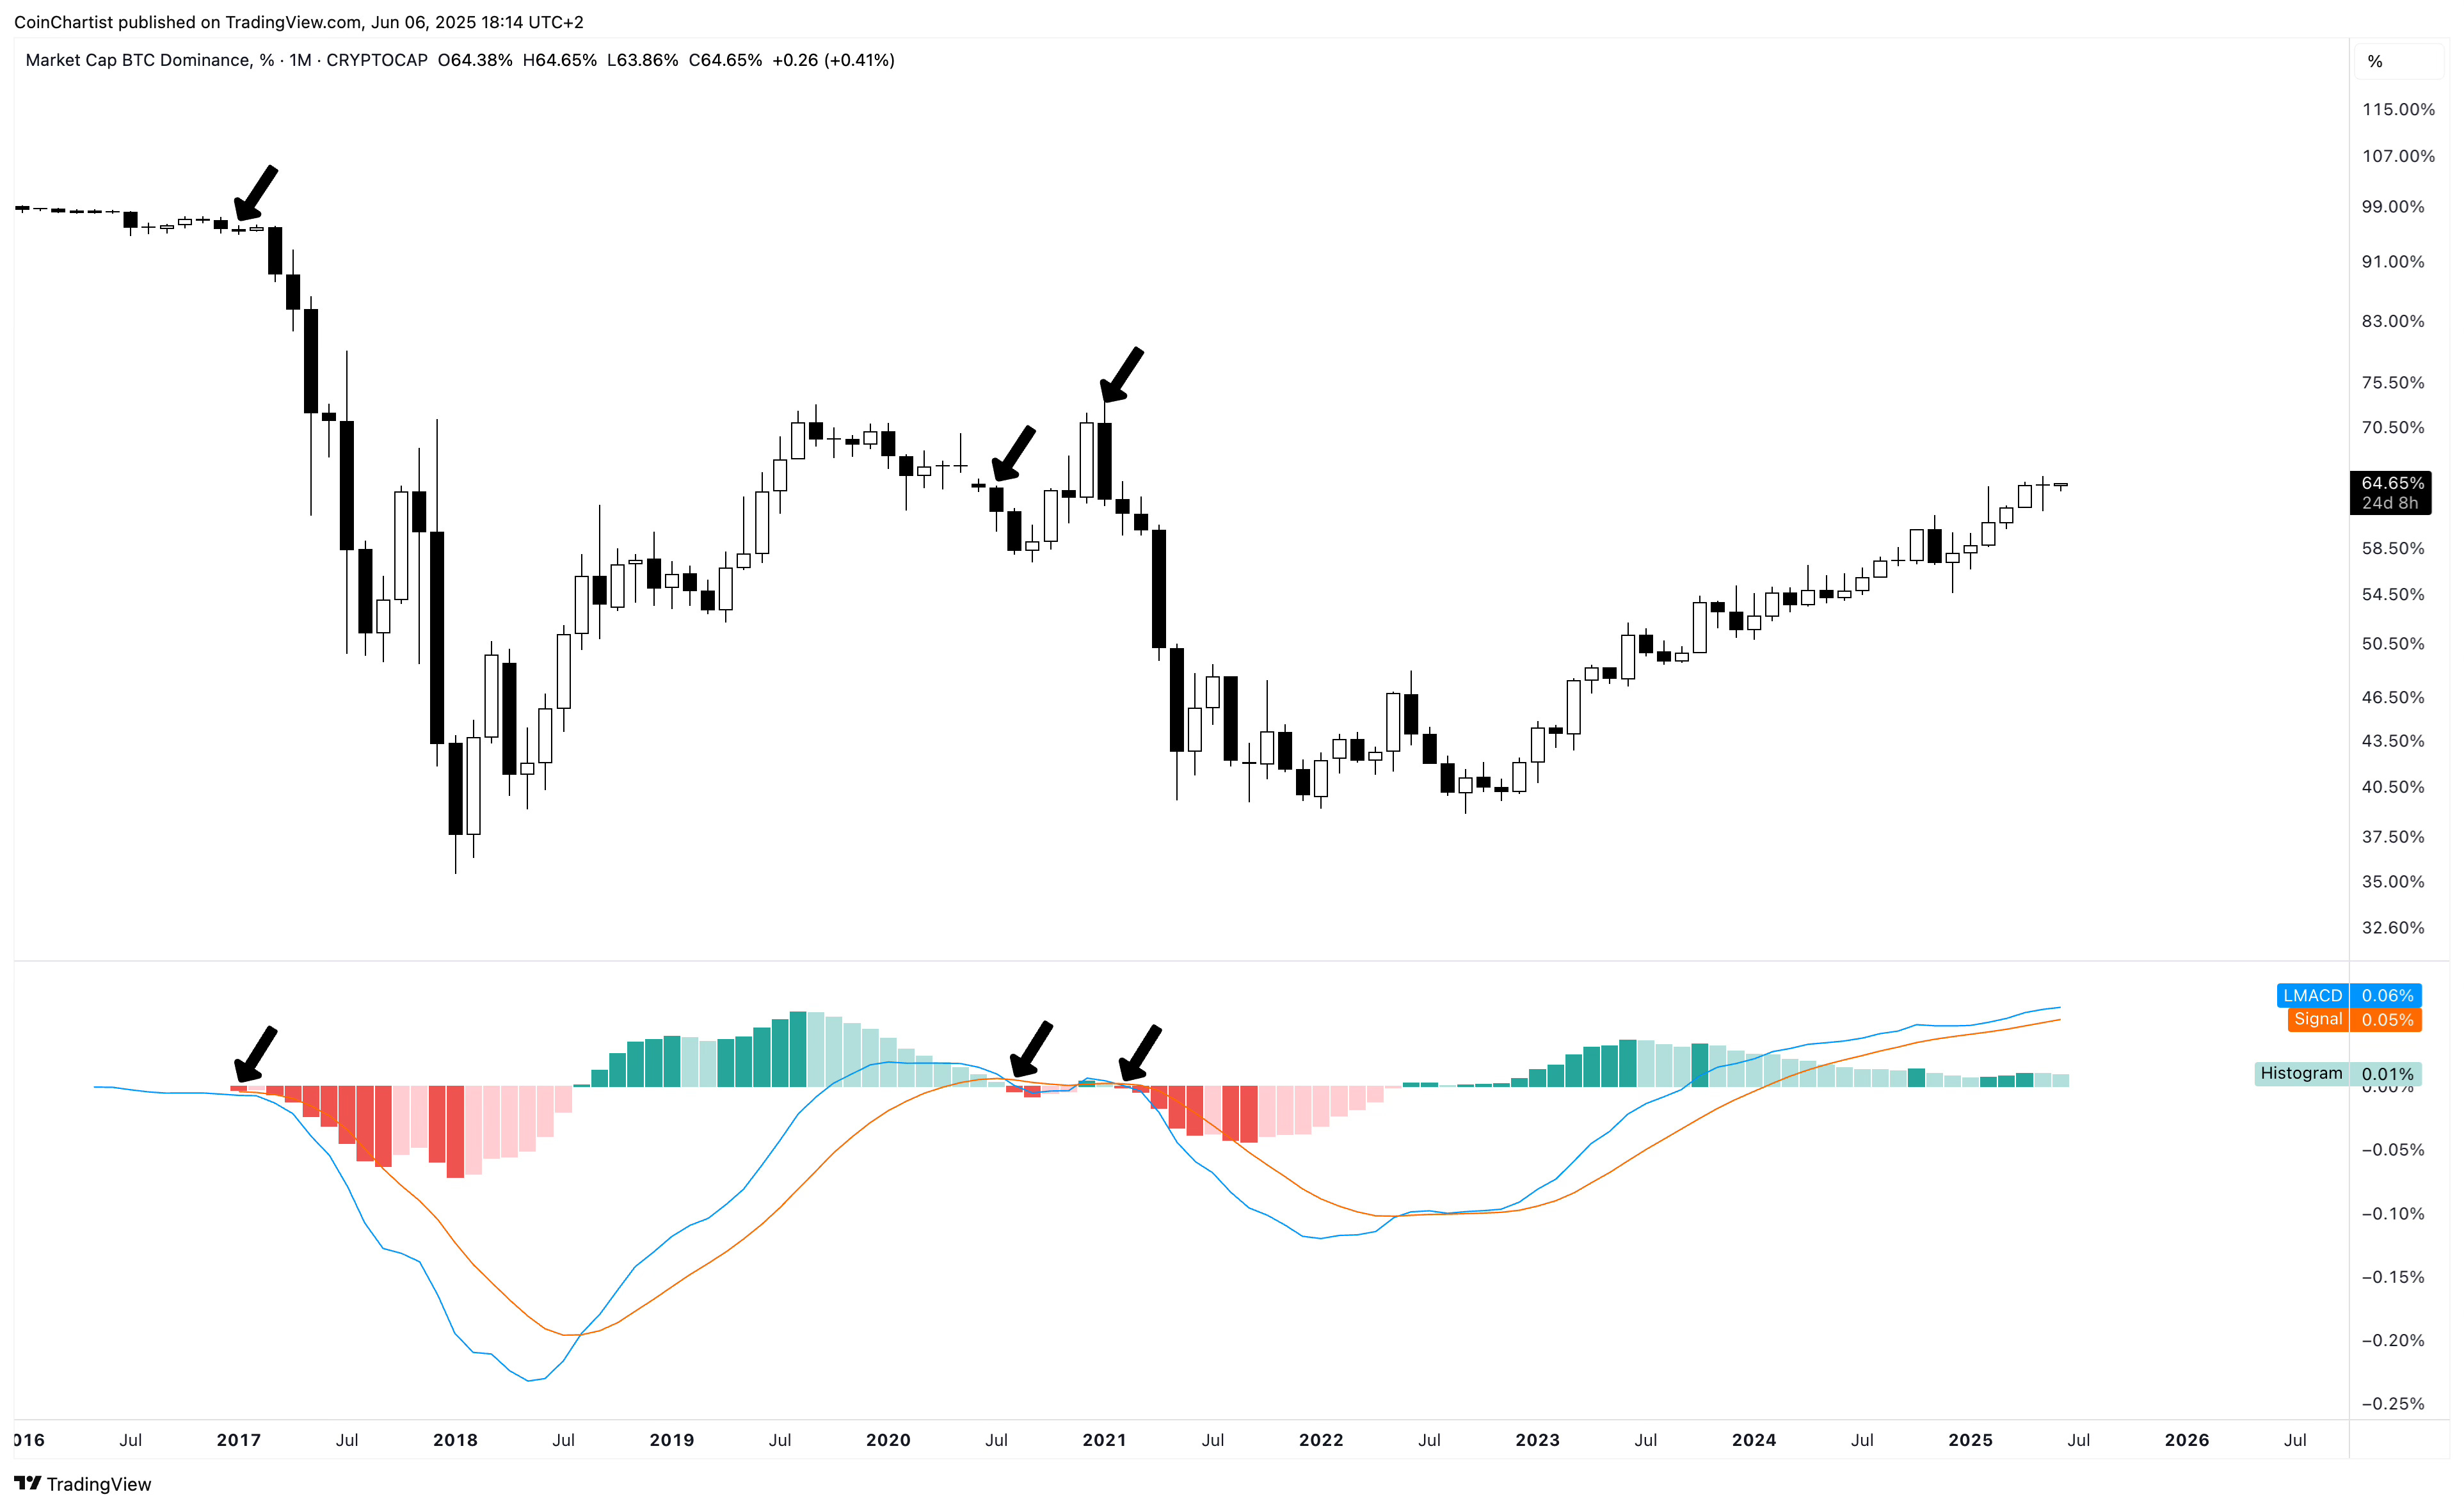
The chart that’s least at risk of crossing down is BTC.D representing Bitcoin Dominance. The LMACD is weakening, but nowhere as close to crossing down as the rest of the charts. Another dark green tick on the histogram at the end of June, and this could crank a lot higher. A full bearish crossover is needed before we consider an altcoin season.
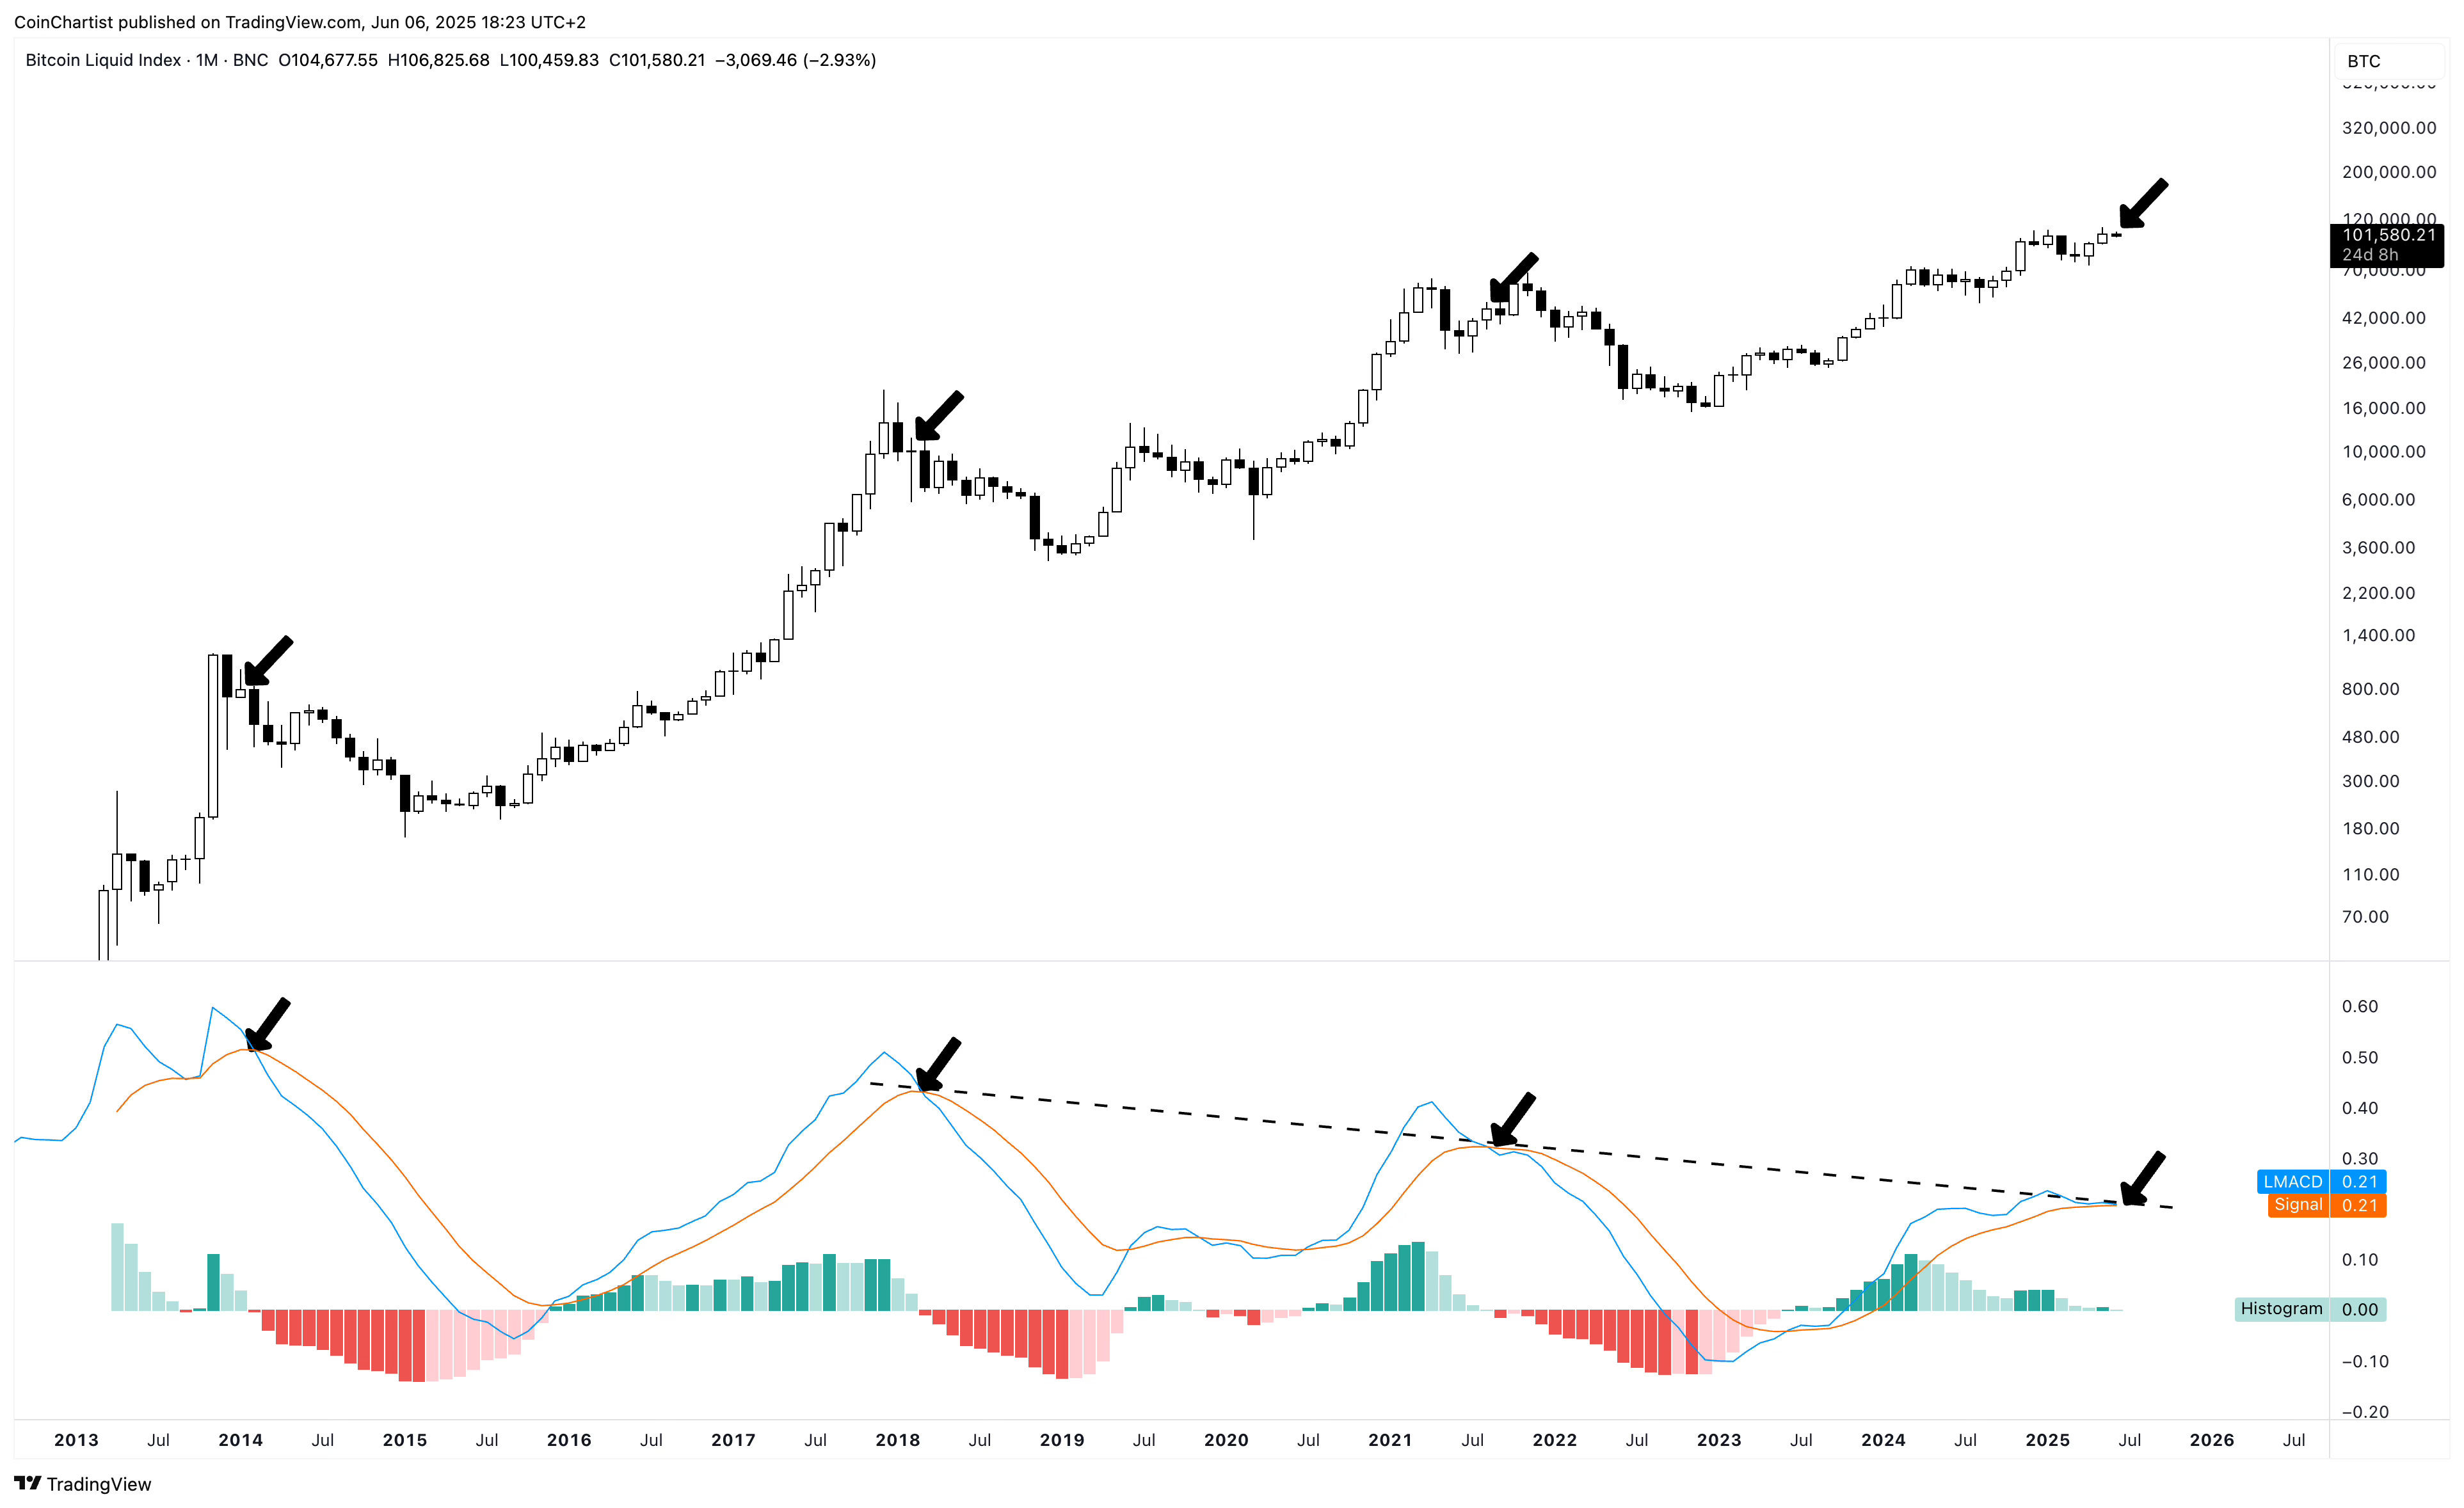
Finally, we have BTCUSD which once again is at risk of crossing bearish on the LMACD. Bulls have fought off this crossover for months now, but because — as I have been stating — momentum persists, the toppling momentum hasn’t truly been stopped yet. Bulls can still diverge this up fully, but it will take a huge move up or more time spent mostly sideways before it happens. The tide of momentum needs to turn back up. This dashed resistance trend line has stopped the LMACD line (orange MA) during past cycles and leaves little room left for upside. The trend could also break to the upside at some point.
Peak? Or Just Weak?
Both the LMACD and RSI are momentum-measuring technical indicators. The LMACD better visualizes shifts in momentum, while the RSI tells us when momentum is at its strongest relative to past movements. The following charts show weakness. This weakness can be interpreted two ways. The first interpretation is that rallies are getting weaker over time, and crypto might have peaked. The second interpretation is that the true rally hasn’t even happened yet and this weakness is just part of the build up to the bigger rally.
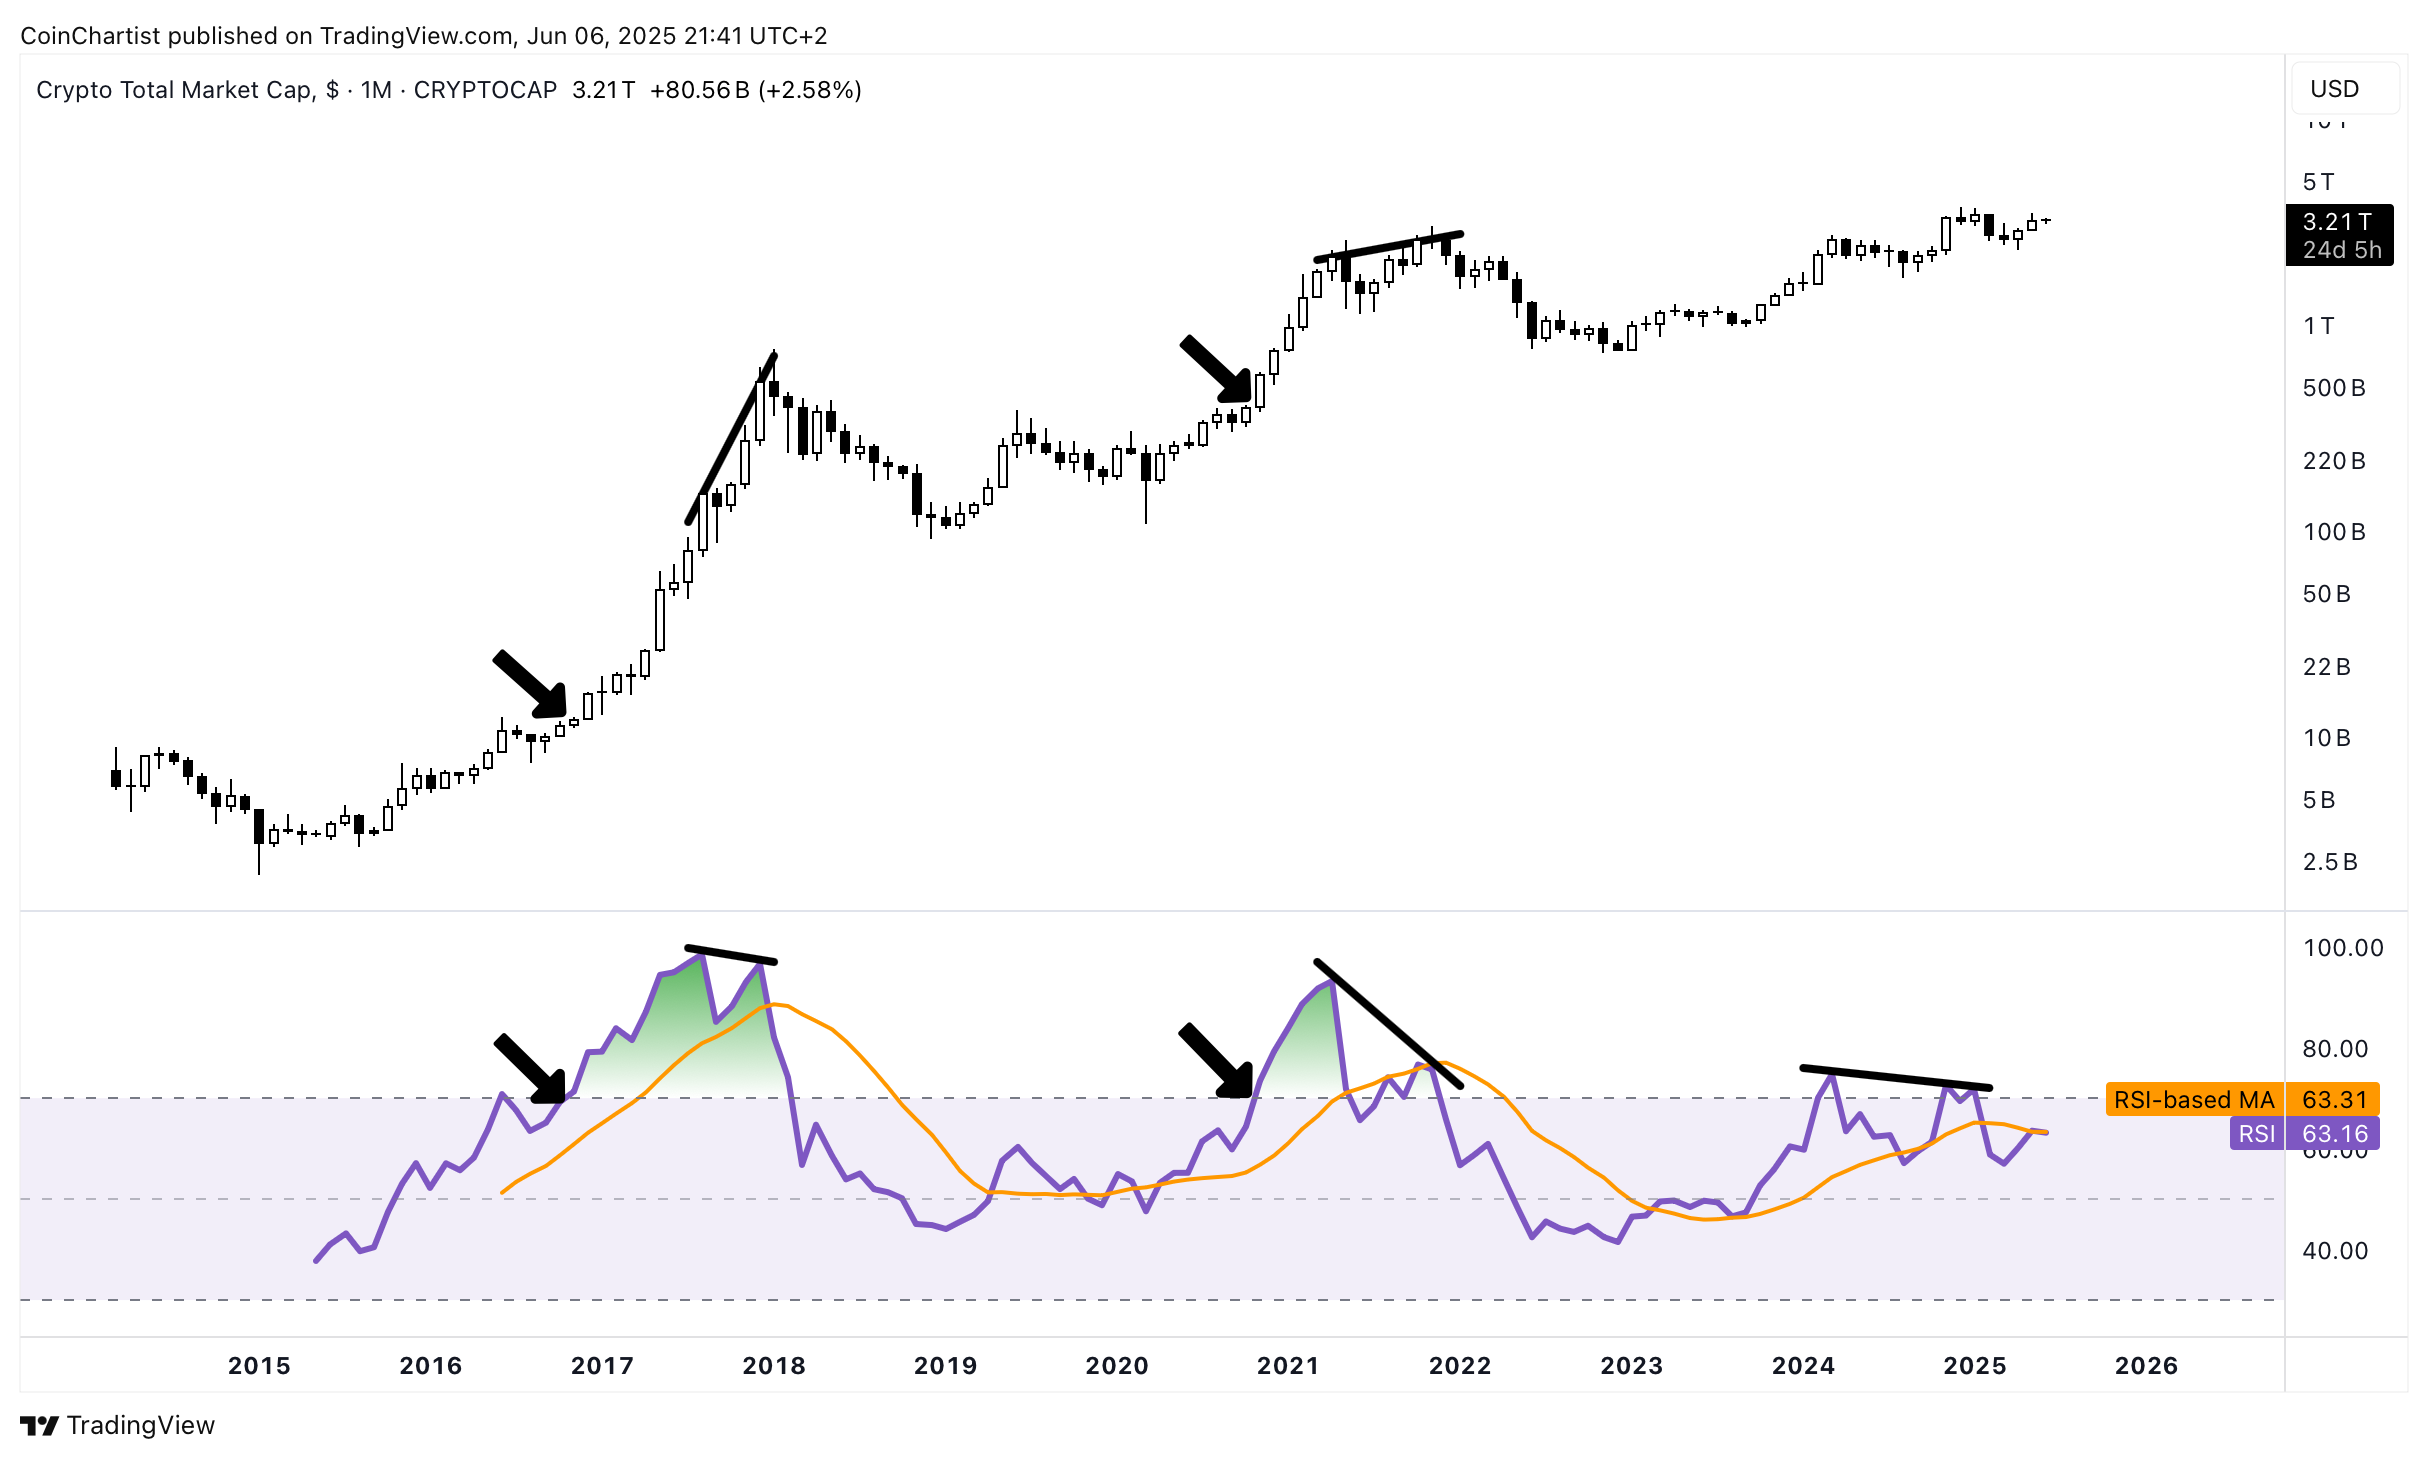
Starting with TOTAL, a sustained move above 70 on the RSI on the monthly timeframe always resulted in the strongest rallies. During this cycle, TOTAL made two decent attempts to get above 70, but barely did and within a month or two, was sent back below 70. This move below 70 typical starts a bear market, but it hasn’t this time around. Also of note, the RSI-based Moving Average is turning down, which has always happened as the market turned bearish. The same RSI-based MA never made it above 70, which could mean we just have more time to wait. There is a growing bearish divergence across the RSI peaks, which is also congruent with past cyclical tops.
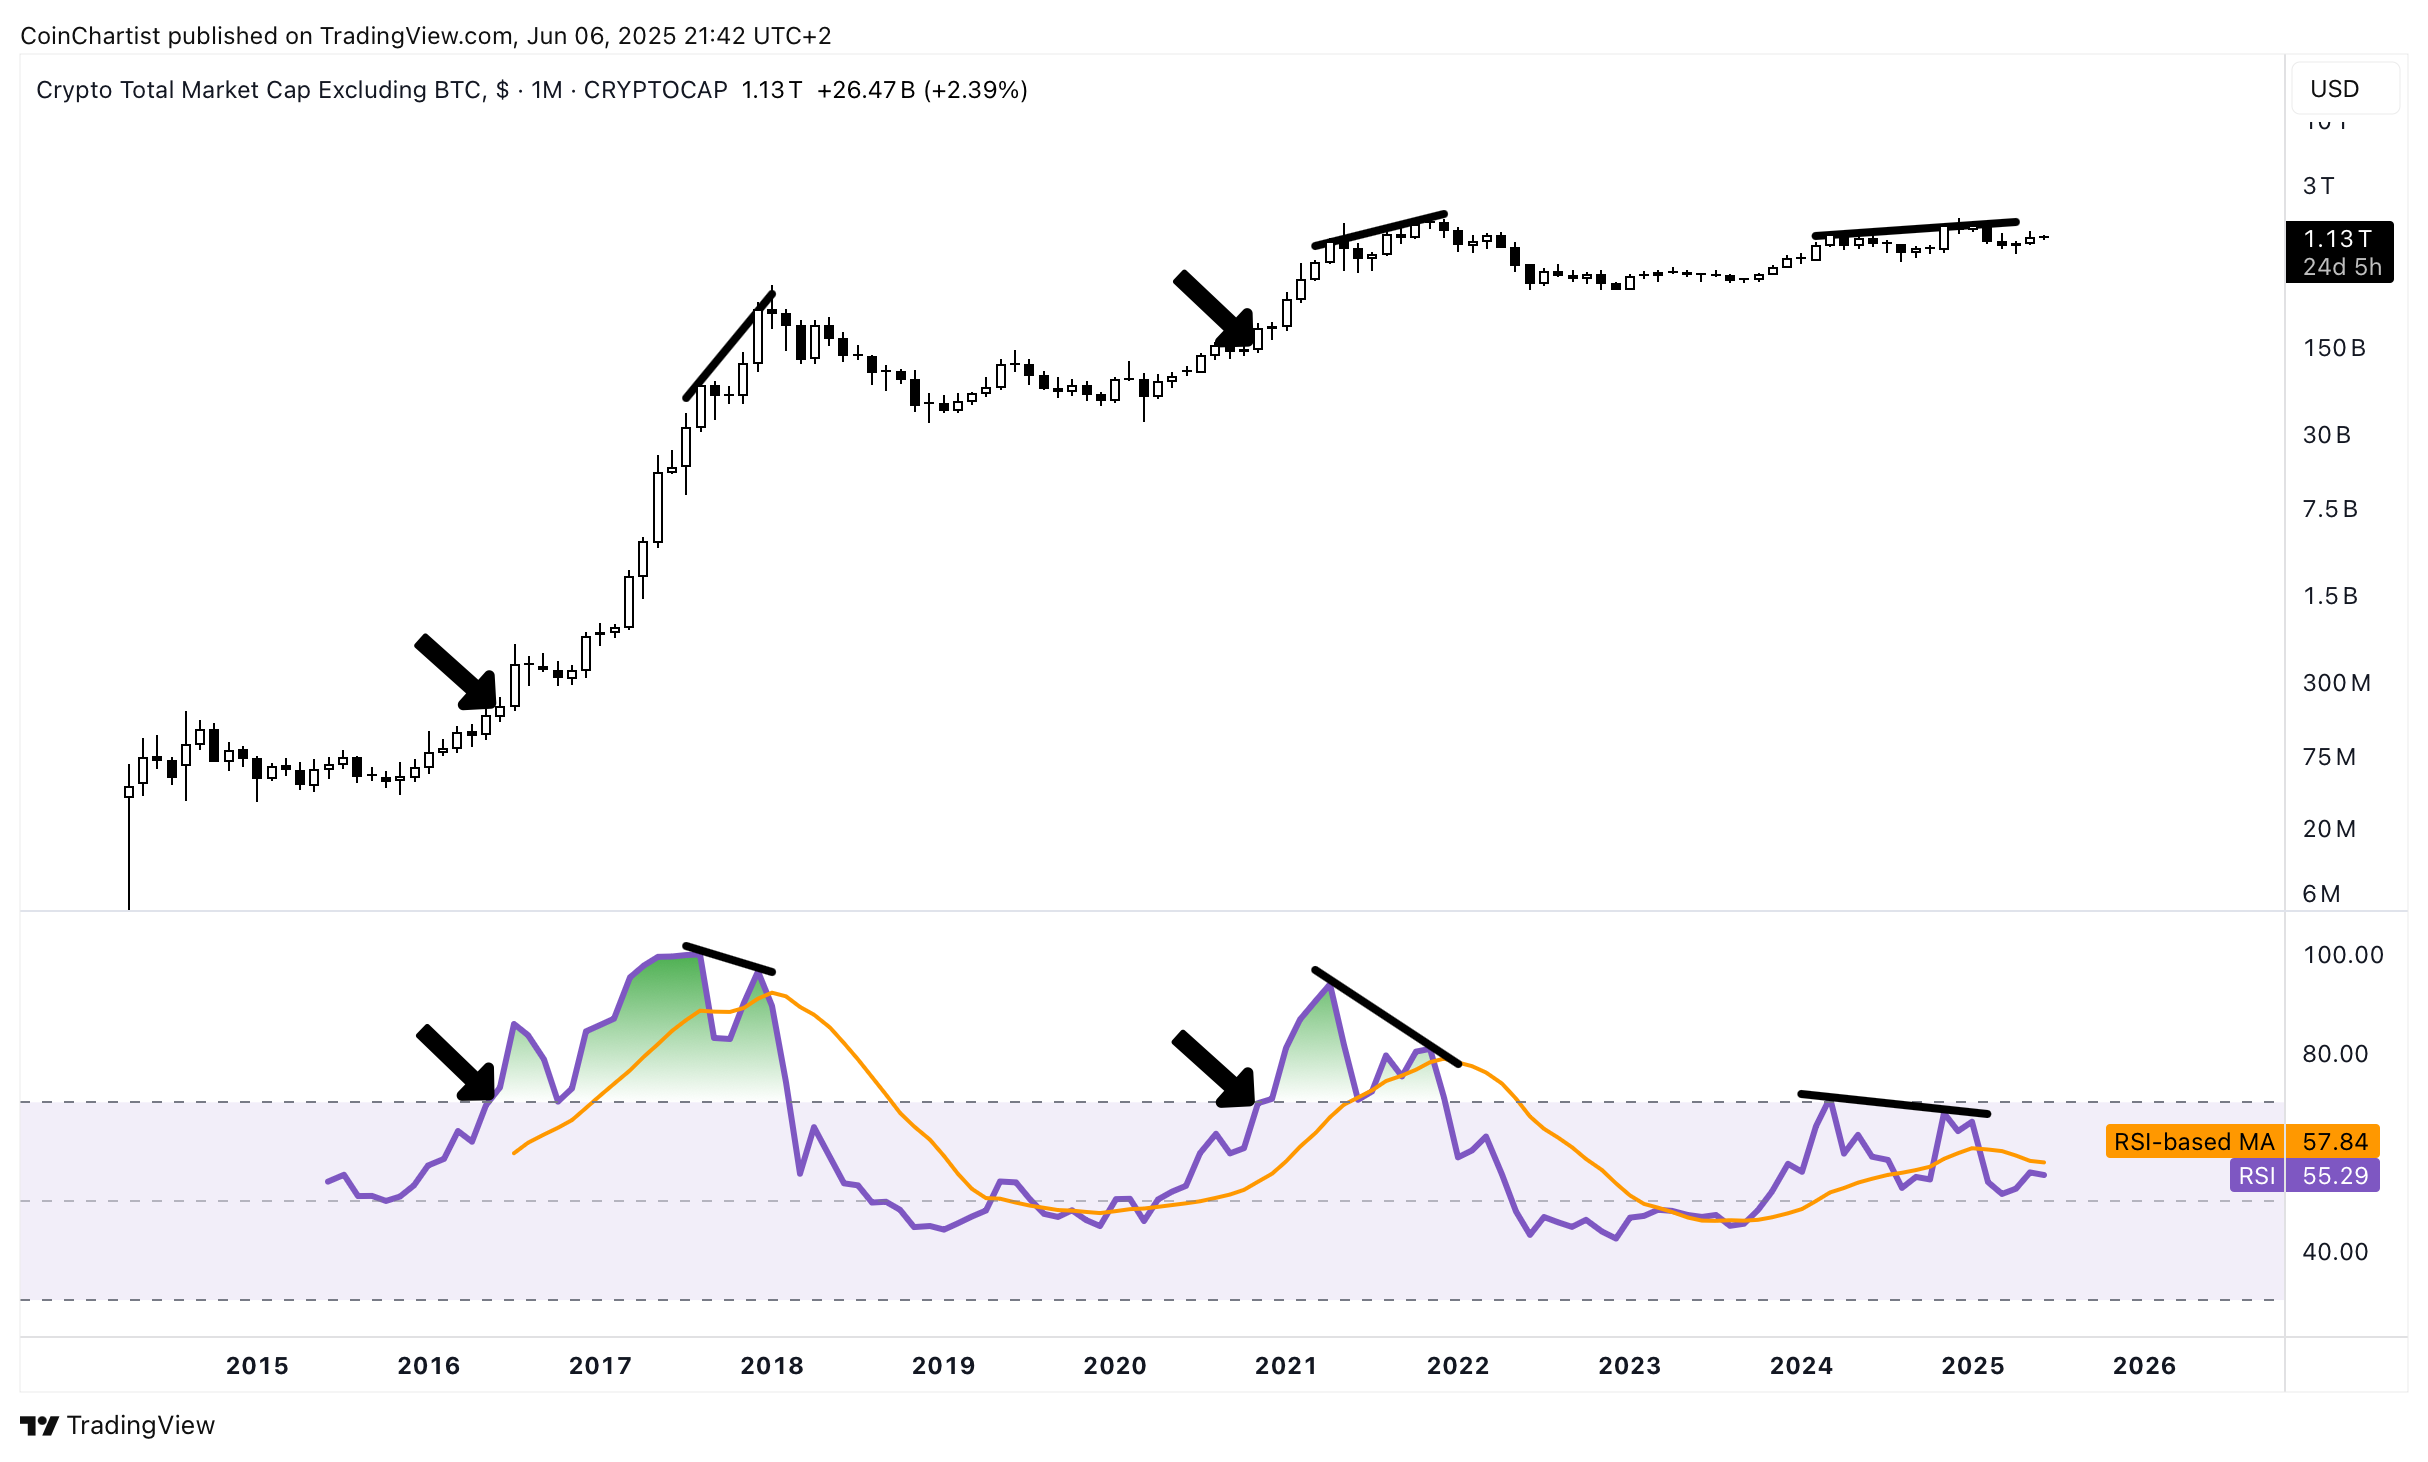
By removing BTC, we can see that in TOTAL2, the RSI was rejected from above 70 at the first attempt and then never made it above on the second try. The same signals are true about TOTAL2 as TOTAL, pertaining to the bearish divergences, and RSI-based Moving Average turning down.
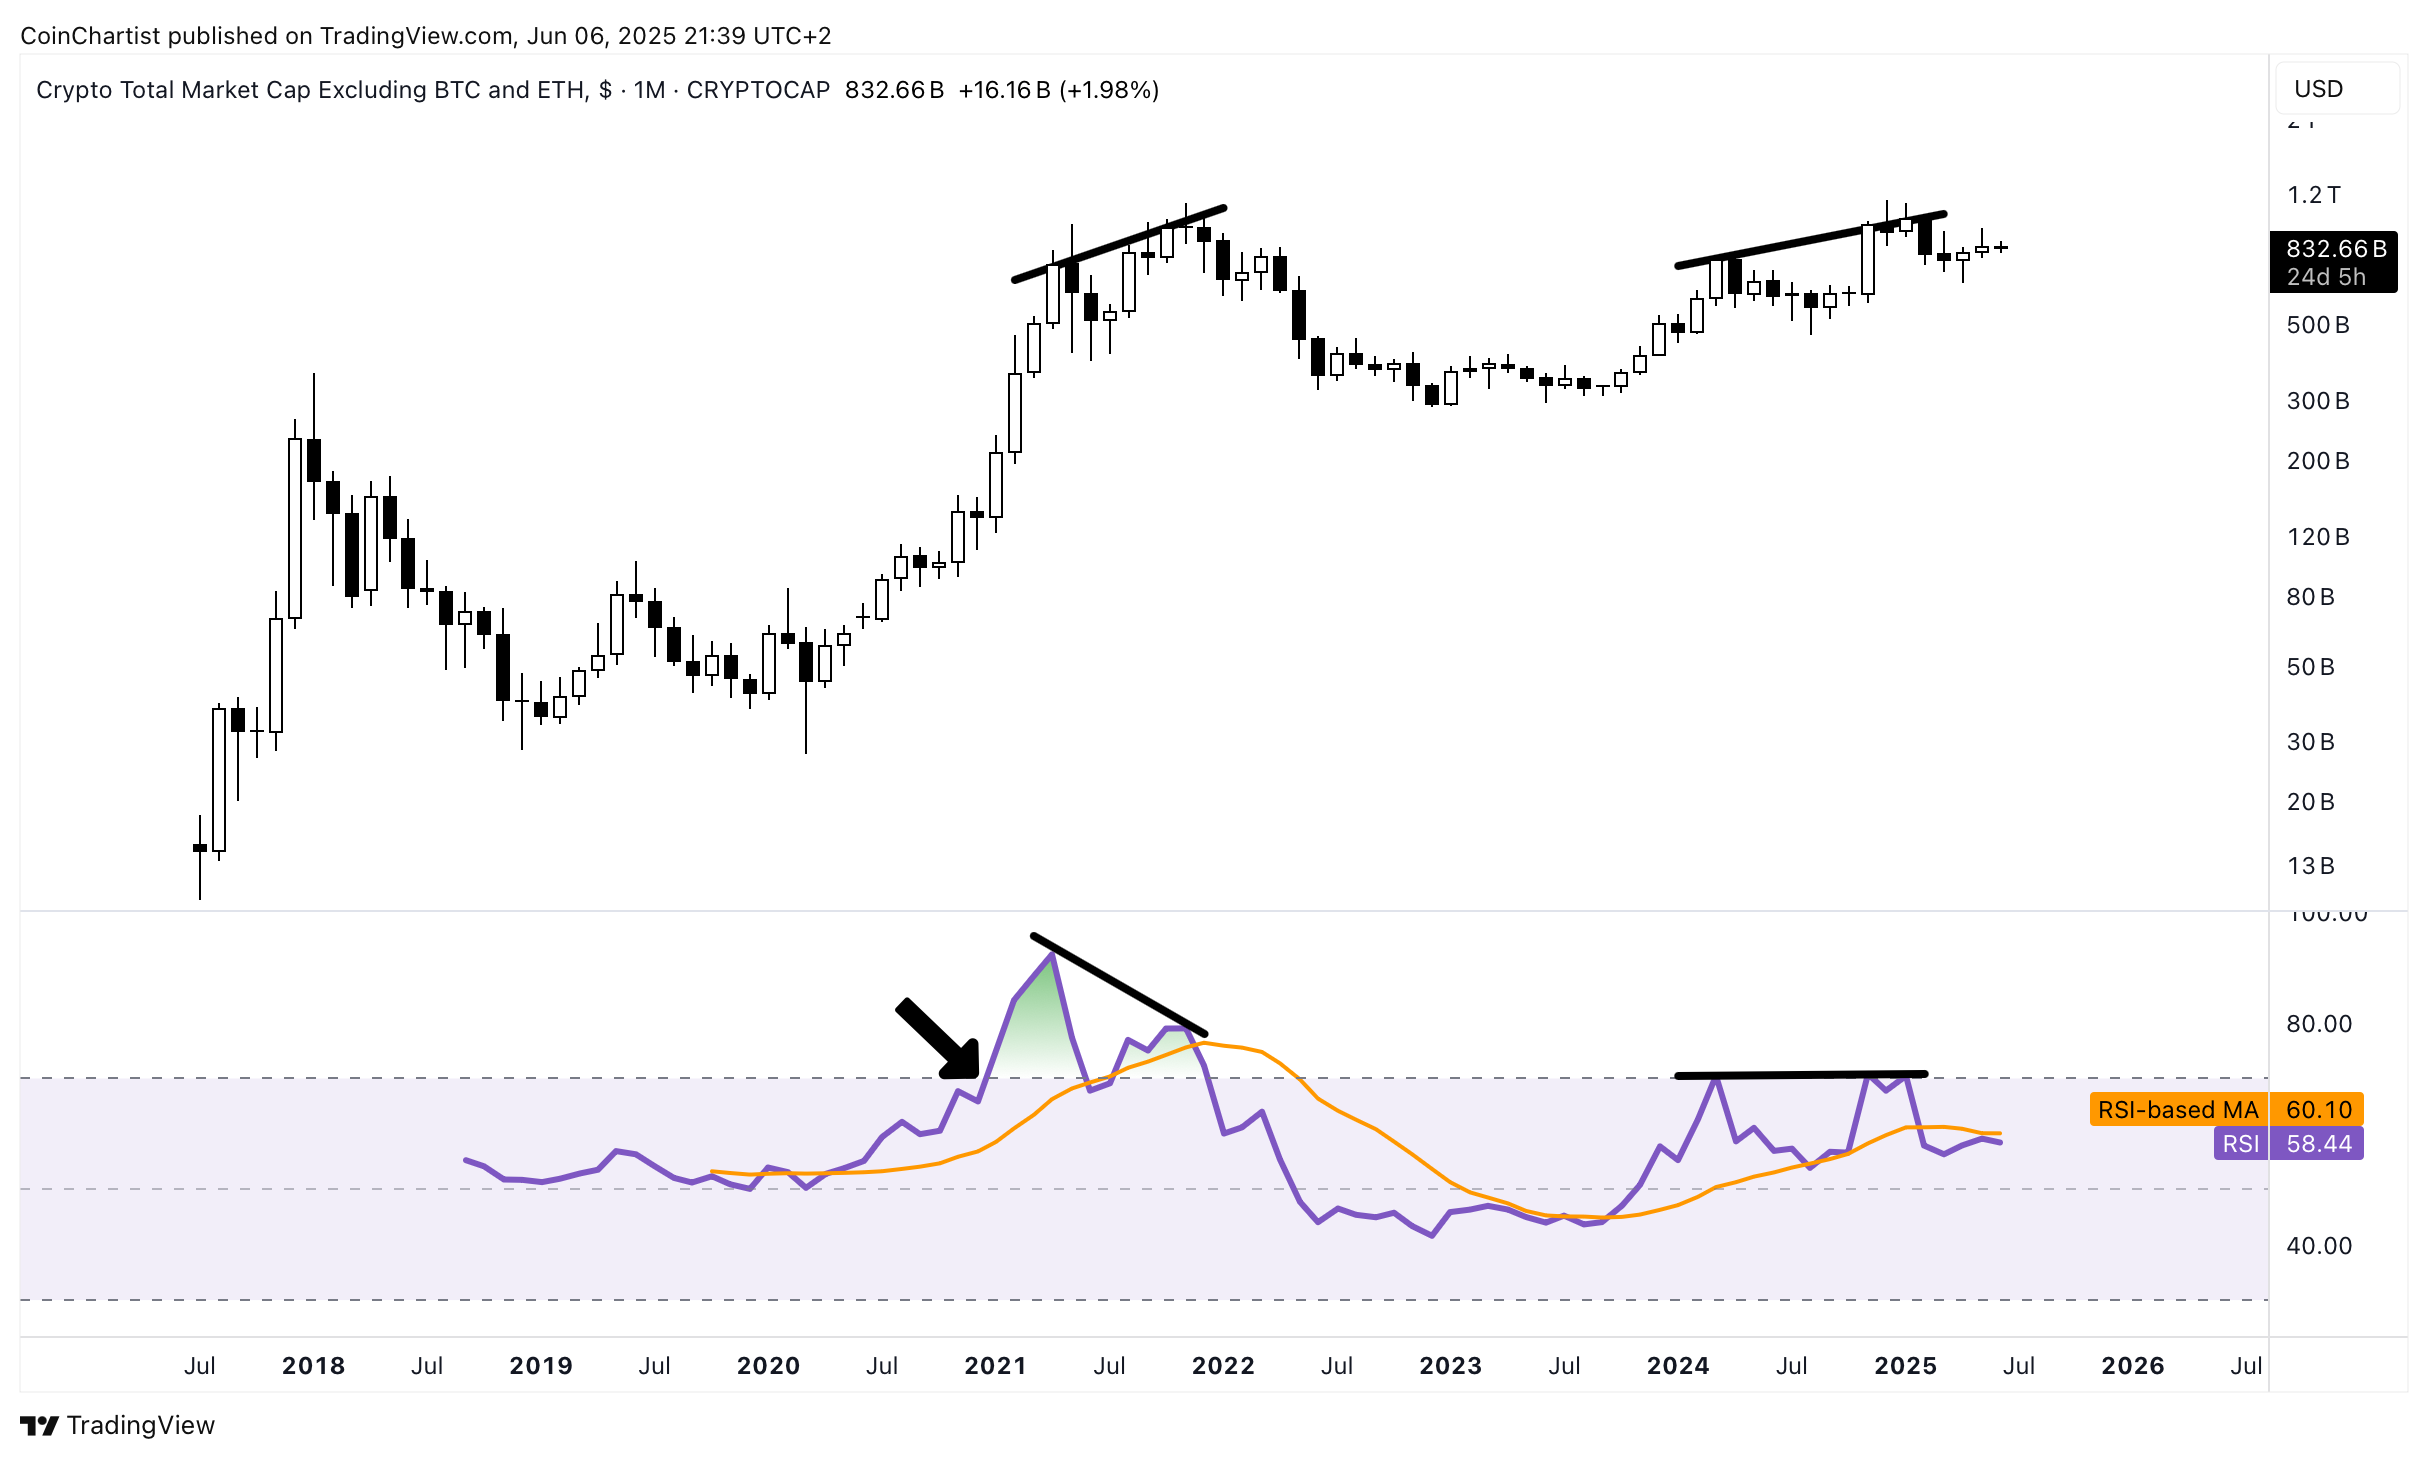
TOTAL3 looks the weakest out of all charts, with the RSI not making it above 70 on the RSI since the last altcoin season in 2021.
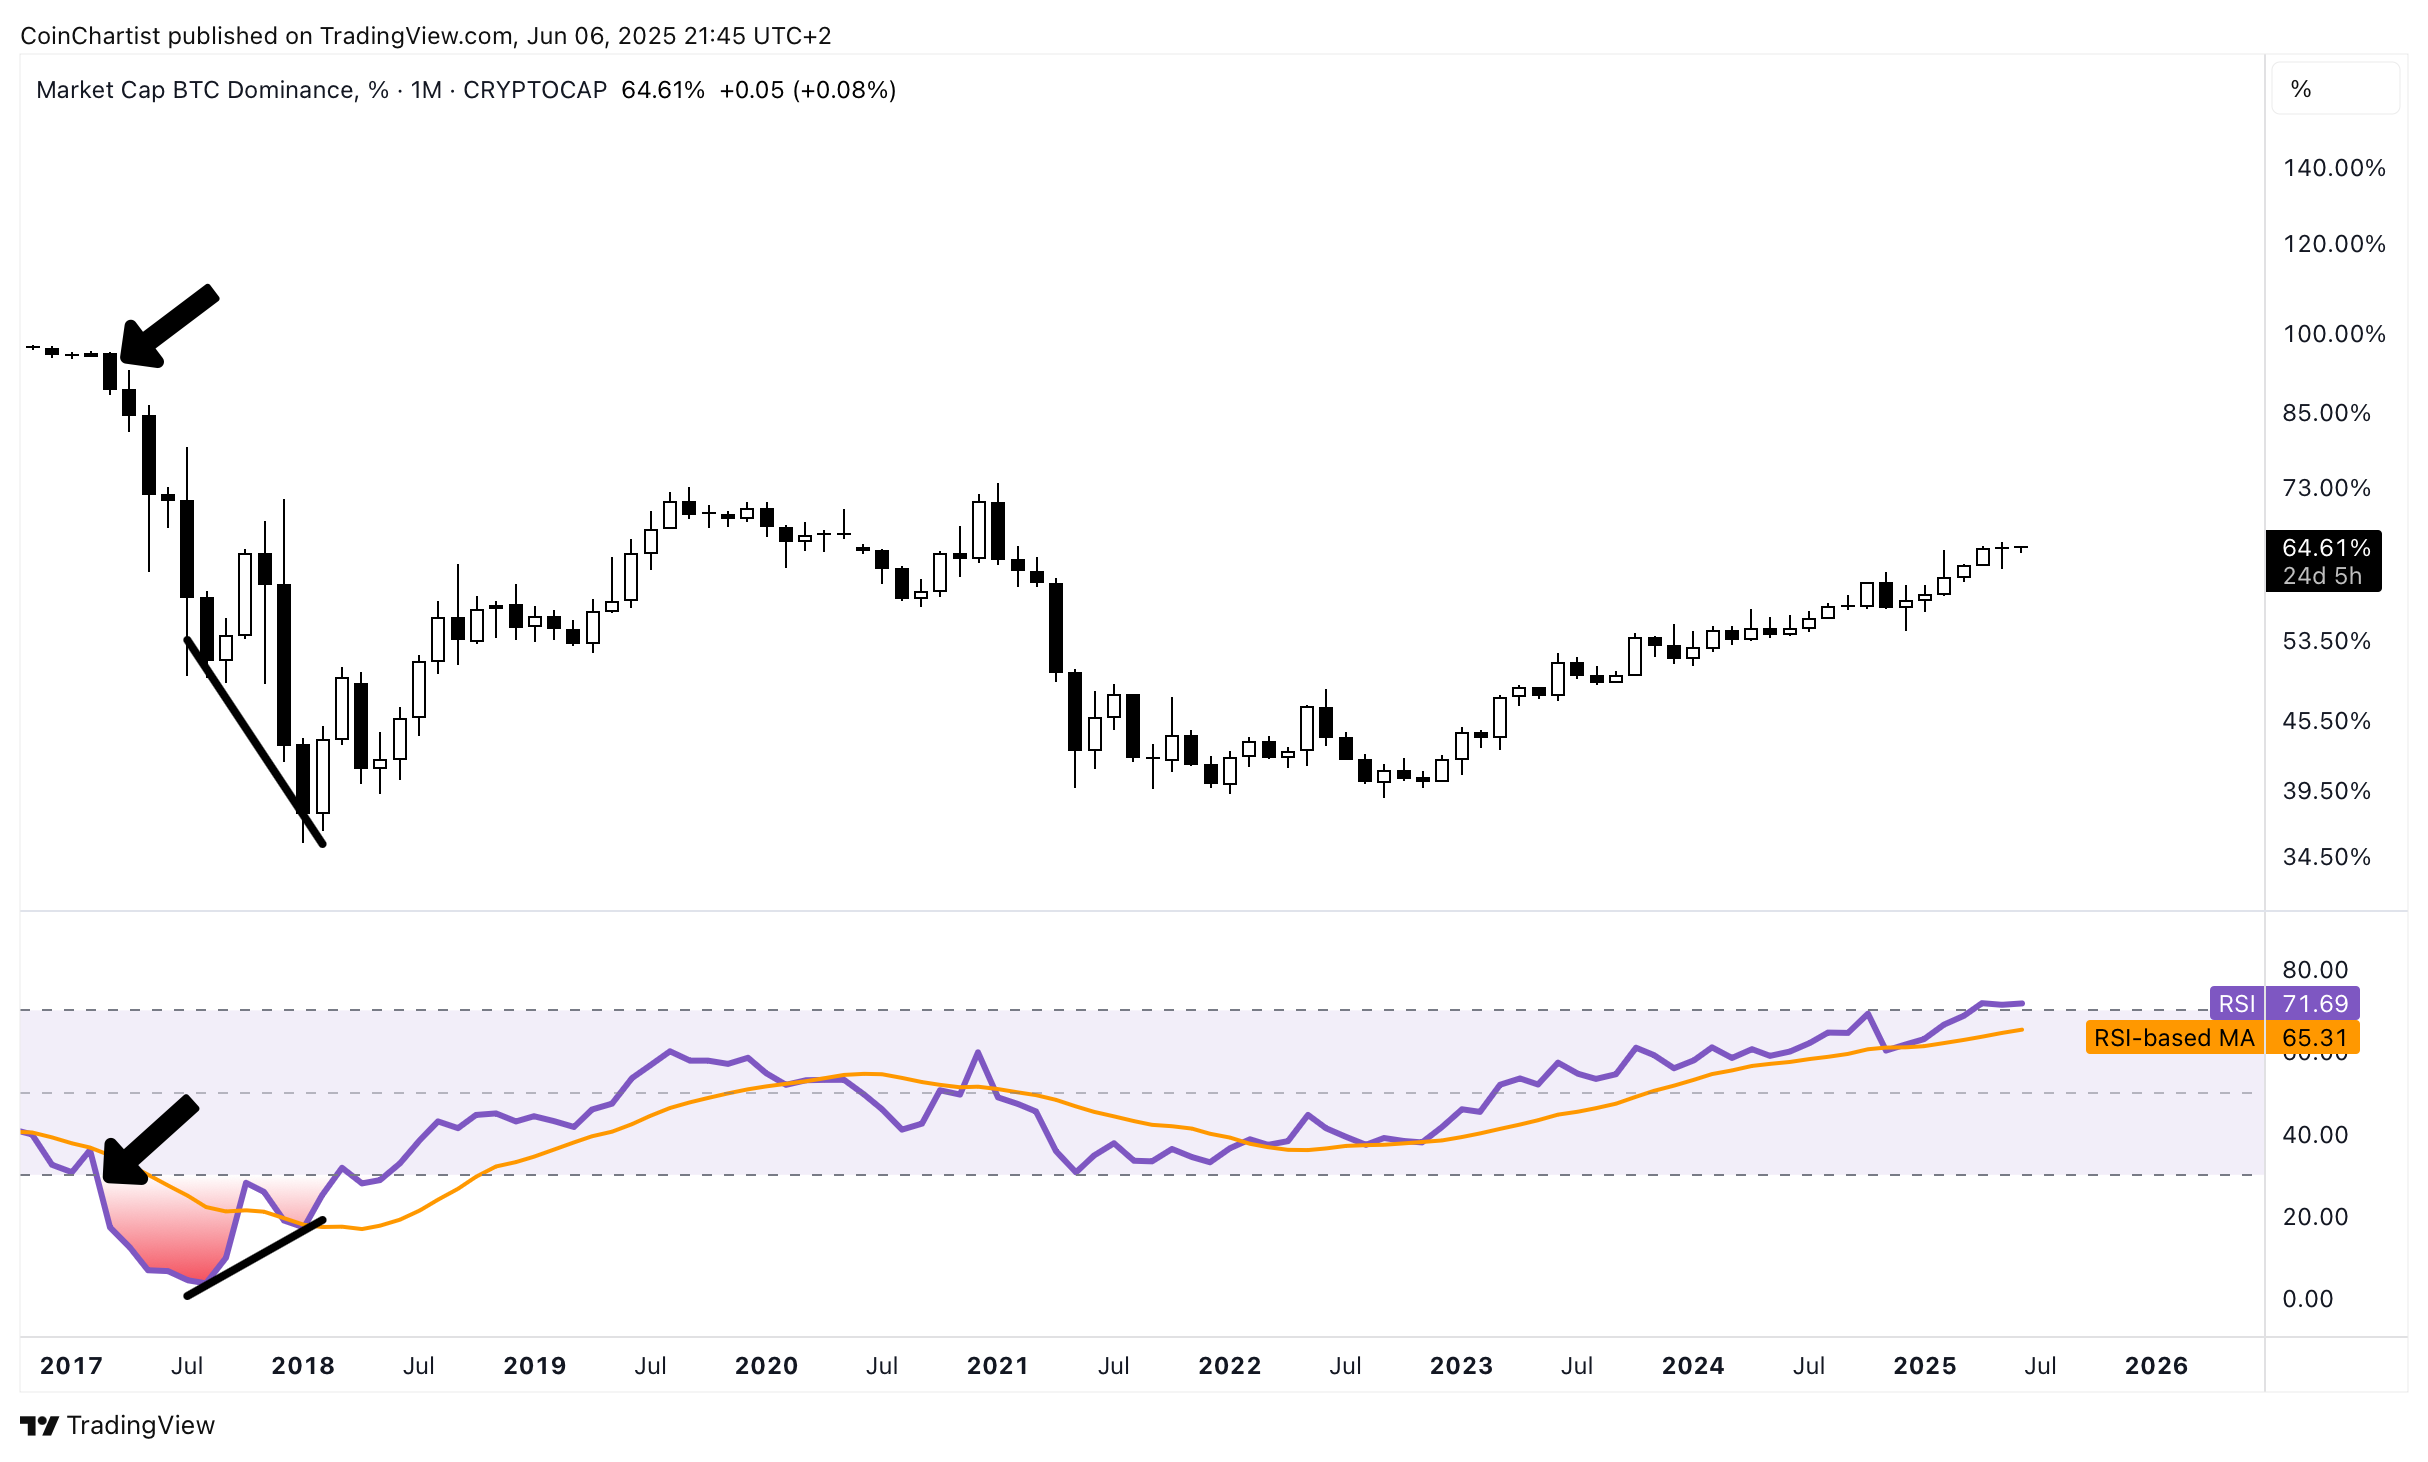
BTC.D is admittedly starting to show some signs of trend exhaustion, but that doesn’t mean it is done just yet (though it could be). The monthly RSI held above 70, which as you have seen in other charts is a trigger for the most bullish and strongest price action in any cycle. The BTC.D chart shows this happened in inverse, where the largest altcoin season ever happened when the RSI fell below 30 and stayed there. It wasn’t until there was a bullish divergence forming until the actual bottom was in. I point this out, because it might be necessary for BTC.D to form a bearish divergence on the monthly RSI above 70 before an actual reversal into altcoin season.
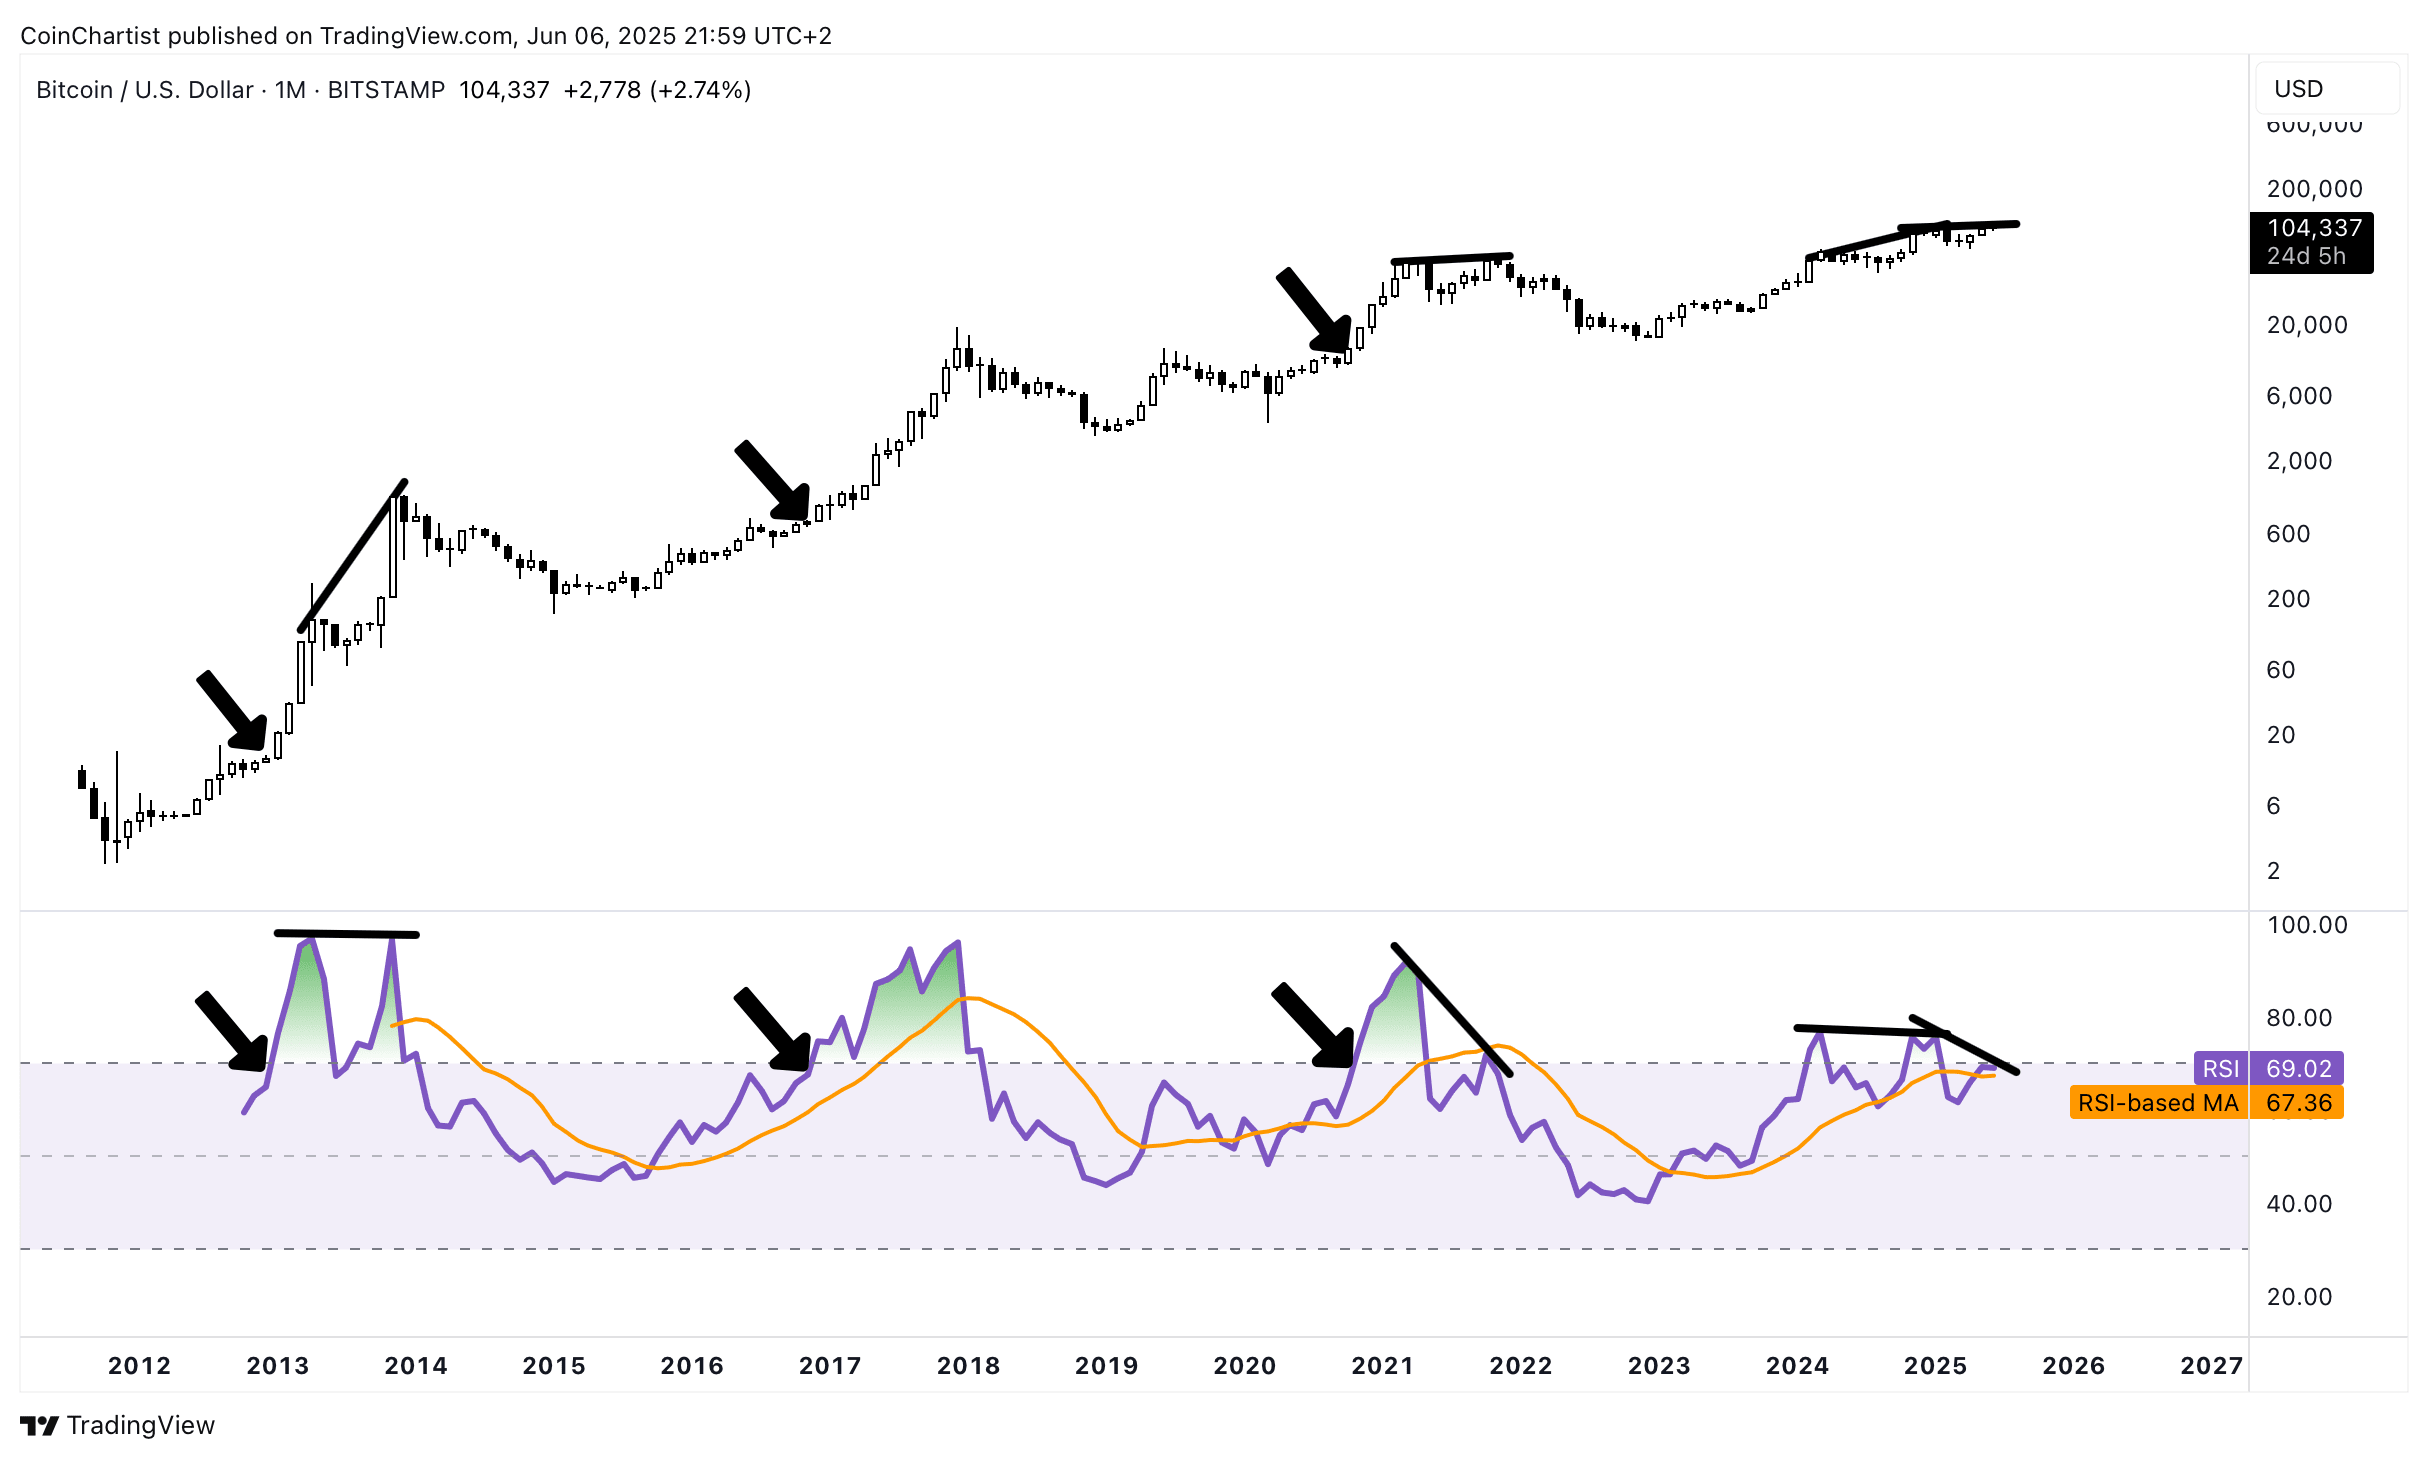
Bitcoin’s RSI is very different, showing larger pushes above 70 on the RSI in 2024 and 2025. The RSI made it above 70 last month but couldn’t close above the key level. The RSI-based Moving Average is also starting to turn back up, which could be a sign Bitcoin may not be done yet. However, there are now several bearish divergences on the RSI, which is never a good sign.
Calm Before The Storm
The goal of this issue was to disprove that suddenly we are rocketing into an all-out altcoin season. It could happen, but at the moment, things are too calm for such a storm to appear.
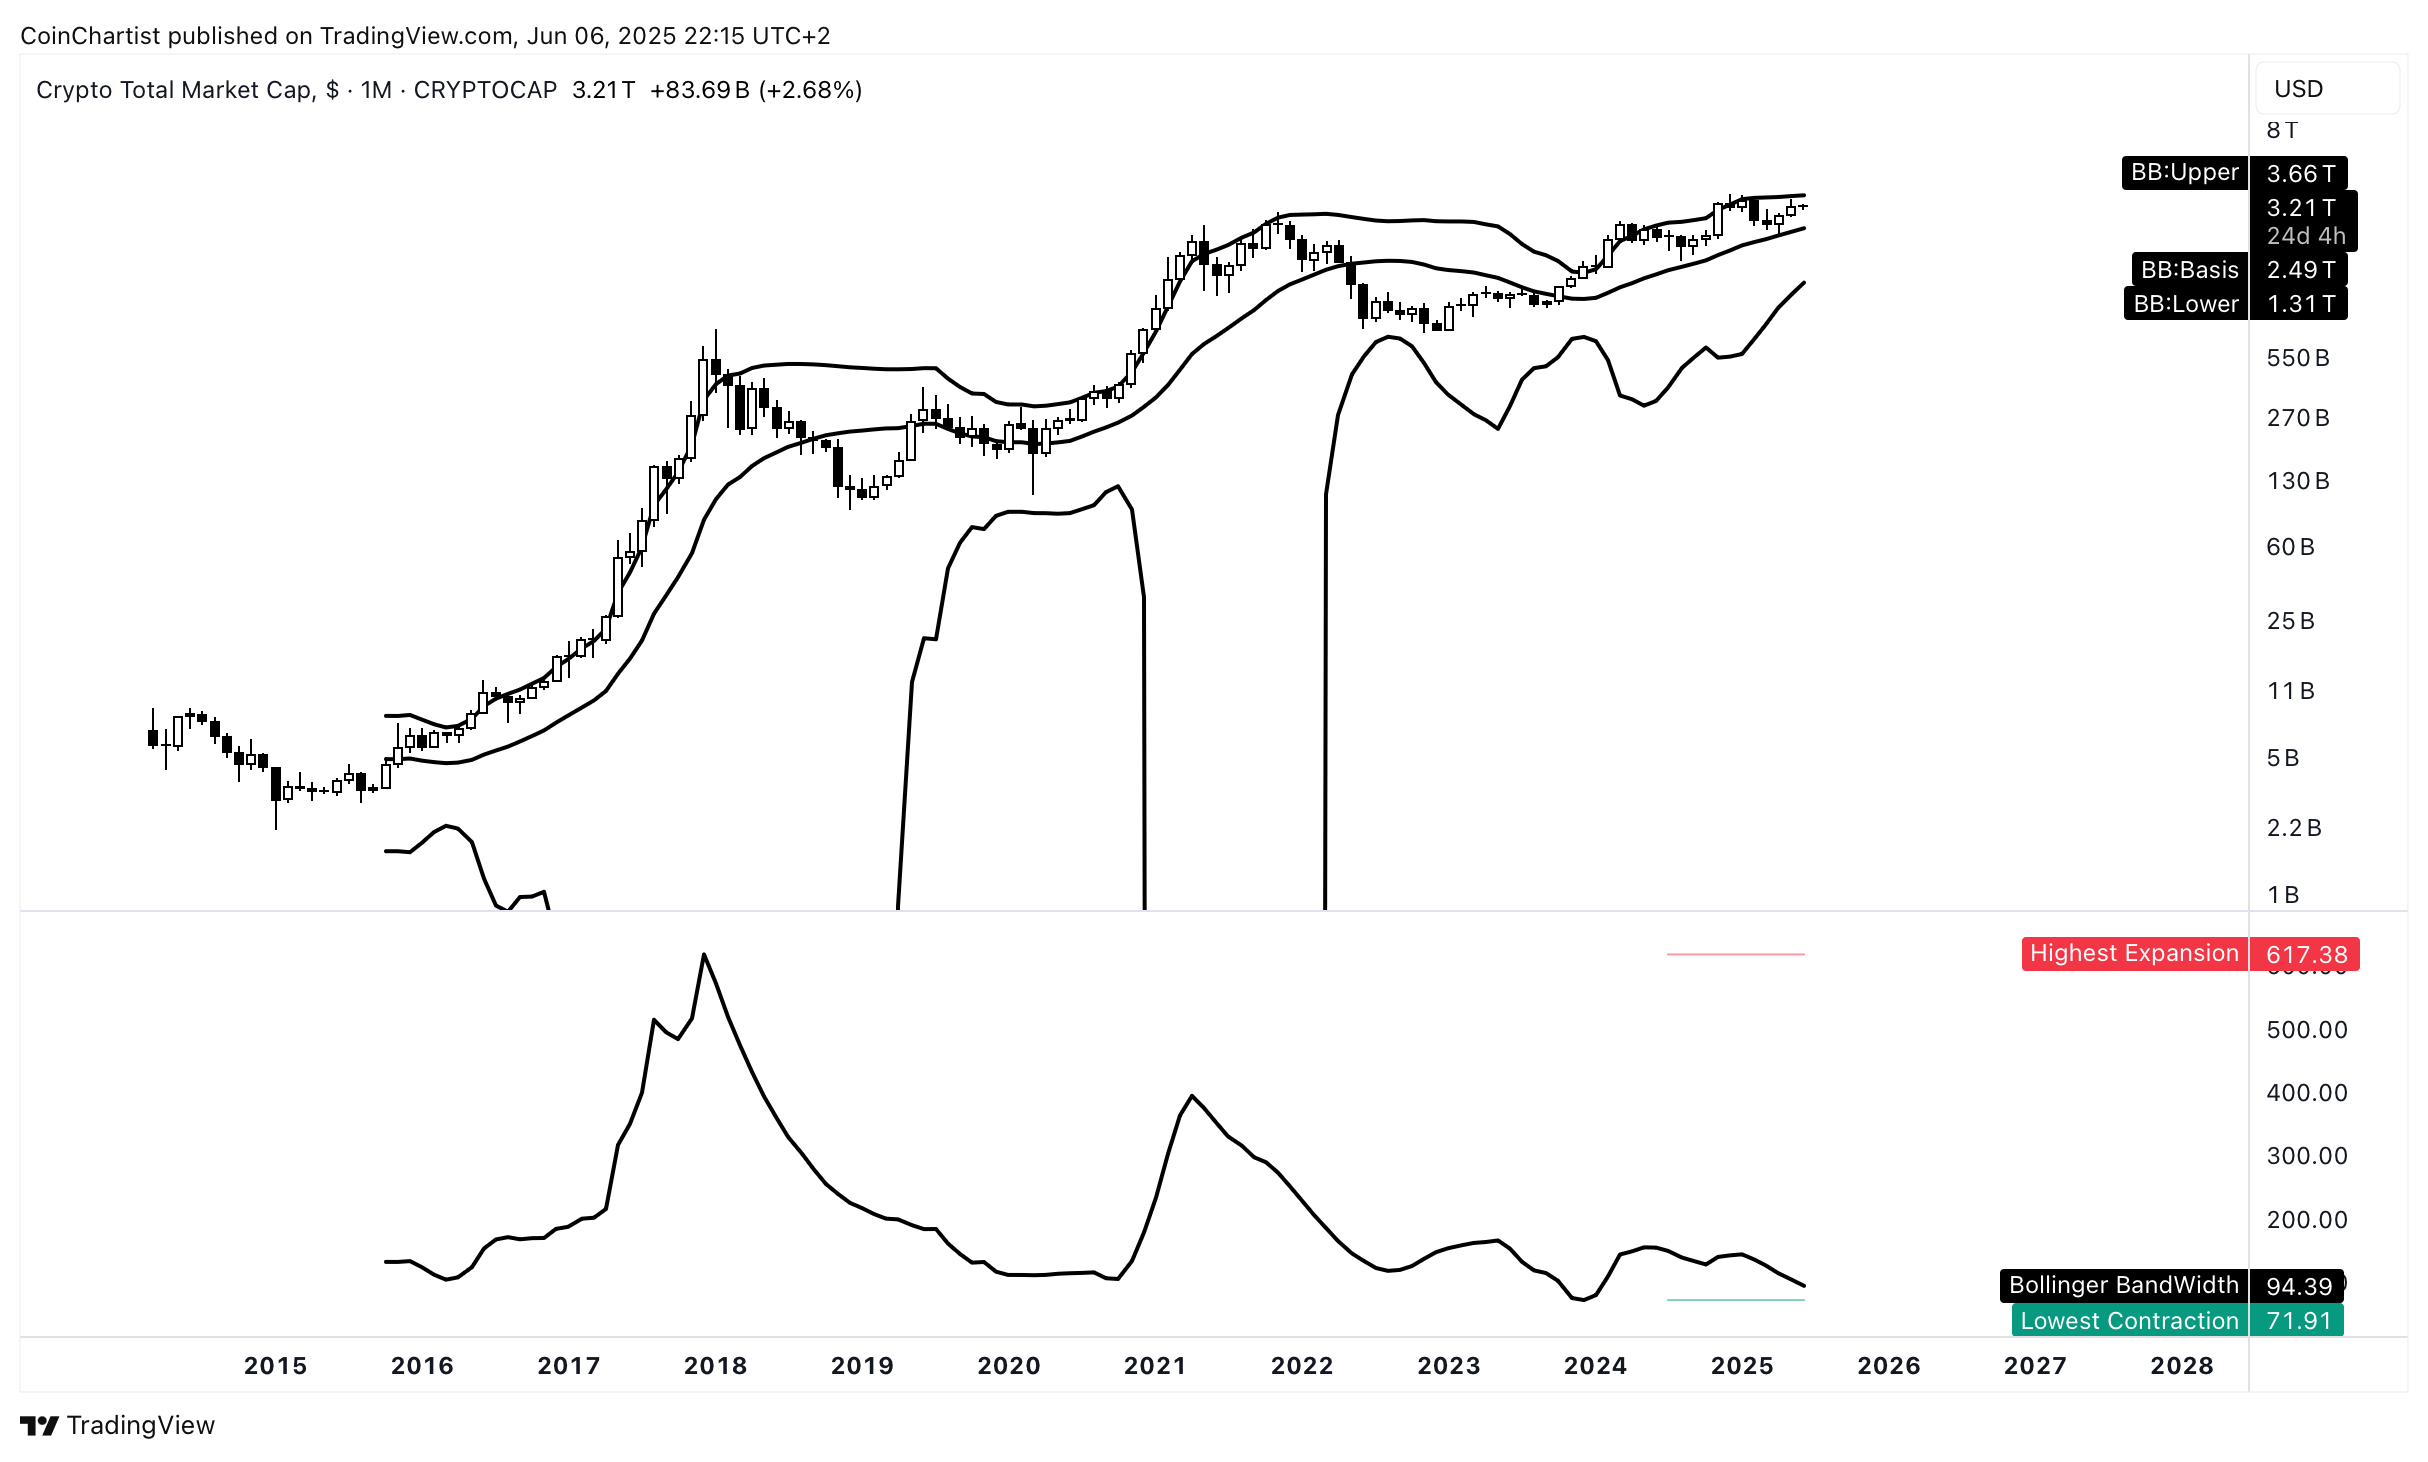
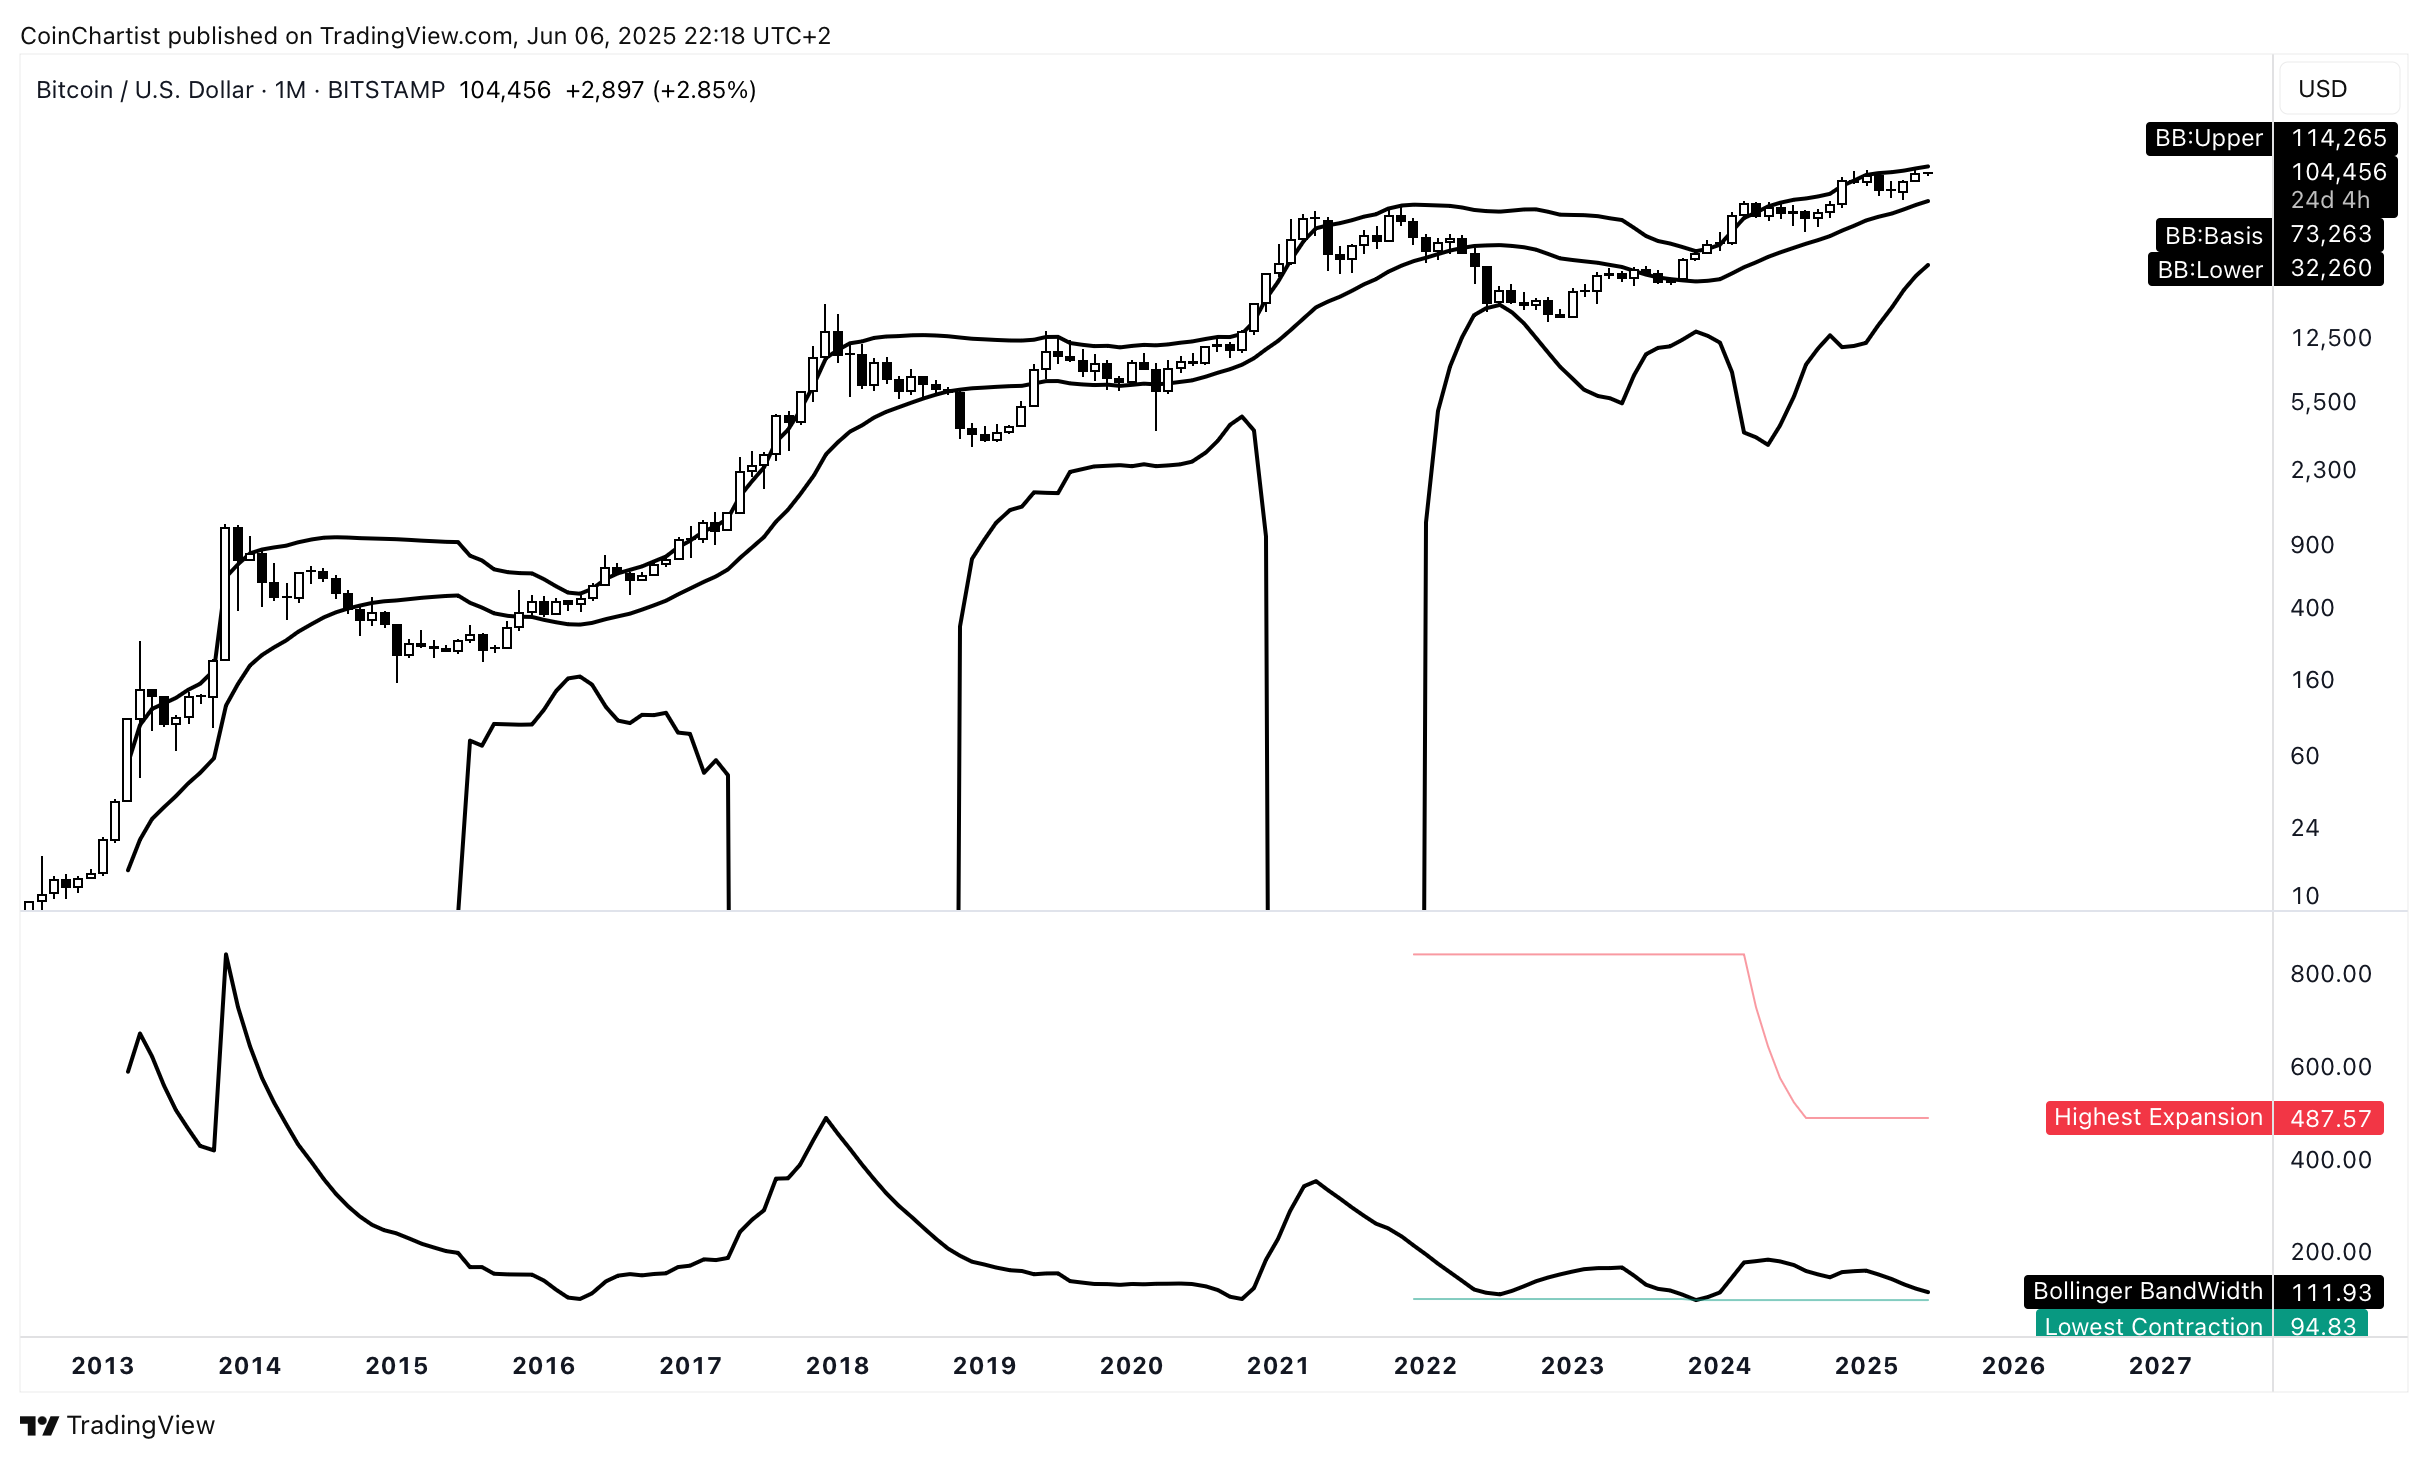
The Bollinger Bands are tightening on TOTAL, telling us that volatility is dwindling. We rarely get a big breakout until volatility falls to new lows, and the Bollinger Bands narrow to new extremes. The crypto market might be taking a sideways pause here a while longer to let the Bollinger Bands contract further. This says nothing about the direction of price after the breakout, so it could be up or down. Whatever the case may be, the resulting move will be huge and powerful. The Bollinger Bands are another tool that supports the idea of sideways and suggests that it could eventually go in either direction. What it definitely doesn’t show is a market ready to absolutely blast off.
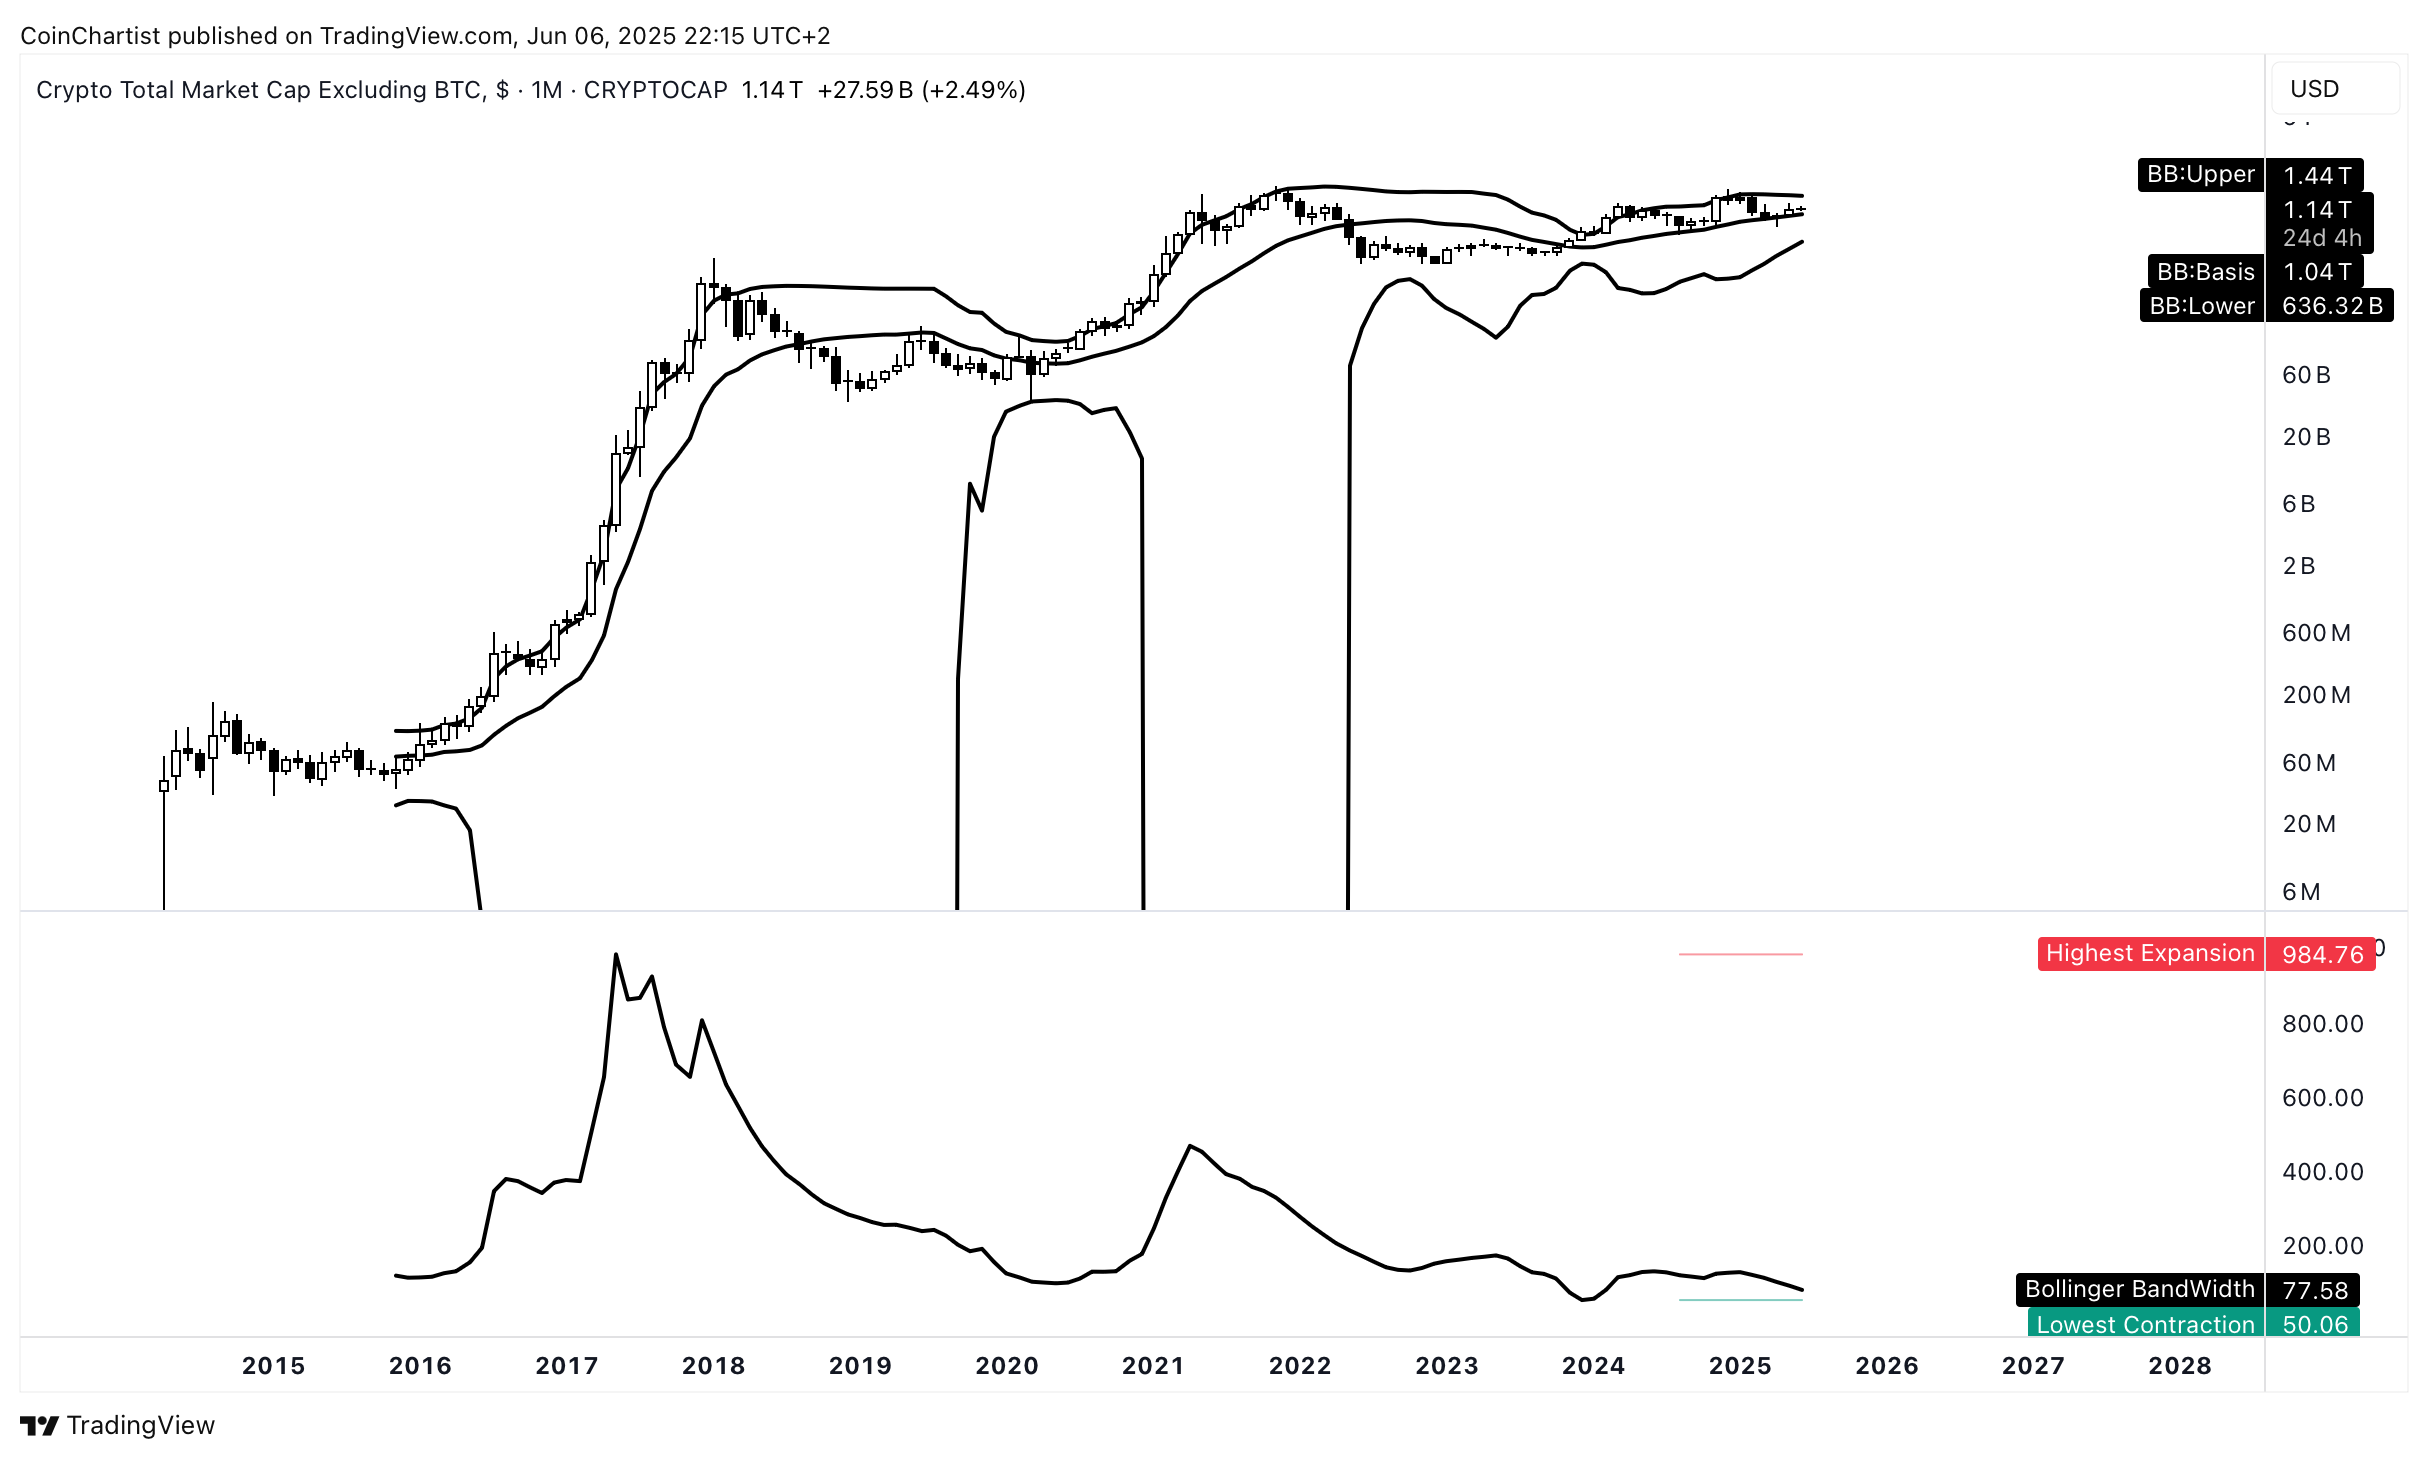
TOTAL2 is even tighter, but still not at new (or old) historical lows. As you can see, the lower Bollinger Bands never dropped off the chart like past cycles. This either means we never really got a true rally before turning bearish, or it simply hasn’t happened just yet.
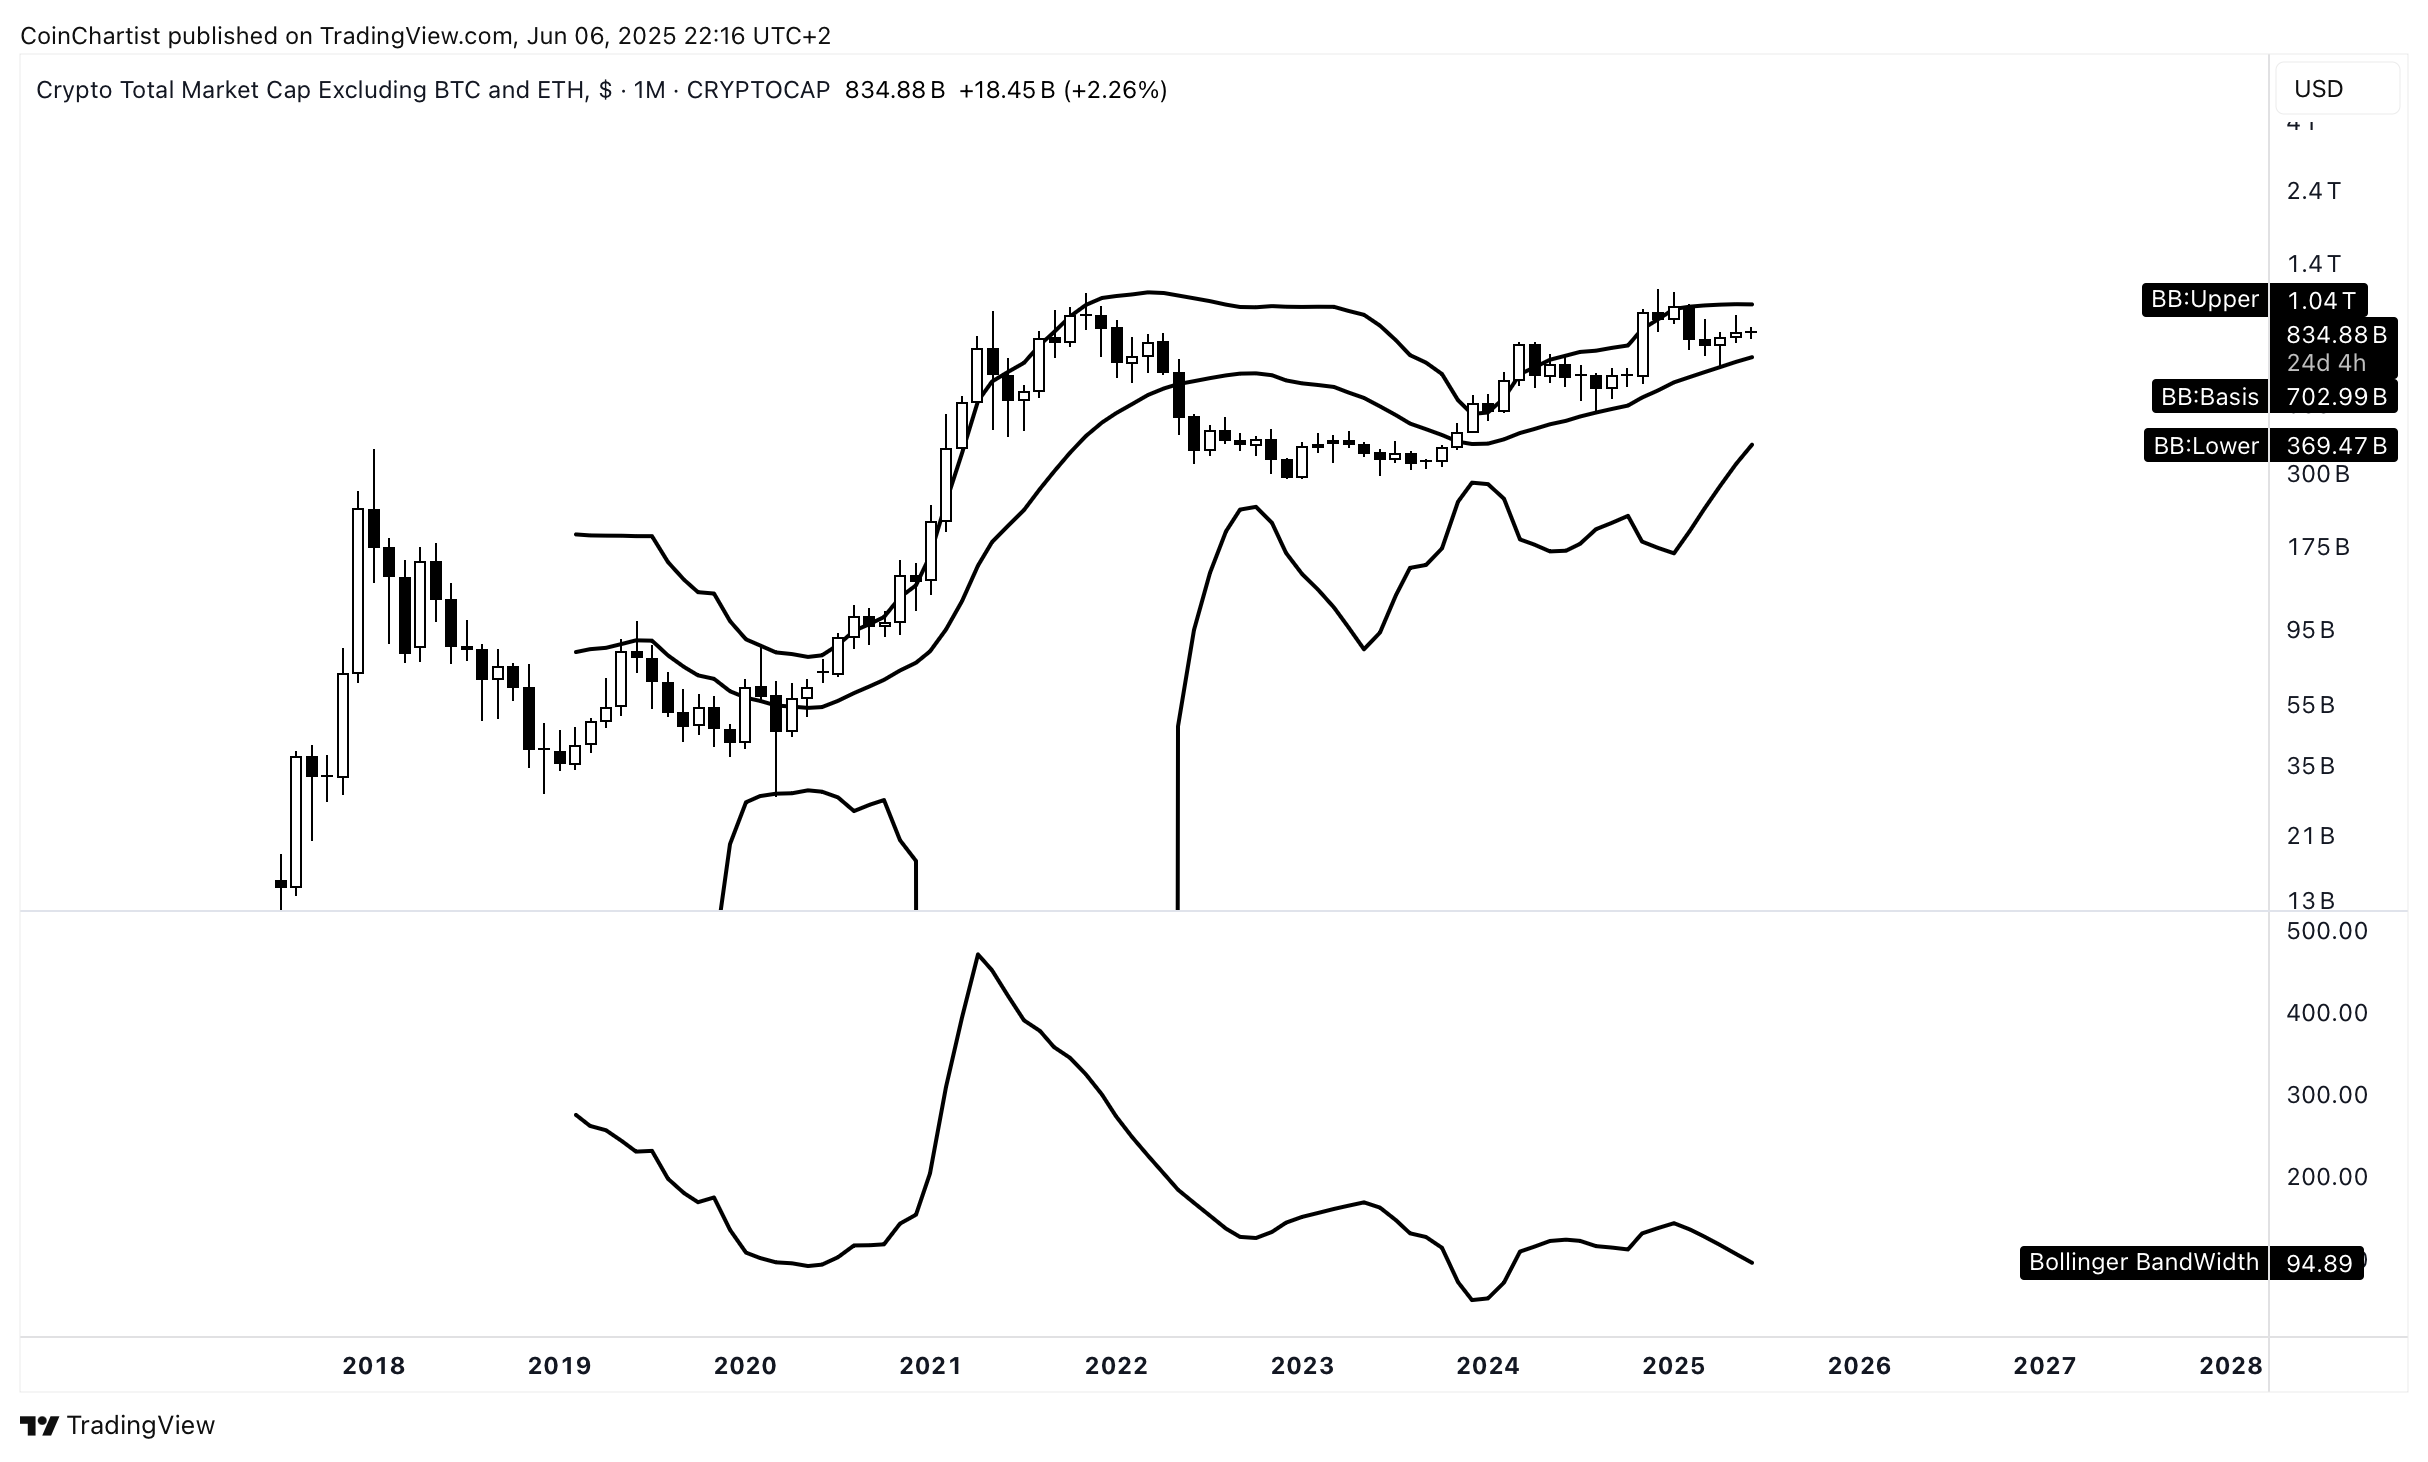
TOTAL3 is the least tight of the bunch. This could indicate even more sideways for altcoins while we see moves in BTC and ETH.
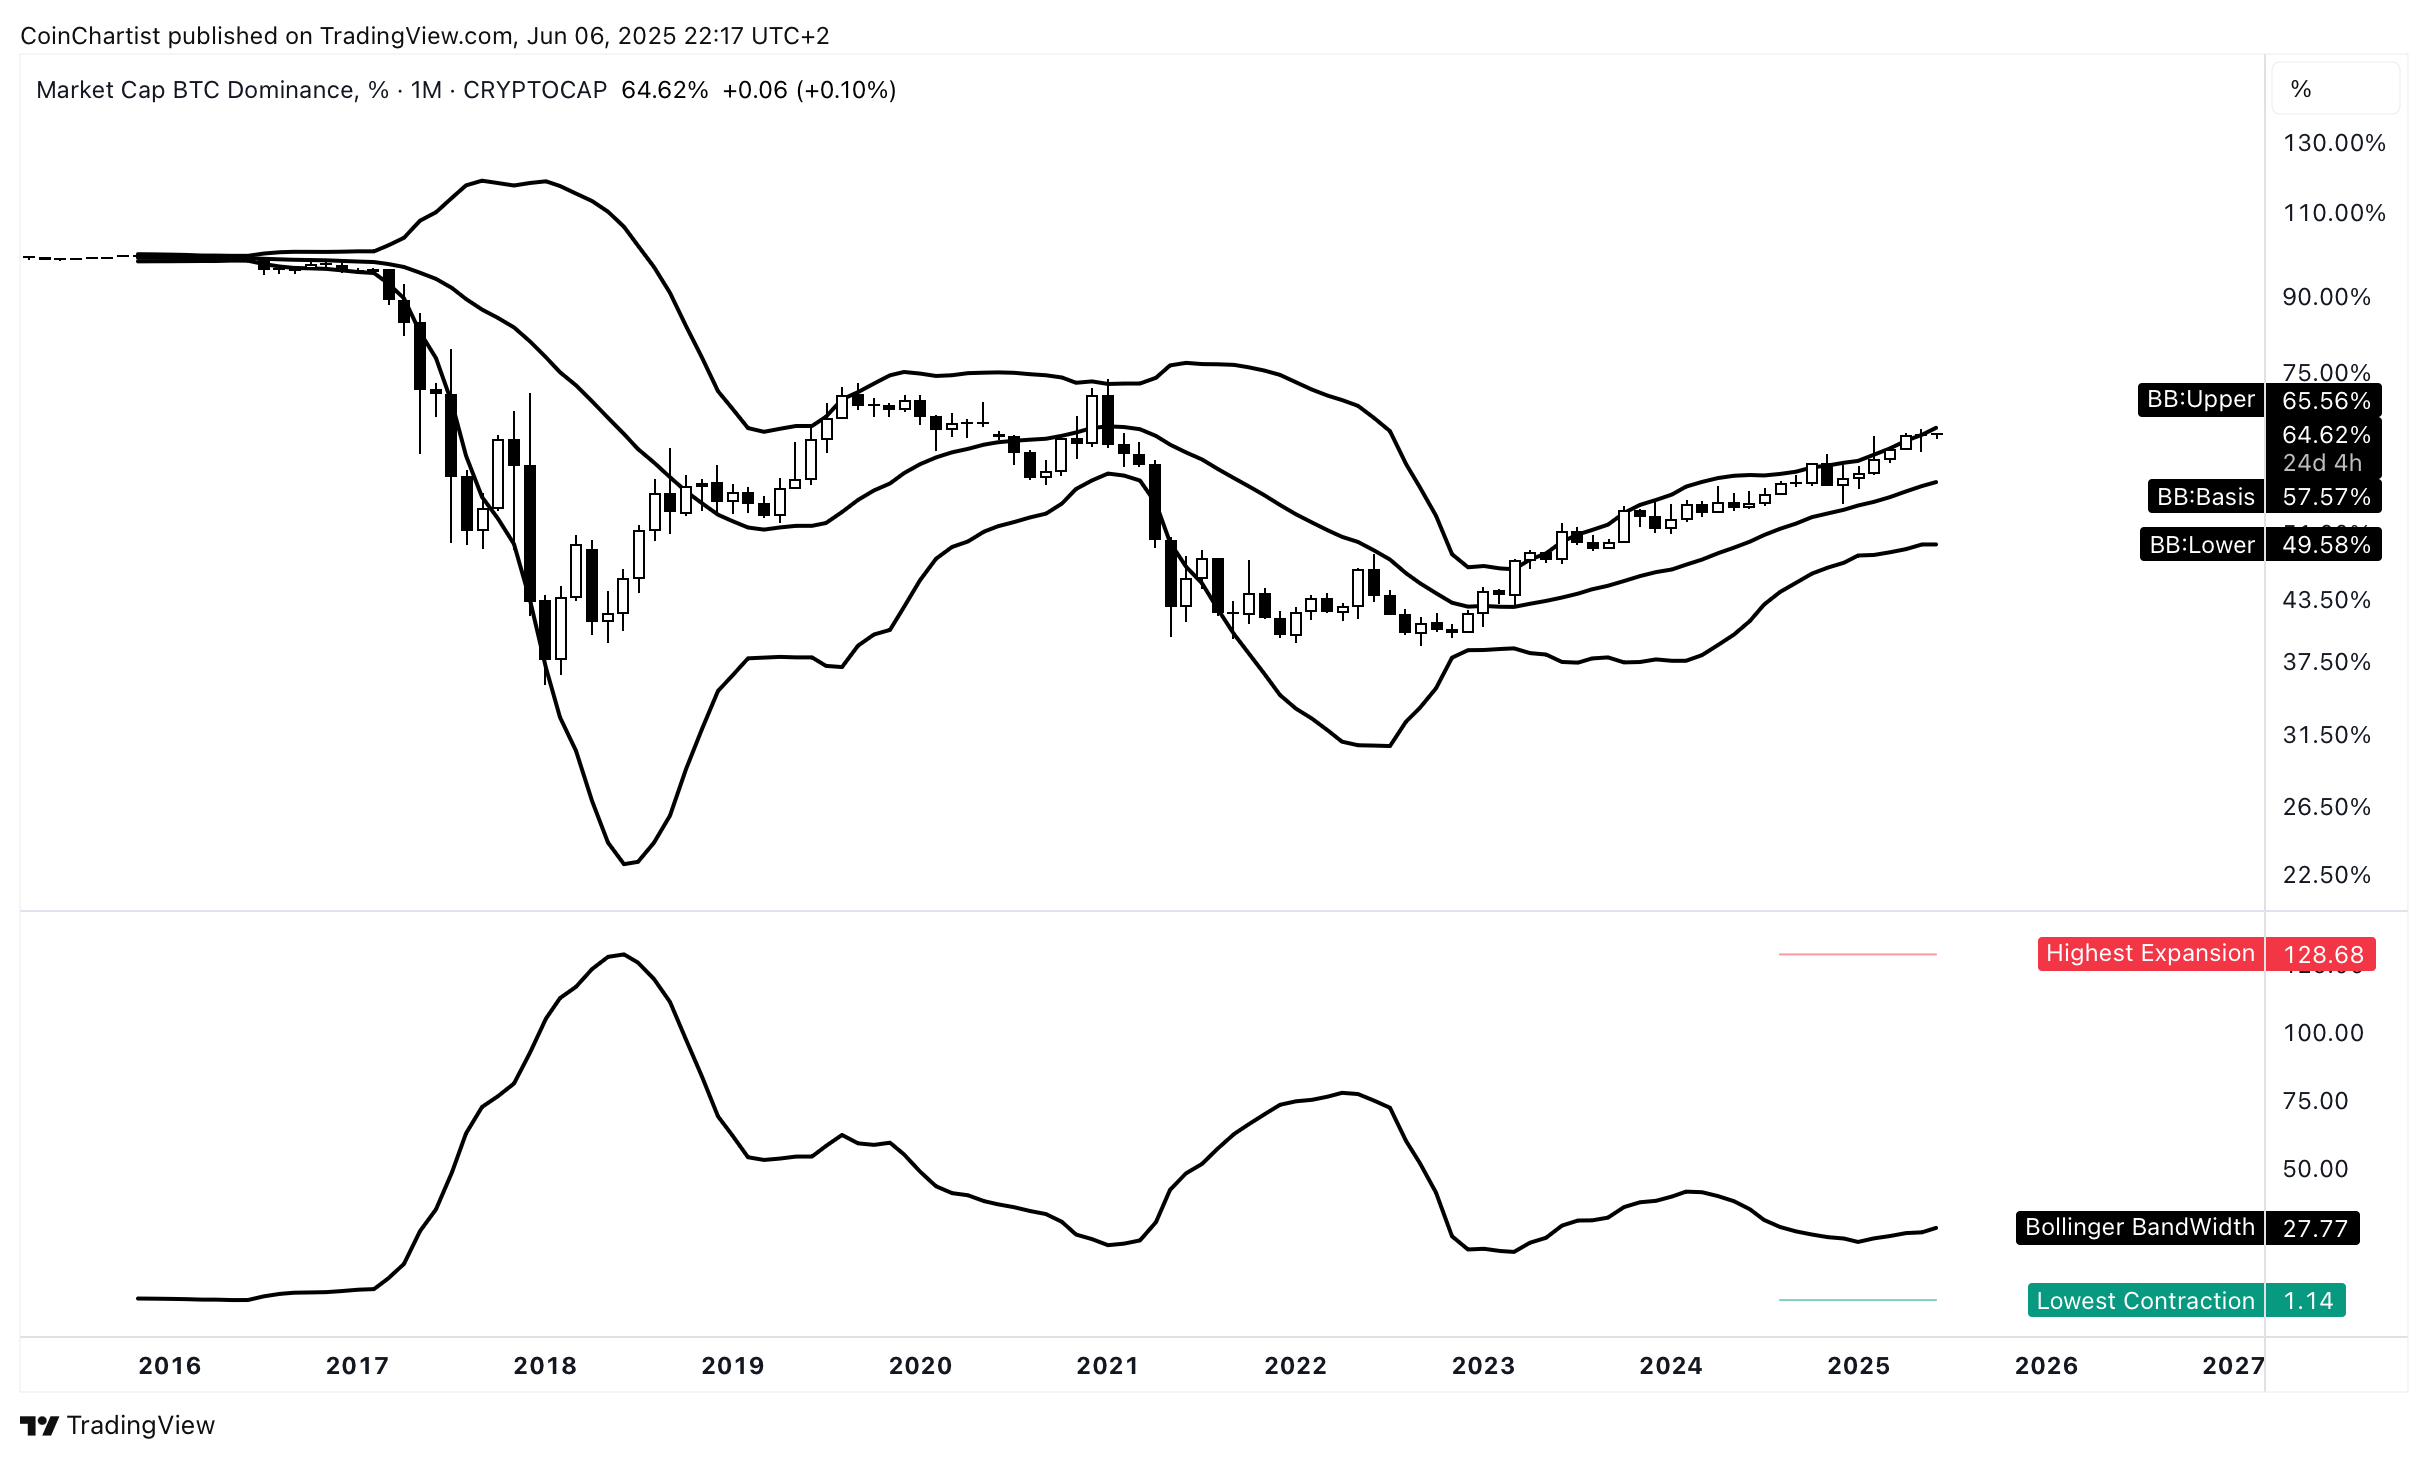
Just like other tools, BTC.D shows wildly different technicals. The Bollinger Bands are currently expanding, suggesting that volatility is growing. This doesn’t necessarily mean we see upside or downside, but it means sideways is less probable here. With BTC.D at the upper Bollinger Band, it here is a higher probability this continues to push up. Look for altcoin season only when there is a close below the Bollinger Band basis line.
Bitcoin is a mixed bag. It is up against the upper Bollinger Band, but the Bands are aggressively narrowing. Once again, it indicates more coiling price action, but also an explosive breakout when it does arrive. And just to reiterate, this doesn’t tell us direction. But because BTCUSD is still so close to the upper Bollinger Band, the higher probability move, is indeed up. If BTCUSD closes below the Bollinger Band basis, we would have to start to worry that the move will be down.
Altcoins Versus Precious Metals
As if things weren’t confusing enough, Silver has started to join in on Gold’s unstoppable rally. In the past, smaller moves in Silver proceeded an altcoin season. If this behavior continues, we need to wait for Silver to start to top out before we can expect an altcoin season. However, this might not be a smaller move in Silver — this could breakout from an over 40 year range. The biggest moves in Gold and Silver are serious risk off signals, which makes this potentially a different scenario for altcoins which are on the other end of the risk spectrum.
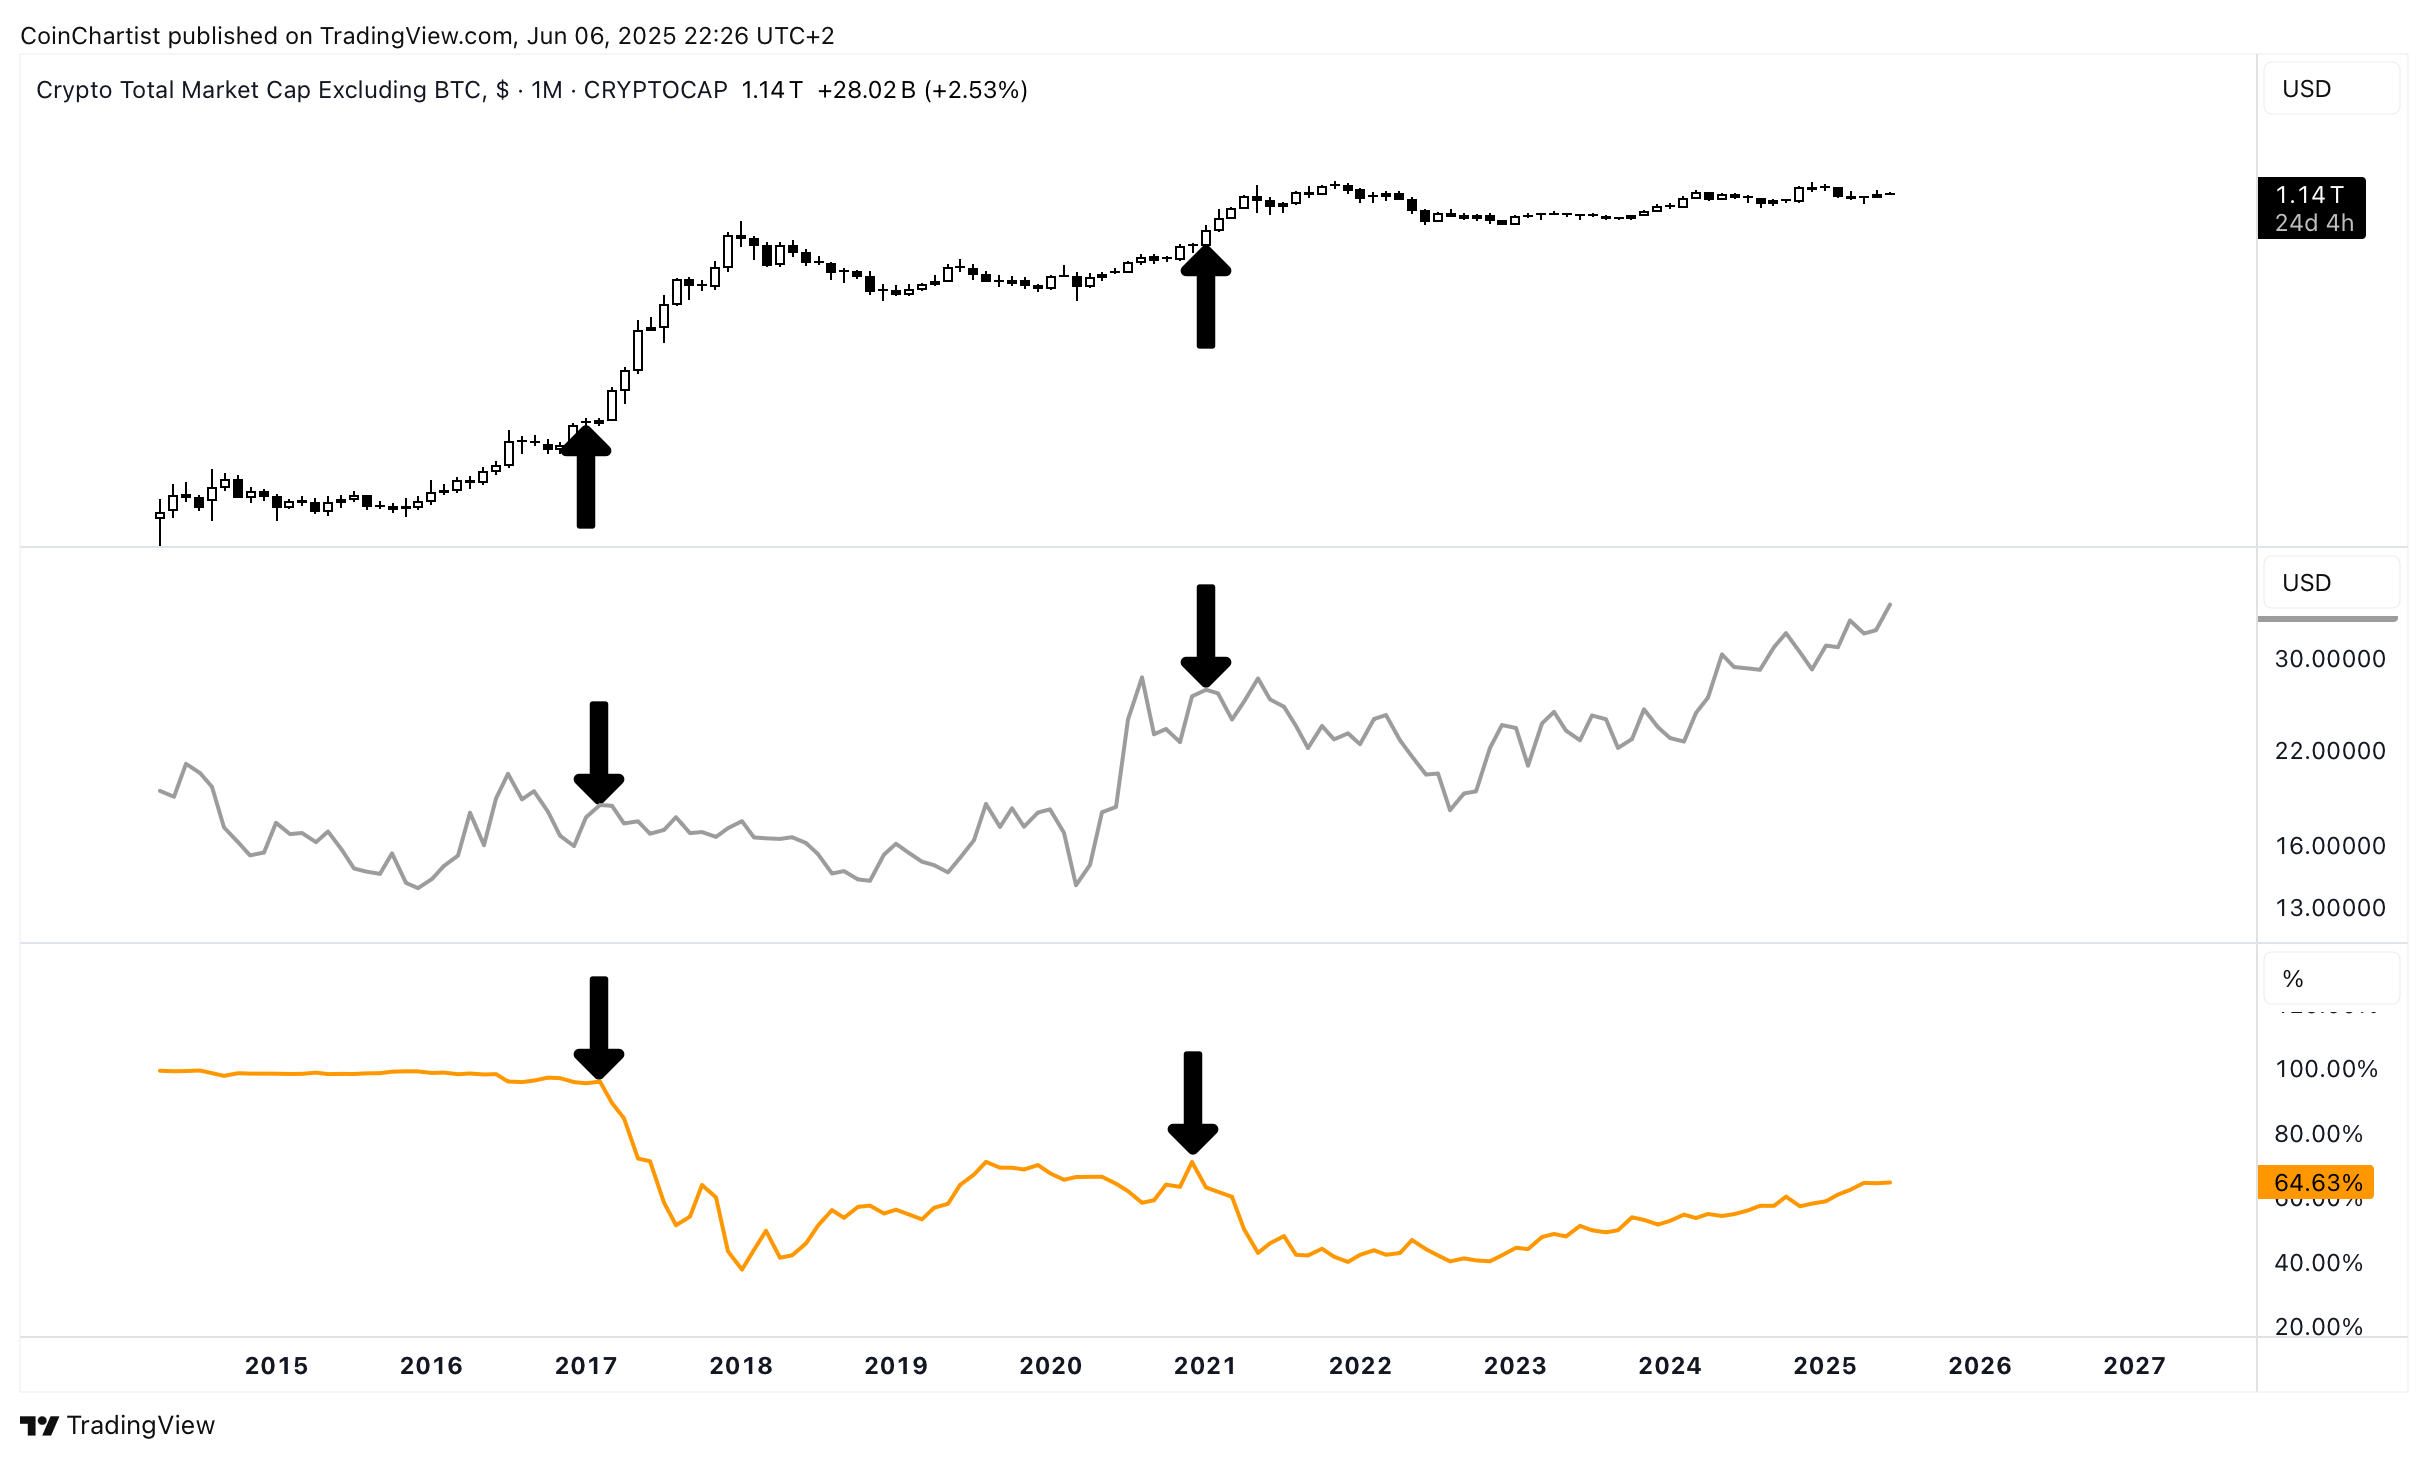
From top to bottom, the chart compares TOTAL2 representing altcoins, Silver, and Bitcoin Dominance. It is easy to see visually that the each lower high on Silver after a rally, resulted in an altcoin season as risk appetite changed and capital rotated. If accurate, alts could do well once silver cools down.
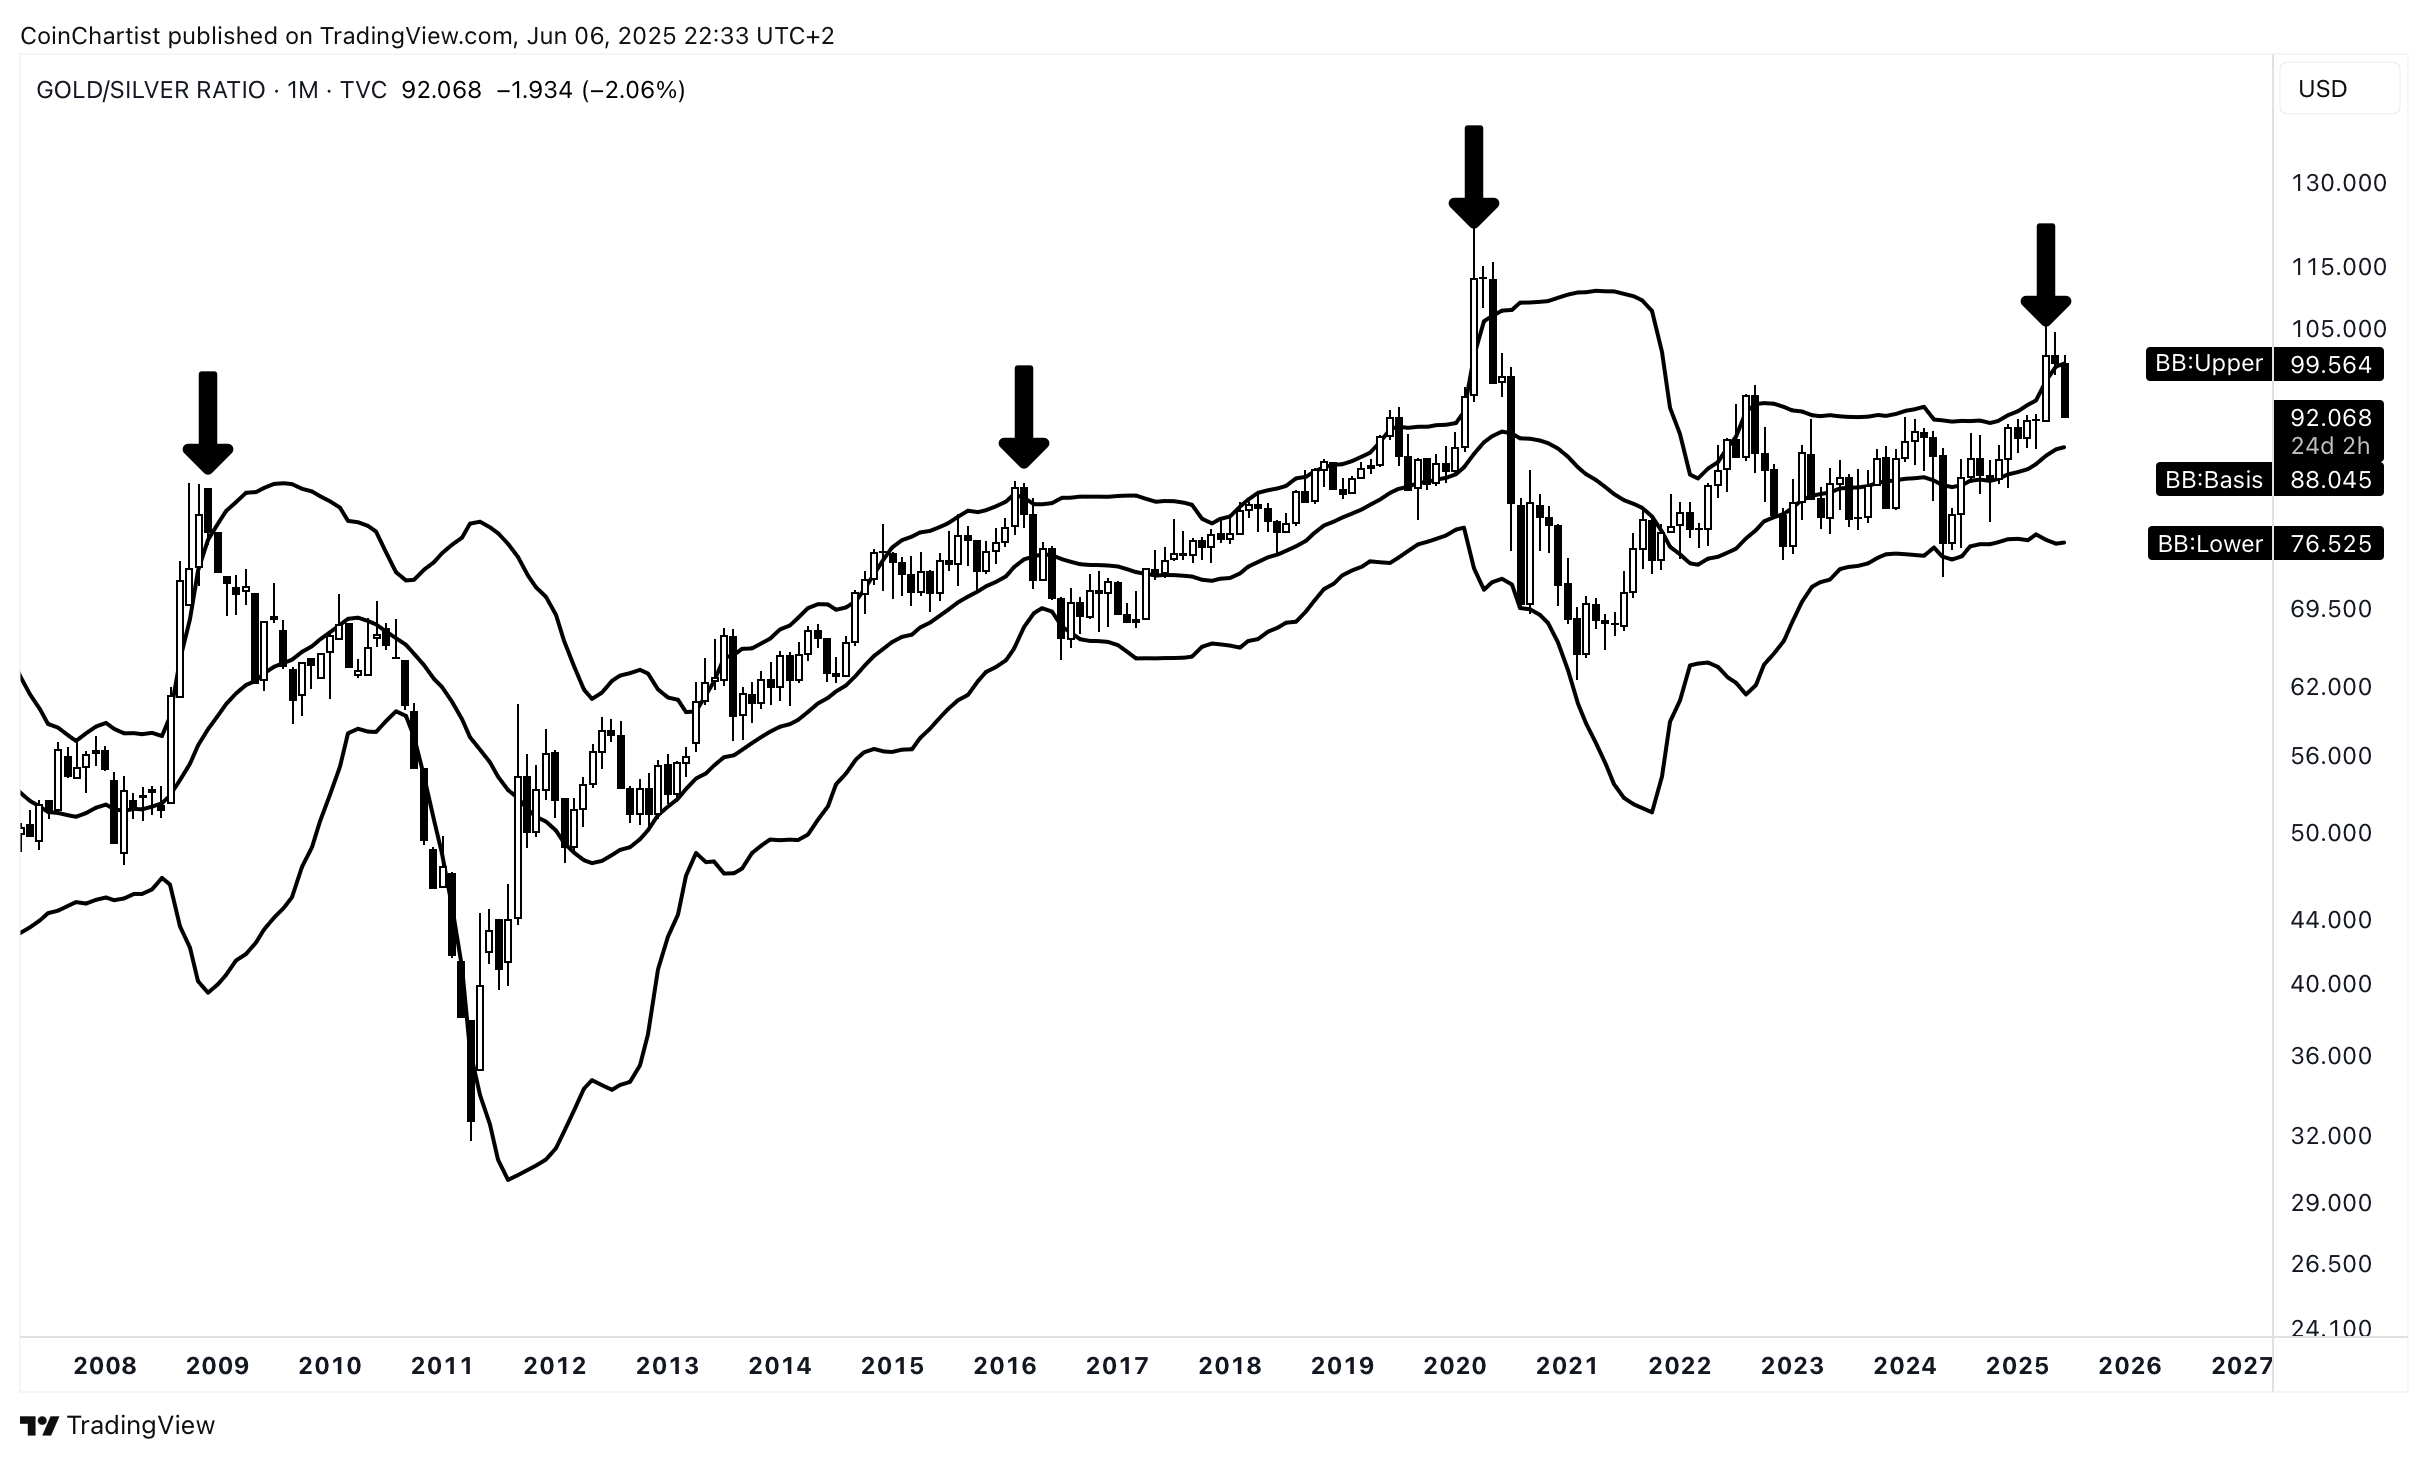
The above is the Gold/Silver ratio. Gold always performs first then the ratio reverses abruptly, Silver spikes hard and it’s all said and done very quickly.
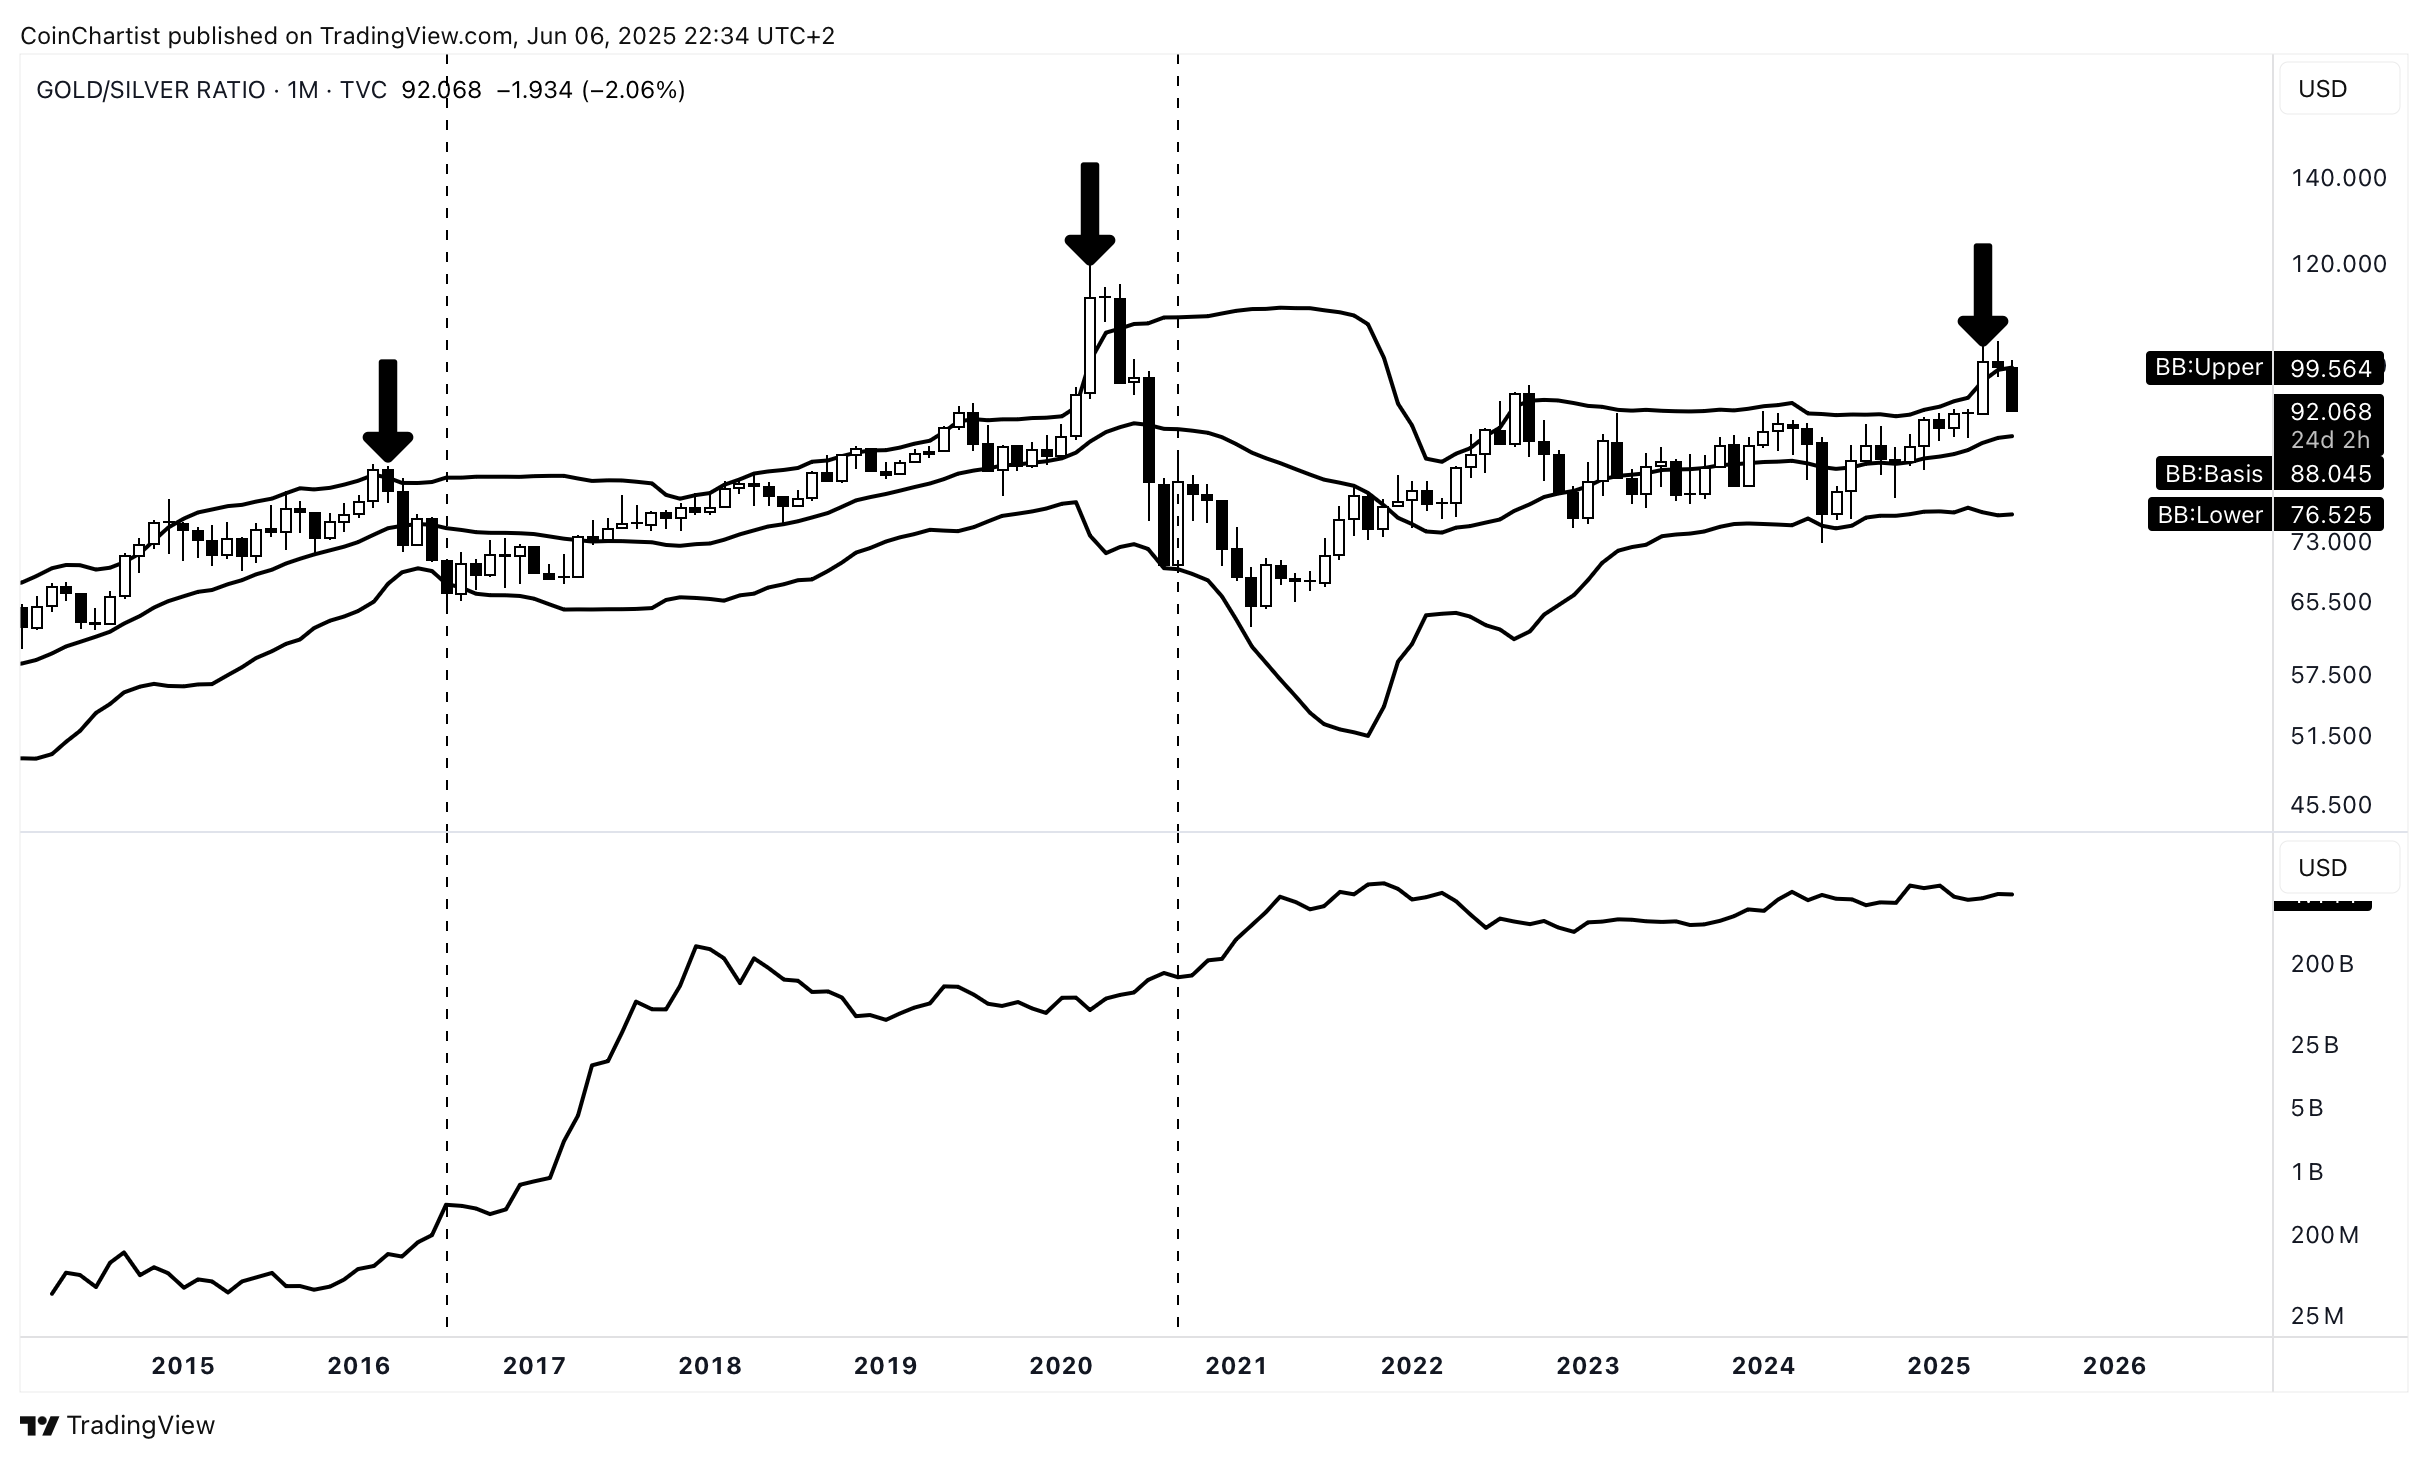
The second and third instances of the Gold/Silver ratio reversing (instance 1 not pictured), show that the ratio gets rejected above the upper Bollinger Band, then immediately falls to the lower Band. When the lower Band is tagged, altcoin season begins. So far we have the rejection above the upper Bollinger Band. It might be wise to wait for a tag of the lower BB before considering a risk-on signal.
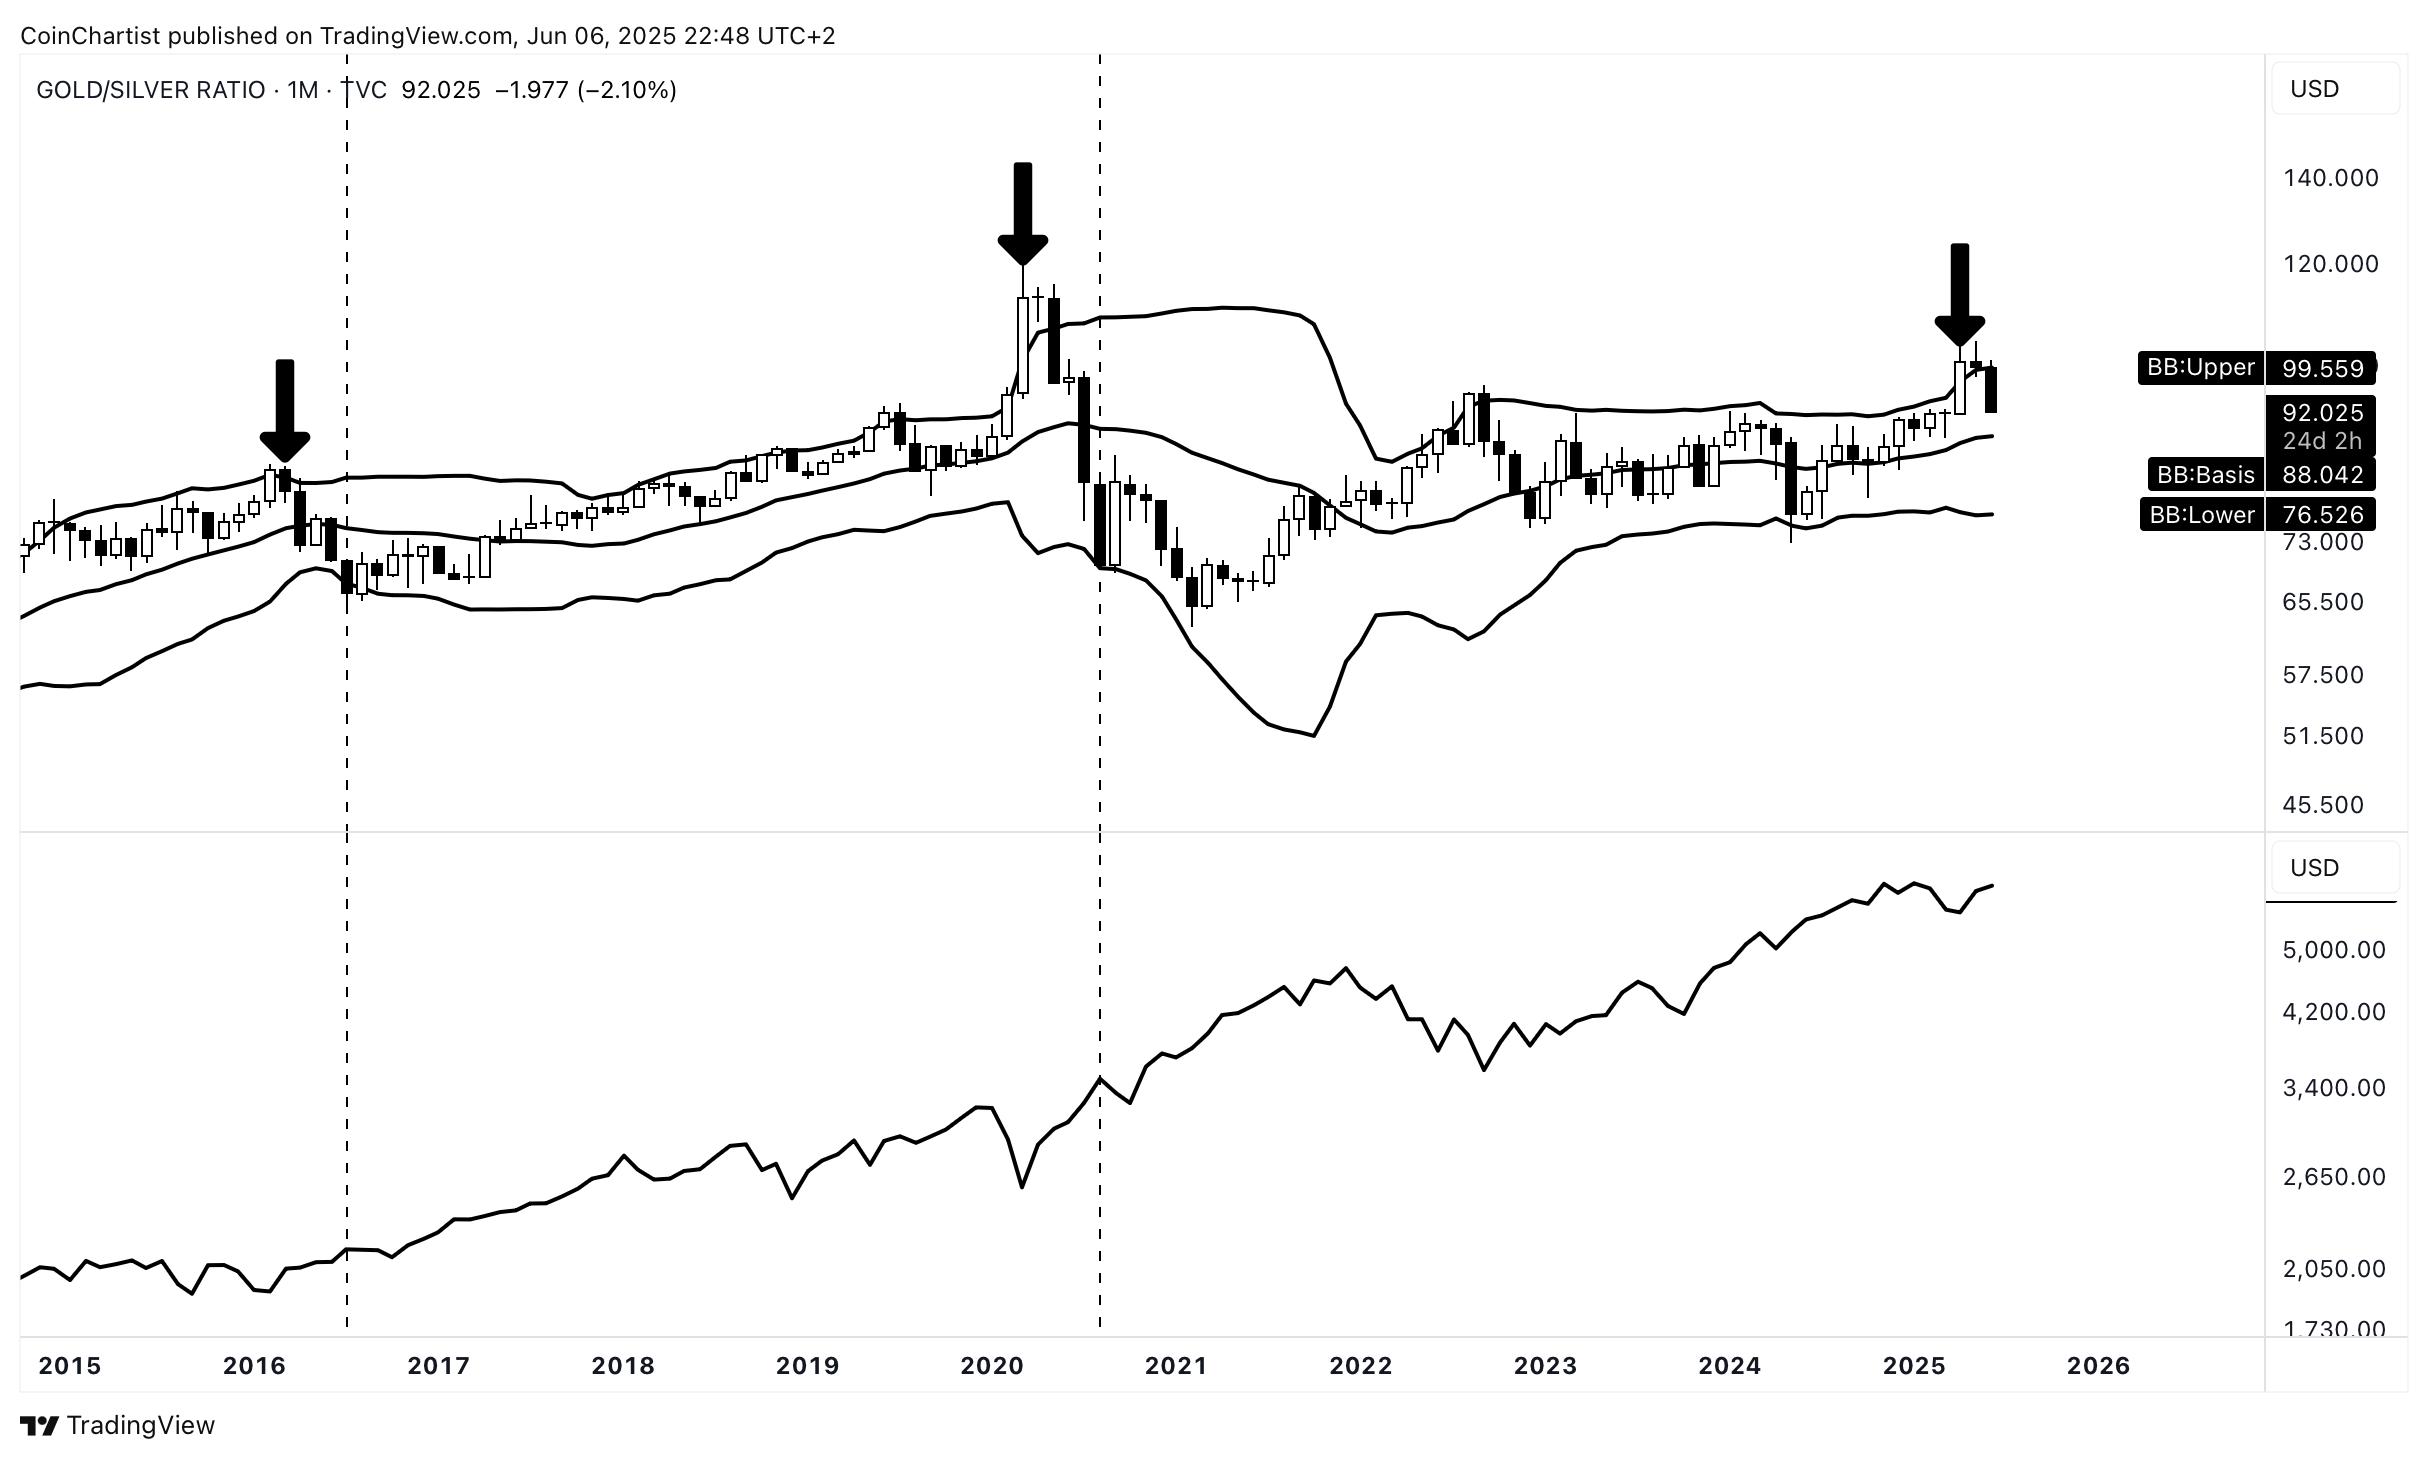
However, I also wanted to point out a major caveat. The Gold/Silver ratio tagging the lower BB also started huge legs up in the S&P 500 alongside the same altcoin season signals.
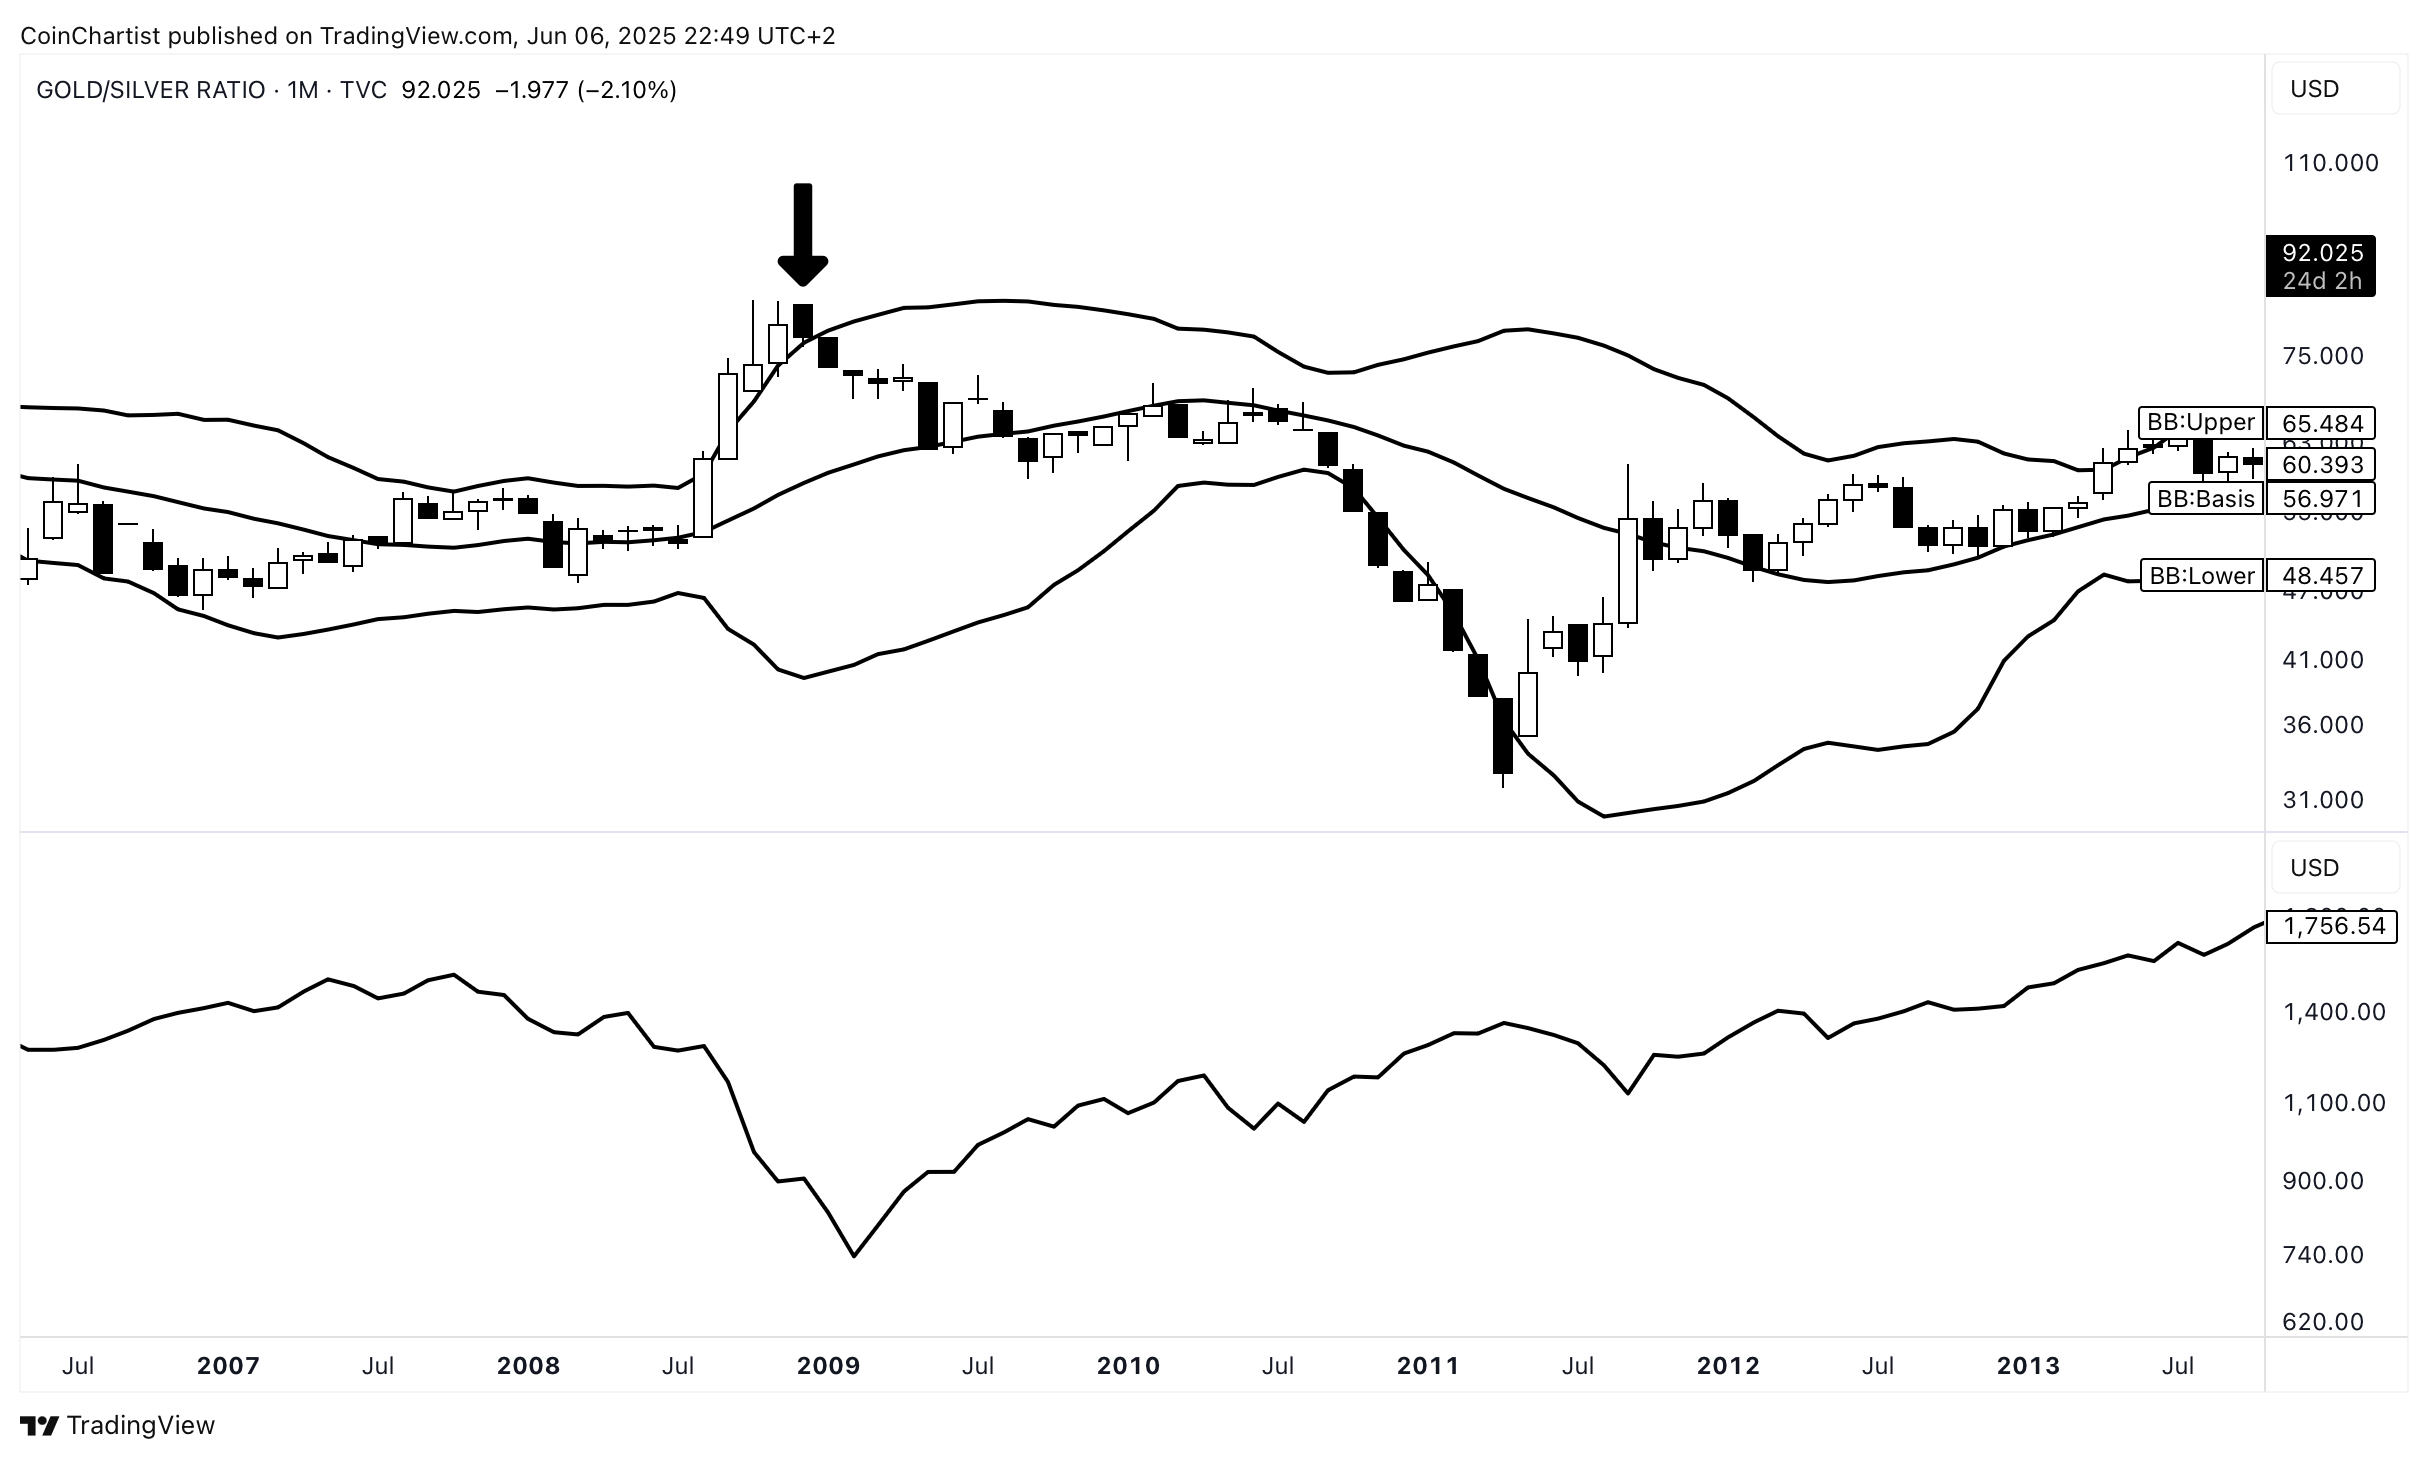
The first instance of a rejection above the upper Bollinger Band on the Gold/Silver ratio I’ve omitted previously, was during the Great Financial Crisis. This was the last major macro event. If Gold and Silver and performing so strongly is another major risk-off signal, altcoins might see further devastation before any chance of revival.
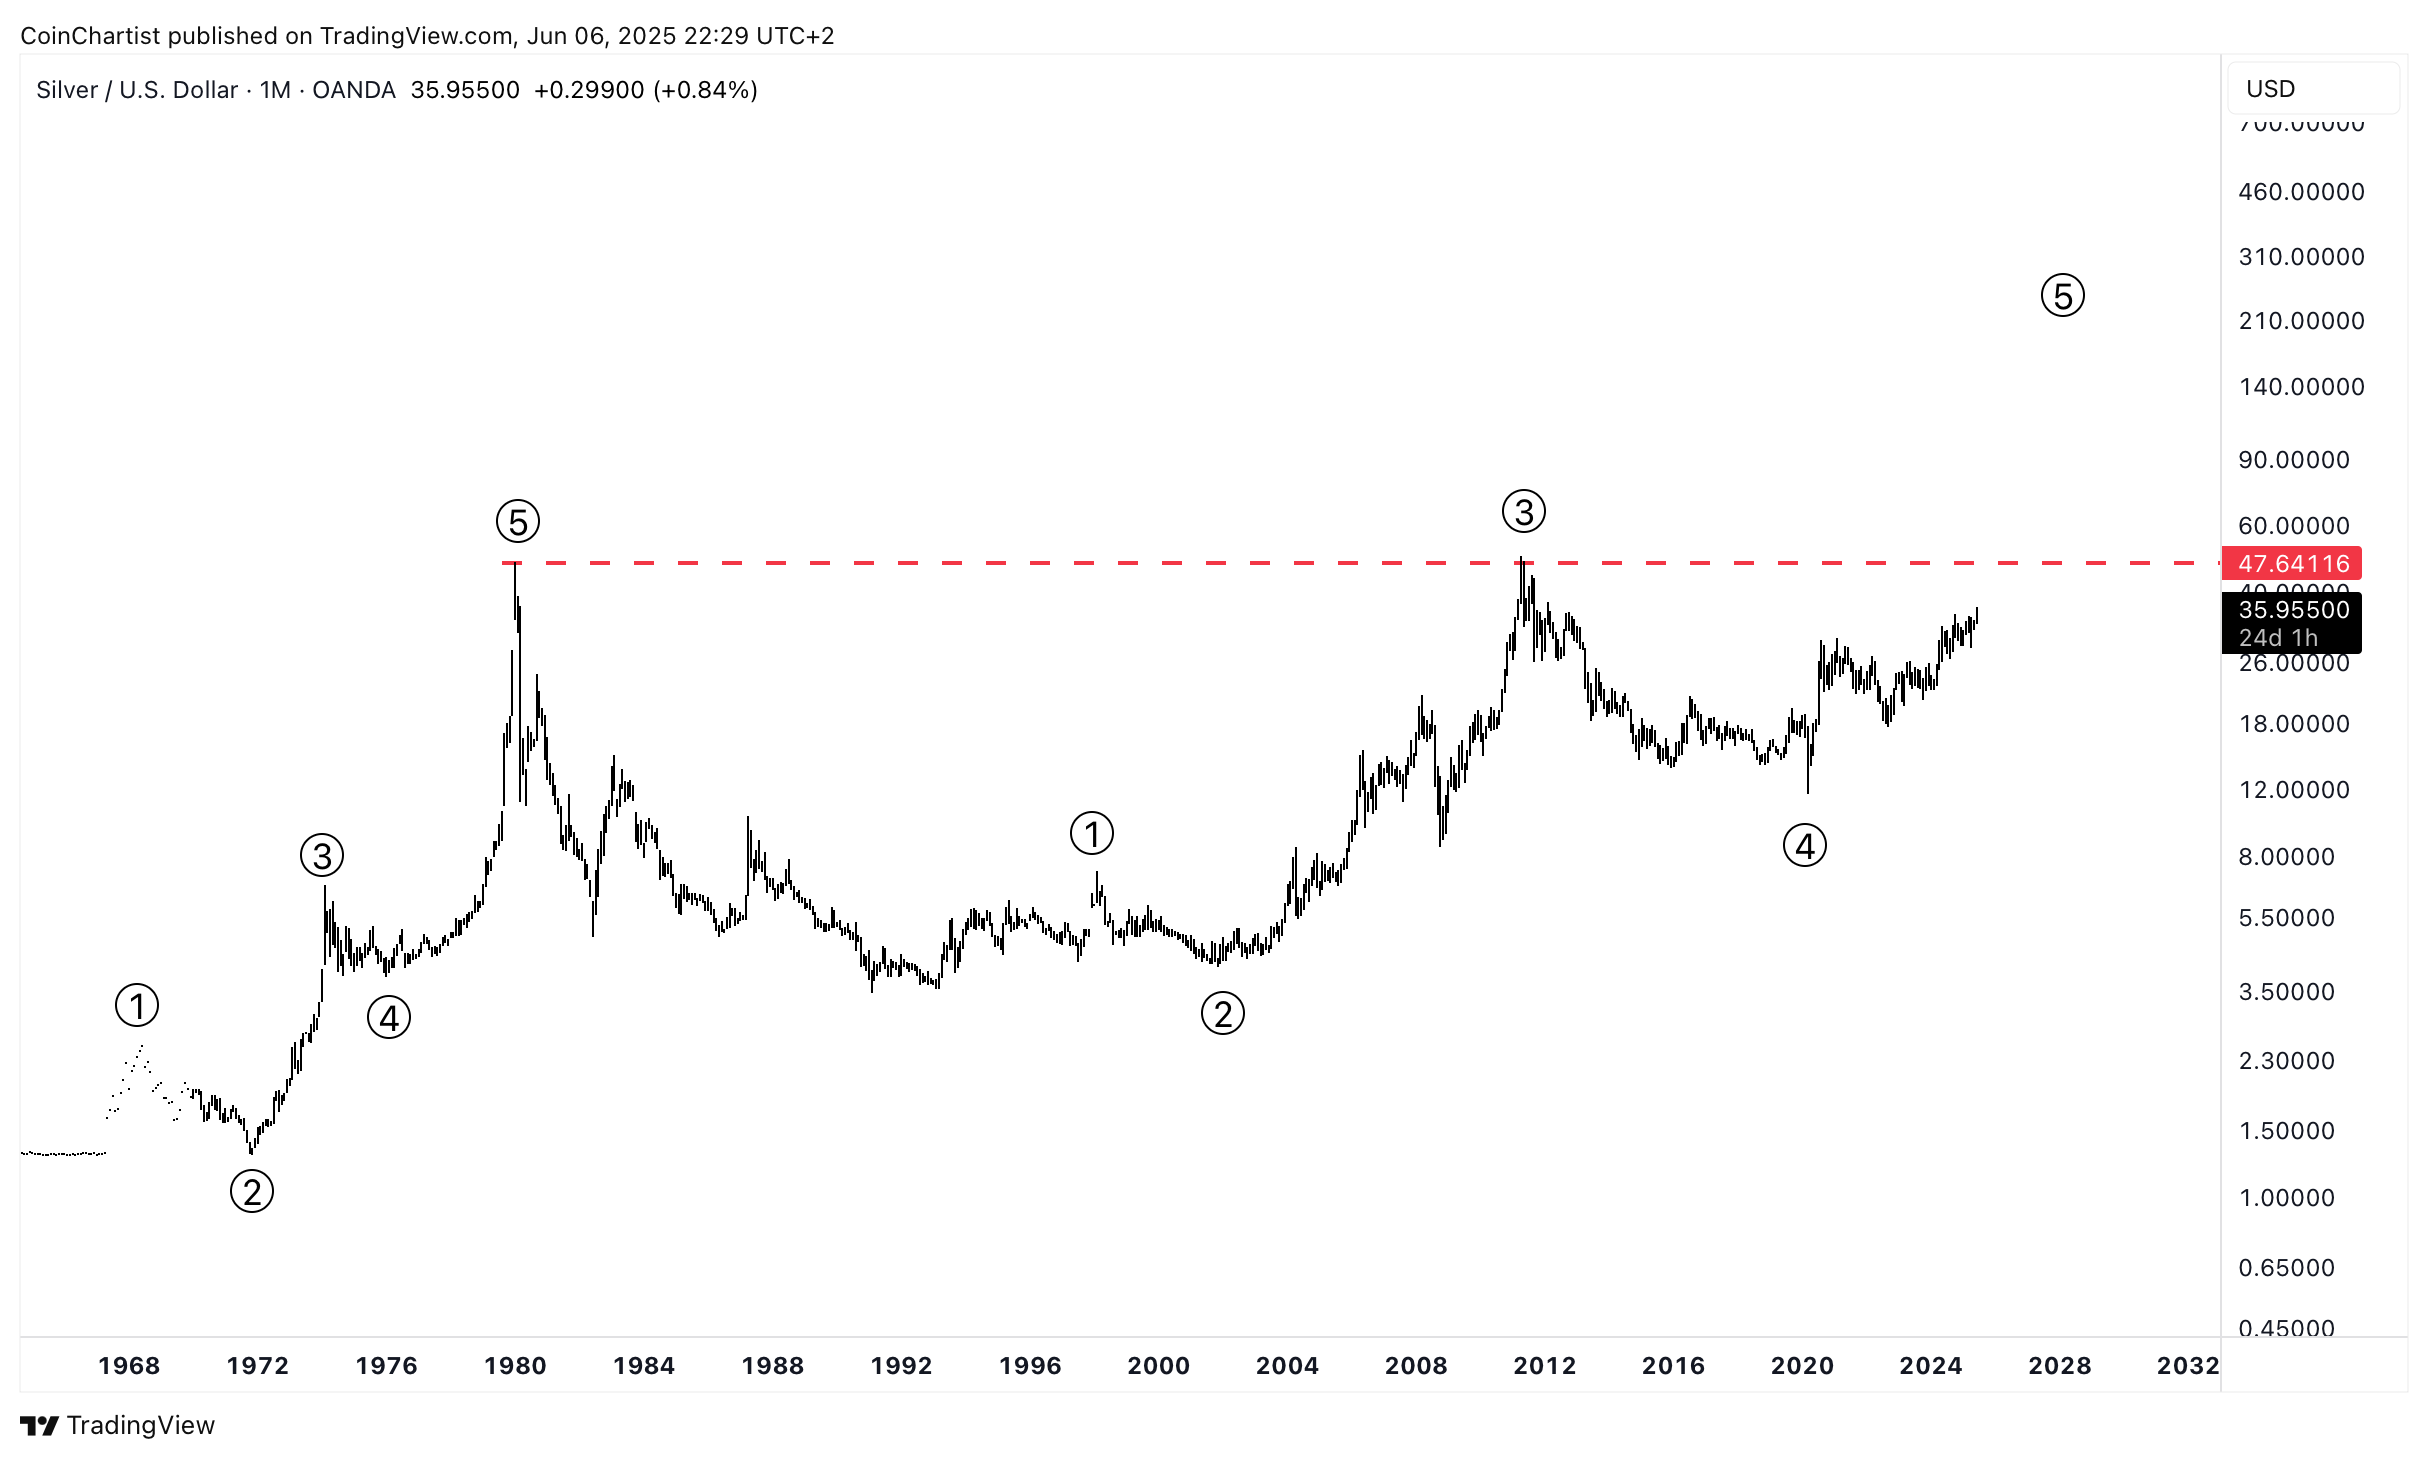
Based on Elliott Wave counts and even the larger price pattern, Silver looks poised for a massive move up. Wave 5s in Commodities are the longest and strongest and most extended. All of this points to something more of a major risk-off event rather than risk-on.
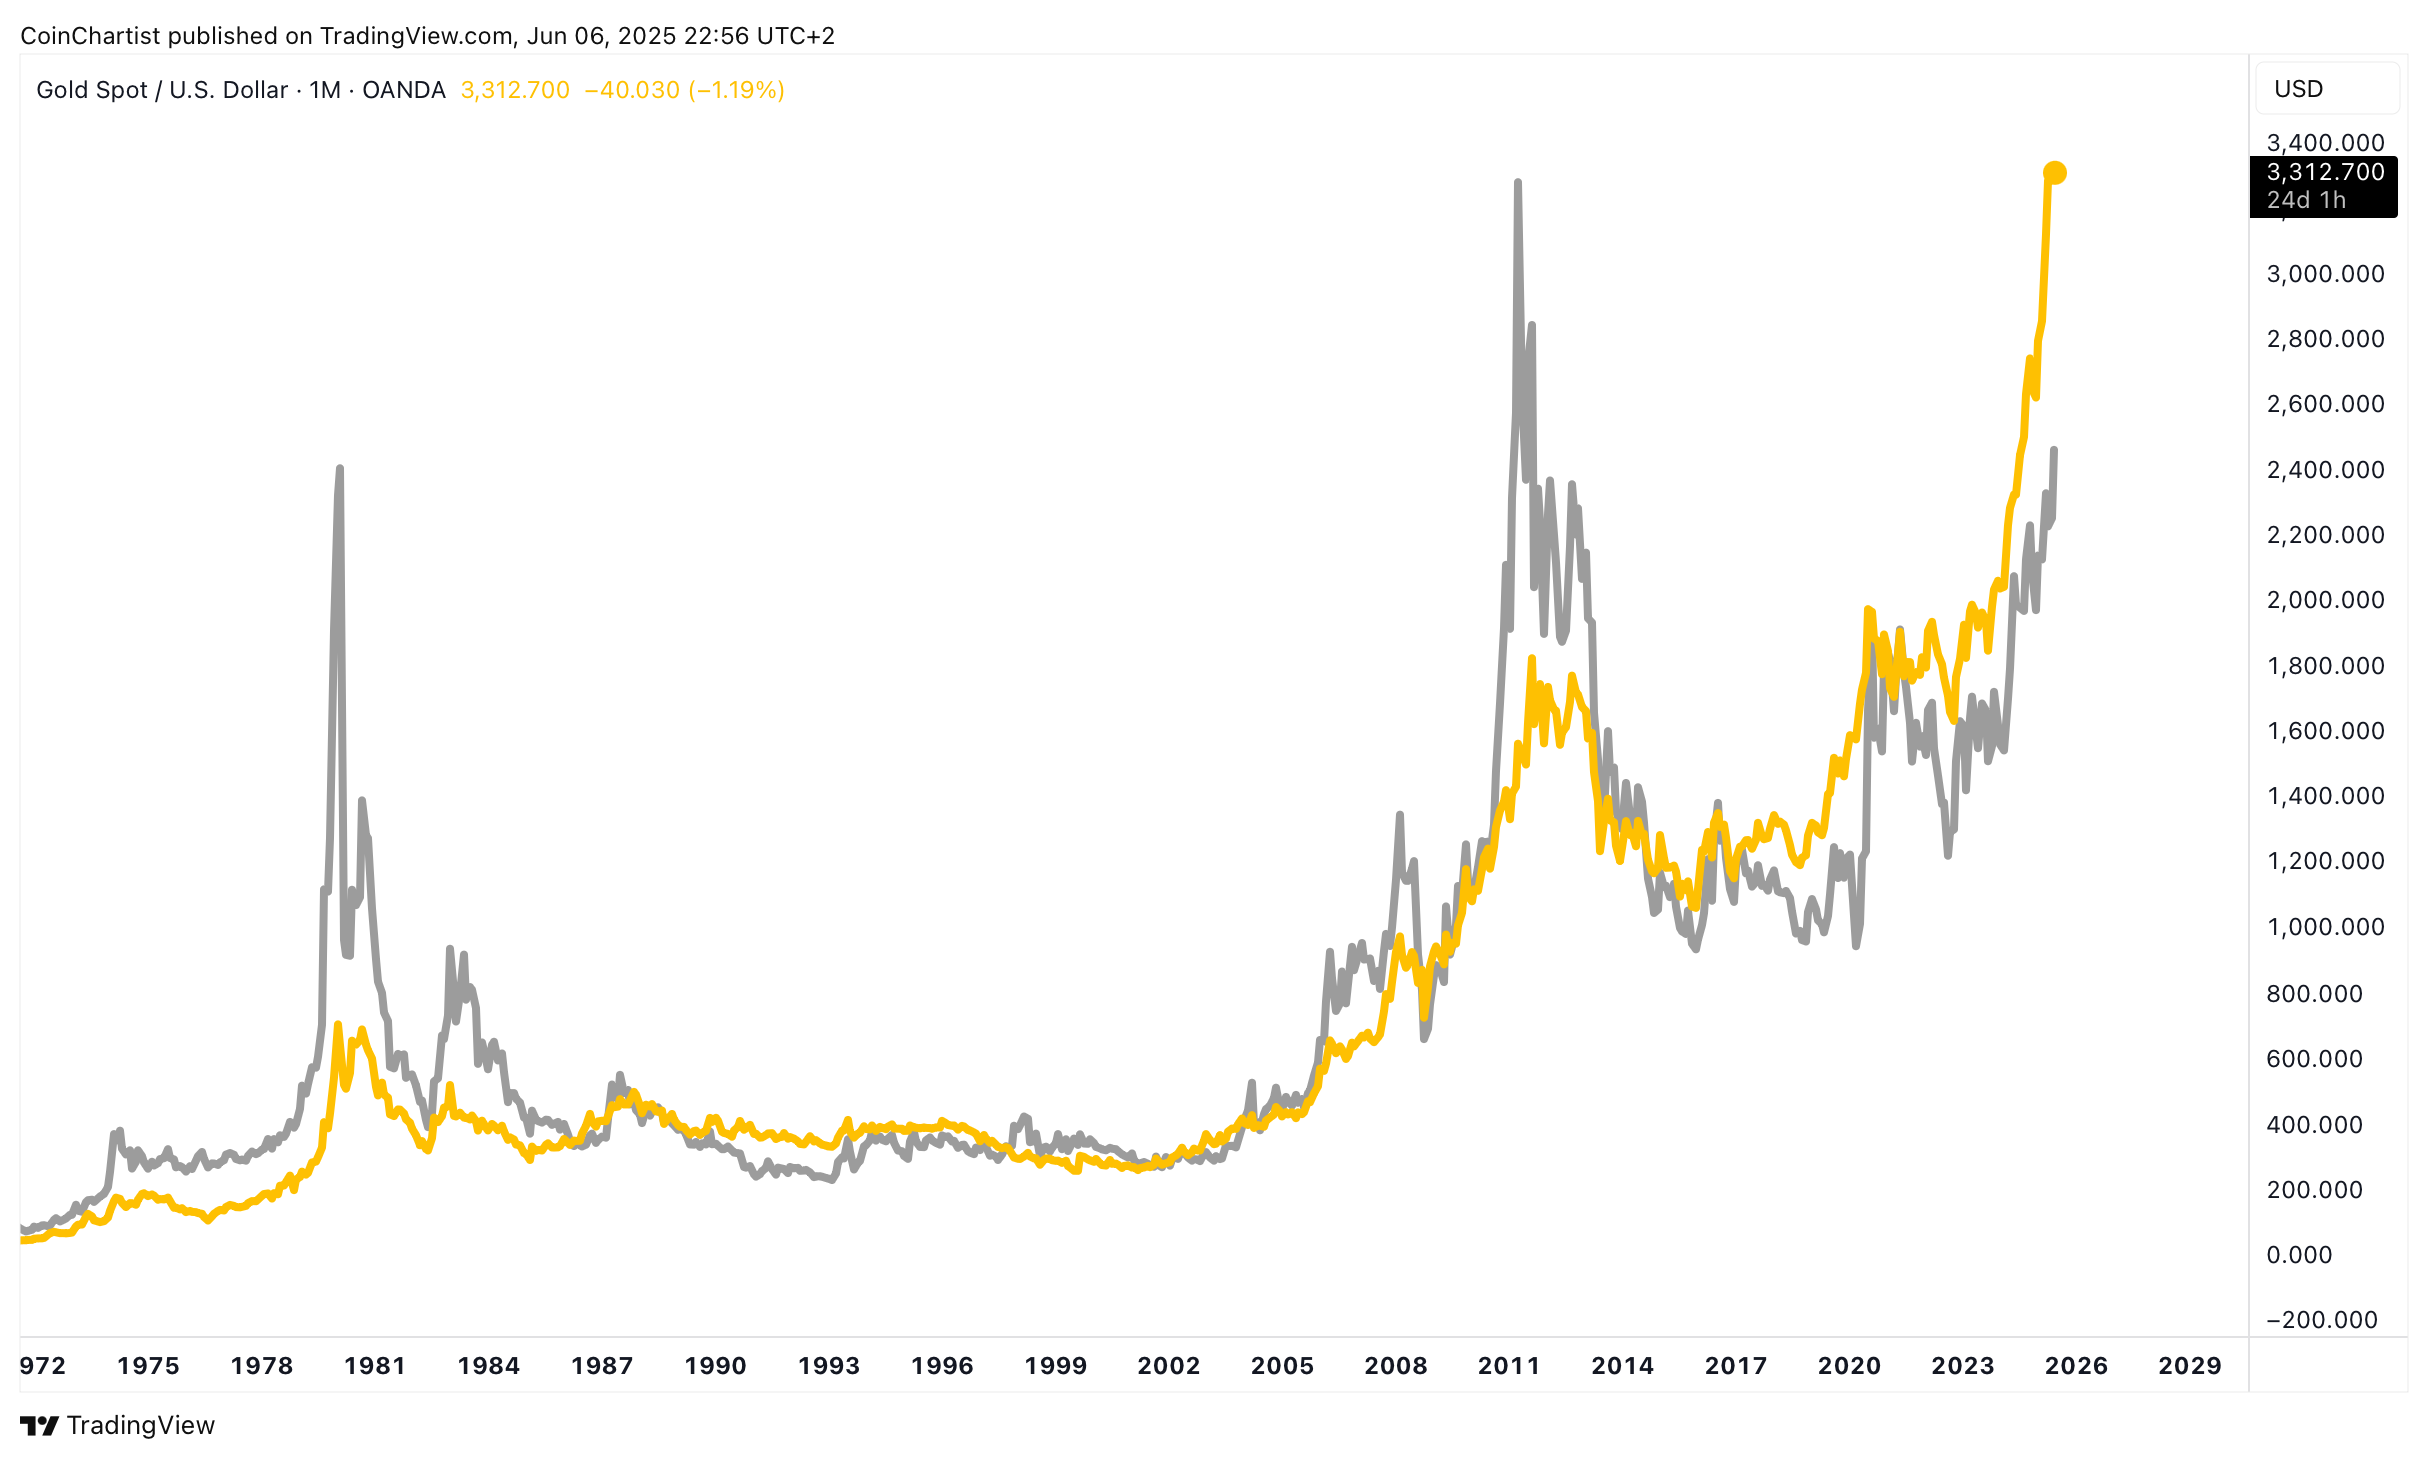
Layering Silver over Gold’s line chart, we can see that Silver always vastly outperforms Gold, and is starting to play catch up now. Realistically, Silver could have a 5-10x in it. If we don’t get an altcoin season in crypto, look at Silver’s run as an altcoin season in Precious Metals.
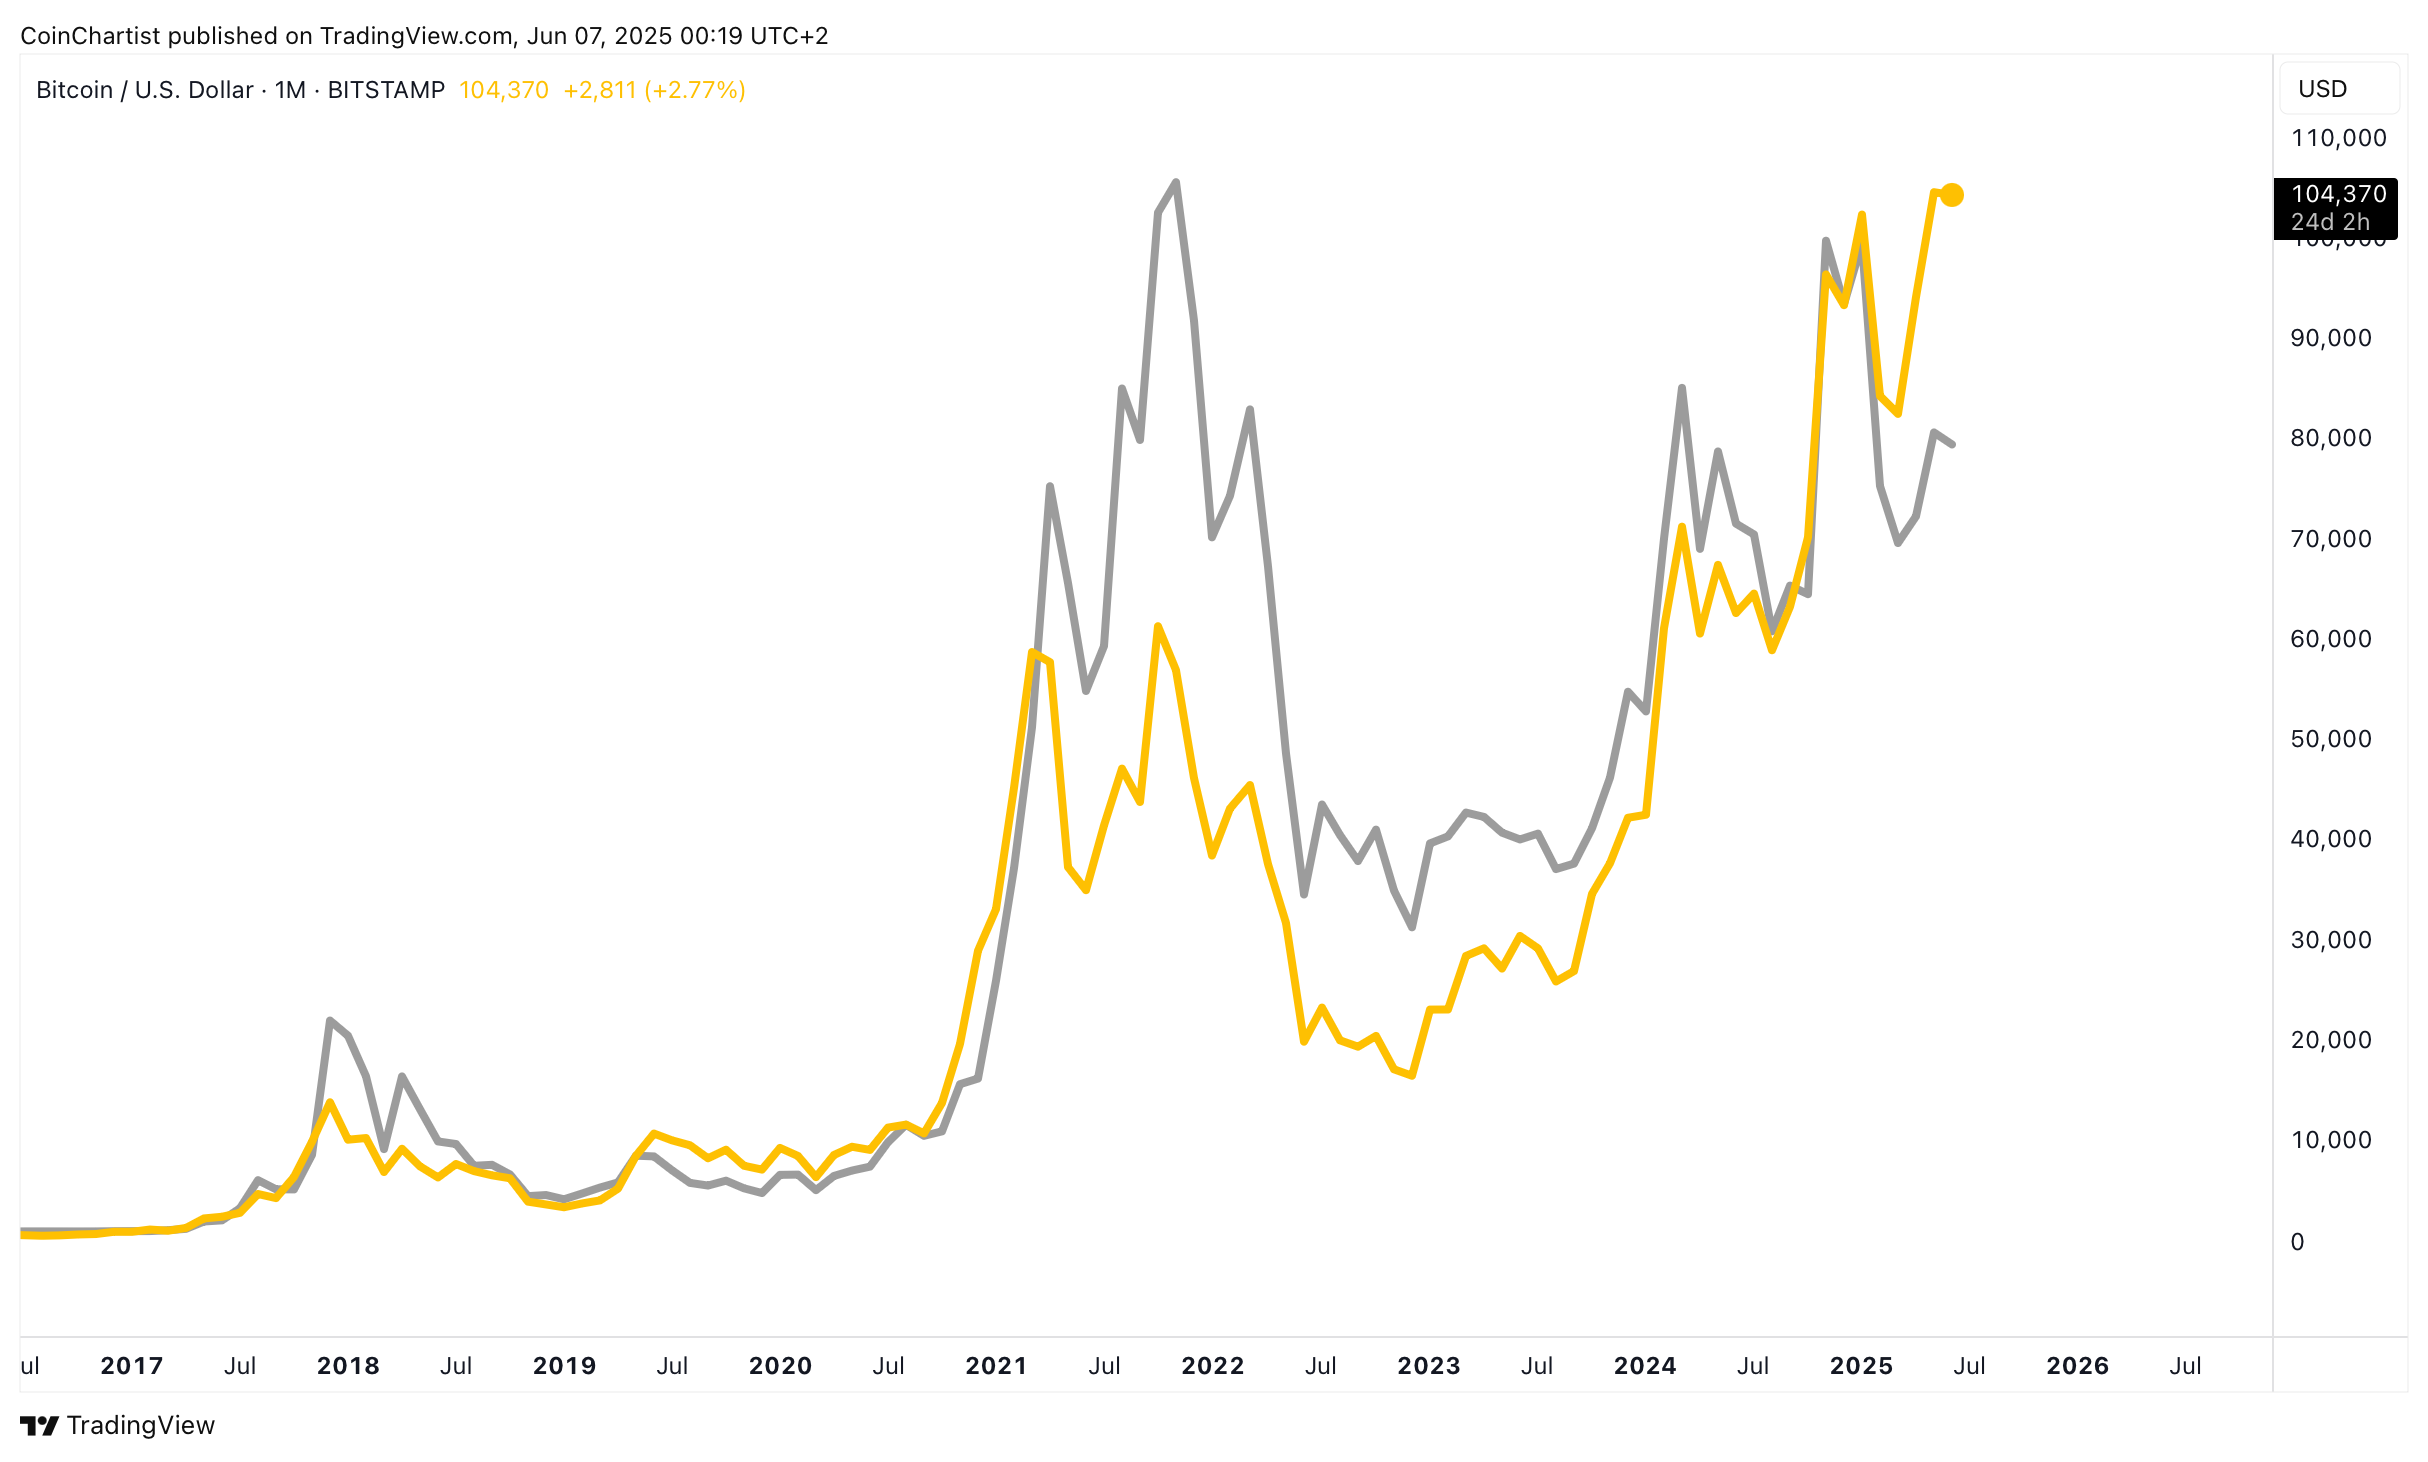
To ensure I am remaining unbiased in my approach here, I do want to still highlight Bitcoin versus TOTAL2. Much like Silver running after Gold and outperforming it, altcoins always rally after Bitcoin and outperform it. The same could be true, it’s just the technicals and the risk and macro environment suggest otherwise. But anything can happen and we all (including me) need to remain flexible to any and all scenarios.
Closing Thoughts
There is no denying this cycle is very different than the past. Although crypto has witnessed some strength in Gold and Silver, it never existed during a time when there was a major secular shift towards Commodities like Precious Metals. Precious Metals performing this well is usually a major risk-off signal, and crypto – even Bitcoin – is much riskier than most other assets. Perhaps, the digital Gold narrative, scarce supply in Bitcoin is enough to help BTC perform in the same environment. And perhaps Silver starting to do well does reignite risk appetite around altcoins. But these are unprecedented times, and technicals aren’t currently supporting some type of major bullish move up, so I continue to advise caution. For me, the safest trade is Silver. I’ve been buying since the pandemic, and all of my Silver is in profit. The larger pattern target is as much as $350/oz., suggesting there’s a potential 10x in XAGUSD on the horizon. For altcoin investors weary about risk, Silver is another great alternative with a more clear technical picture. Altcoins, if we do see an altcoin season, will massively outperform Bitcoin, Silver, and Gold. Risk and reward are tightly connected, so in theory, the higher the reward, the higher the risk. If you must enter altcoins, do so only incrementally, set stop losses, and hedge your expectations. This is not 2017 when no one knew what crypto was. This is not 2021 with a seemingly unlimited supply of liquidity from quantitative easing. This is 2025, and it’s a very different beast. Remember, you can always make more money with your capital if you miss out on some gains. If you lose your capital, it’s gone and you can’t as easily get it back.
Thank you for being a CoinChartist VIP premium subscriber.
Remember to leave a comment, hit like, or restack this content.
Please feel free to contact us with any issues or inquiries by emailing coinchartist@gmail.com.
-Tony “The Bull” Severino, CMT
Thanks for another great edition, Tony.