

Bull Trap
A bull trap is the result of lingering hope. When hope is lost, true panic sets in.

Disclaimer: The information provided in this Substack newsletter is for general informational purposes only and should not be considered as financial advice. Investing involves risk, and past performance is not indicative of future results. Please conduct your own research or consult a financial advisor before making any investment decisions. The newsletter disclaims any liability for losses or damages arising from the use of this information.
Bull Trap overview:
Every Bitcoin bear market has a major bull trap moment – could that moment be here?
Comparing past BTCUSD bear market structures and post-trap drawdowns
Why weekly technicals support a bull trap setup
Explaining the psychology that occurs during a bull trap – and why it is especially demoralizing to bulls
Bitcoin Dominance shows a bull trap setup also – but it doesn’t mean altcoin season is ahead
Altcoin market (OTHERS) cyclical analysis suggests this entire cycle may have been a larger degree bull trap – if true, what happens next?
NOTE: The next issue will be my 2026 preview which will extensively discuss the two paths Bitcoin could take when it finds a bottom. One theory points to the worst and longest bear market in history, while the other points to a renewed super cycle in Bitcoin. Cyclicality leaves little room for in-between scenarios, making the next several months critical for the longer-term trajectory of Bitcoin and cryptocurrencies.
In the meantime, indicators and sentiment suggest that Bitcoin is in the early stages of a bear market. The speed (rate of change) and intensity of the drop has brought out the bears and shaken bulls. Price fell over $40,000 in less than two months. But it also fell precisely to a level that holds onto hope – the worst emotion you can feel when investing and trading.
From a market structure perspective, if Bitcoin bounces here it made another higher high and higher low. This is the definition of an uptrend. That alone is significant for bulls clinging to hope. This hope is the main ingredient necessary for a bull trap. Sprinkle in a key psychological level like $100,000 and you have another major component in the recipe. I’ll cover the rest of the psychological and structural ingredients that increase the probability of a bull trap. This issue also compares past bull traps and how technicals are slightly shifting over time, which could be telling us what might happen if we do get a bull trap here.
The Anatomy of a Bitcoin Bull Trap
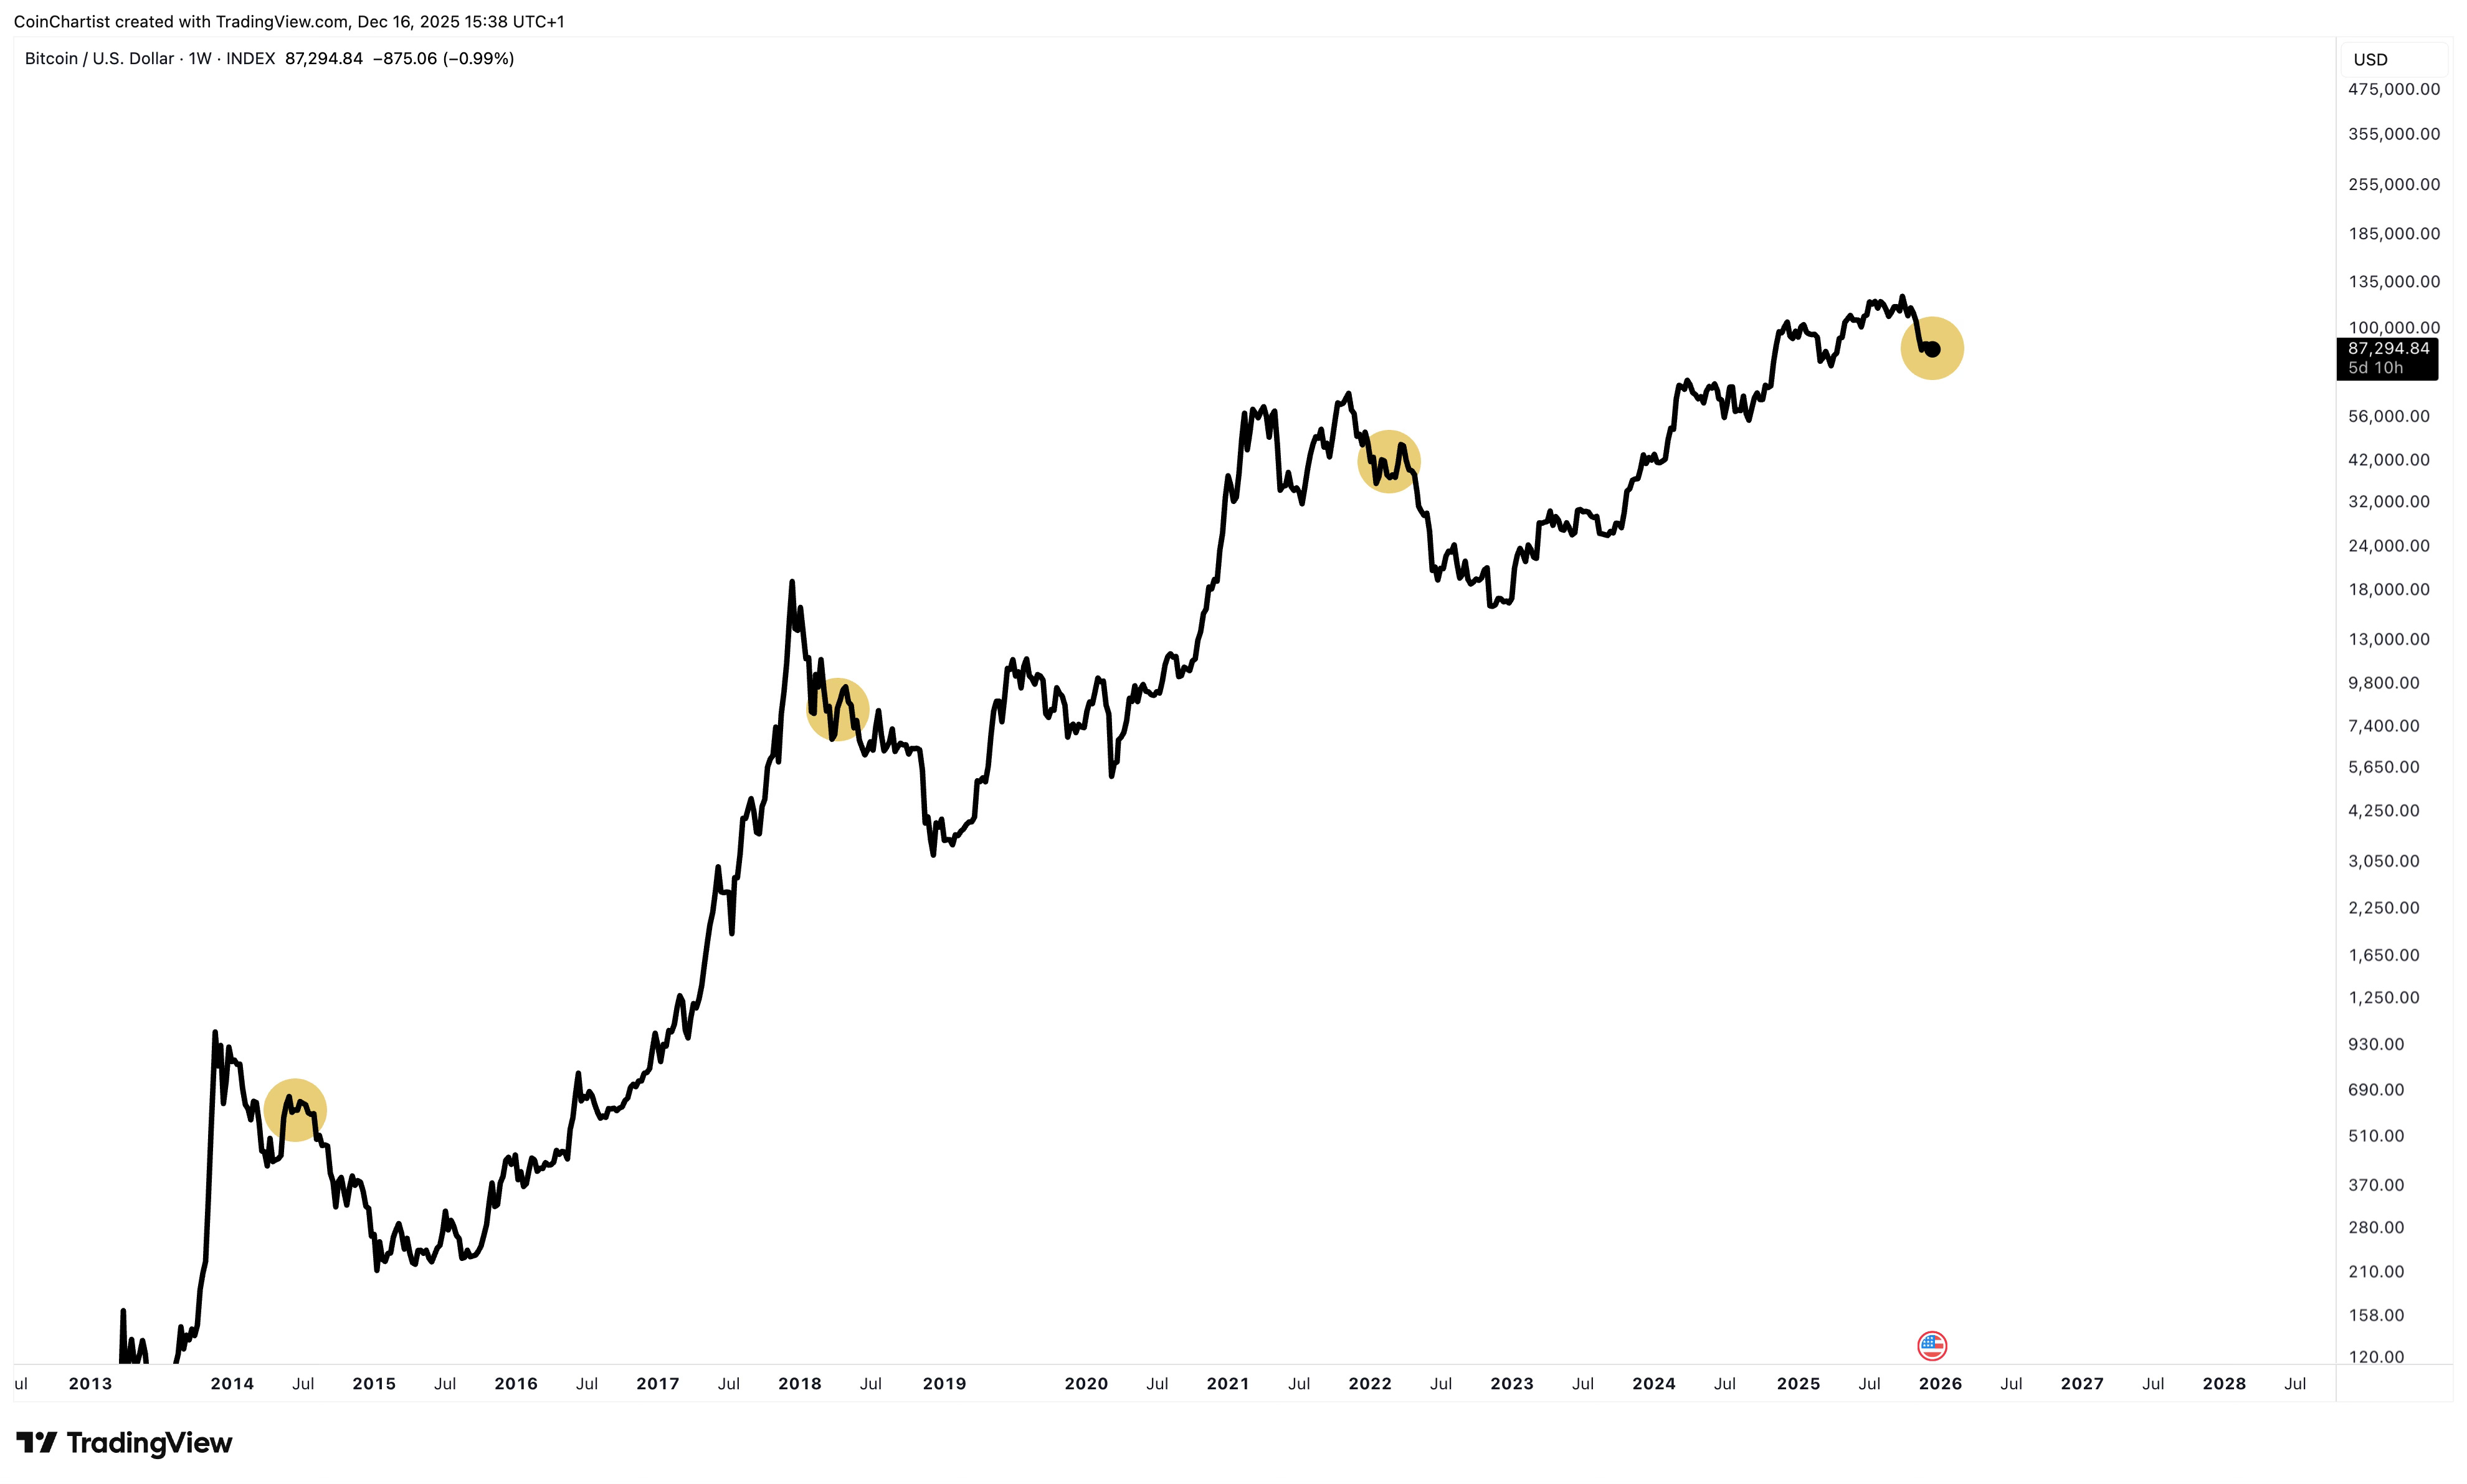
What you are looking at is the complete history of major bull traps in Bitcoin, highlighted in gold. These weren’t your typical dead cat bounces – these were bigger bull traps that gave the impression of a recovery. When the recovery fails, capitulation quickly follows. That’s what’s at stake here. And the recovery, if it does indeed fail, also offers the last chance to sell BTC as close to $100,000 as possible before new lows are made.
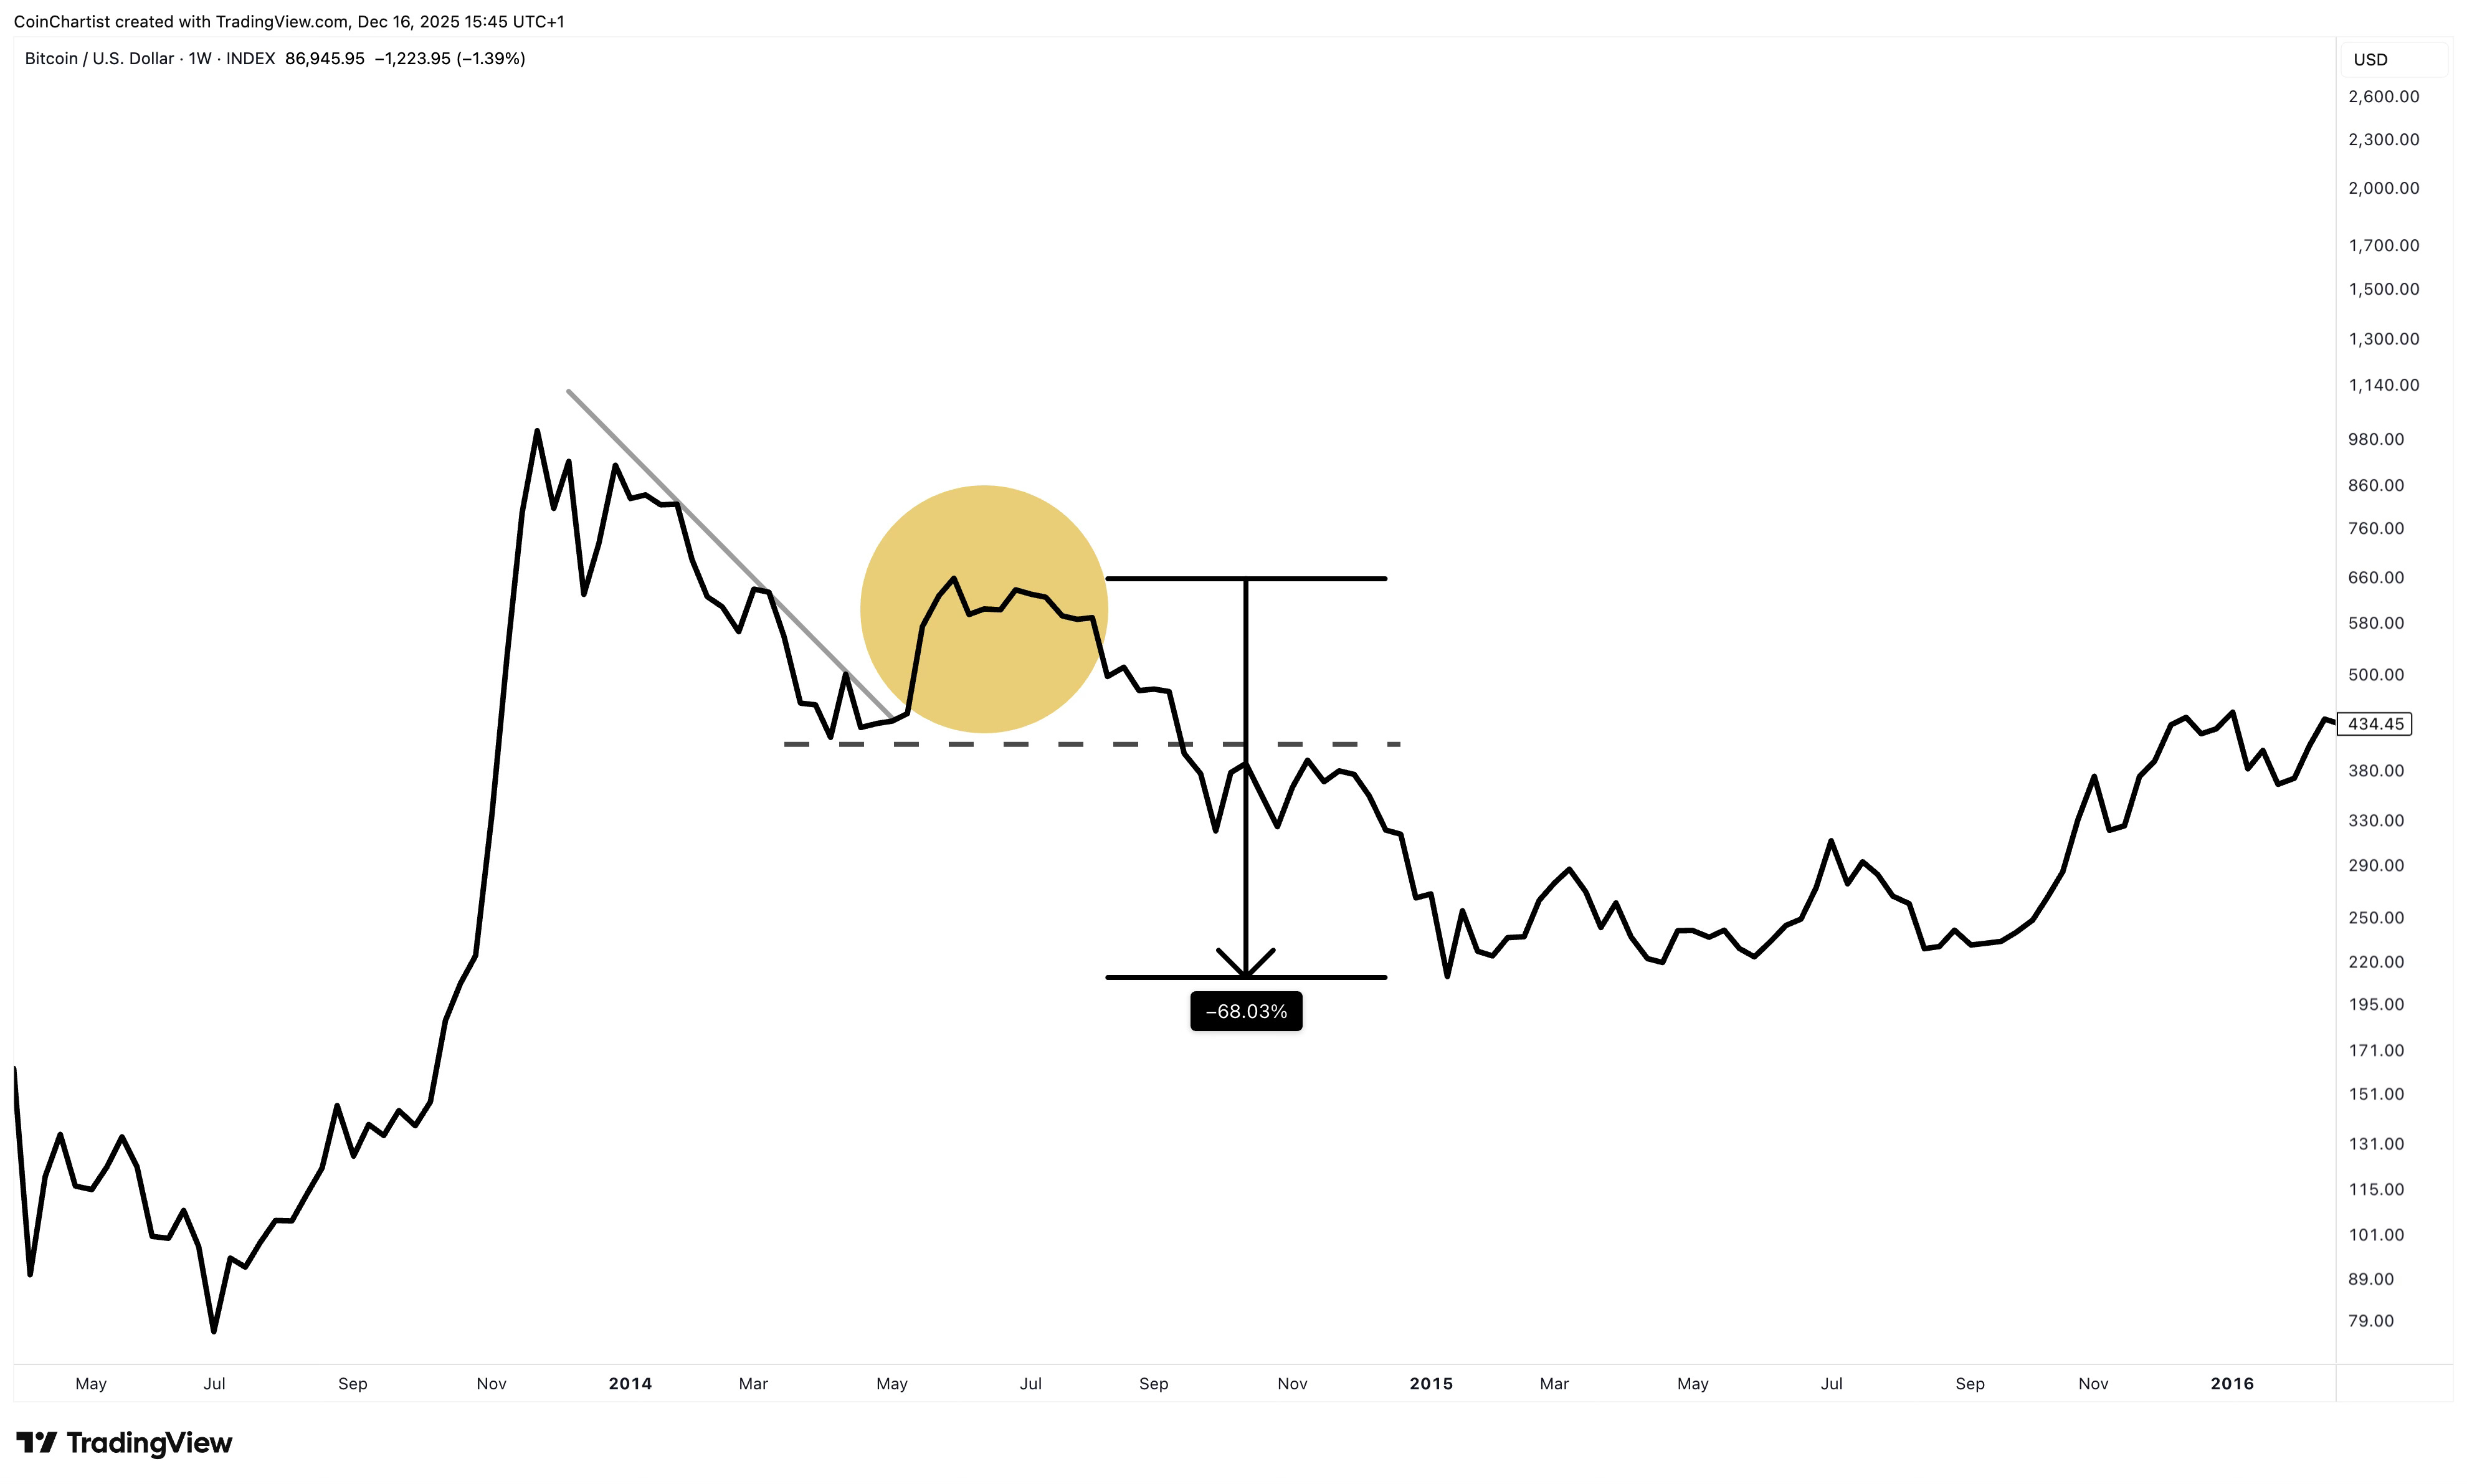
After the peak in 2013’s bull market, BTC dropped by 70% in 2014. It found temporary horizontal support at around $400. It then broke out of a downtrend line and bounced by 99%. Almost doubling in price definitely gave the impression of “we’re so back,” not “new lows are ahead.” A nearly 100% gain likely sucked a large number of hold-outs back in because that’s a significant gain usually more associated with bull markets. When $400 broke down, BTC fell another 68% before bottoming.
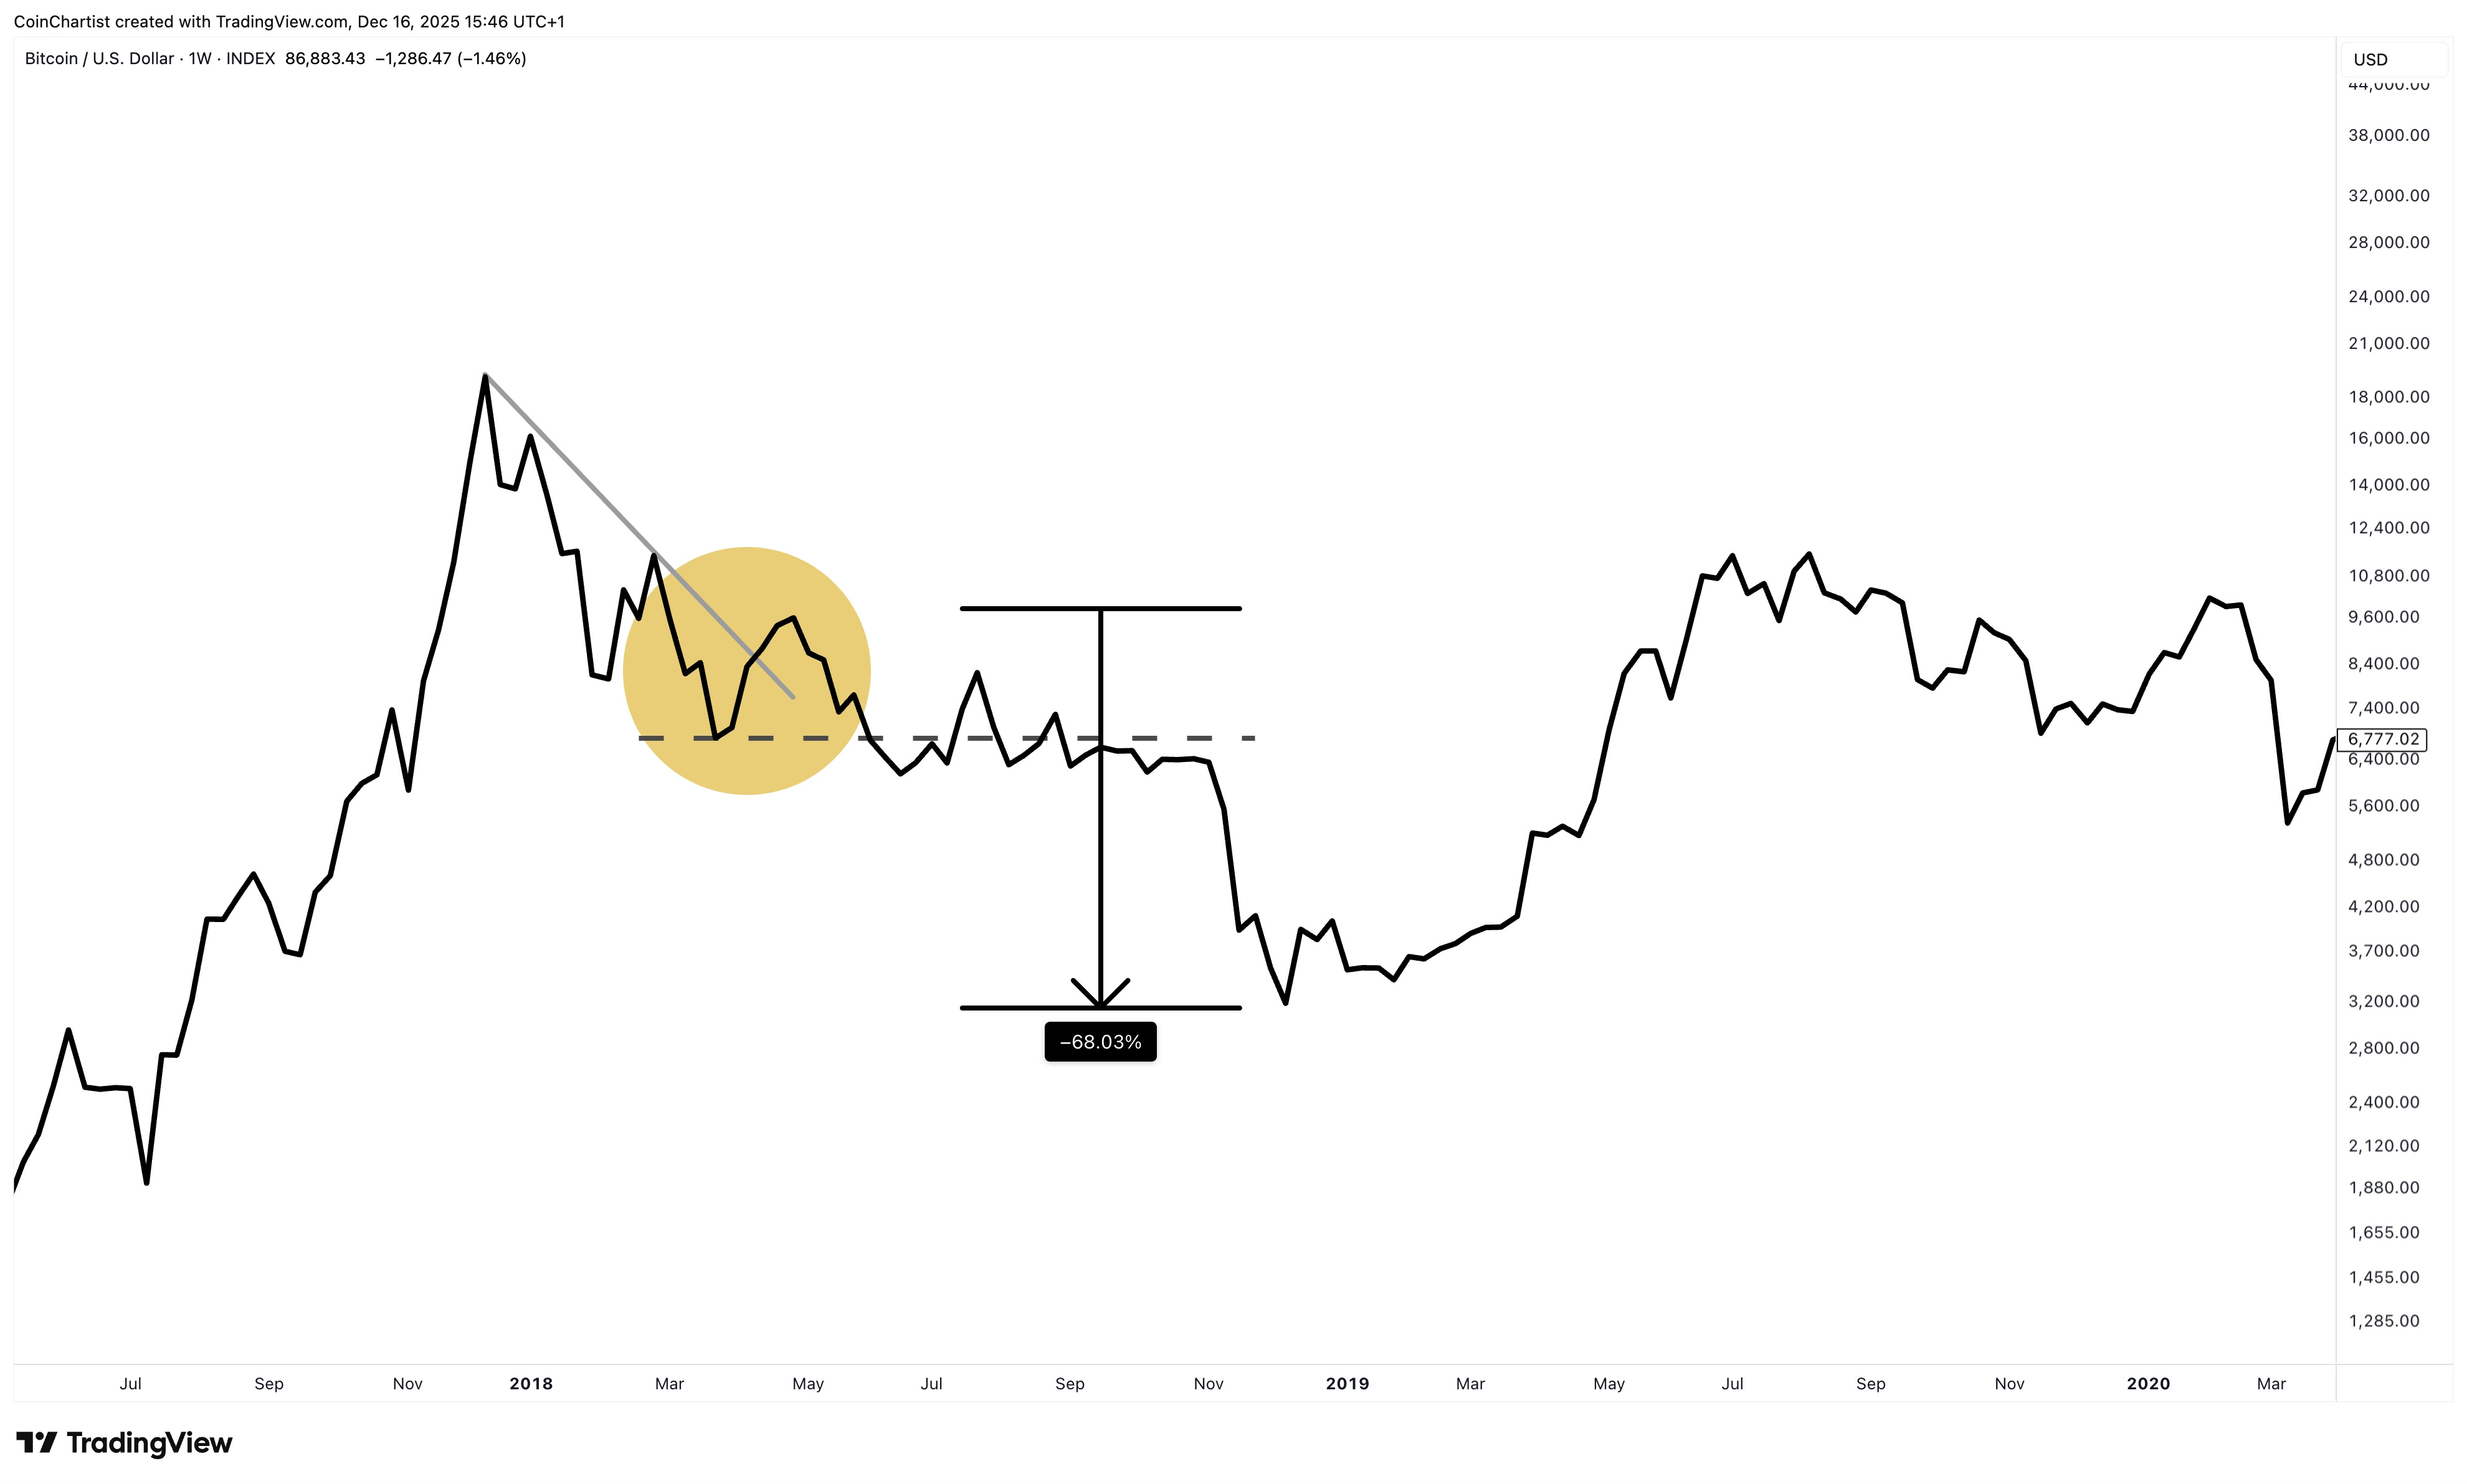
In 2018, there were actually several bull trap-like moves. Sentiment gyrated between panic and hope. The biggest bull trap, however, fit the same conditions as the rest. The $6,000 support established from the initial bounce acted as the floor for many subsequent bounces and failures to make a higher high. Over time, support became resistance and the market immediately capitulated after realizing the $6,000 price floor was lost. Price broke out from a downtrend line which tricked many investors and traders into thinking a new trend was beginning. BTC only rose by 55% during this bull trap, but at the time the idea of a recovery was very believable.
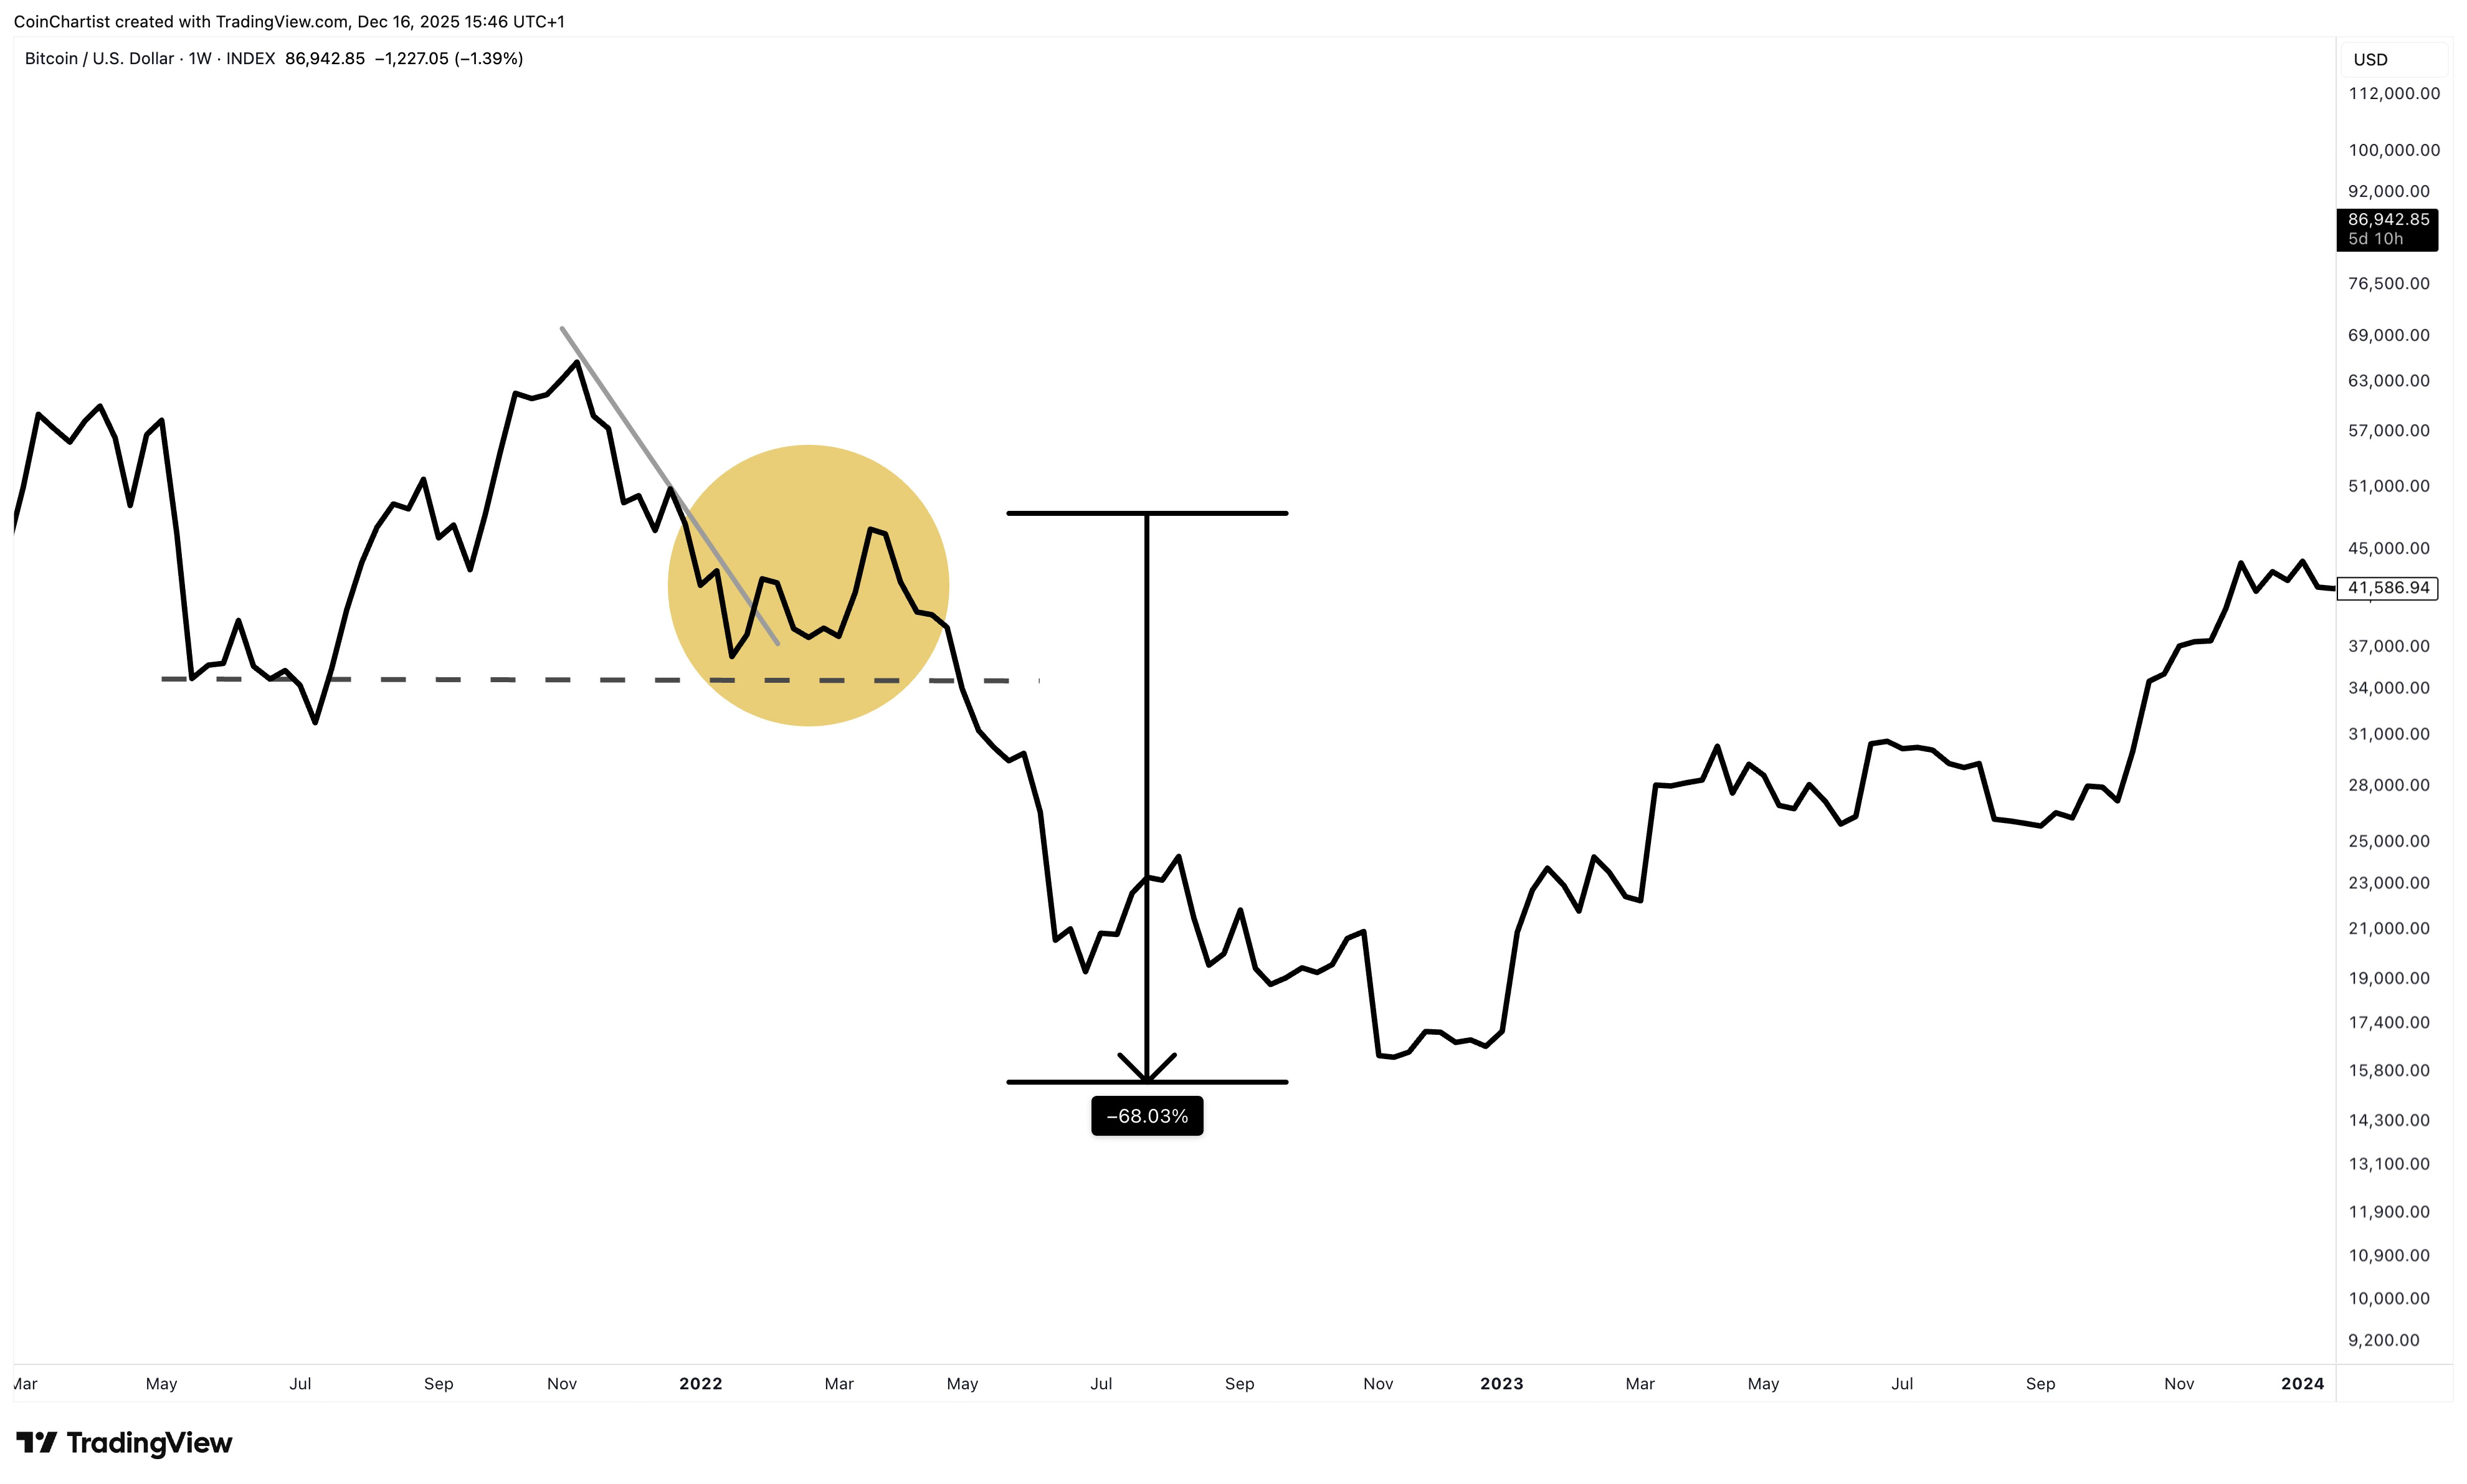
In 2021, Bitcoin put in a temporary low, followed by a higher high before beginning a deeper downtrend in 2022. Price then retreated once again right above the prior temporary low, giving the impression of a foundational higher high being built. The bounce regained 45% of what was lost on the way down, making the move feel even more like a recovery. However, price support between $30,000 and $40,000 was later cut through like a knife, triggering capitulation across the crypto market. This dealt double the psychological blow to the market smashing through two levels in one sharp move.
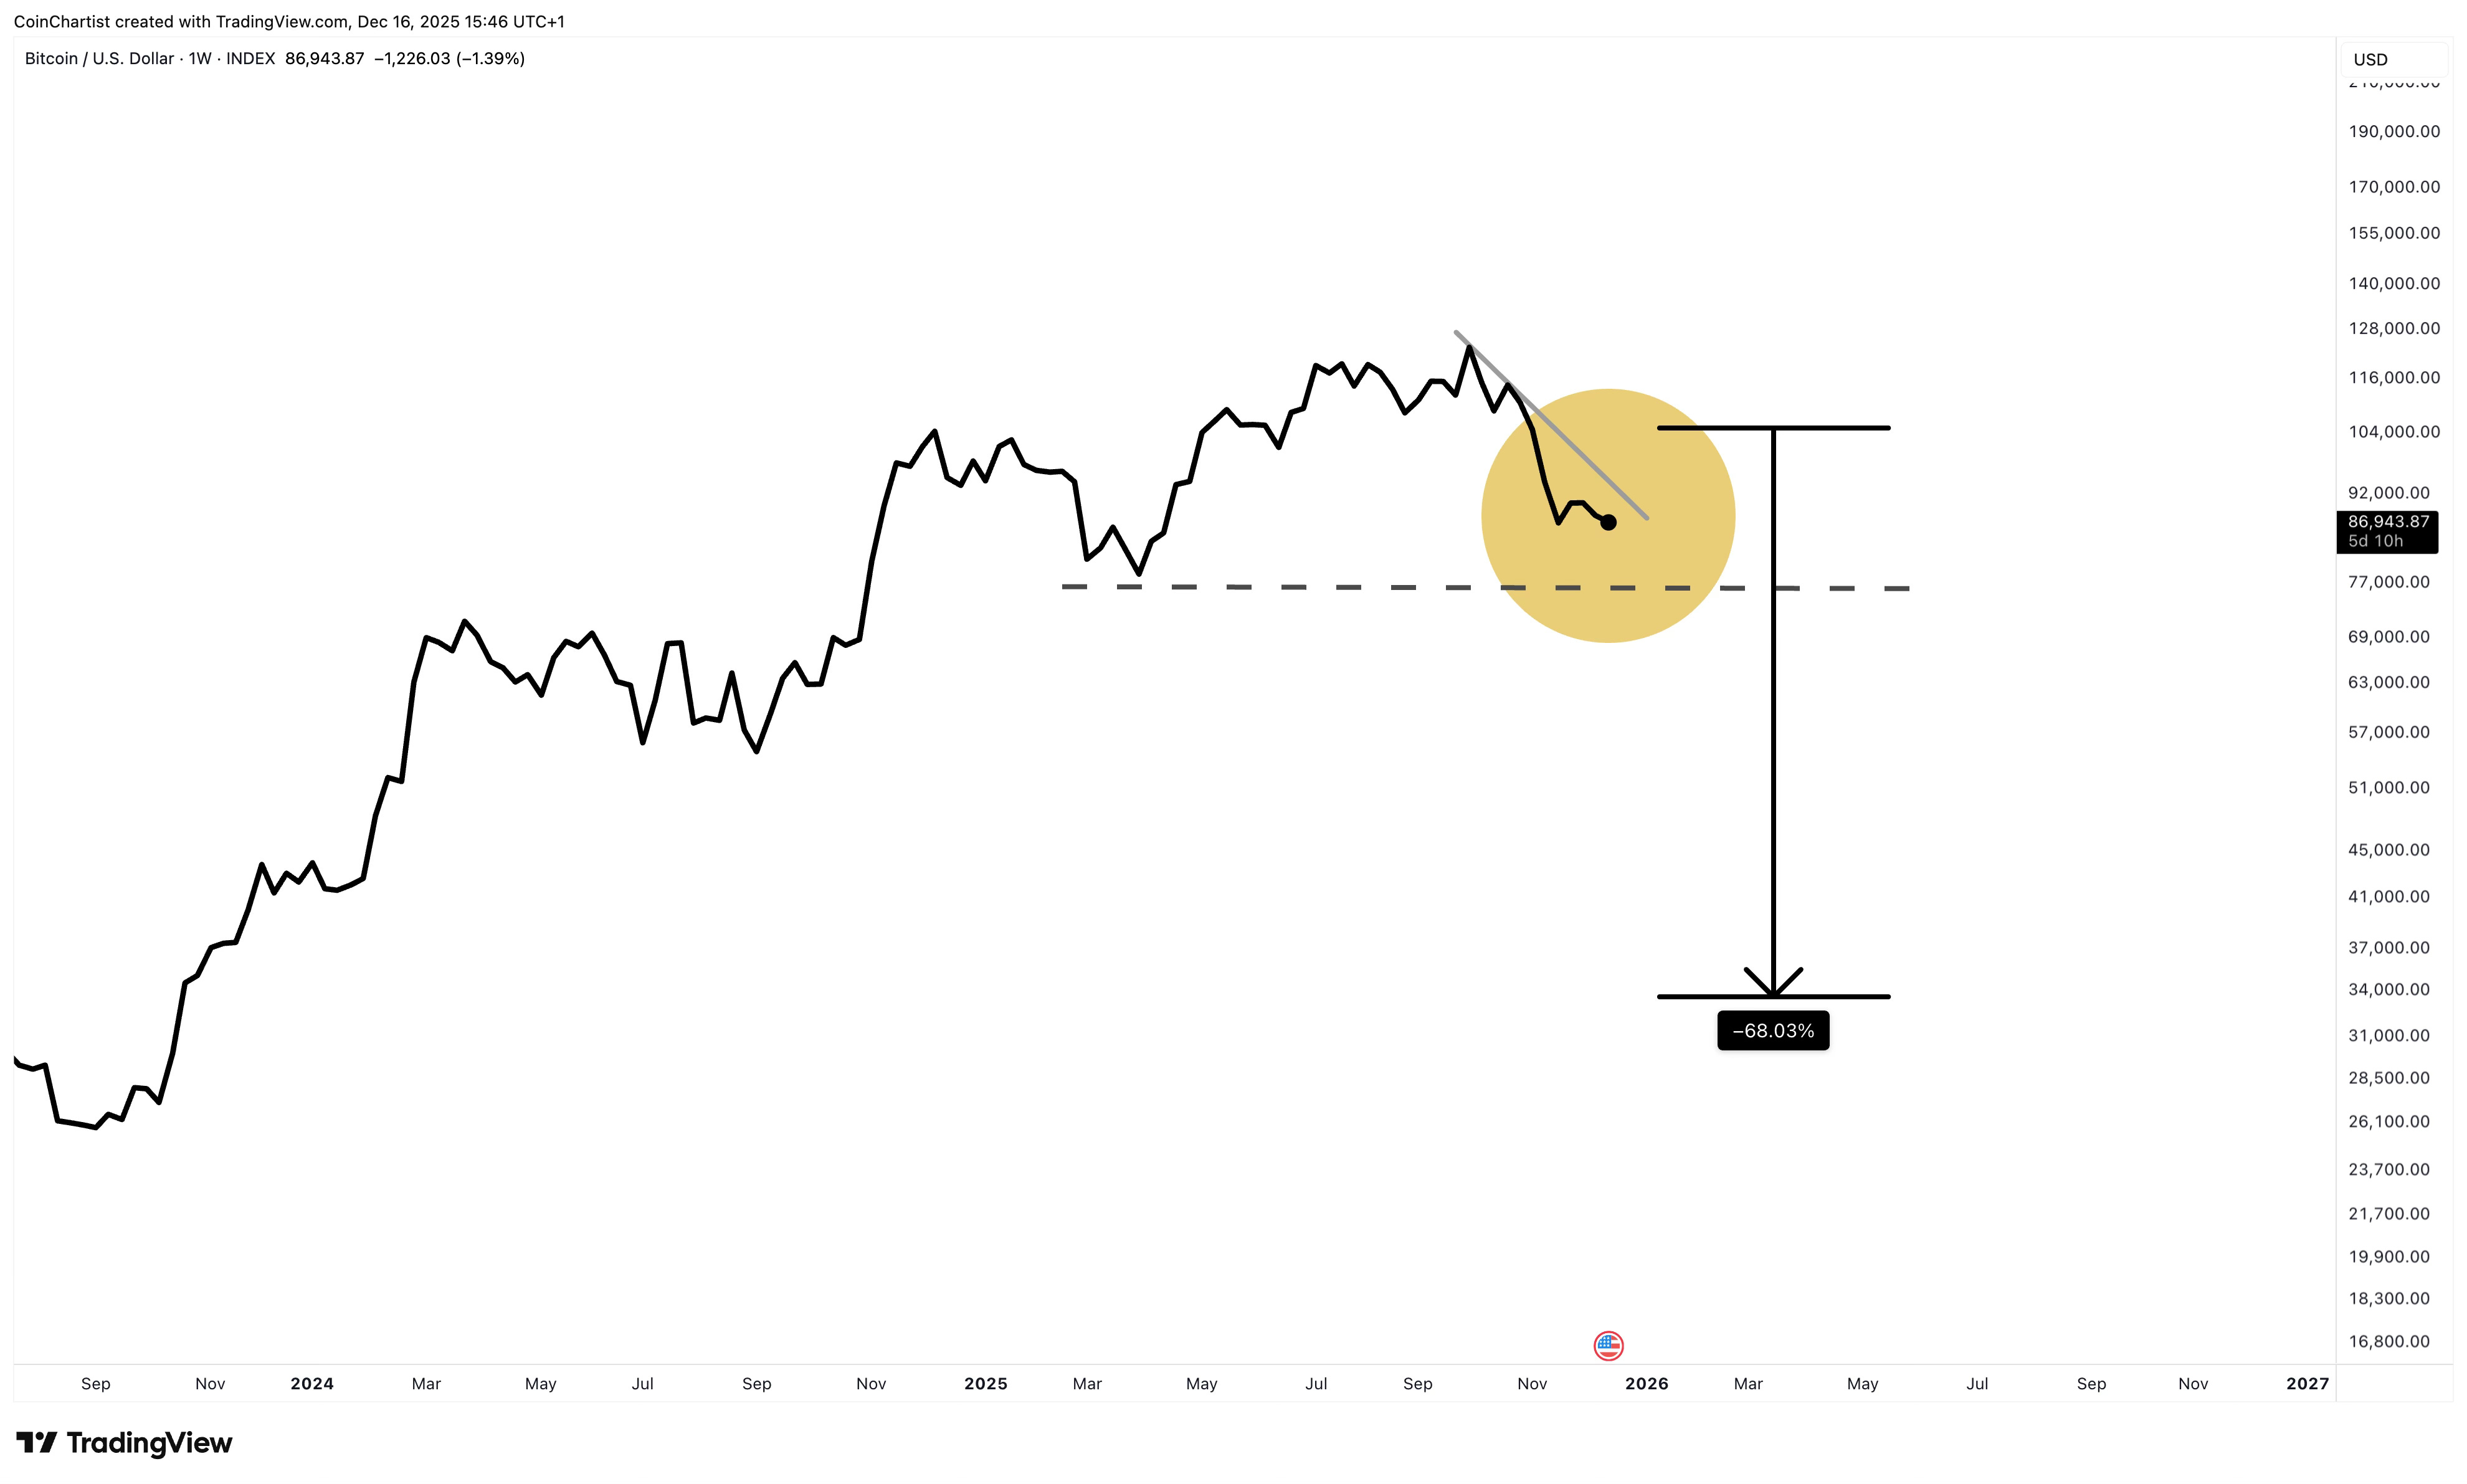
This chart is a simple diagram speculating on what a bull trap might look like. It is difficult to call out a specific level price might revisit. $100,000 is the most important level psychologically, and I am undecided on which scenario will be more demoralizing:
Scenario A: Price moves above $100,000 and ignites the whole “we're so back” vibe across crypto, adding to the hope and emotional state of the market. Above $100,000 might also incite more FOMO, sucking in even more bulls.
Scenario B: Price doesn’t even make it above $100,000. This could be even more demoralizing when price turns around and makes a new low. The realization that $100,000 couldn’t even be reached will be a sign of weakness and cause great discomfort in those who held onto hope too long.
The signal will come from sentiment. Of course, there’s still a scenario that Bitcoin does bounce and resume a bull market. The probability is very low in my opinion, but definitely the probability is definitely not zero – there are no certainties in markets.
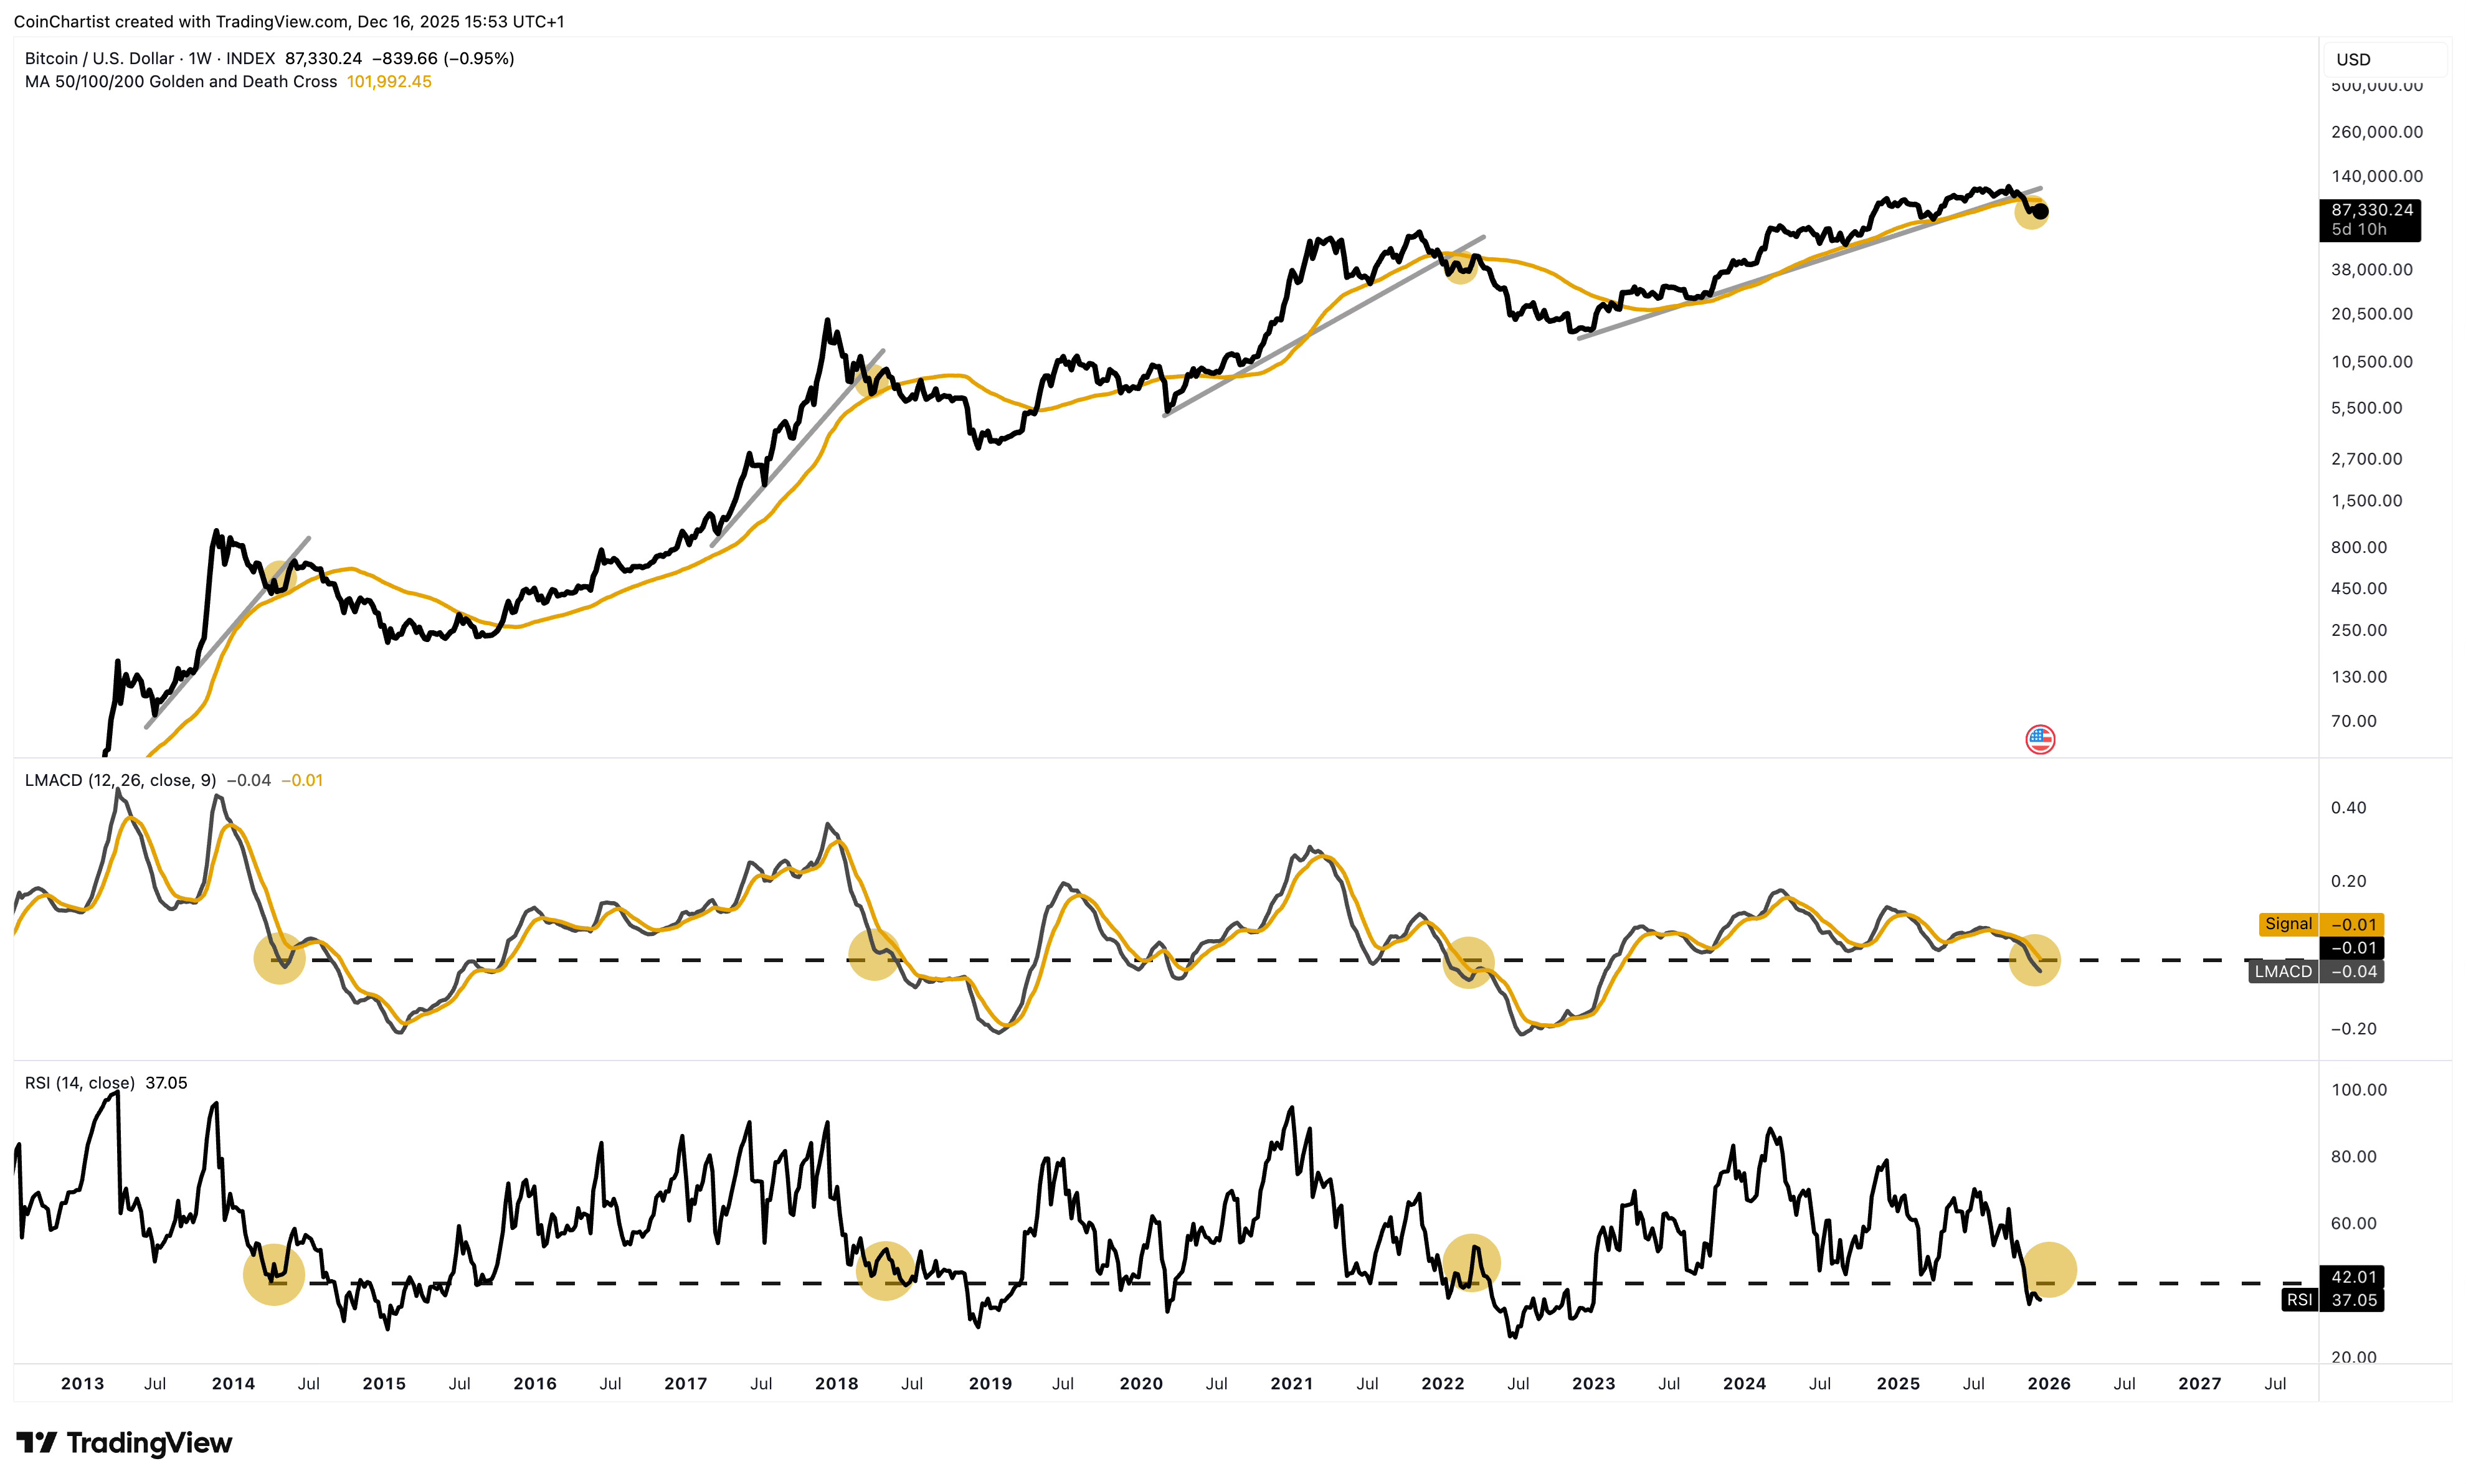
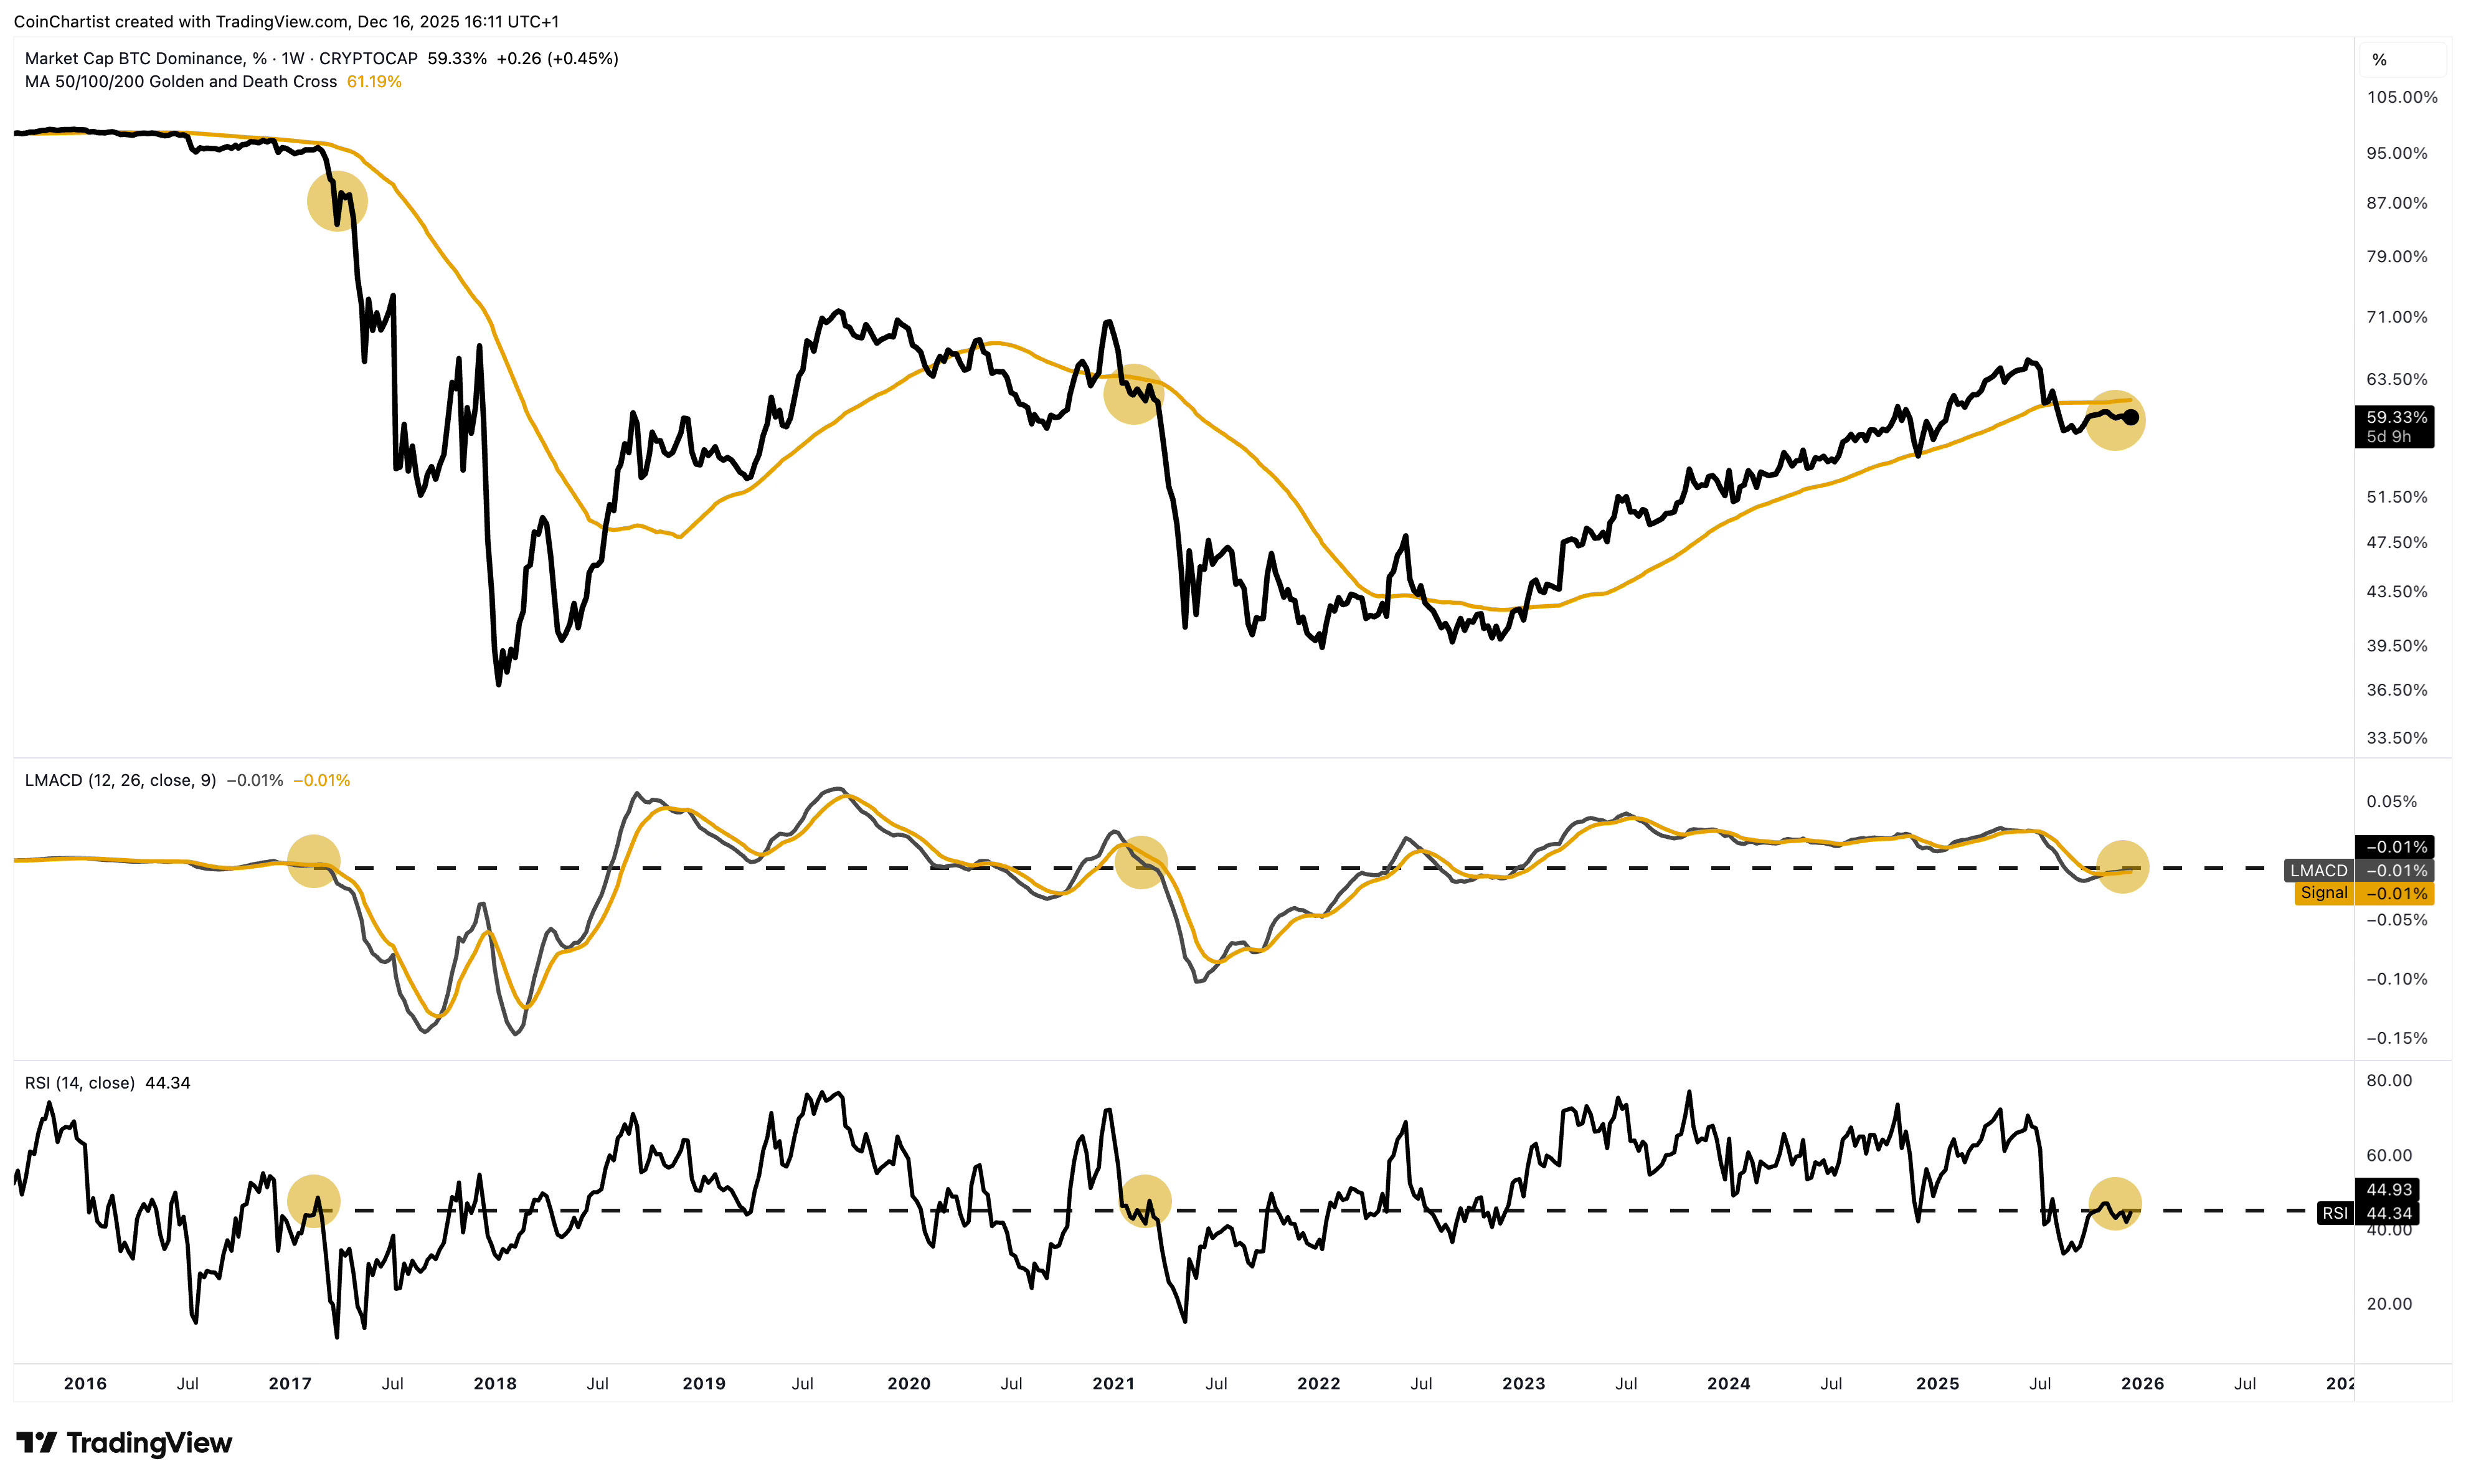
In this zoomed out view, the dashed line highlights roughly the level that all past Bitcoin bull traps happened at, per the LMACD and RSI. The bull trap usually happens when price loses the final uptrend line each cycle. It has typically involved interacting with the 50-week Moving Average. In 2014, price bounced off the MA as support. In 2018, it bounced off it, then later retested it and failed to reclaim it. In 2022, price retested it only, yet was rejected. Perhaps this time price never gets there, as Moving Averages appear to shift lower over time. The 50-week MA is currently located near $102,000 and it inches lower with each passing week we trade below it.
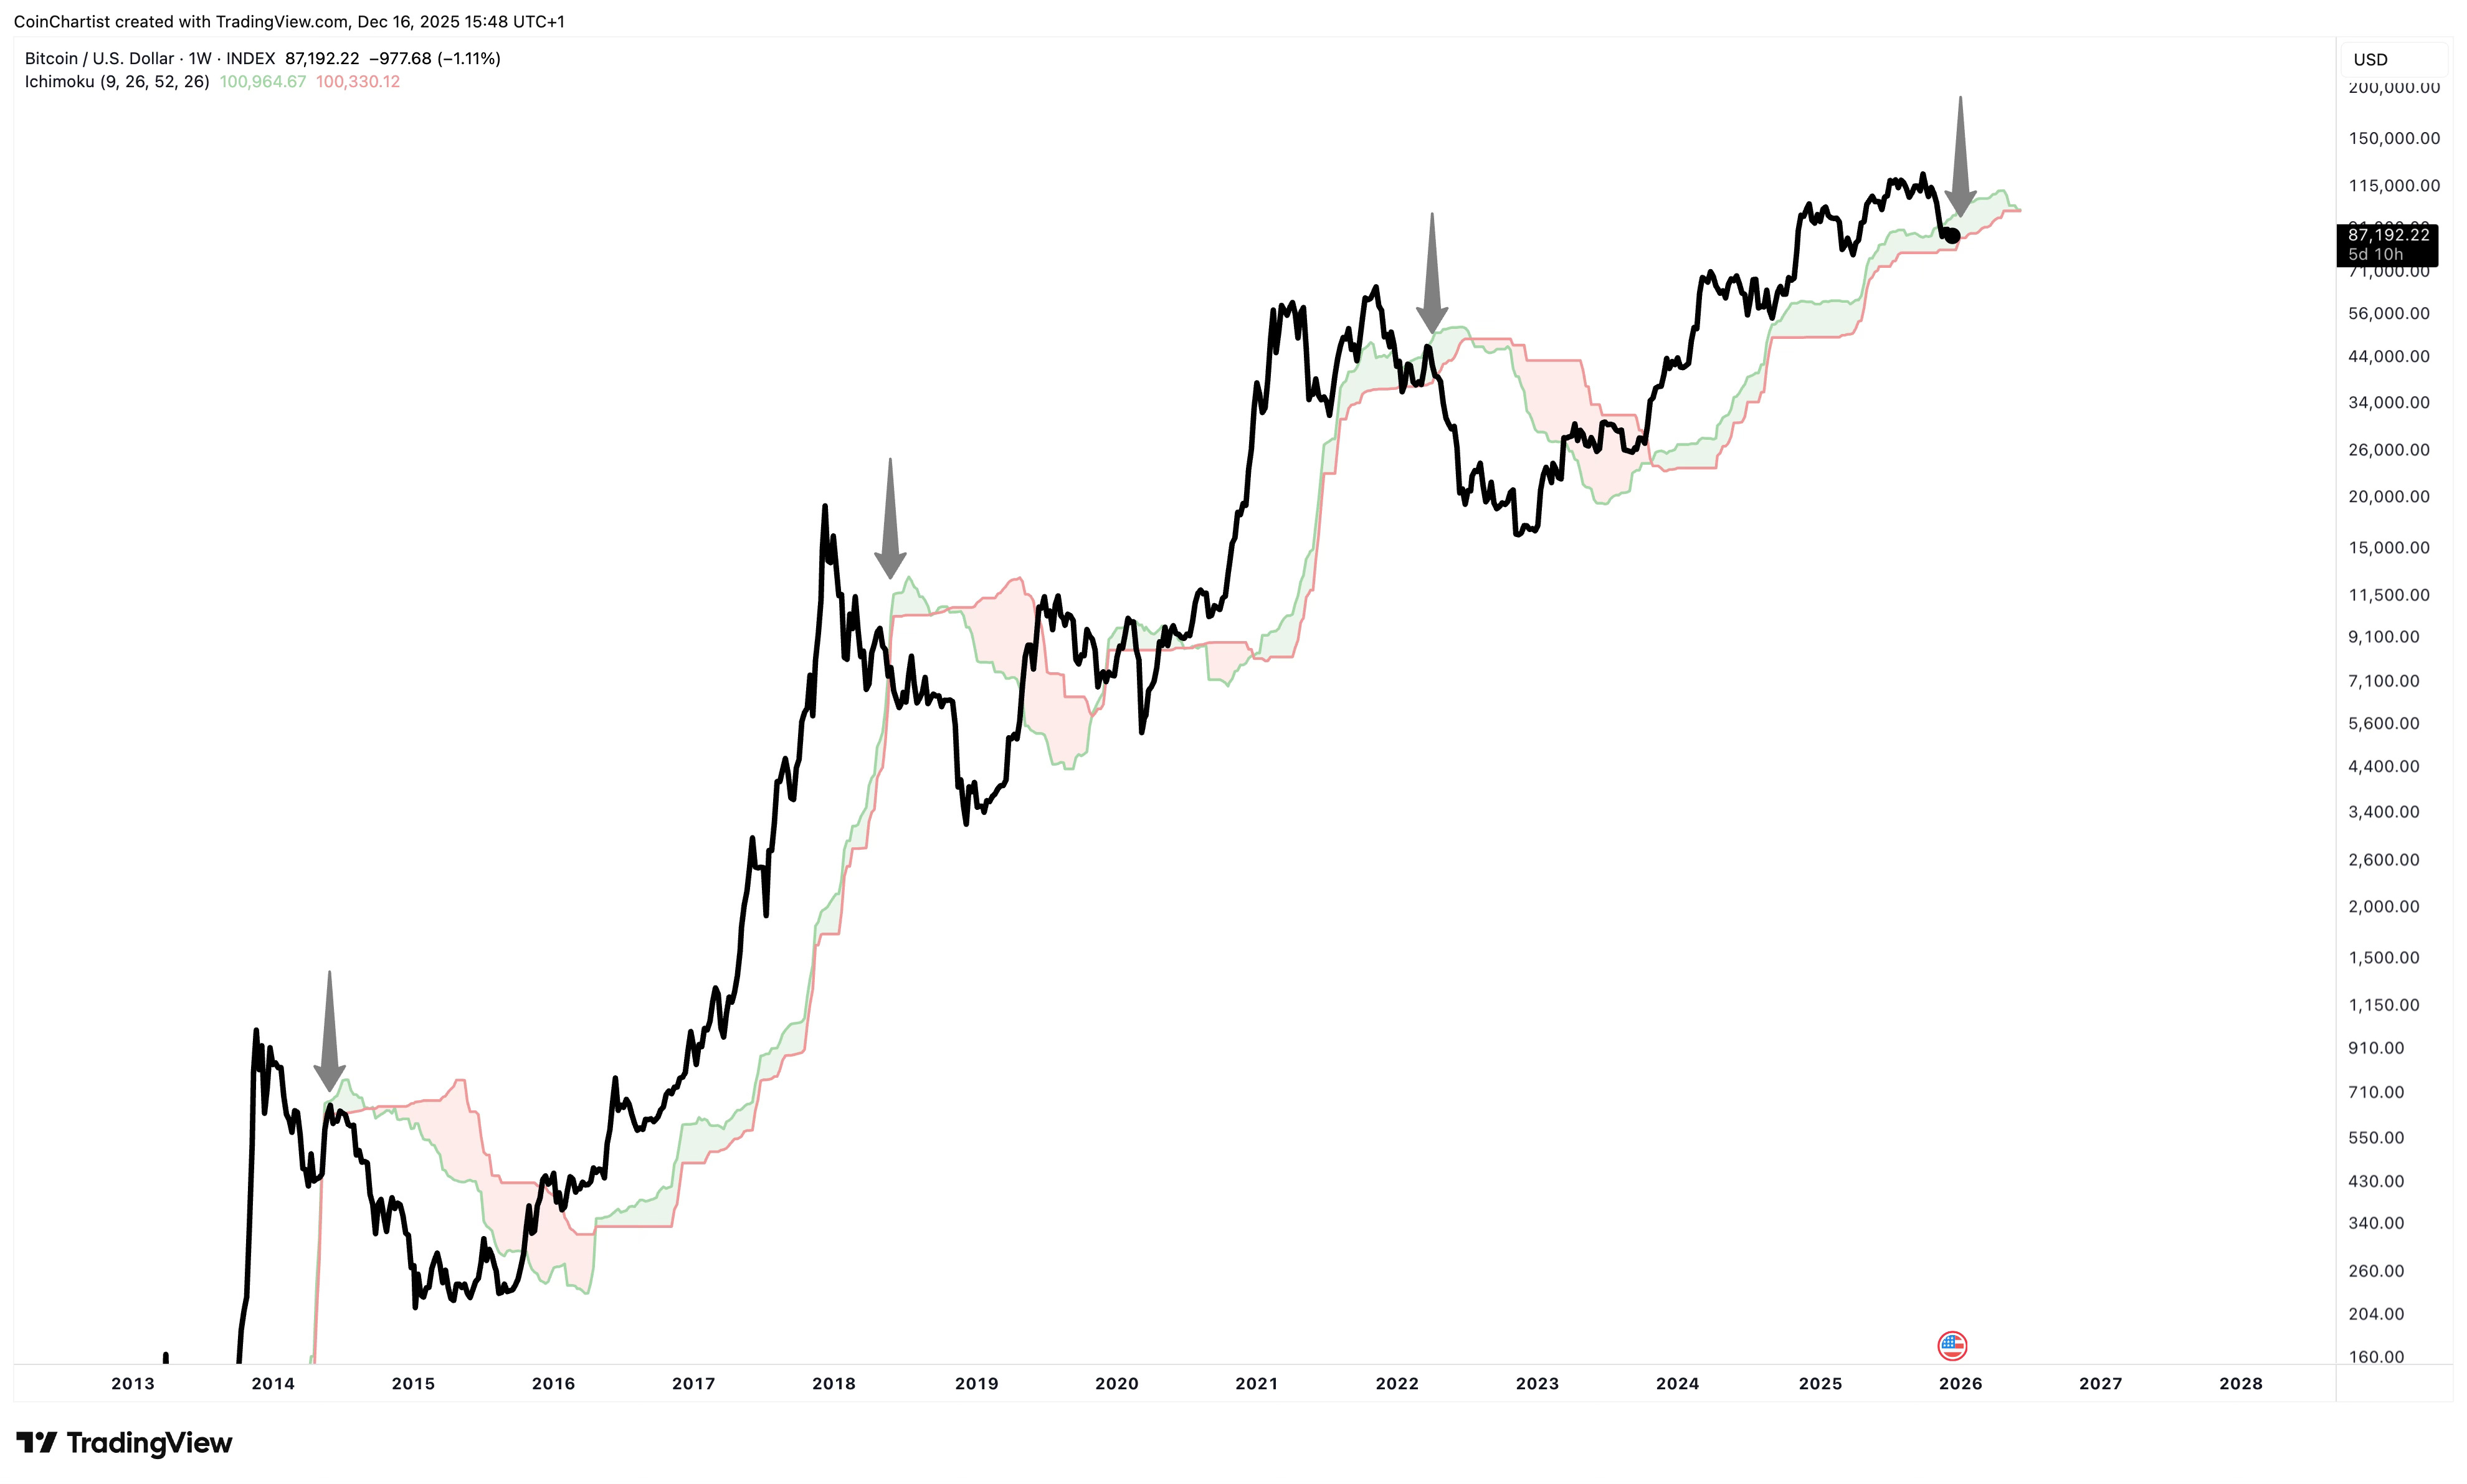
All past Bitcoin bull traps were also associated with price passing through the weekly Ichimoku cloud. BTCUSD is trading inside the cloud right now. Losing it completely usually leads to capitulation. Making it back out of the cloud triggers a bull market – so this is an important indicator to watch for bull trap confirmation.
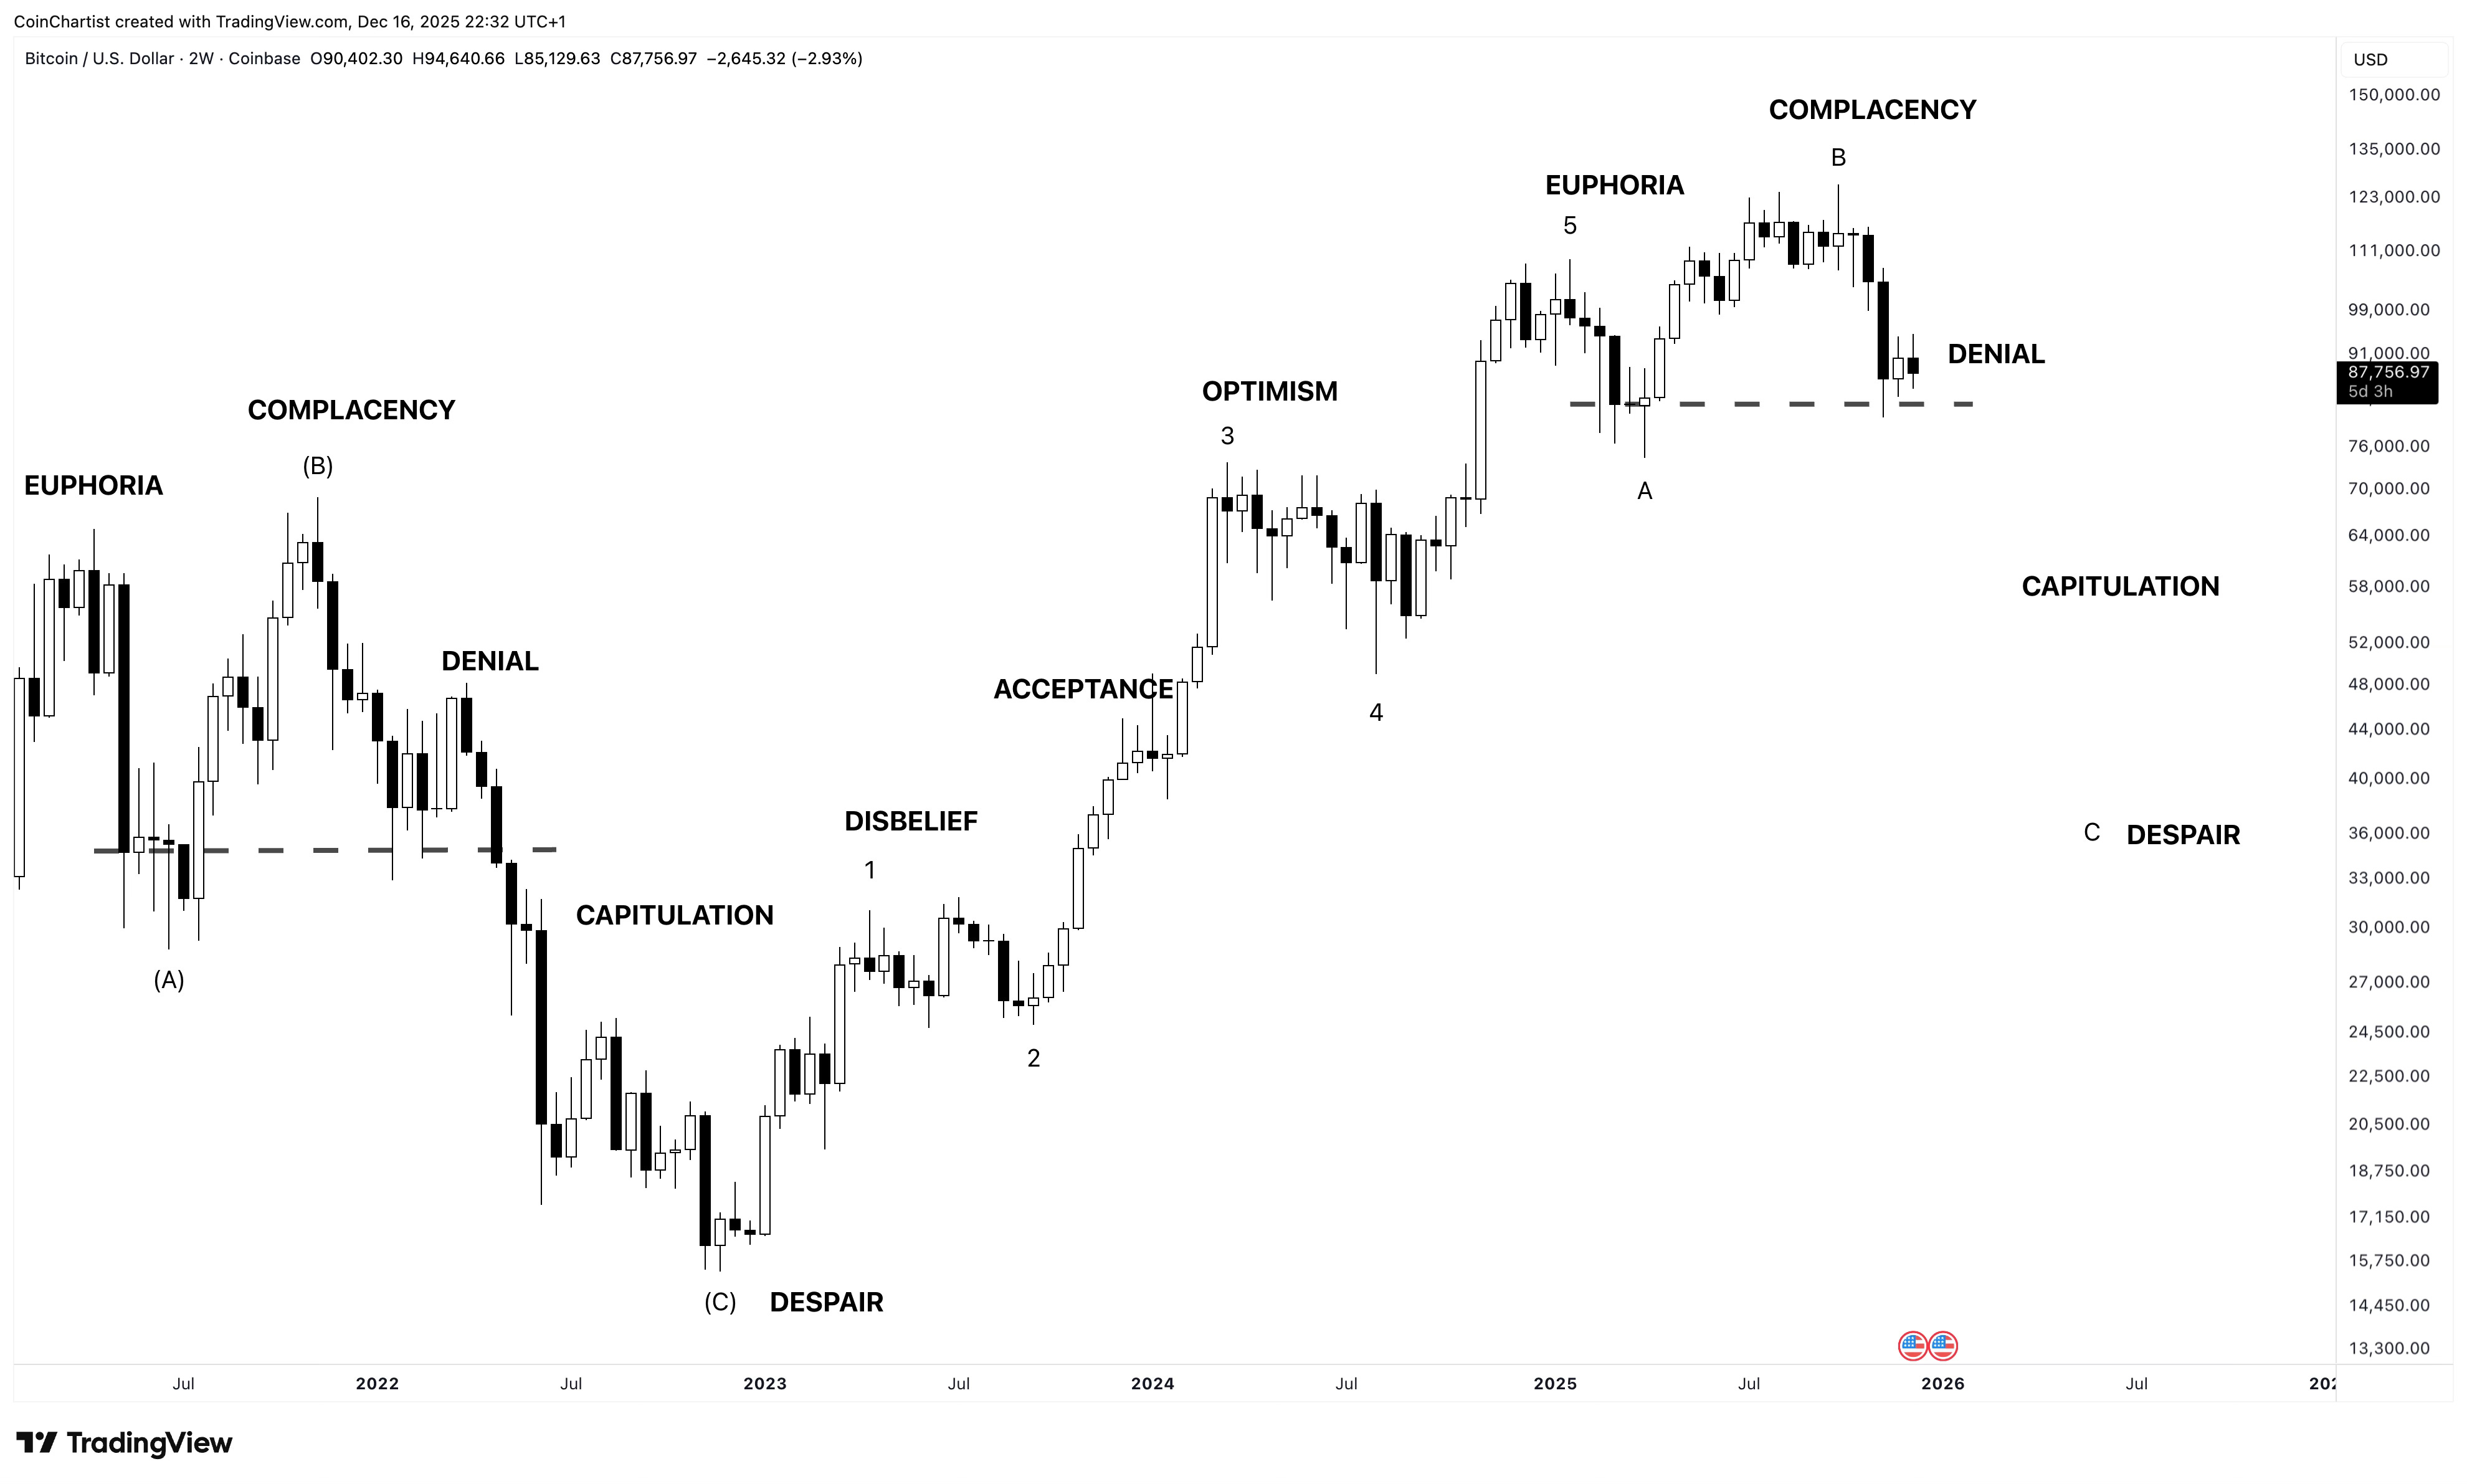
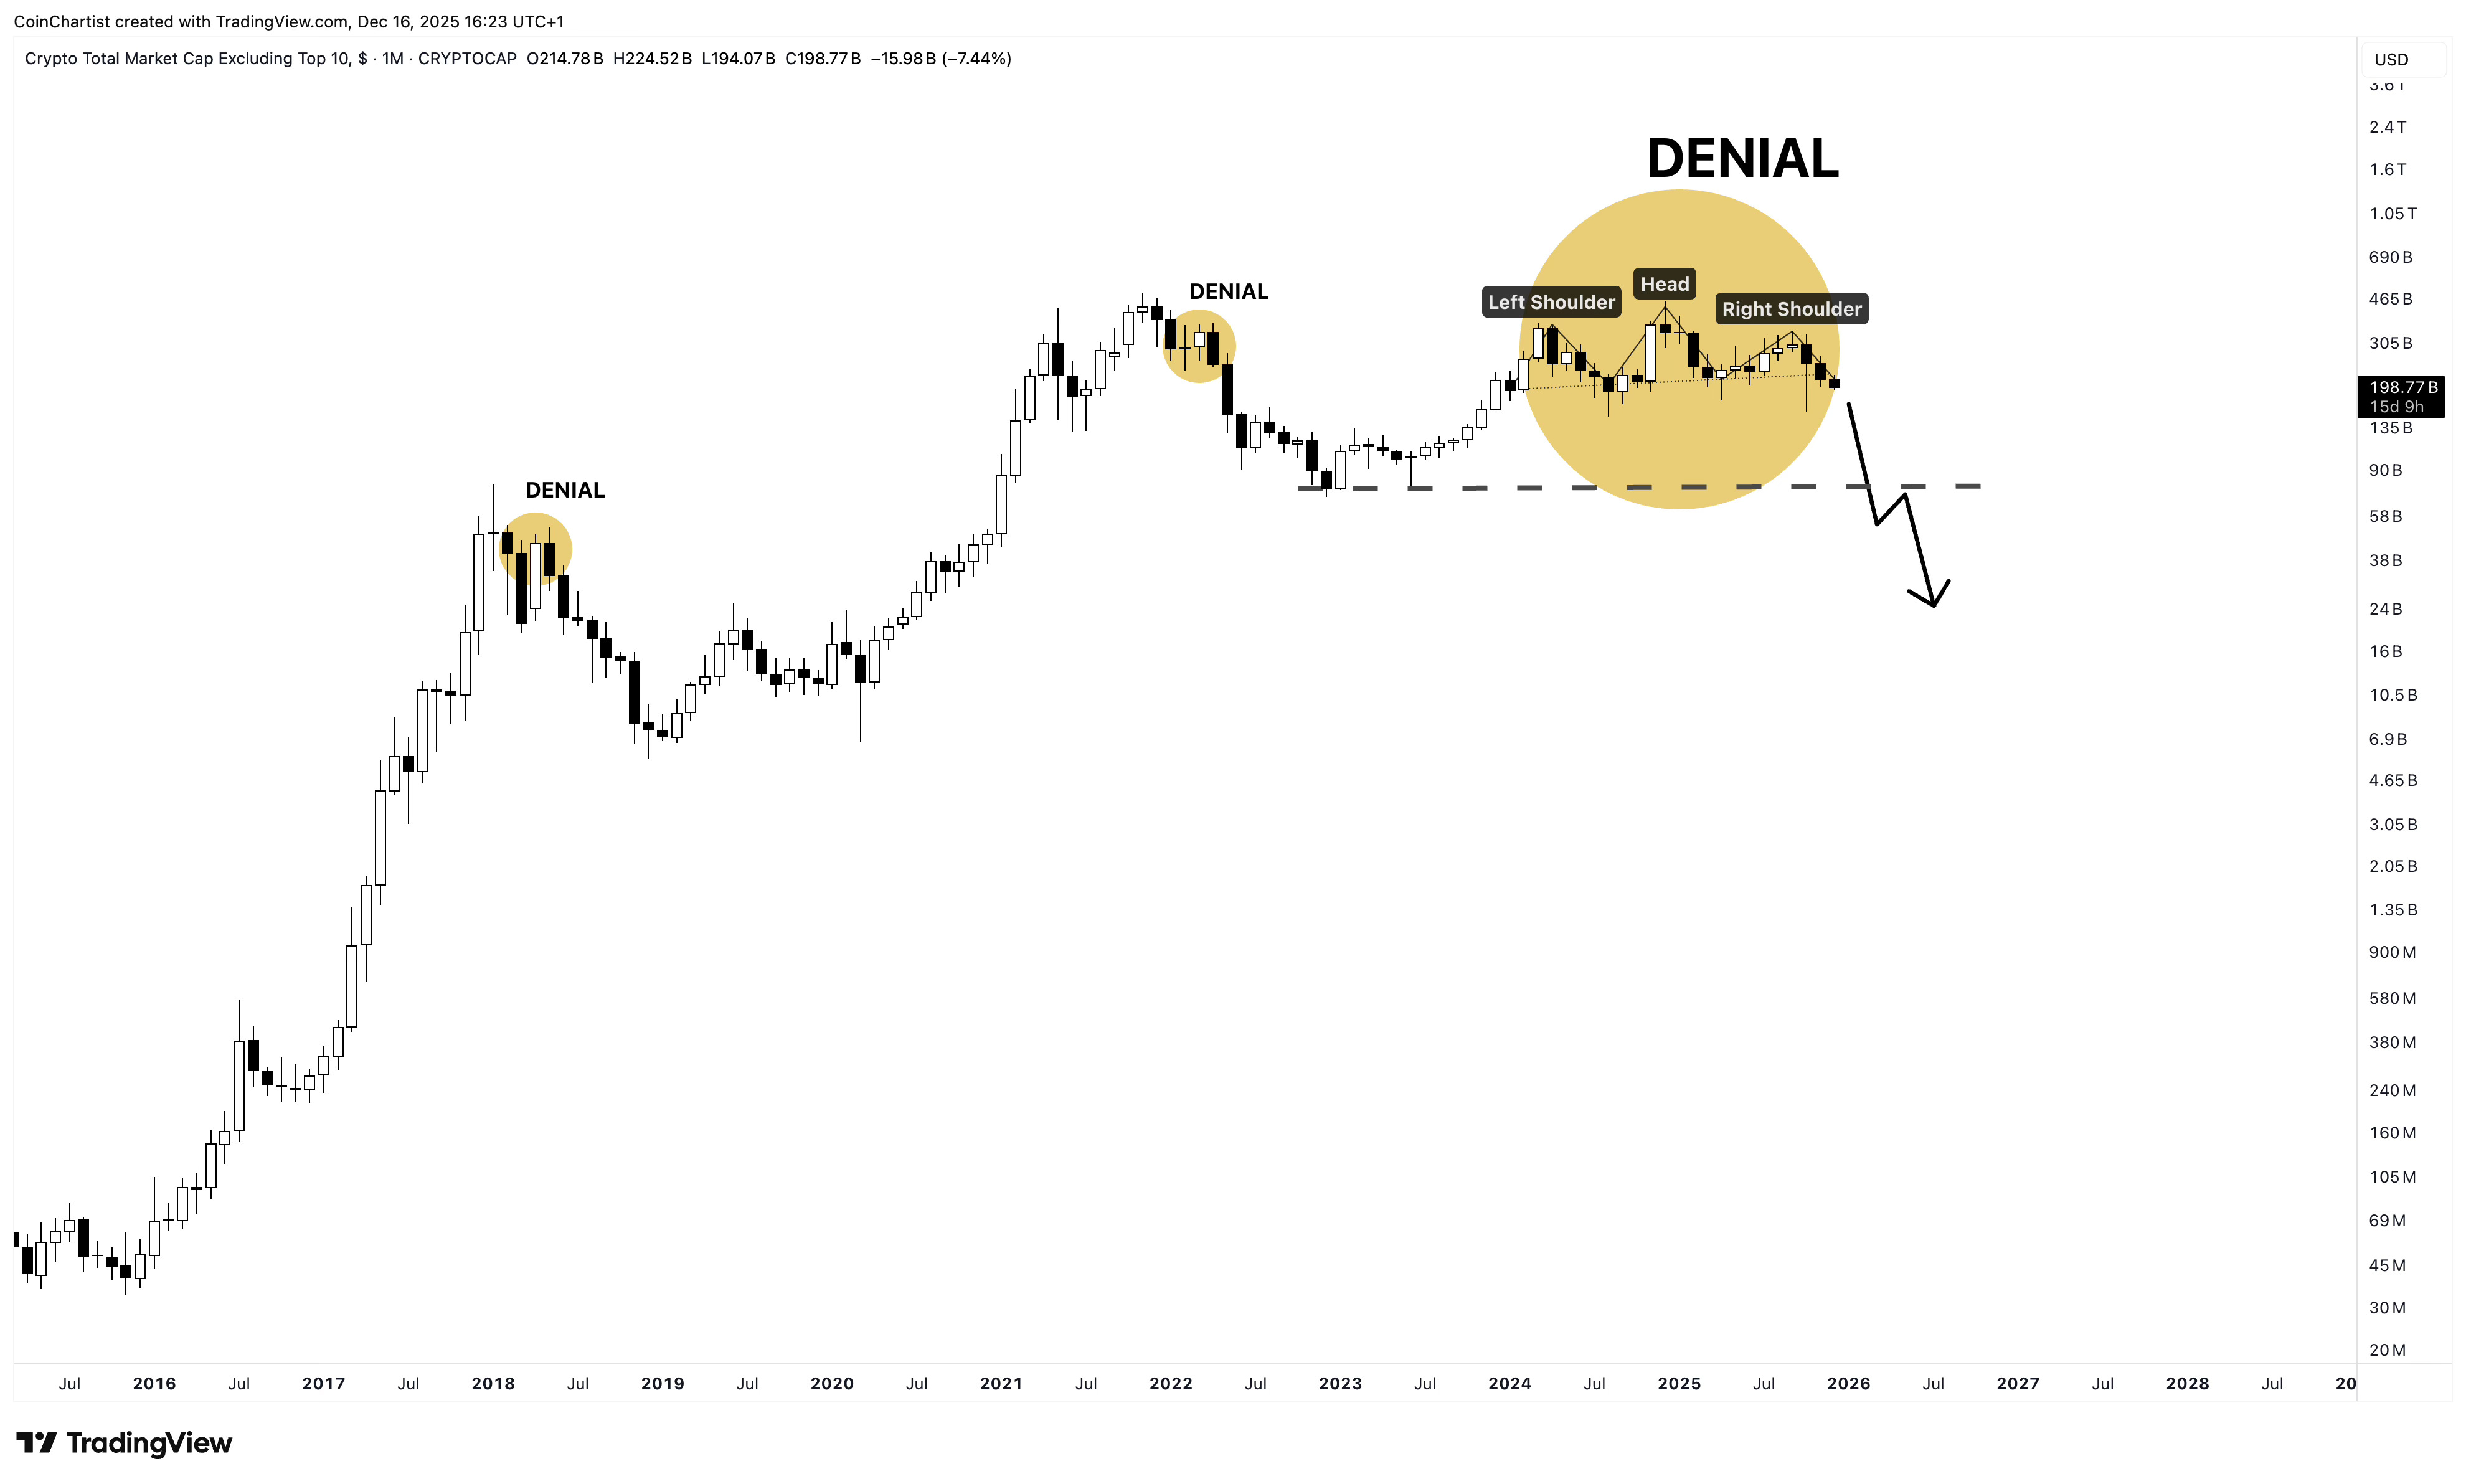
The Psychology Behind a Bitcoin Bull Trap
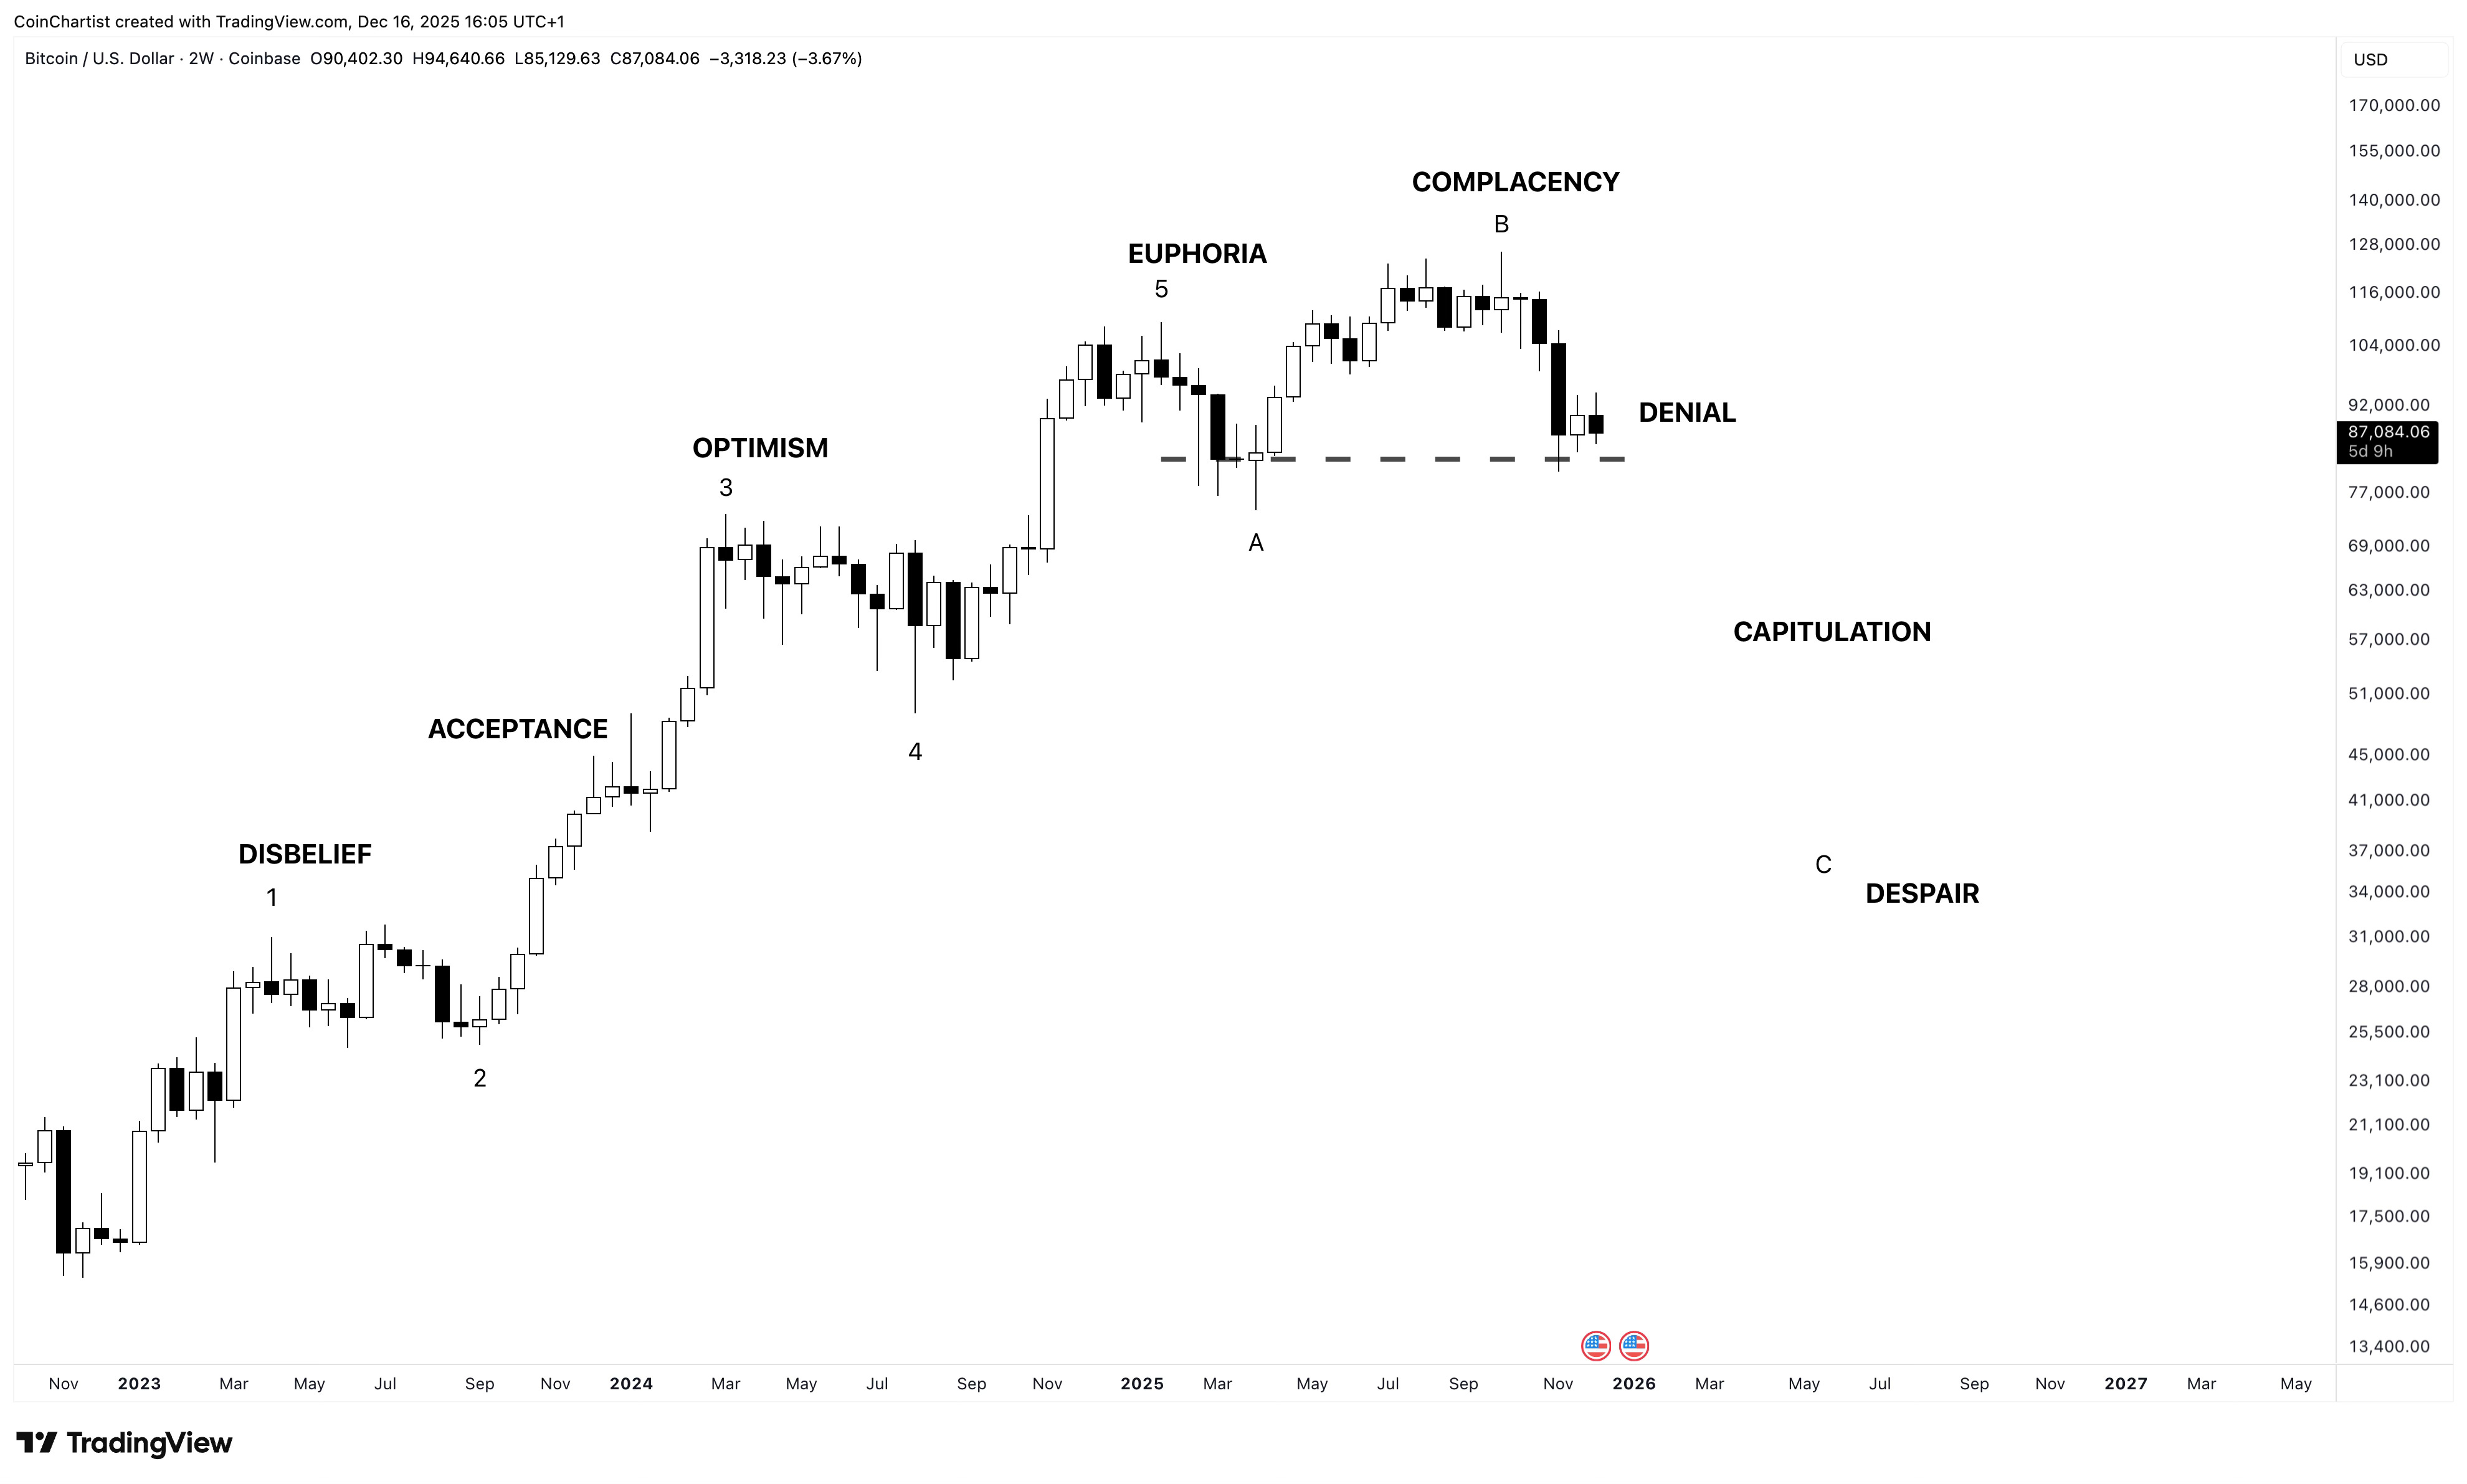
Above is the concept of a market cycle and how the bull trap is due to the denial phase and its related psychology. Bulls are in denial, so hope is the prominent emotion. The initial move down was not from euphoria, adding to the overall confusion of the current environment. Euphoria peaked in January/February, although it was very subtle due to Bitcoin being the only crypto asset with a sustained rally to new all-time highs. The lack of breadth kept euphoria at less visible levels than past cyclical tops. Right now, bulls are holding onto hope for a higher high and an immediate move back into a bull run. The intensity of the first move down brought technical indicators to levels associated with local bottoms, further reinforcing overconfidence in the underlying trend remaining bullish. Dip buying may become aggressive, especially if a bounce materializes towards $100,000. Approaching an important psychological level like $100,000 will trigger all kinds of emotions of FOMO, profit-taking, and again, “we’re so back.” Bulls feel momentary relief and validation that almost immediately gets crushed. The truth is that bulls are so desperate for confirmation of a resumption of the bull trend that they’re especially susceptible to crushing disappointment when it once again fails to go in the direction they had hoped for. The loss of hope and a turn to panic simultaneously as support levels are lost make the move that much more violent and painful.
In this chart, all I’ve done is zoom out slightly to show the same structure and psychology at play during the last bear market cycle. The denial phase led to the largest drawdown and true capitulation. Price did keep moving lower, leading to despair. But it was the loss of hope during the denial phase that causes the sharpest change in market psychology and thus the largest movement in price.
Altcoin Dominance During a Bitcoin Downtrend
There might be a bull trap brewing in BTC.D also. And interestingly, Bitcoin Dominance tends to have a bull trap right before there is an altcoin season. Your first thought might be, “well that must mean that altcoin season is coming.” The problem is that the conditions necessary for an altcoin season will be impossible if the Bitcoin bull trap scenario is legit. In BTC.D, bull traps happen below the 50-week MA and while the RSI and LMACD are at specific levels (just like BTCUSD). All of the conditions are here both in BTC.D and BTCUSD for bull traps.
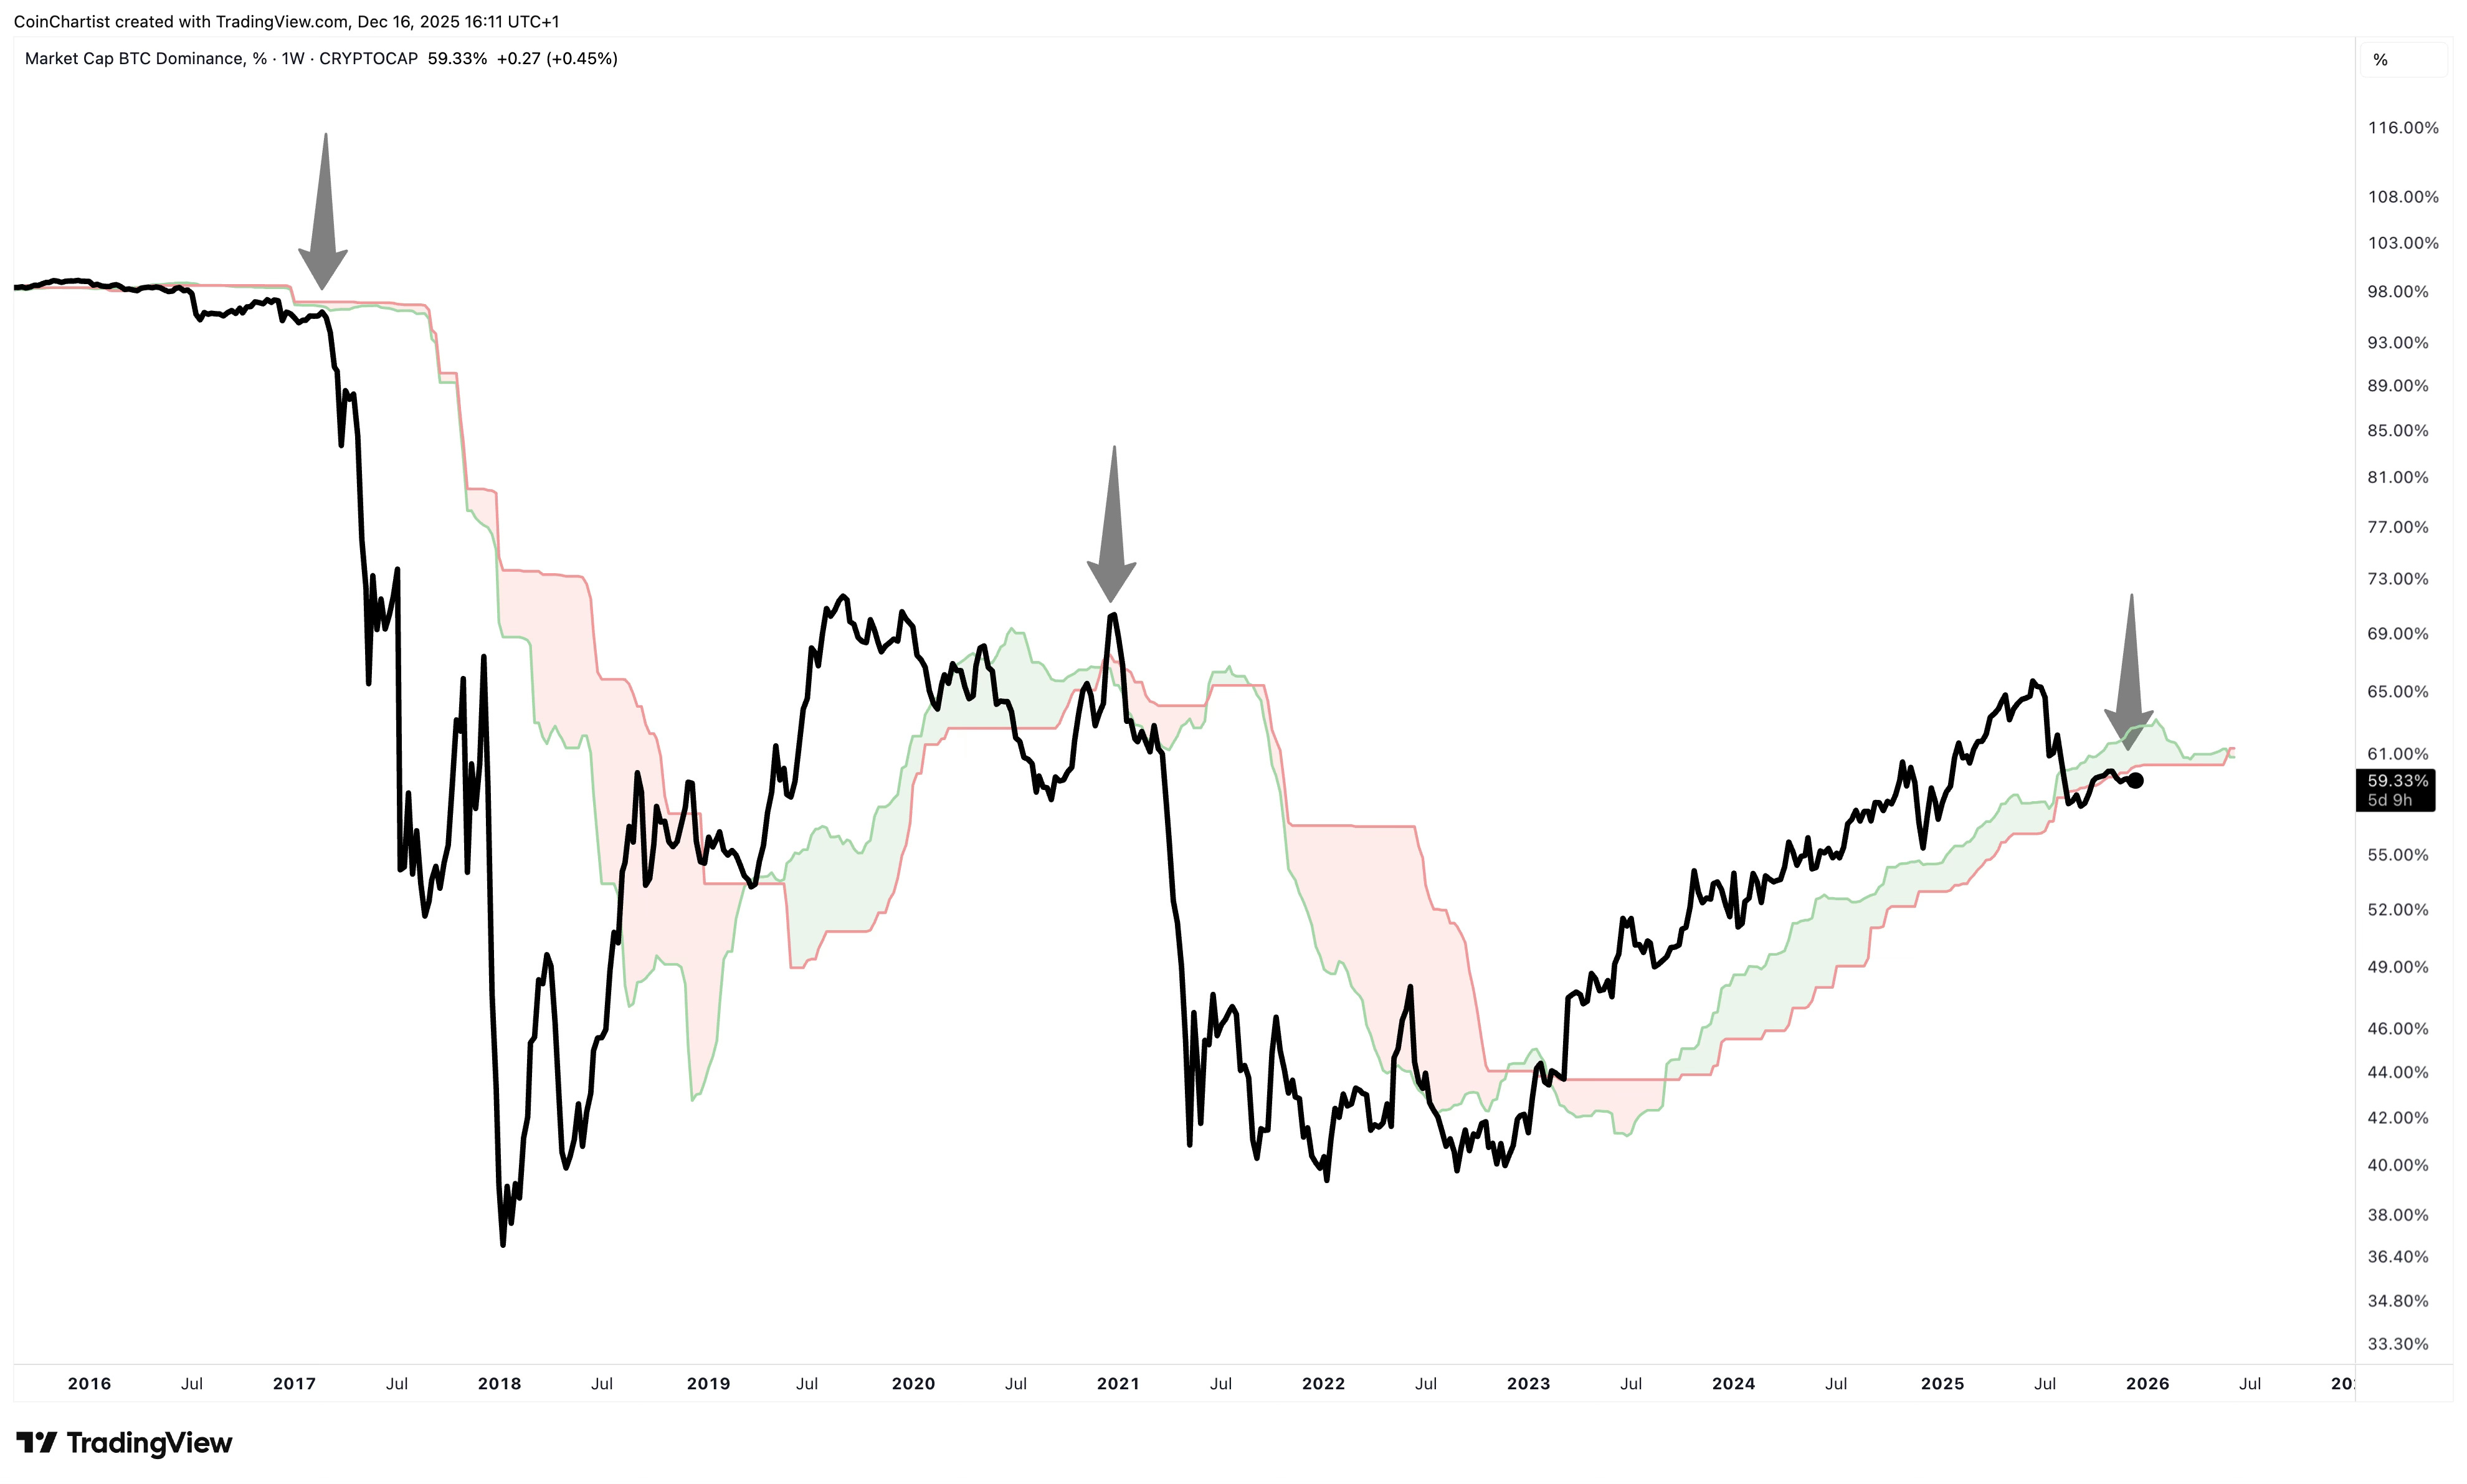
BTC.D is even losing the weekly Ichimoku cloud — one of the factors from the start of the newsletter that will confirm if we do or don’t get a bull trap in BTCUSD. The problem is, if Bitcoin is in a bear market, altcoins won’t go up independently. But if BTC.D is also giving a valid signal, it is telling us this bloodbath is mostly Bitcoin-specific, and alts will simply fall less than Bitcoin in USD value.
The Cyclical Timing of a Crypto Bull Trap
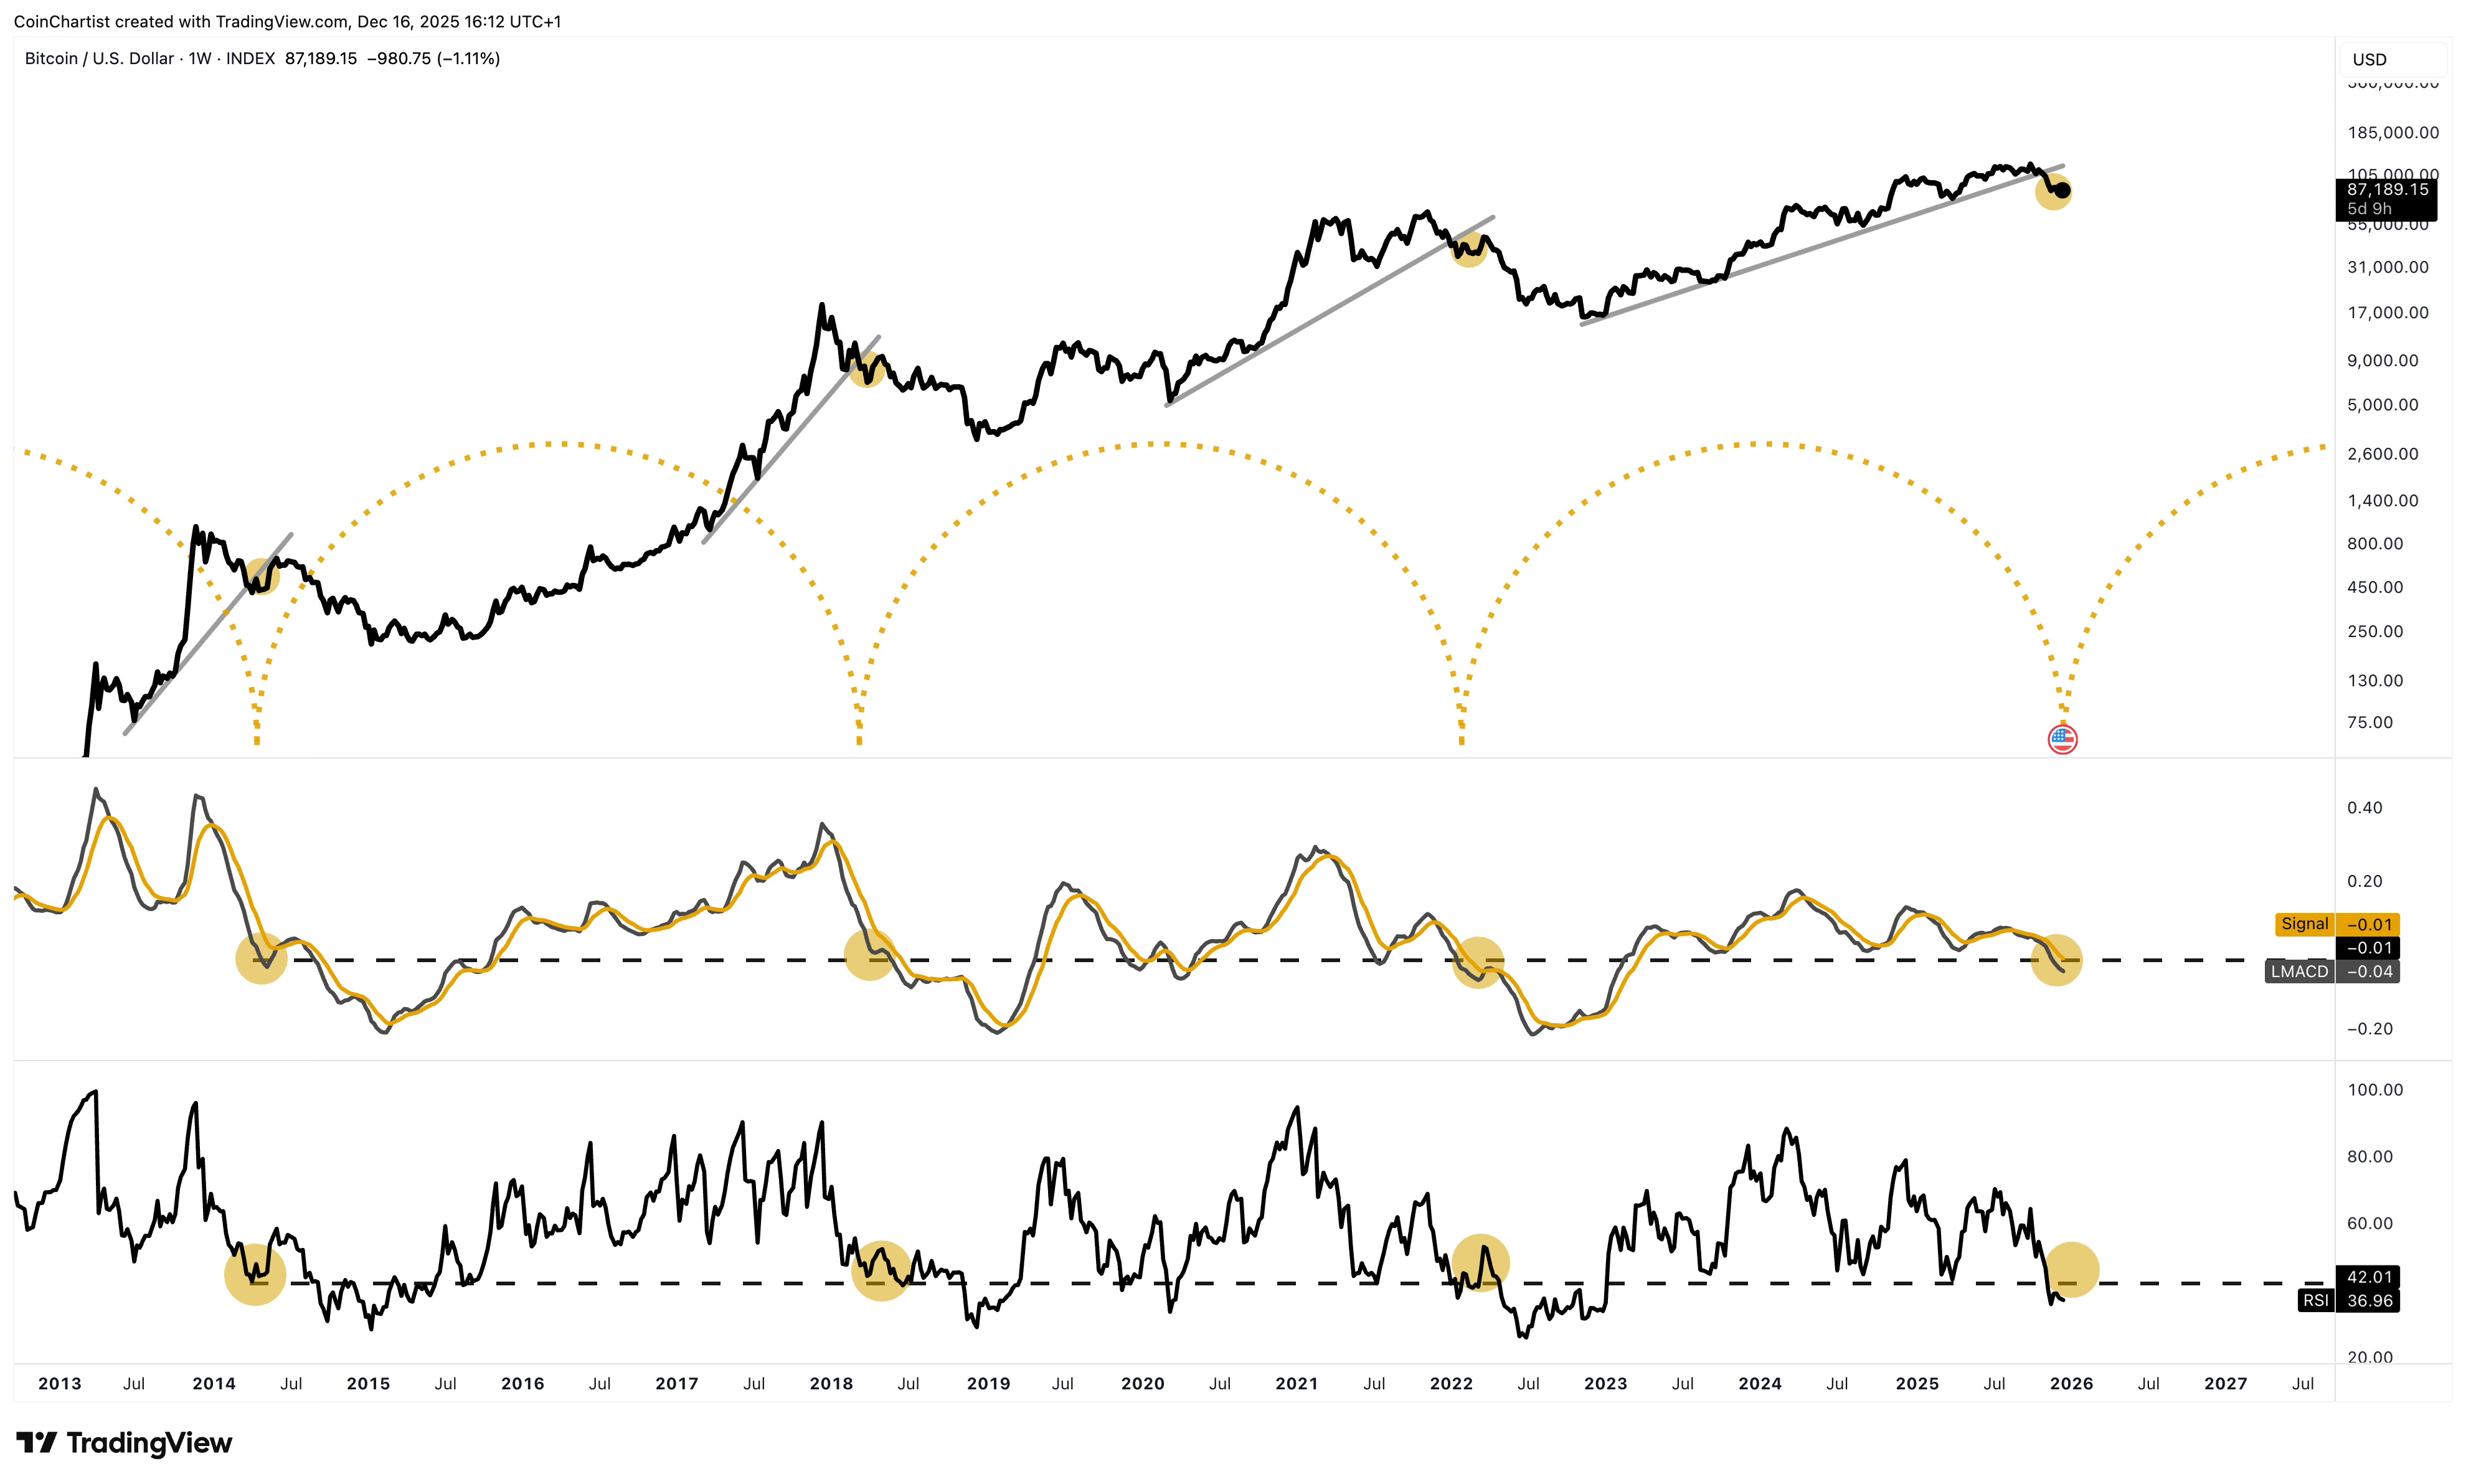
This is a chart explored earlier in the issue, but with time cycle arcs added to demonstrate that this bull trap is right on time cyclically. The Gold highlights in price action and technical indicators line up precisely with the cyclical troughs.
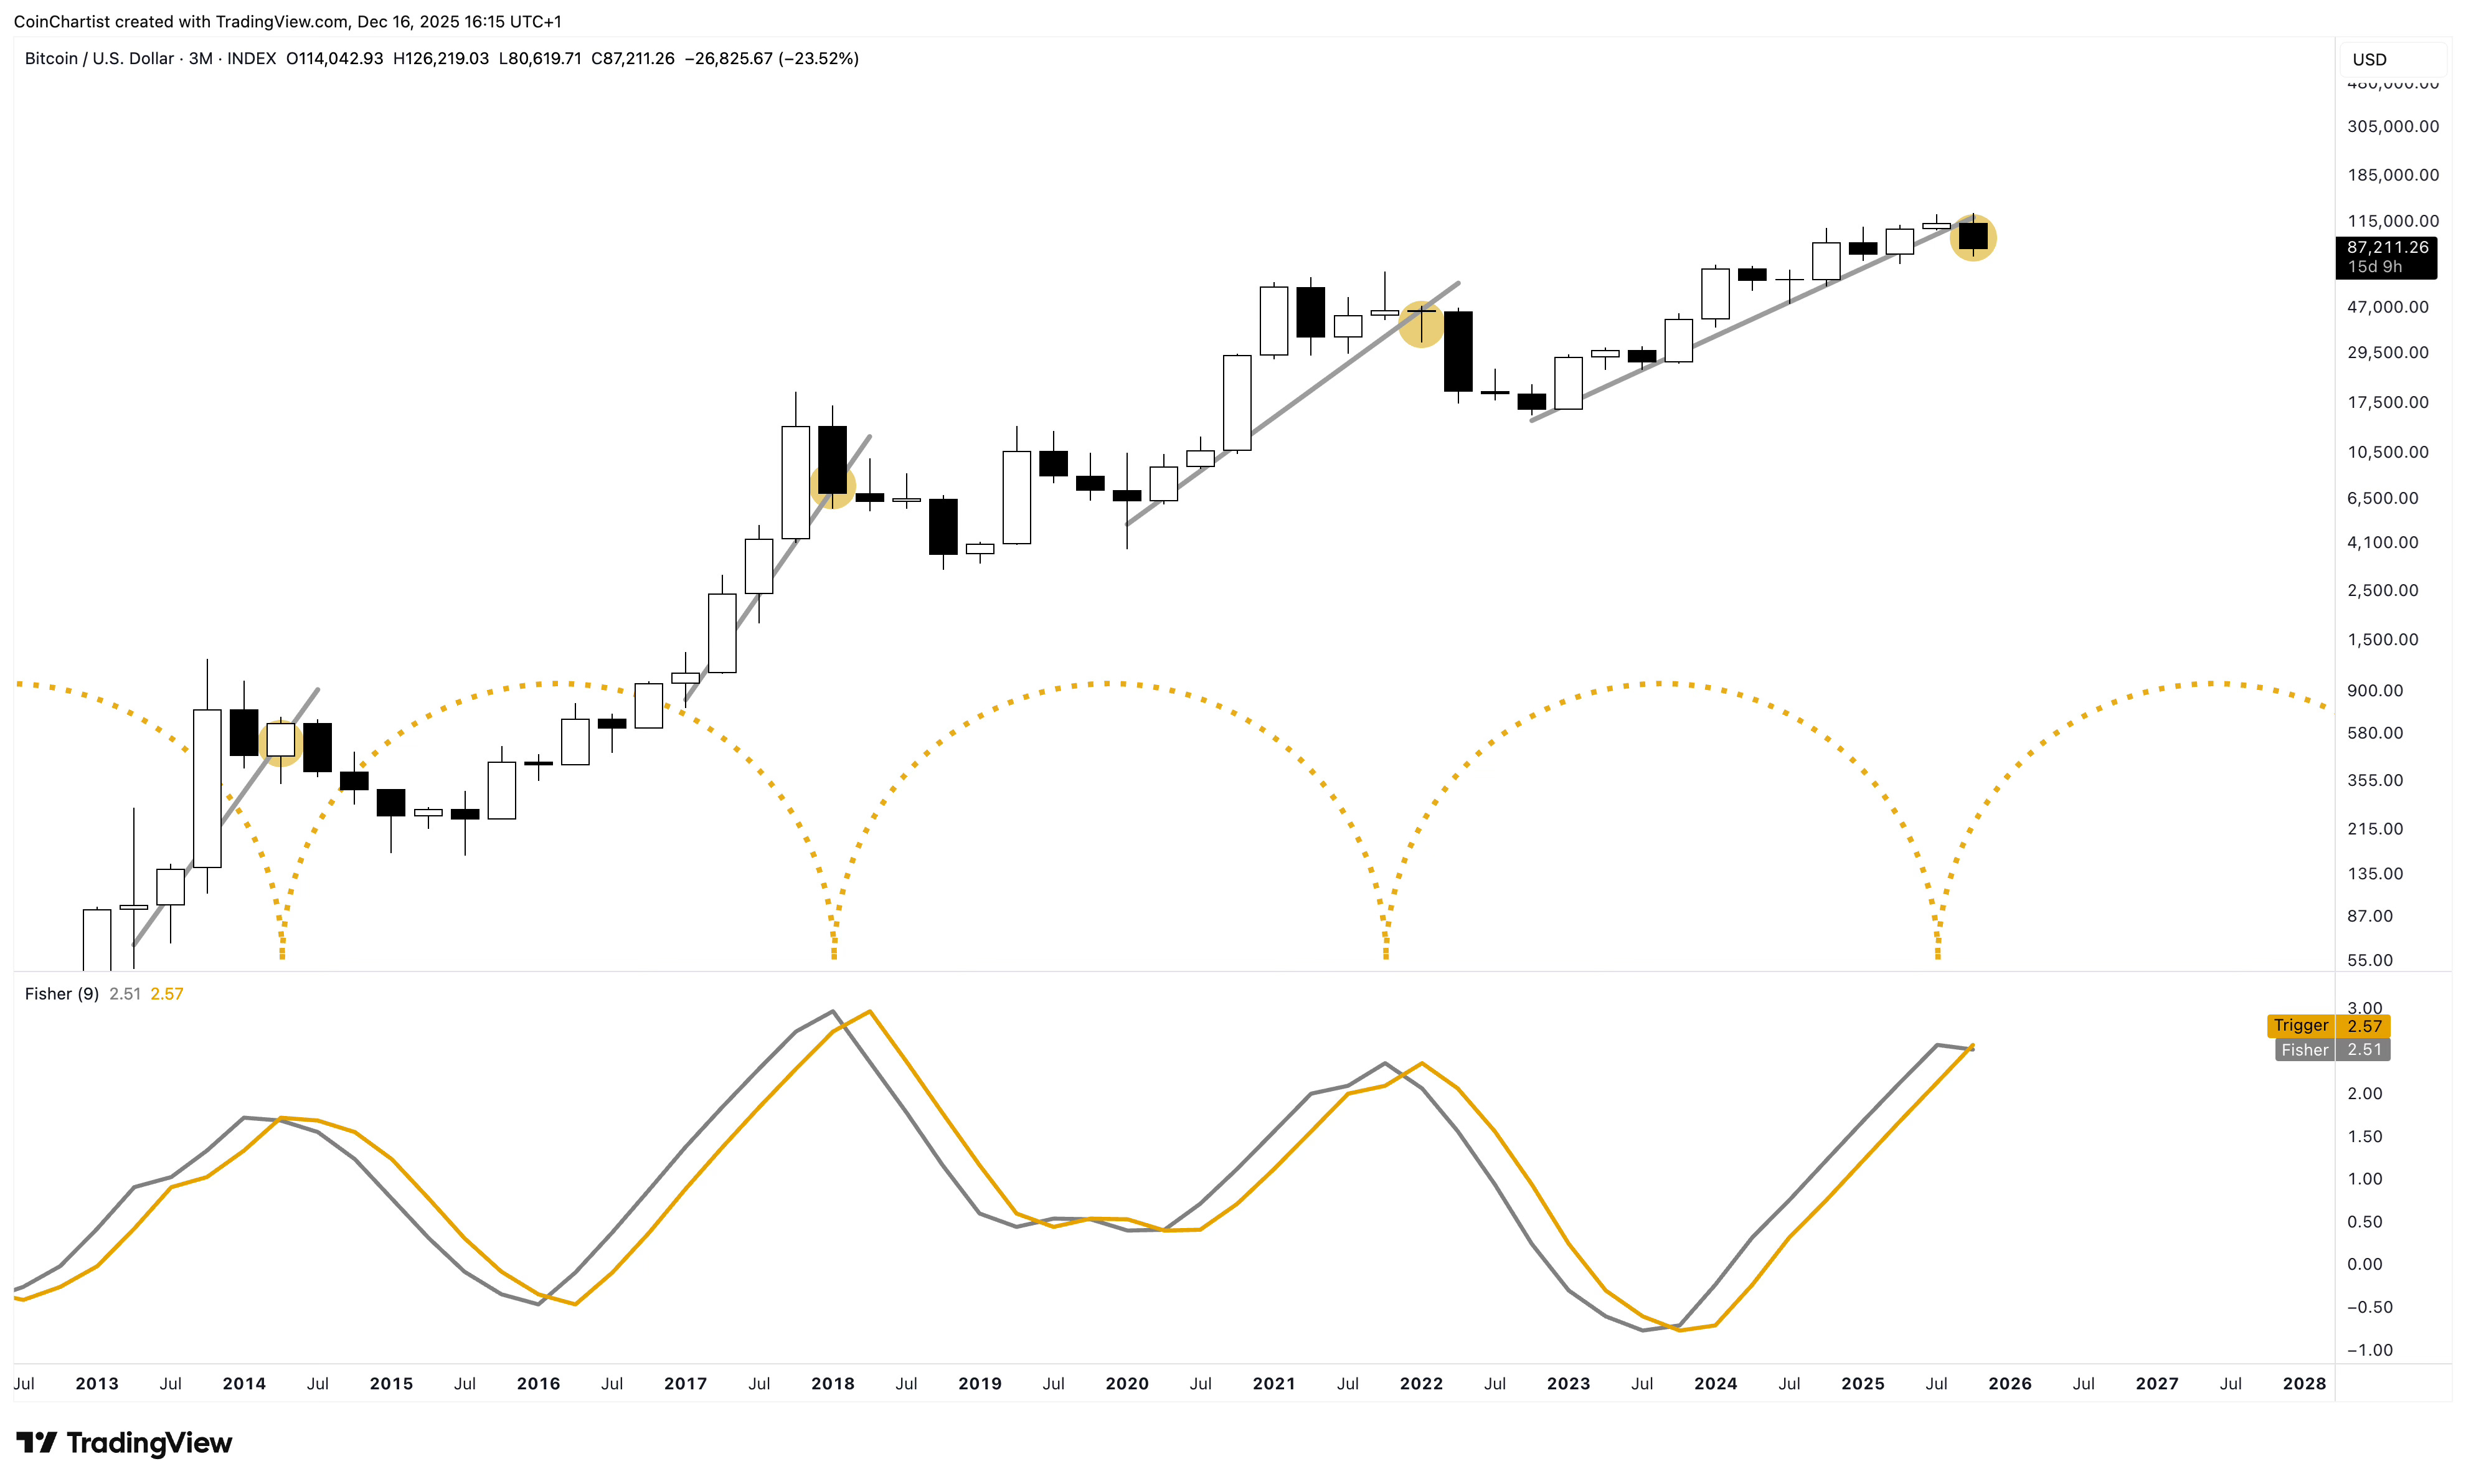
Switching to higher timeframes, such as the quarterly (which closes in 16 days), we can see that the Fisher Transform has crossed bearish, signaling the end of the current cycle. This peak lines up cyclically with past peak timing. The most important thing to pay attention to here is the fact that the indicator has just started flipping bearish and price already fell by over $40,000. The statistical tool used to smooth out price volatility and pinpoint cyclical swing highs and lows, is doing that perfectly. But it also is telling us that the drawdown has just begun, and there could be a lot more way to go down. This signal does not suggest Bitcoin will be making new all-time highs soon.
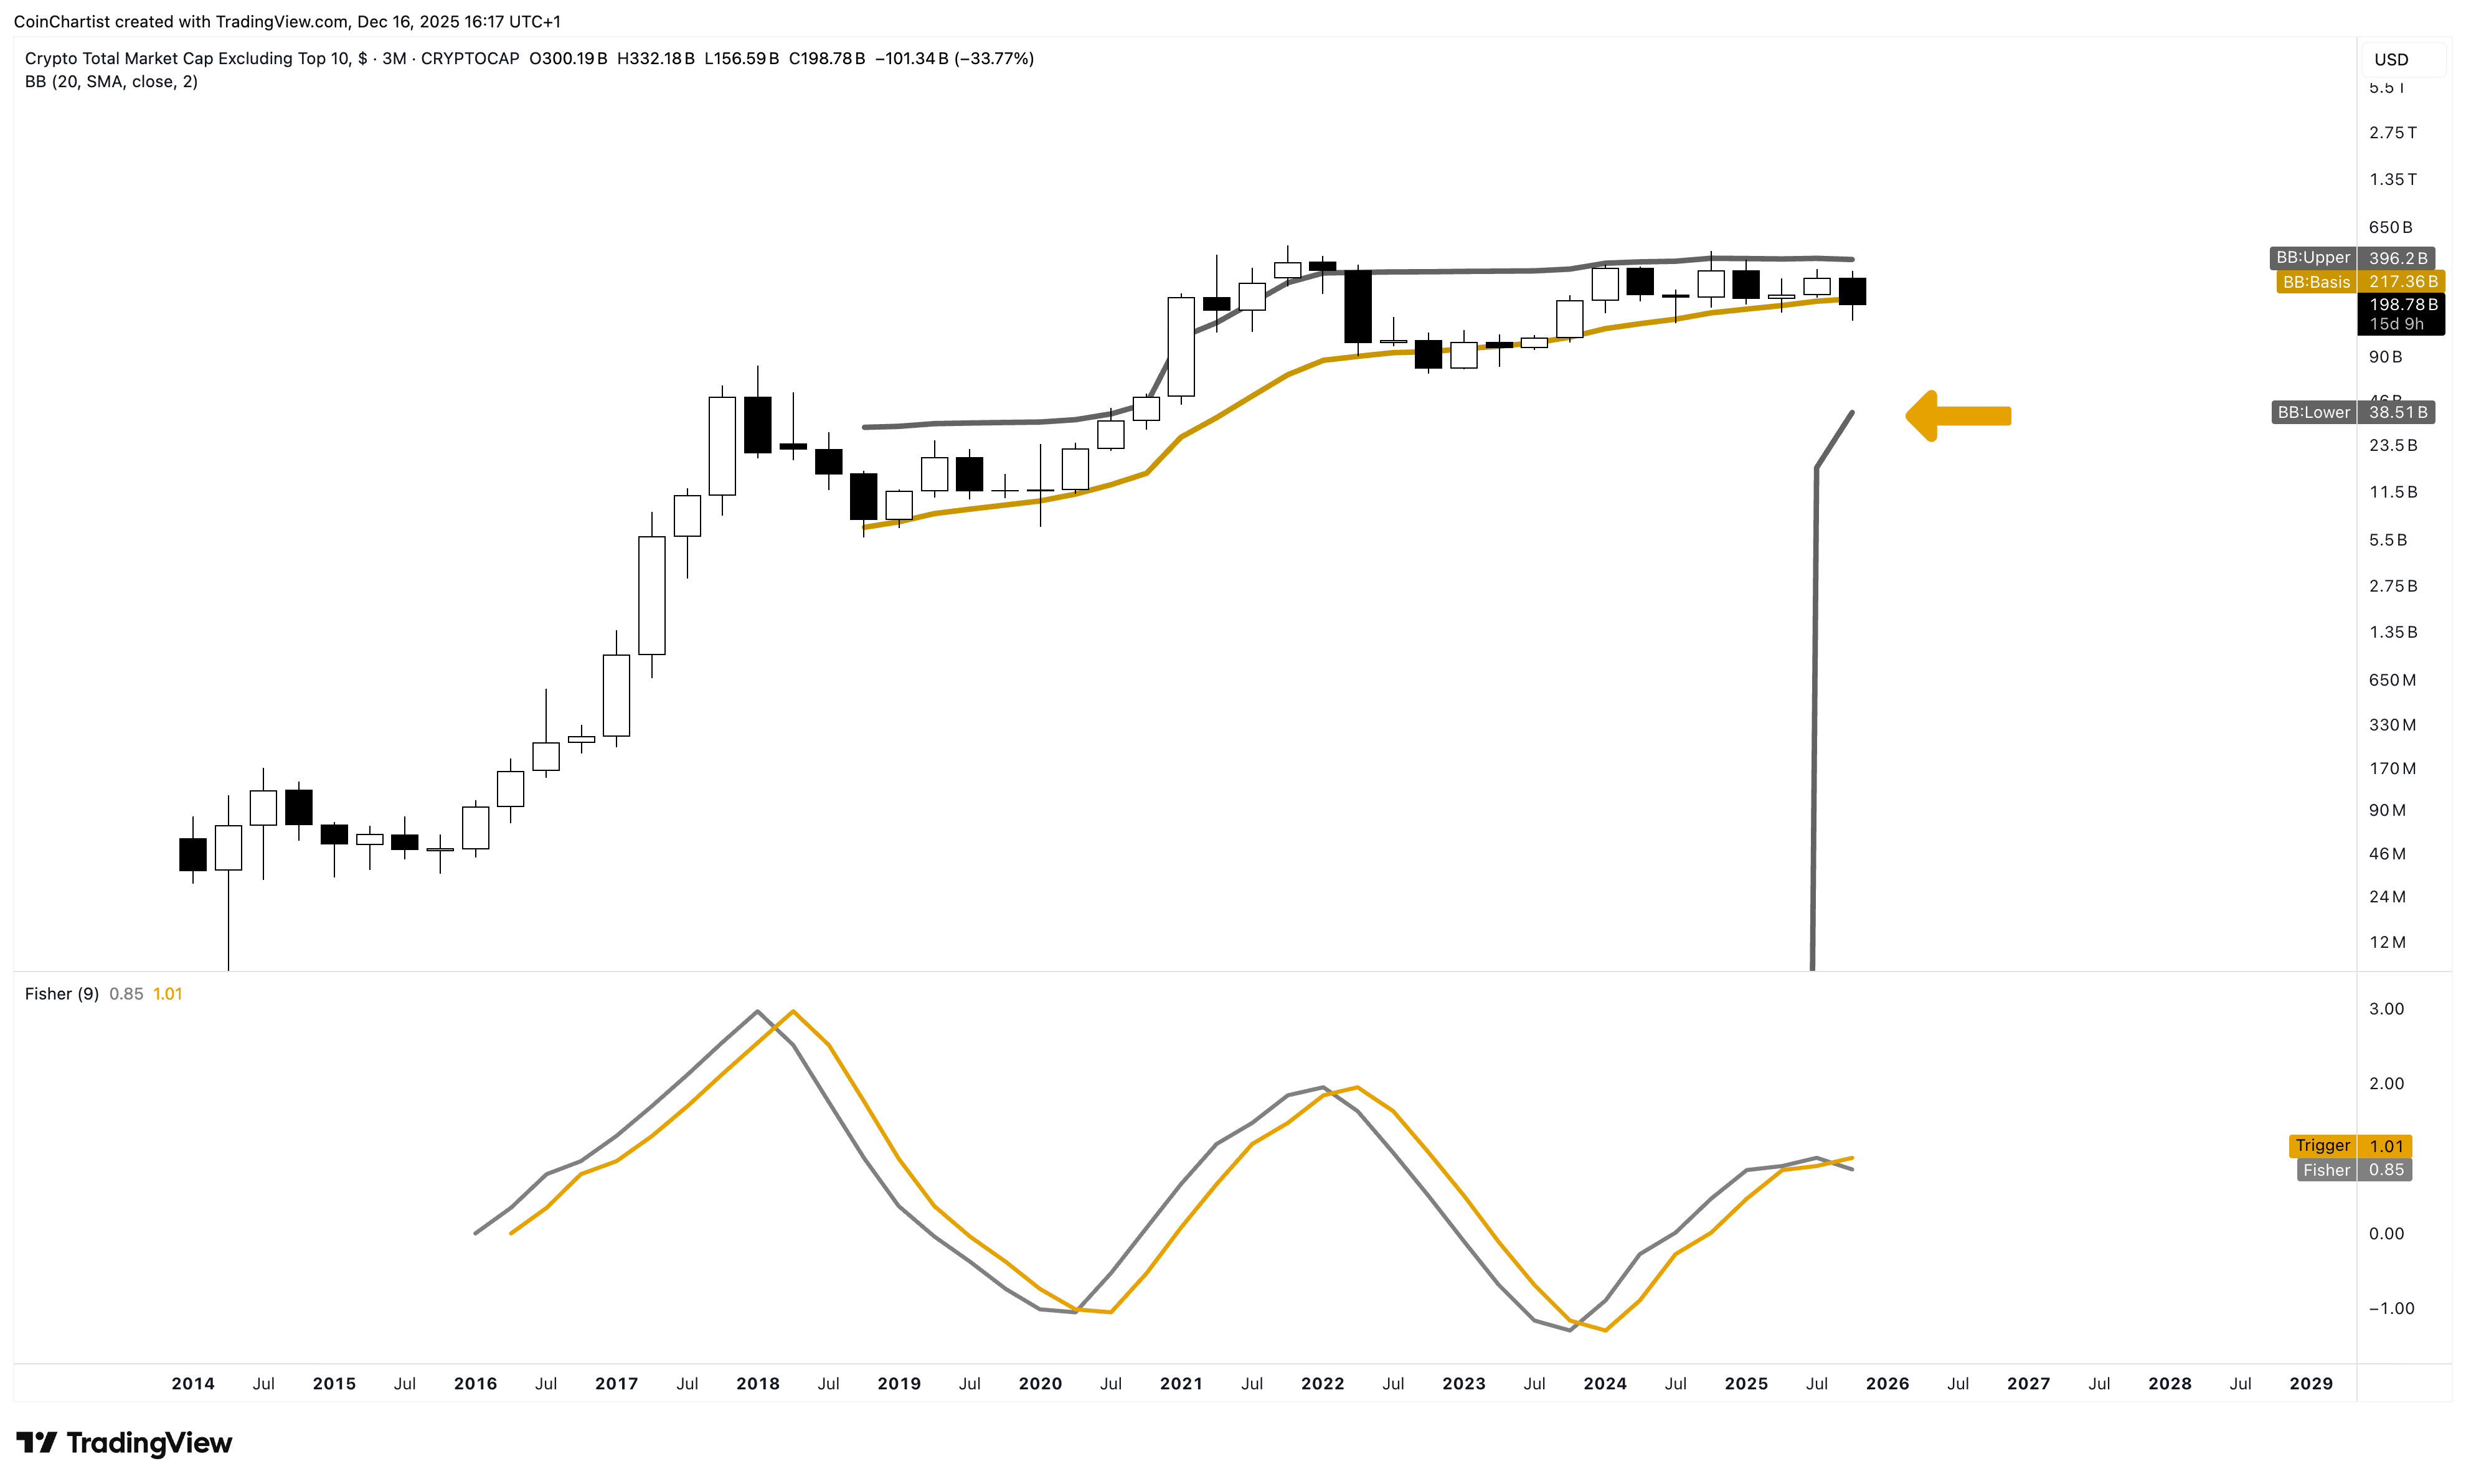
This chart is OTHERS, representing altcoins as a whole. The same quarterly Fisher Transform crossed bearish last month, so the signal is already confirmed. The quarterly candlestick is currently below the quarterly Bollinger Band basis, and the lower Band is rising to the tightest level in history. Losing the basis line points to price touching the lower Band.
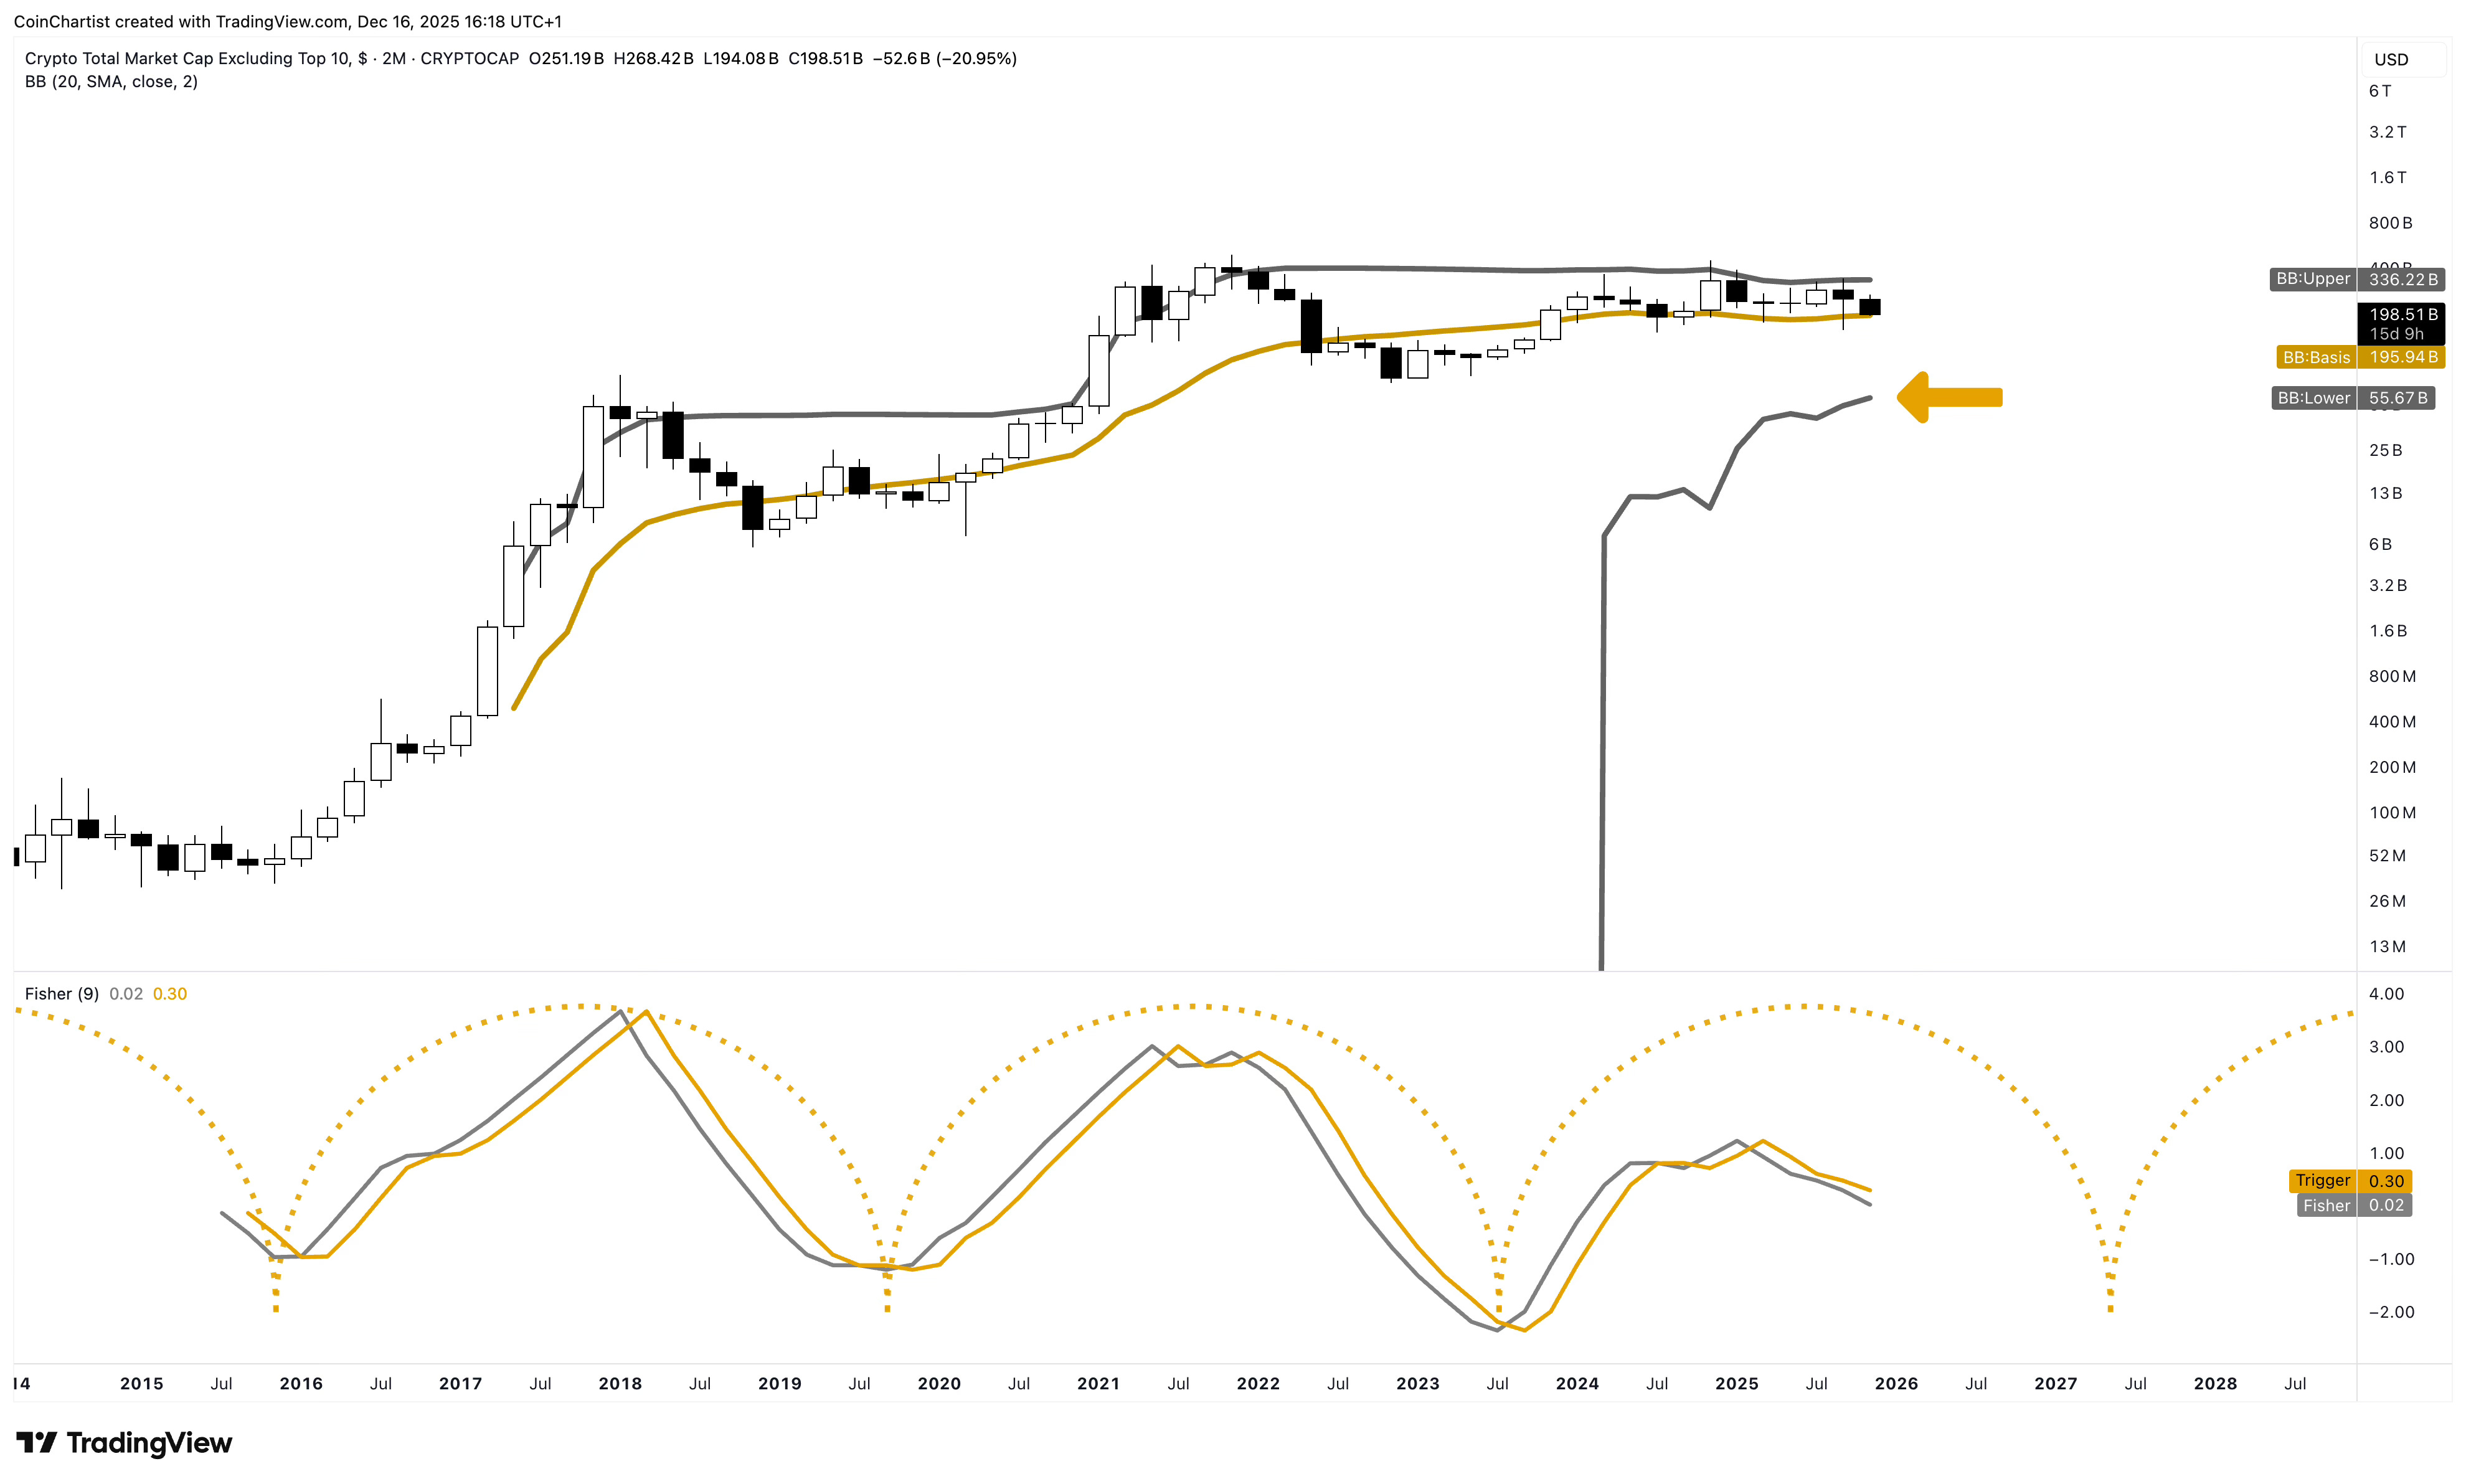
The two-month timeframe tightens things up a little bit for clarity, and is pointing to a bottom in early to mid-2027 for altcoins. This could be a long, brutal bottoming process if accurate, especially after failing to make a new ATH at all on the OTHERS index.
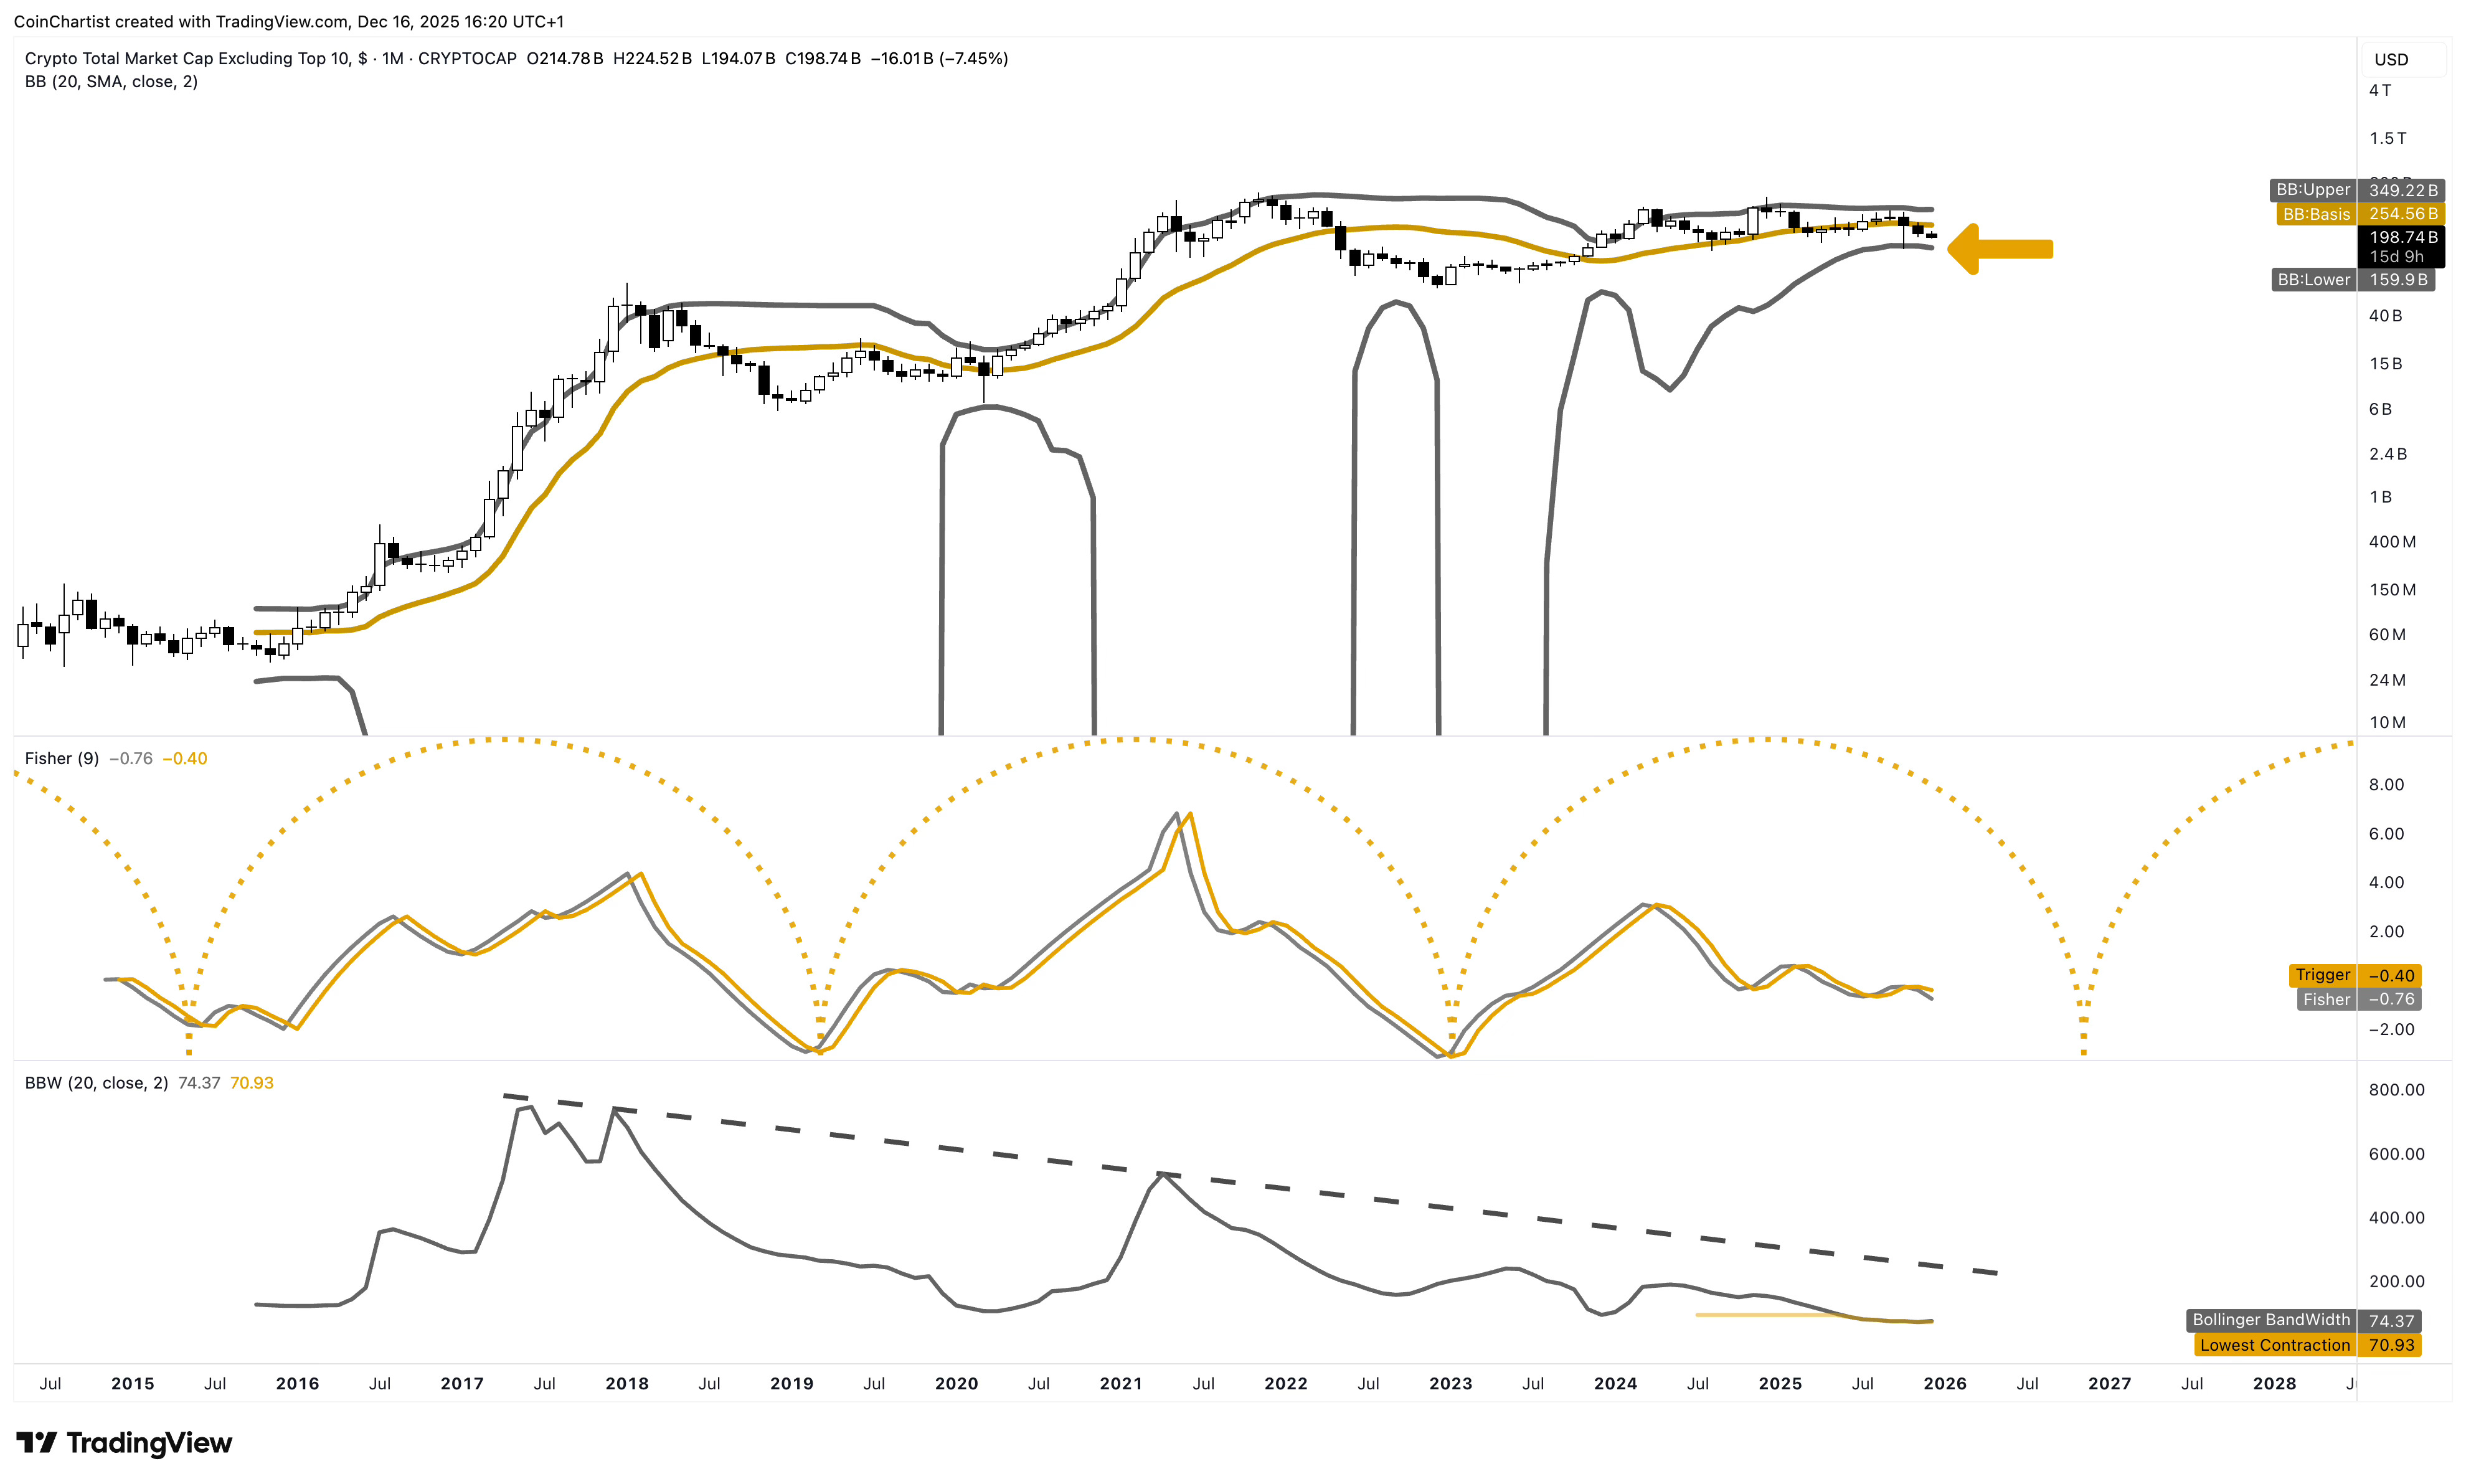
The monthly tightens it up even further, showing off how narrow the Bollinger Bands are on the timeframe. They are the tightest in history, and a squeeze setup like this tends to lead to an explosive move. The lowest indicator on the chart is Bollinger BandWidth, which helps to better see the bands are tighter than at any other point in time. Tight bands don’t tell us direction, but they do hint at a more significant move coming sooner than later. All the pent up emotion from the last two years will resolve in one direction or the other, with the higher probability assigned to downside, not upside. Ask yourself realistically – if the world is panicking and buying hard assets like Gold and Silver which have withstood the test of time, are they really interested in buying altcoins ranked below the top ten? Altcoins below the top ten have very little history, longevity, trust, revenue, etc. Investors are looking for safety and value, not risk and speculation. Don’t be in denial.
Beware of the Bigger Bull Trap
OTHERS made a macro lower high thus far. It is forming what appears to be a head and shoulders topping pattern. And it is doing this while Bitcoin is poised to plummet further, technicals are turning over, and yet altcoin holders are still in extreme denial about what is going on. They’re grasping onto any narrative at all to justify holding their favorite coin. QT has ended. Interest rates were cut. M2 correlation with crypto broke. ETFs were launched. None of these narratives are reviving altcoin sentiment. If Bitcoin breaks down, and the narrative changes extremely negative for the primary market driver, what narrative then is going to get people to bid on altcoins?
Final thoughts: This newsletter took a very bearish tone. The market psychology is ripe for this setup. But that doesn’t guarantee this outcome. The goal of this issue was to show you the technicals, explain the underlying psychology, and match it together with the current environment. From there, we can consider possible scenarios based on past behavior. Cycles do indeed change, but mass crowd behavior never does.
Make sure you check out the next issue where the tone returns to more of a neutral, yet very dramatic tone. The fate of Bitcoin for the next decade hangs in the balance according to Hurst Cycle Theory and Elliott Wave Principle. See how these match up with mass market psychology and narratives that could appear over the coming months to years.
Thank you for being a CoinChartist VIP premium subscriber.
Remember to leave a comment, hit like, or restack this content.
Please feel free to contact us with any issues or inquiries by emailing coinchartist@gmail.com.
-Tony “The Bull” Severino, CMT