

Calm Before The Storm
Crypto is reaching record-breaking low volatility. But what exactly does this mean for your money?

Disclaimer: The information provided in this Substack newsletter is for general informational purposes only and should not be considered as financial advice. Investing involves risk, and past performance is not indicative of future results. Please conduct your own research or consult a financial advisor before making any investment decisions. The newsletter disclaims any liability for losses or damages arising from the use of this information.
Calm Before The Storm overview:
An educational lesson on the Bollinger Bands, specifically the “squeeze” setup.
How volatility is cyclical and ebbs and flows between low and high states
What record low volatility could mean for Bitcoin, Ethereum, altcoins, and crypto as a whole
Bitcoin retains a bullish bias, while altcoins appear to be in a more precarious position
How to prepare yourself for the storm that’s coming – up or down
Bitcoin has been above $100,000 for 9 full weeks in a row. It also spent 5 weeks above the key psychological level in January and February. Despite being above this level and for as long as it has, there is almost no excitement in the space.
Number isn’t going up – it’s just meandering sideways (which is something I said in recent newsletters to expect). Bitcoin is becoming borderline boring. Even altcoins aren’t going much of anywhere these days.
But I am happy to tell you that relief will come. Everything in life is cyclical. Winter turns into summer and then back to winter. Days become night and turn back into the next day. Good times can turn bad quickly, but good days are always ahead once again.
Like everything else, volatility is cyclical. This is the calm before the storm. We can tell the storm is coming, but we don’t know what that storm will bring.
We can tell the storm is coming, because of just how low the volatility is across the board in the cryptocurrency industry. The lower the volatility, typically, the higher the volatility that arrives when the low volatility phase ends.
Let’s take a look at just how low the volatility has become on a variety of timeframes while we prepare further for the storm that’s ahead.
Squeezing In A Lesson On The Bollinger Bands
Before I dive into current analysis, I want to begin this issue by visually demonstrating how the Bollinger Bands work – specifically the “squeeze” setup. According to John Bollinger, a squeeze occurs when Bollinger BandWidth drops to its lowest level in 6 months.
I do believe the squeeze setup works and exists on lower timeframes as well. For example, a squeeze on the 4-hour chart might work just fine after reaching the lowest BandWidth reading in 6 weeks versus 6 months. There’s also evidence to support that the longer the duration of the squeeze, the larger the resulting move.
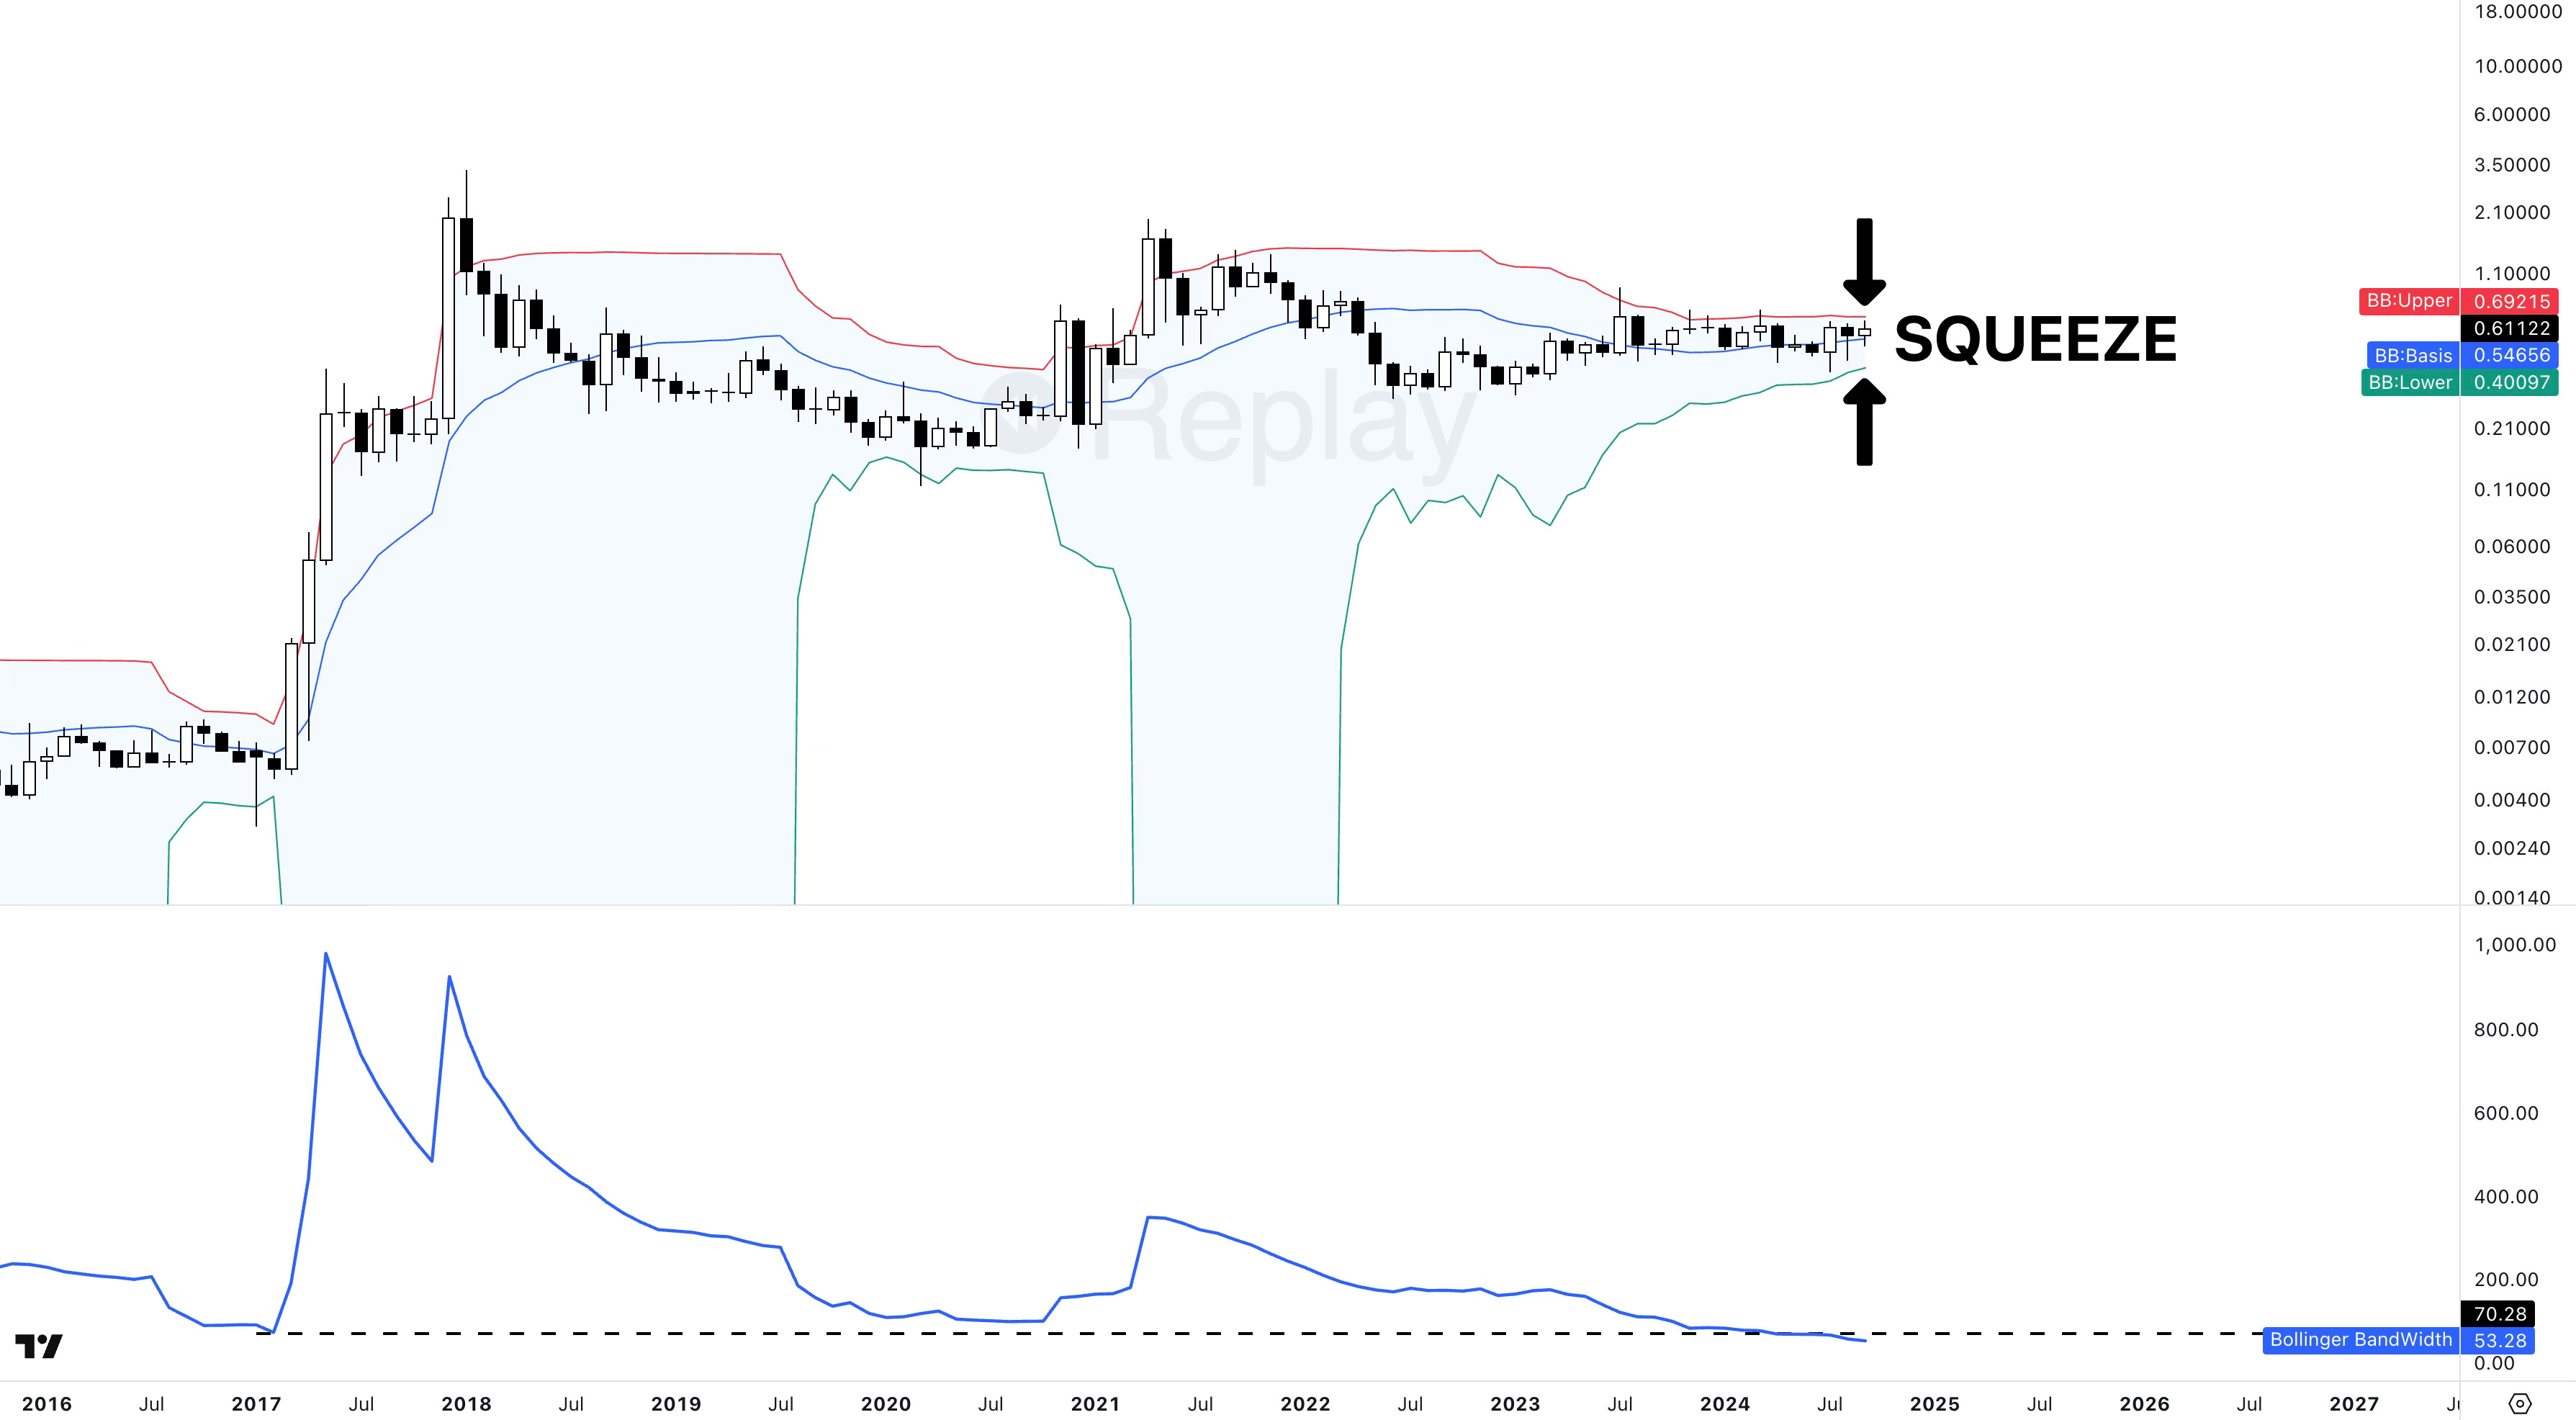
In the above example, XRP reached the lowest BandWidth reading ever on the monthly chart. At the time (September 2024), sentiment around XRP was in the gutter. I kept posting on X that something big would be coming in XRP soon, and I was laughed at.
The resulting high-volatility move after ending that low-volatility state was anything but laughable. If anyone should have been laughing, it was XRP holders who were vindicated in an instant.
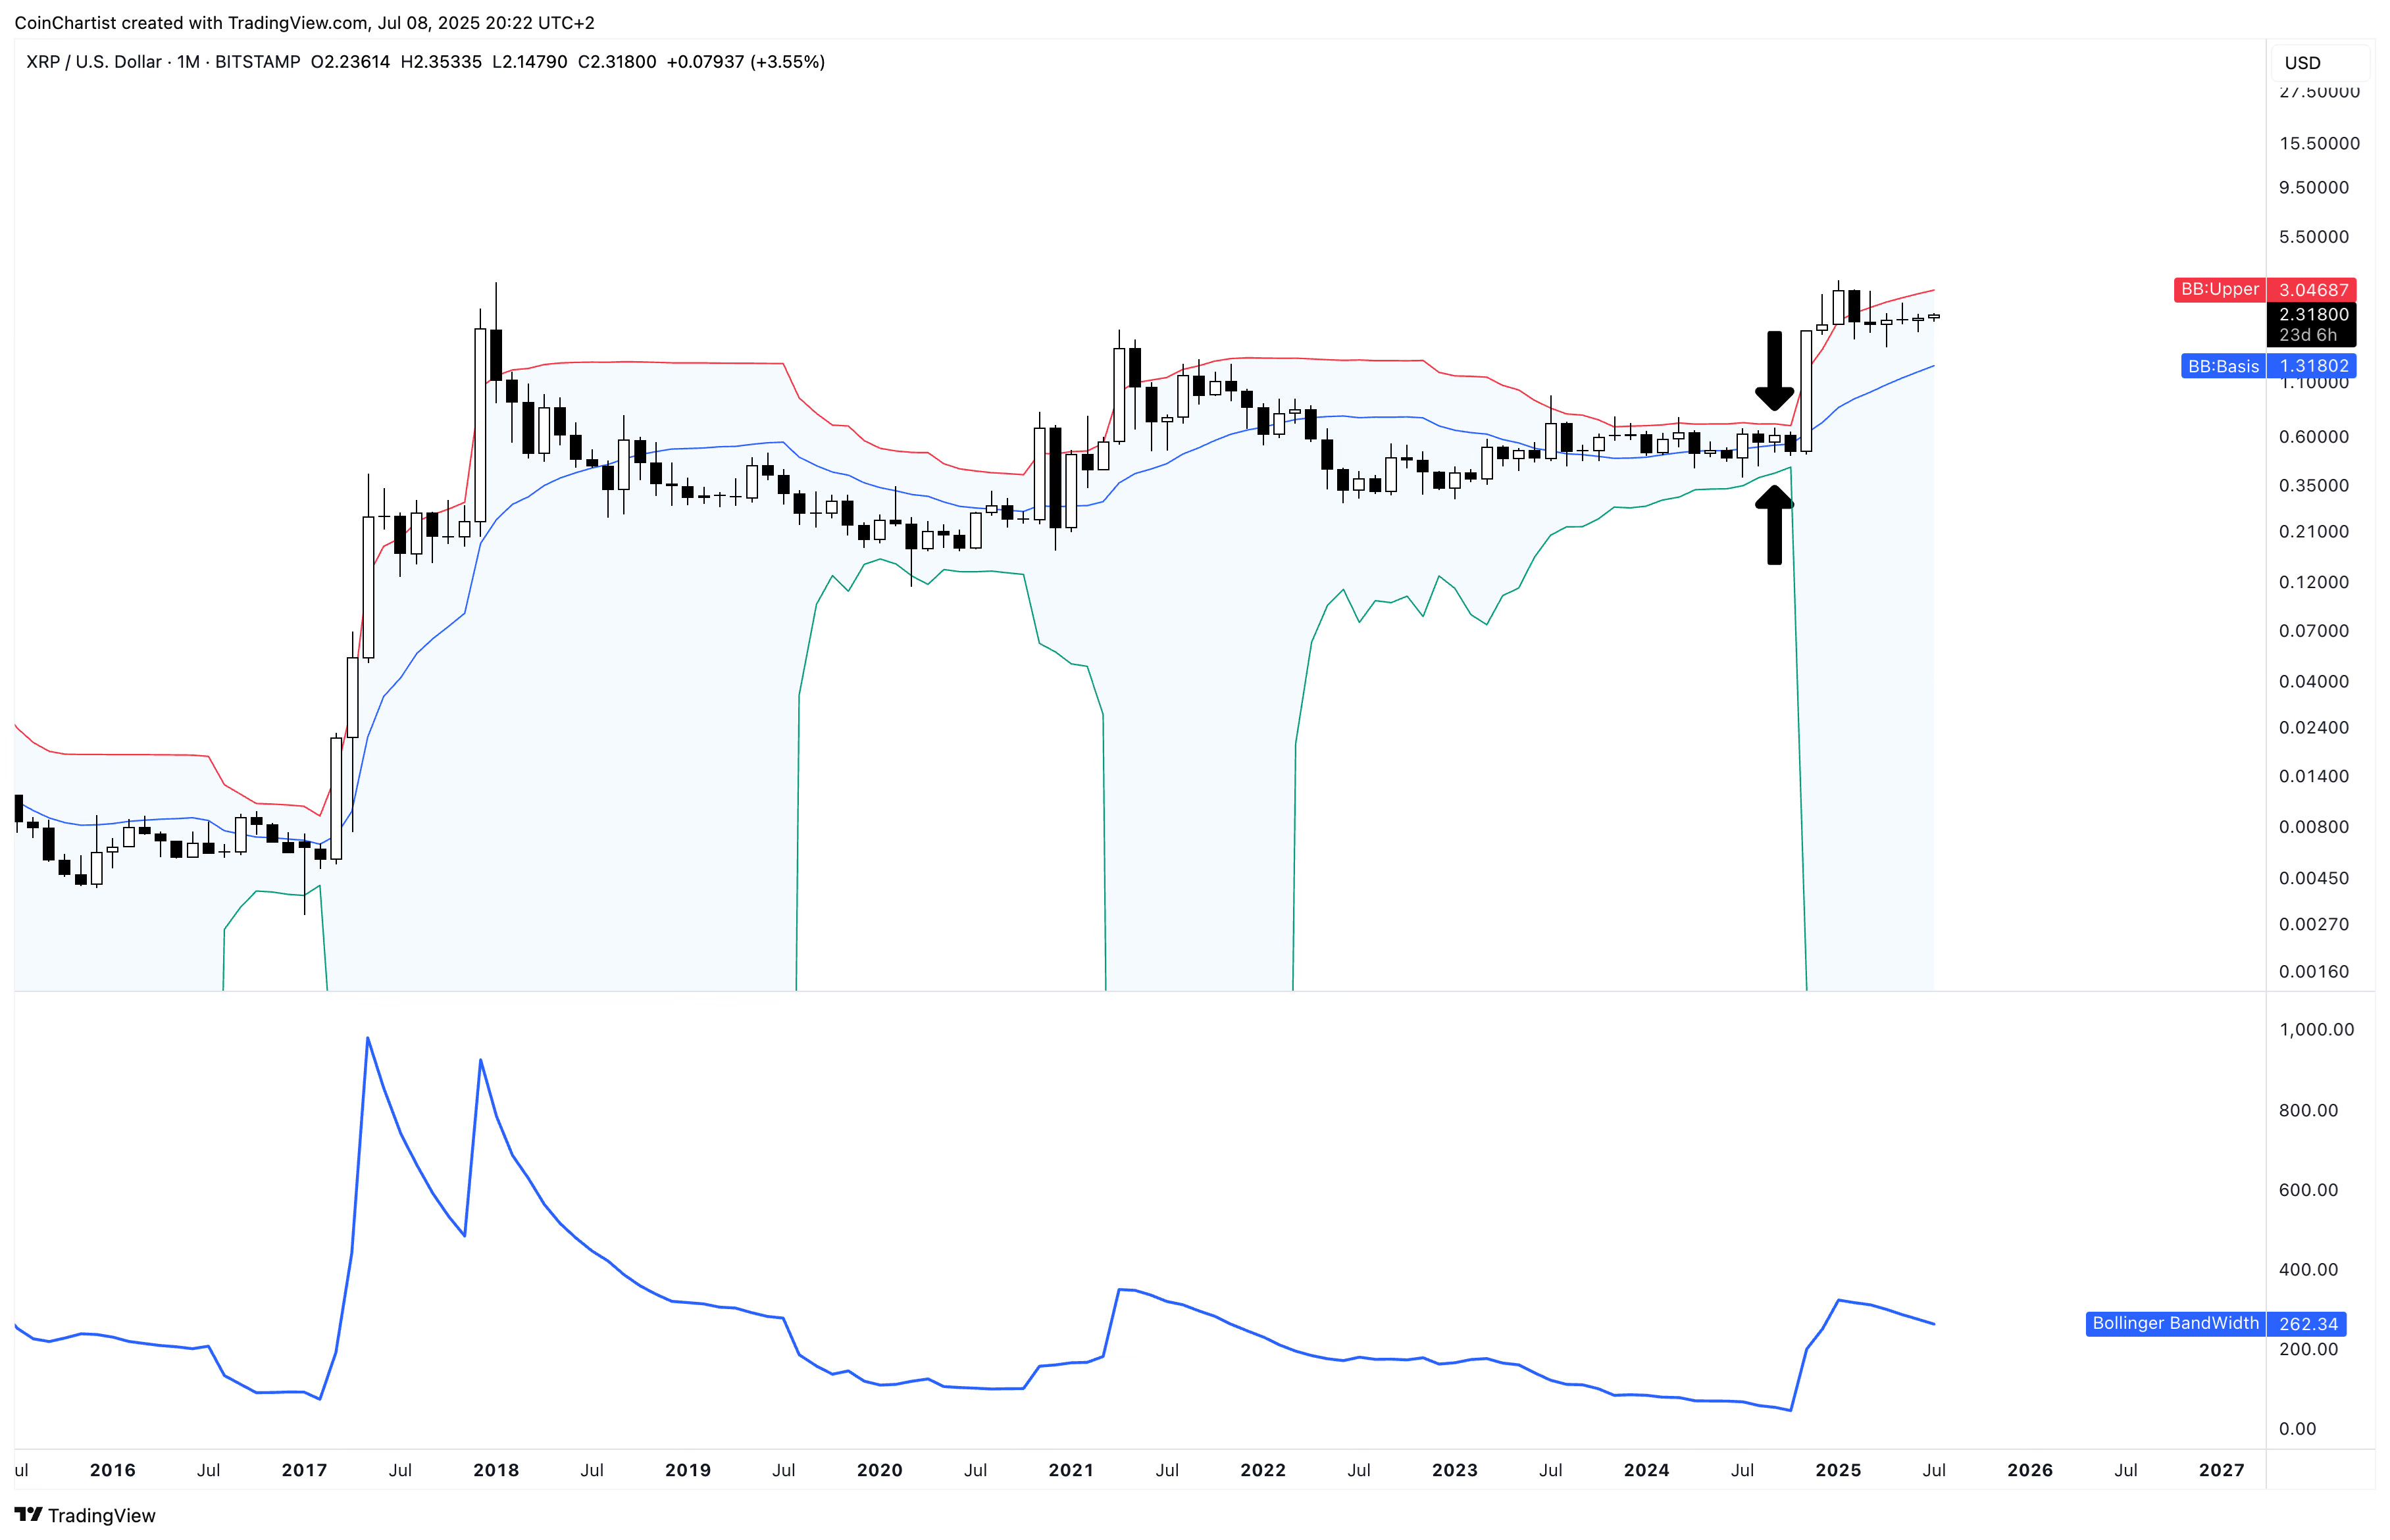
However, it is important to note that a low volatility state only tells us that a high volatility state is eventually coming. It doesn’t tell us exactly when, or in what direction the asset will move when the low volatility phase ends.
Record-Low Volatility
The TOTAL crypto market index, several other crypto related indexes, and several individual crypto assets are all showing some of the lowest volatility ever.
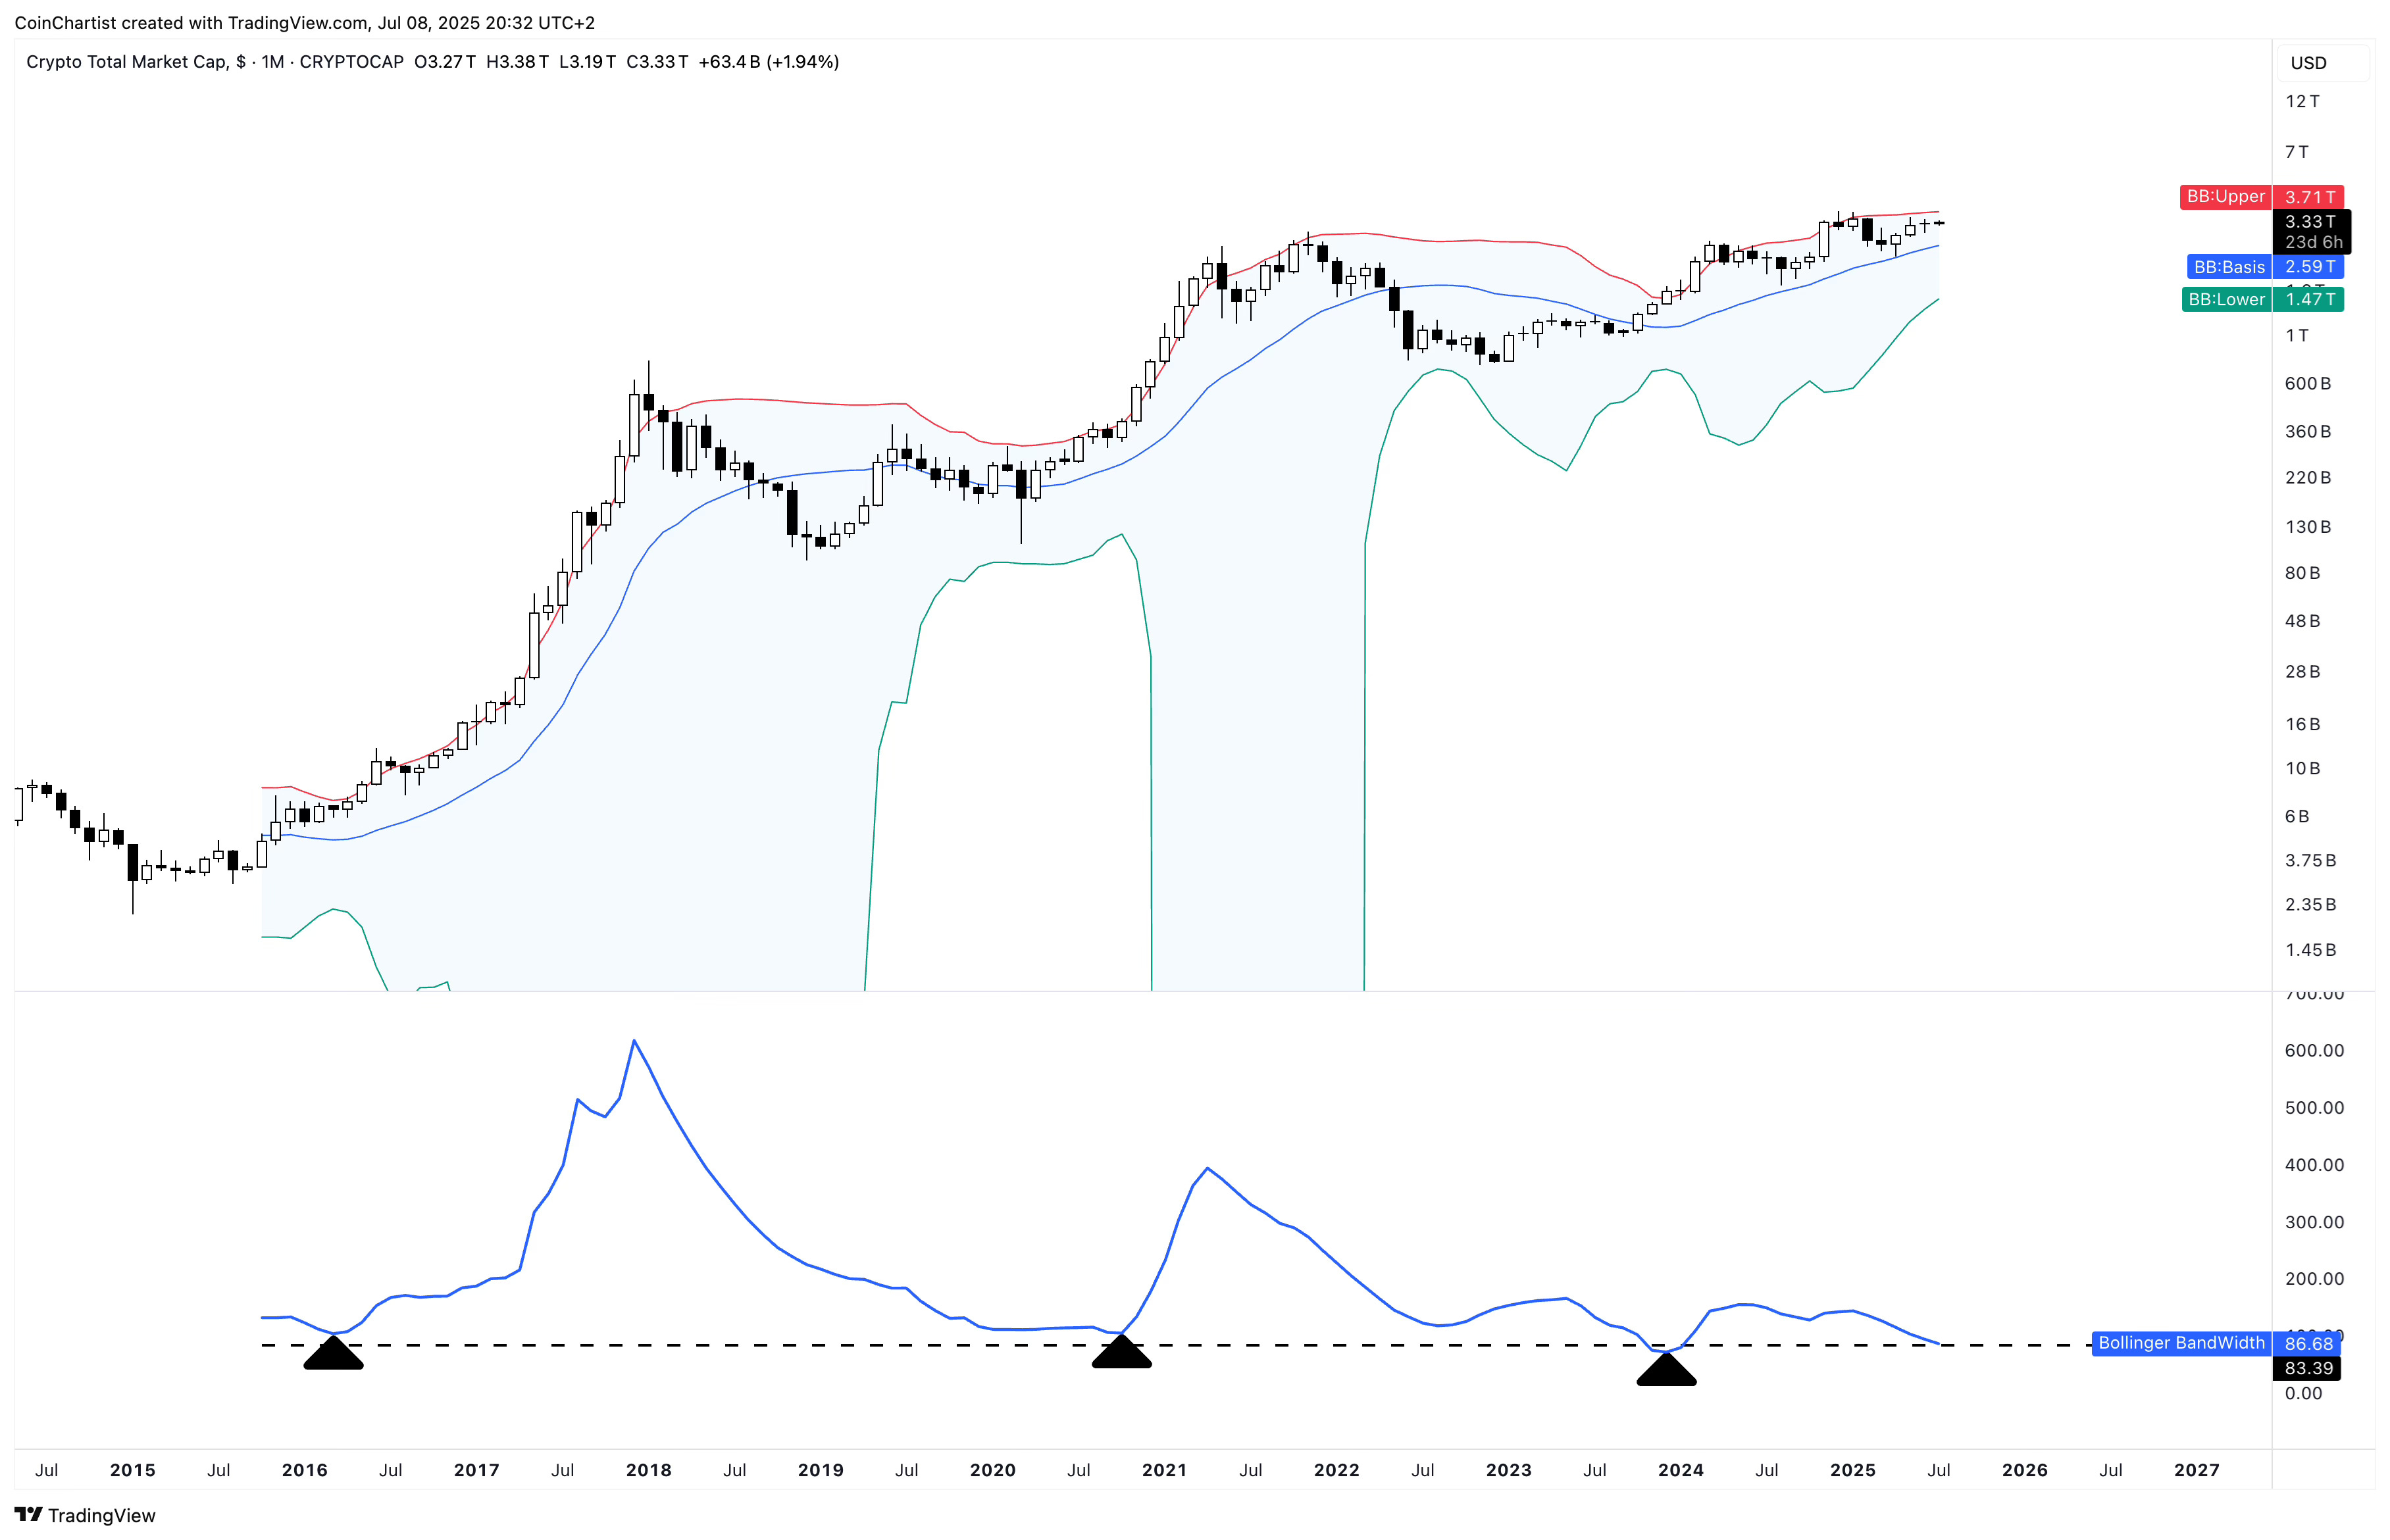
Starting with TOTAL, we can see that the current BandWidth reading is the second-lowest ever. It isn’t quite as low as the December 2023 reading, but it is lower than in 2017 and lower than 2020. BandWidth may need to drop even lower to make a lower low before the market makes a more volatile move. It is also worth noting that the late 2023 BandWidth low didn’t produce much upside – especially not when compared to 2017 and 2020. We can view this in two ways: the bigger move from the 2023 low isn’t done yet and is still in progress, or the move is already over and the current tightness is preparing for something else.
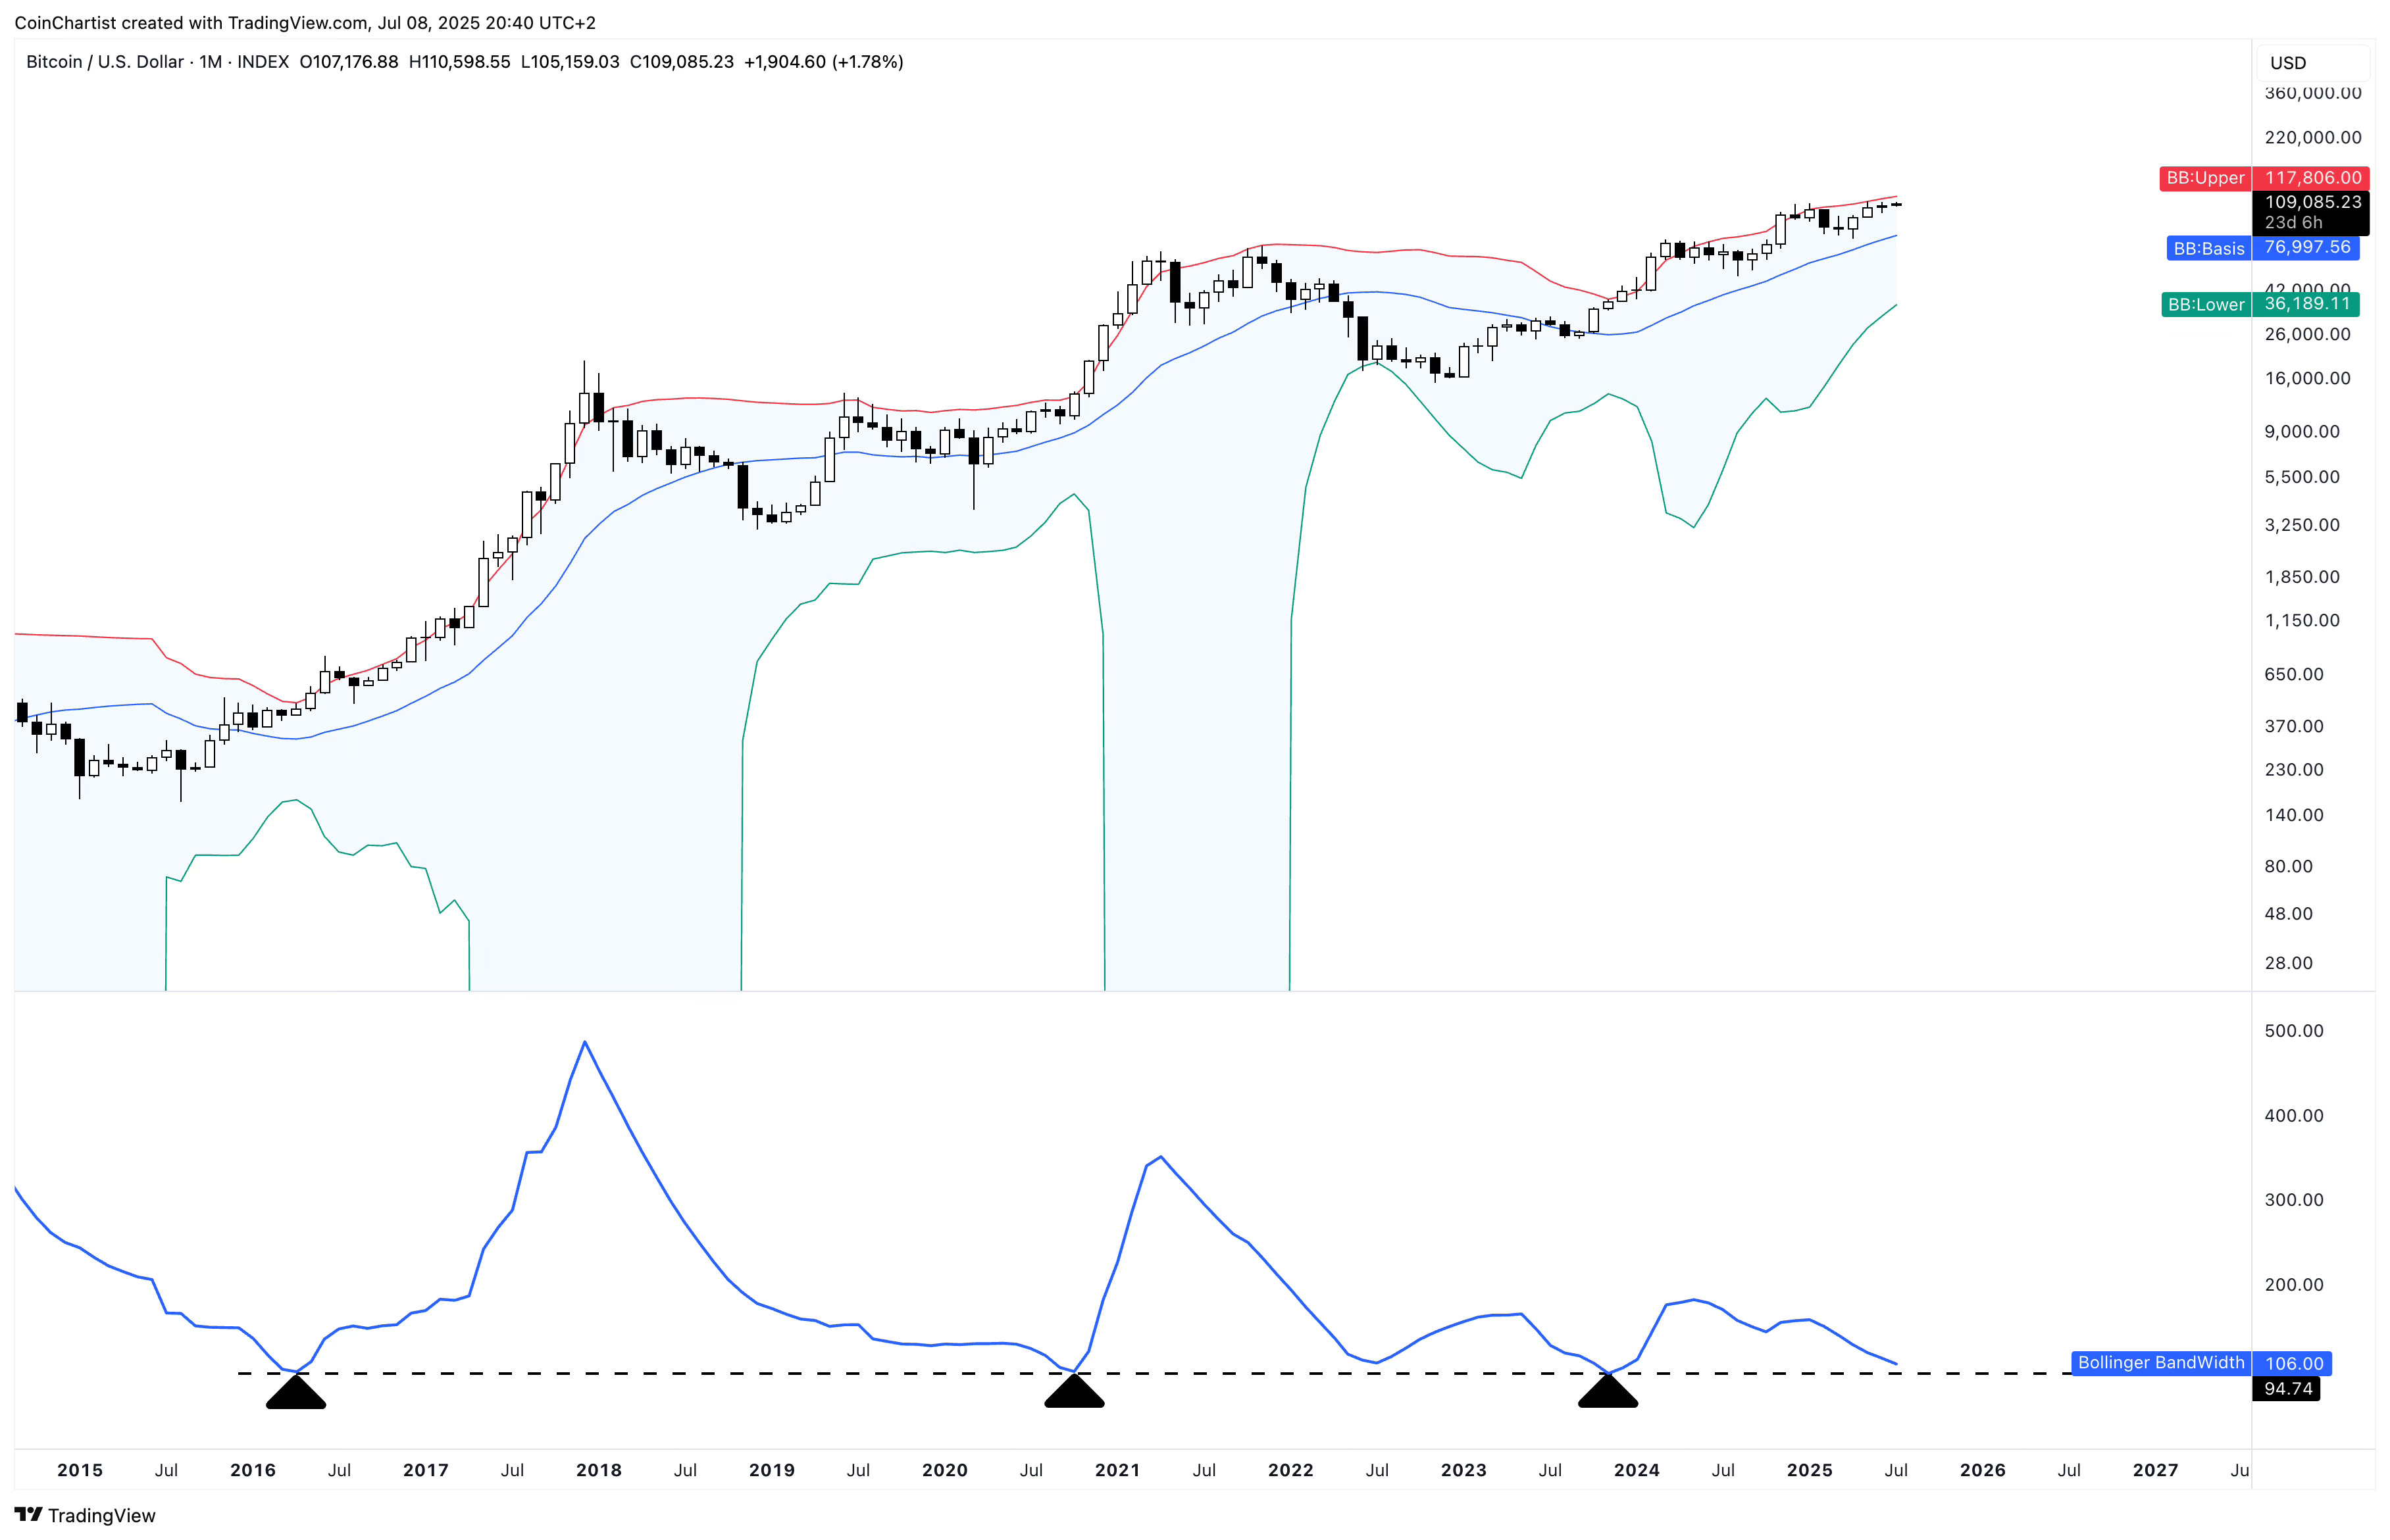
Bitcoin pretty reliably has touched down at the same BandWidth reading before moving into a bull market. BandWidth is currently at 106. Bull market breakouts happen after BandWidth reaches 95. BandWidth is currently pointed downward and the sideways price action almost guarantees that we’ll end up seeing 95 eventually. Like the TOTAL chart, the big move usually happens after the Squeeze. But in 2023 forward, the move has been rather muted by comparison.
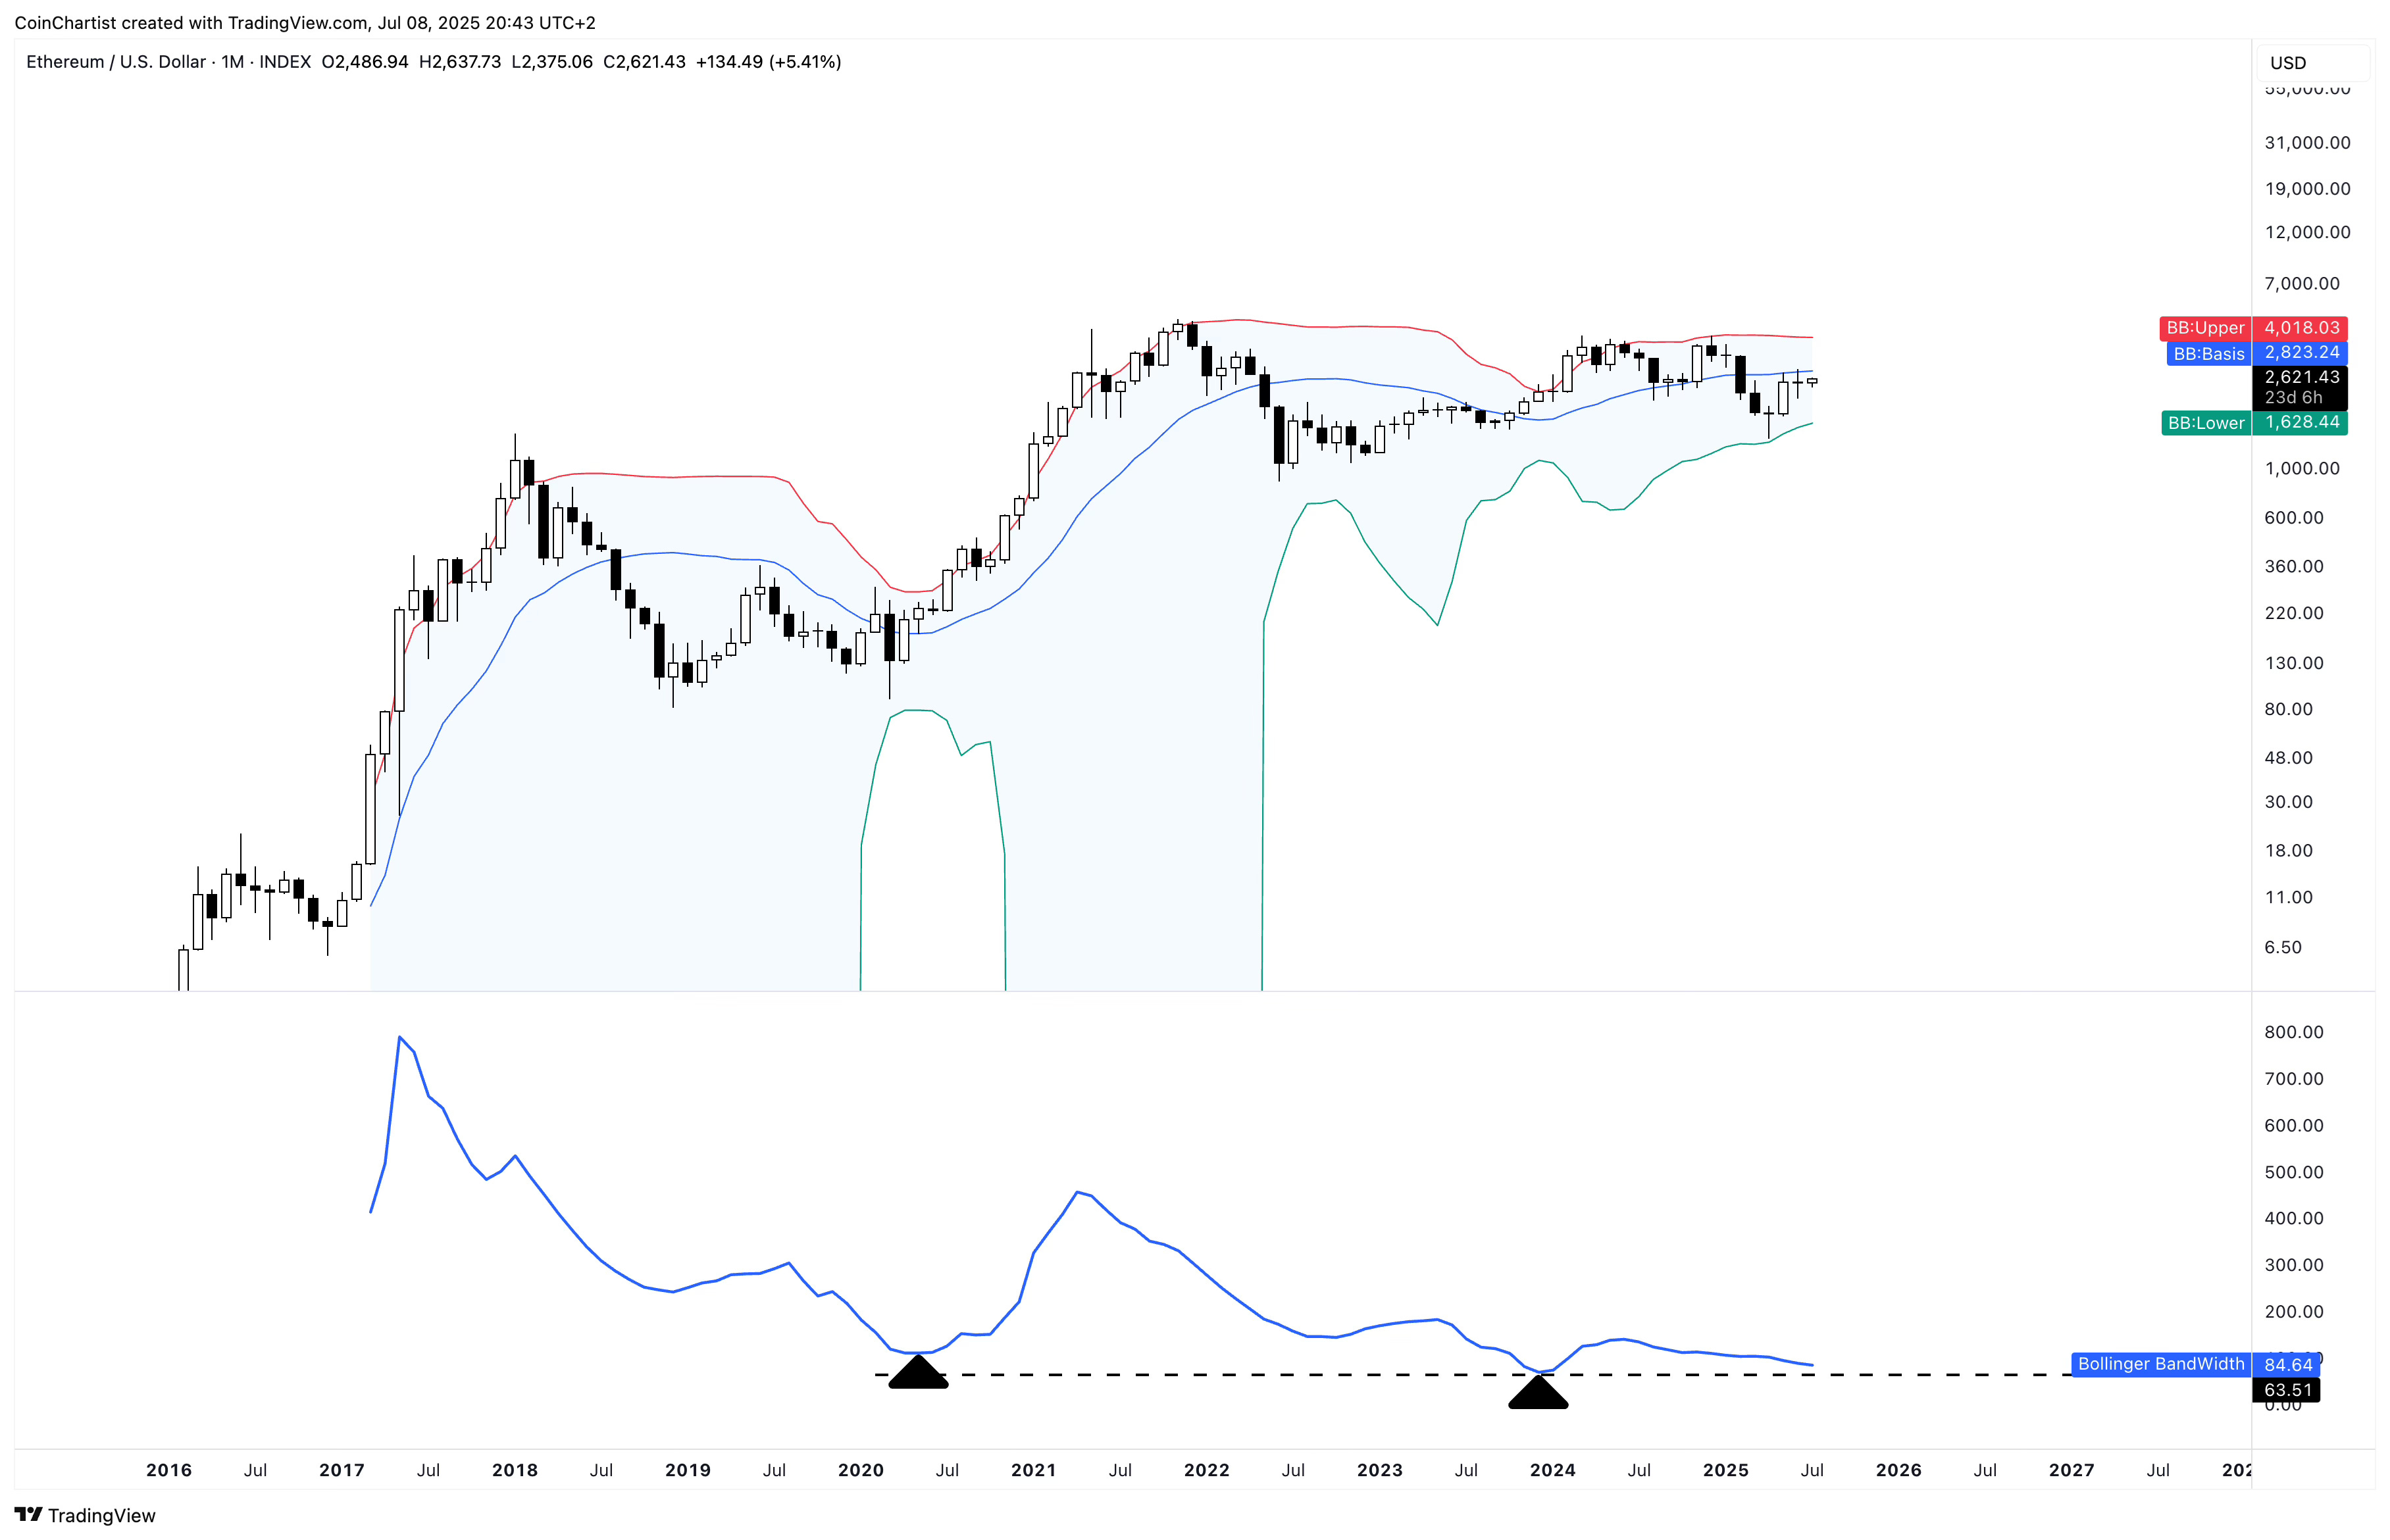
Ethereum is also at historical low readings in BandWidth – lower than the 2020 reading that eventually released one of the biggest altcoin seasons ever. It hasn’t quite reached as low as the 2023 reading, but could be headed there.
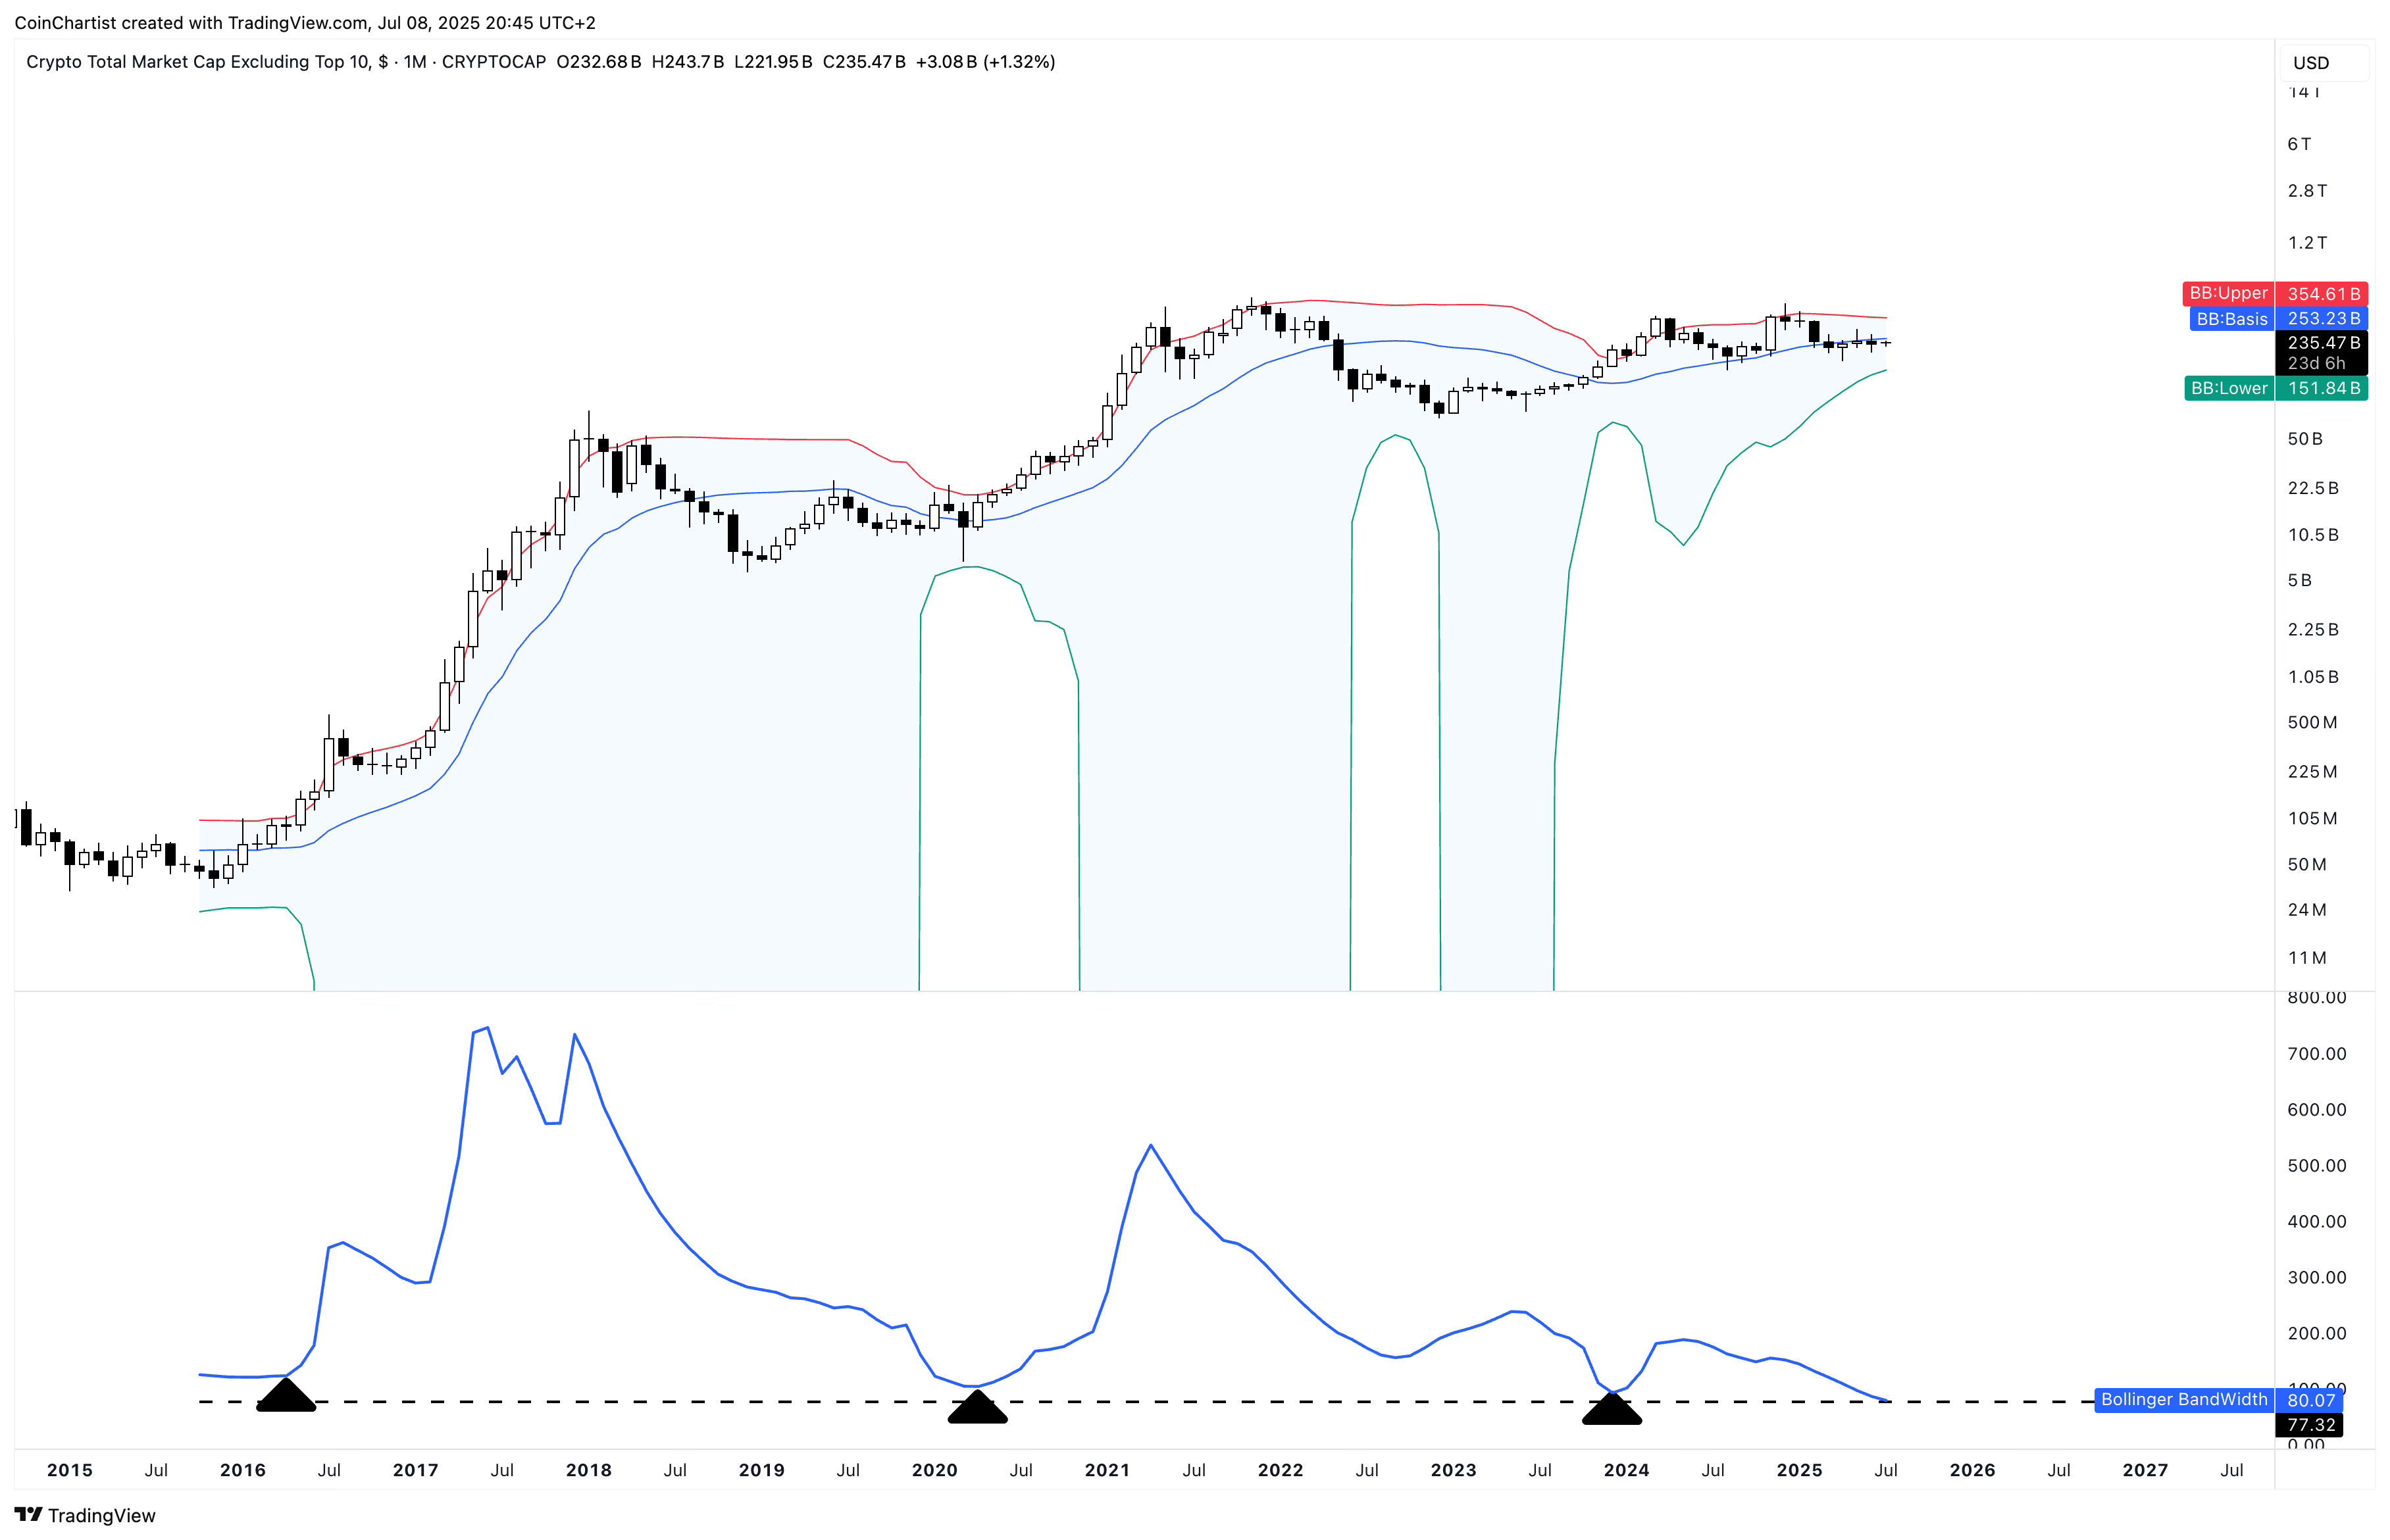
OTHERS, which represents all altcoins outside of the top ten cryptocurrencies by market cap, is at the lowest BandWidth reading ever in crypto history. This is the tightest squeeze we’ve seen and it could mean the biggest move ever will result from this period of low volatility. But again, we don’t yet know the direction of the move. I admittedly struggle to see altcoins outside of the top ten ever pulling off such a large move up due to how little fundamental value they offer. But they’ve certainly done it before and could do it again.
Keep reading with a 7-day free trial
Subscribe to CoinChartist to keep reading this post and get 7 days of free access to the full post archives.