

Failure to Launch
Bitcoin sees rejection at ATH resistance. Is this a failed breakout, or does BTC just need to regain some momentum?

Disclaimer: The information provided in this Substack newsletter is for general informational purposes only and should not be considered as financial advice. Investing involves risk, and past performance is not indicative of future results. Please conduct your own research or consult a financial advisor before making any investment decisions. The newsletter disclaims any liability for losses or damages arising from the use of this information.
Failure to Launch overview:
Bitcoin fails to break out into price discovery
Can an inverse head and shoulders send Bitcoin back higher?
Bitcoin strength, or dollar weakness? Comparing BTC against top currencies
Elliott Wave count alternatives: TOTAL, BTCEUR, & BTC/Gold
A technically confusing comparison across crypto charts
Is the digital Gold narrative in trouble?
Market timing: A deep dive into the TD Sequential timing tool
Will we ever see an altcoin season again?
It has been a frustrating few weeks for me as an analyst. Months ago, technicals began to turn over in Bitcoin and I immediately began to call attention to this potential change. I set clear invalidation levels that were hit, expect for a one that required a strong monthly close above the upper Bollinger Band. Bitcoin hitting a new all-time high should have sparked a surge of buying on high volume that led to a sustained breakout. But it didn’t.
So while bearish invalidation levels were tagged, Bitcoin isn’t exactly bullish, either. The lack of a breakout makes me feel like something remains wrong and could cause some widespread confusion in the coming days and weeks. While searching for potential answers and scenarios, I’ve come across some truly interesting charts that could suggest that the new all-time high in BTCUSD was more due to dollar weakness than Bitcoin strength.
These same charts I’ve stumbled upon still have lower highs, which keep a bearish Elliott Wave count intact. Several of these charts also show bearish high timeframe technicals that would potentially support a more bearish phase to come. To try and make more sense of the discrepancy between Bitcoin against USD and other currencies, I’ve done a deep dive on the TD Sequential market timing tool to see what it says about the timing of a top or bear market across all charts examined.
Finally, I’ve got some updated charts of Bitcoin versus Gold, Bitcoin Dominance, and TOTAL 2, representing the state of altcoins.
Side note: In addition to this Substack newsletter, I am over at Slice where I am posting three videos per week, trade setups, and other education. I will soon be opening up 3 spots for private 1-on-1 private mentorship. Visit Slice to secure your spot.
Expansion Dysfunction
When a range is left behind to the upside, Bitcoin should begin price expansion. Unfortunately, Bitcoin was able to get it up and make a new all-time high, but it wasn’t able to keep it up very long. Everyone is left unsatisfied.
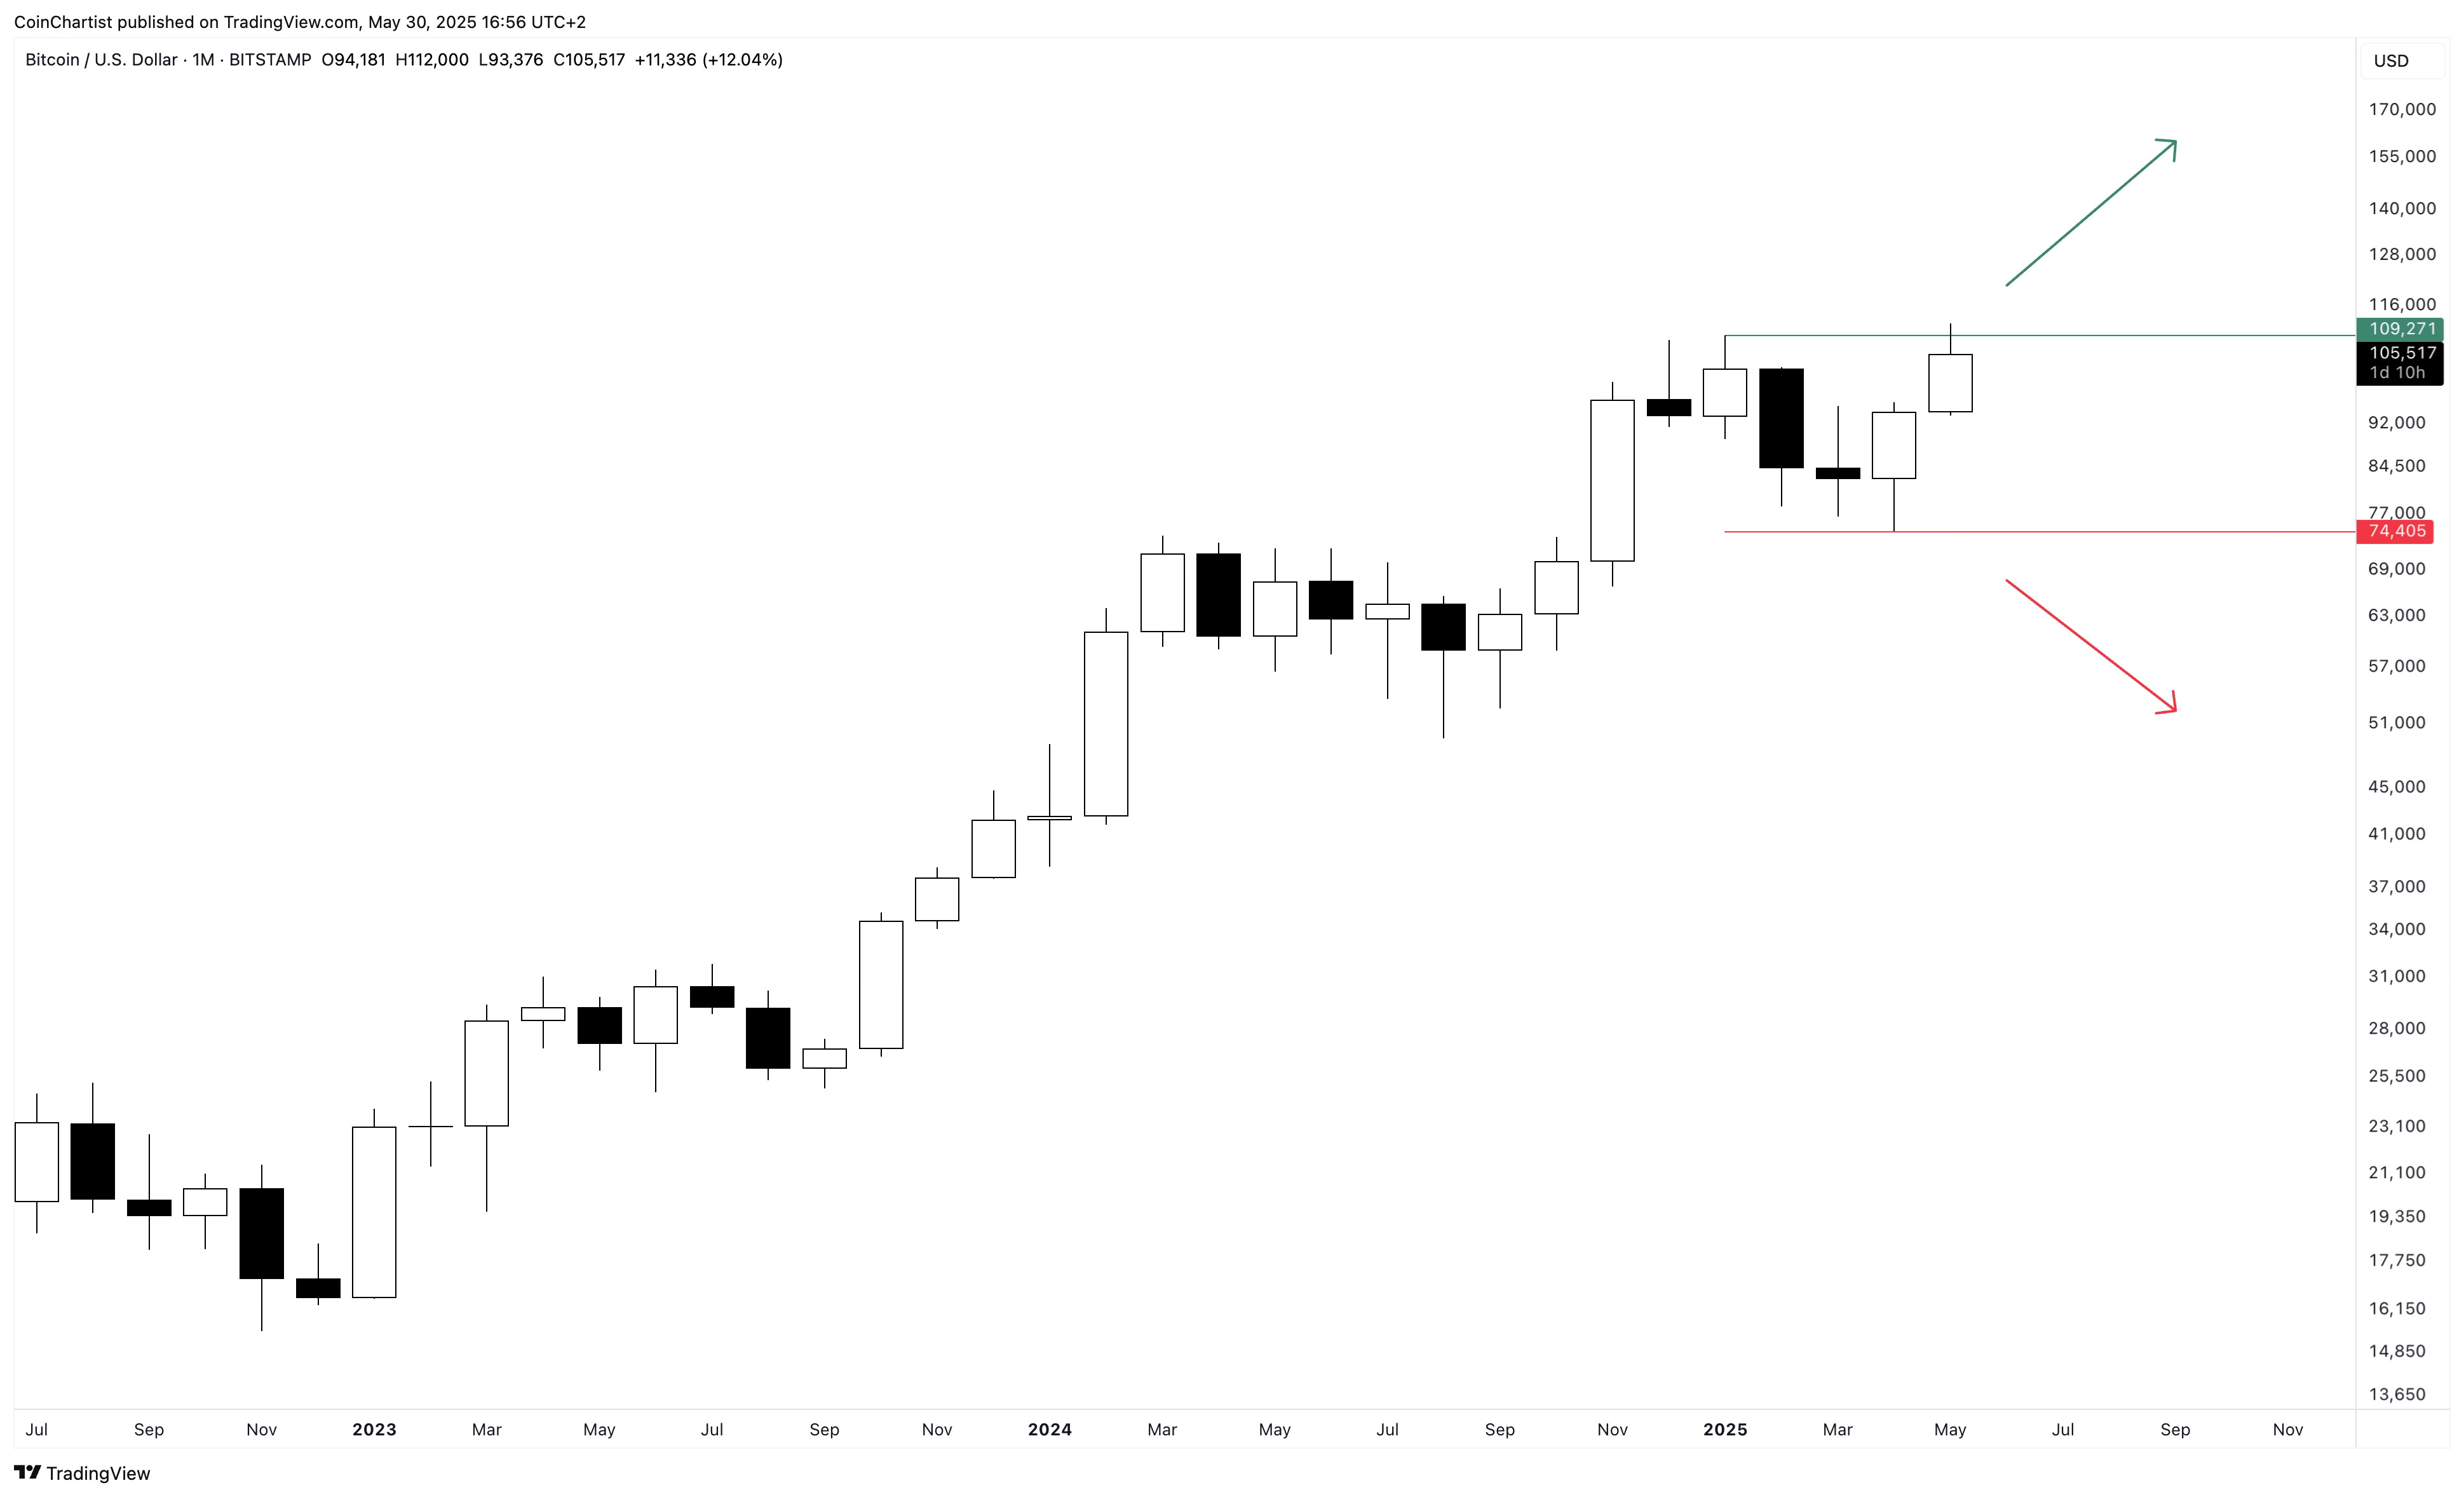
This monthly chart with only a resistance and support line drawn shows where Bitcoin will need to close above or below to ensure we’ve got a decisive move. Any candle closes within this range suggests more sideways. Only a monthly close above the green line or a monthly close below the red line should be believed.
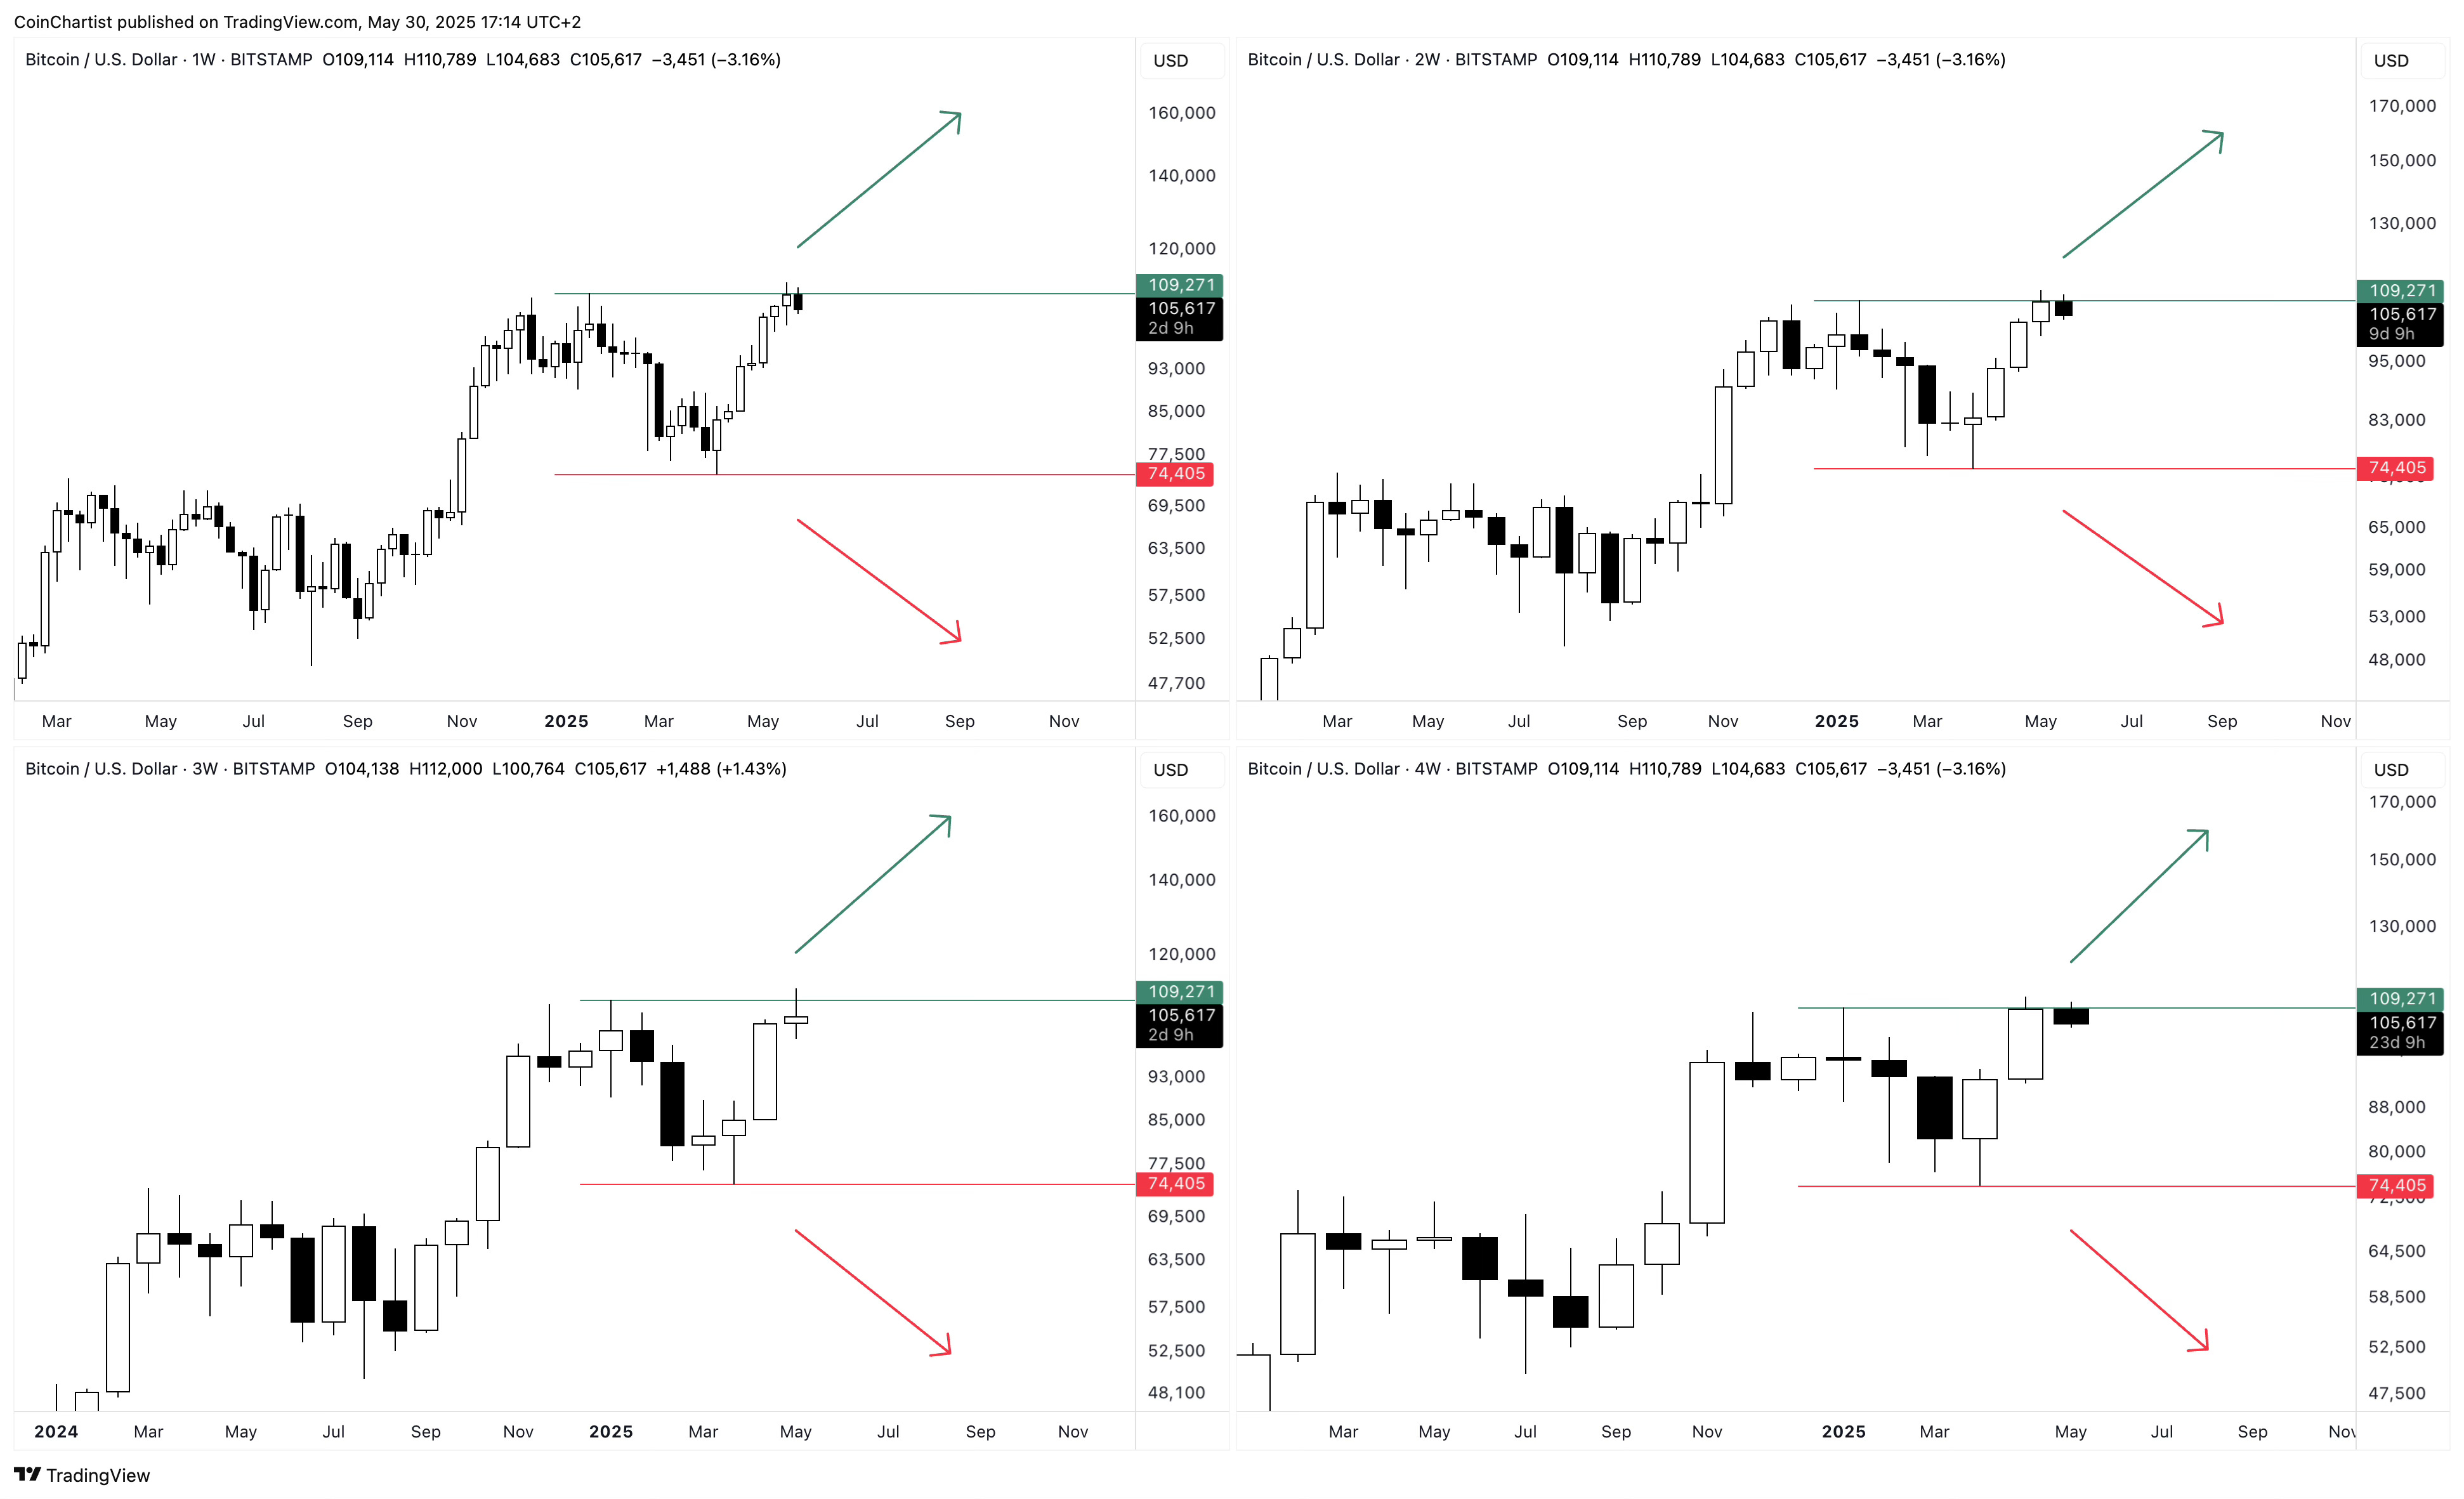
The same drawn lines acted as precise resistance for BTCUSD on the weekly, 2-week, 3-week, and 4-week. None of these weekly candles closed above the upper green horizontal line.
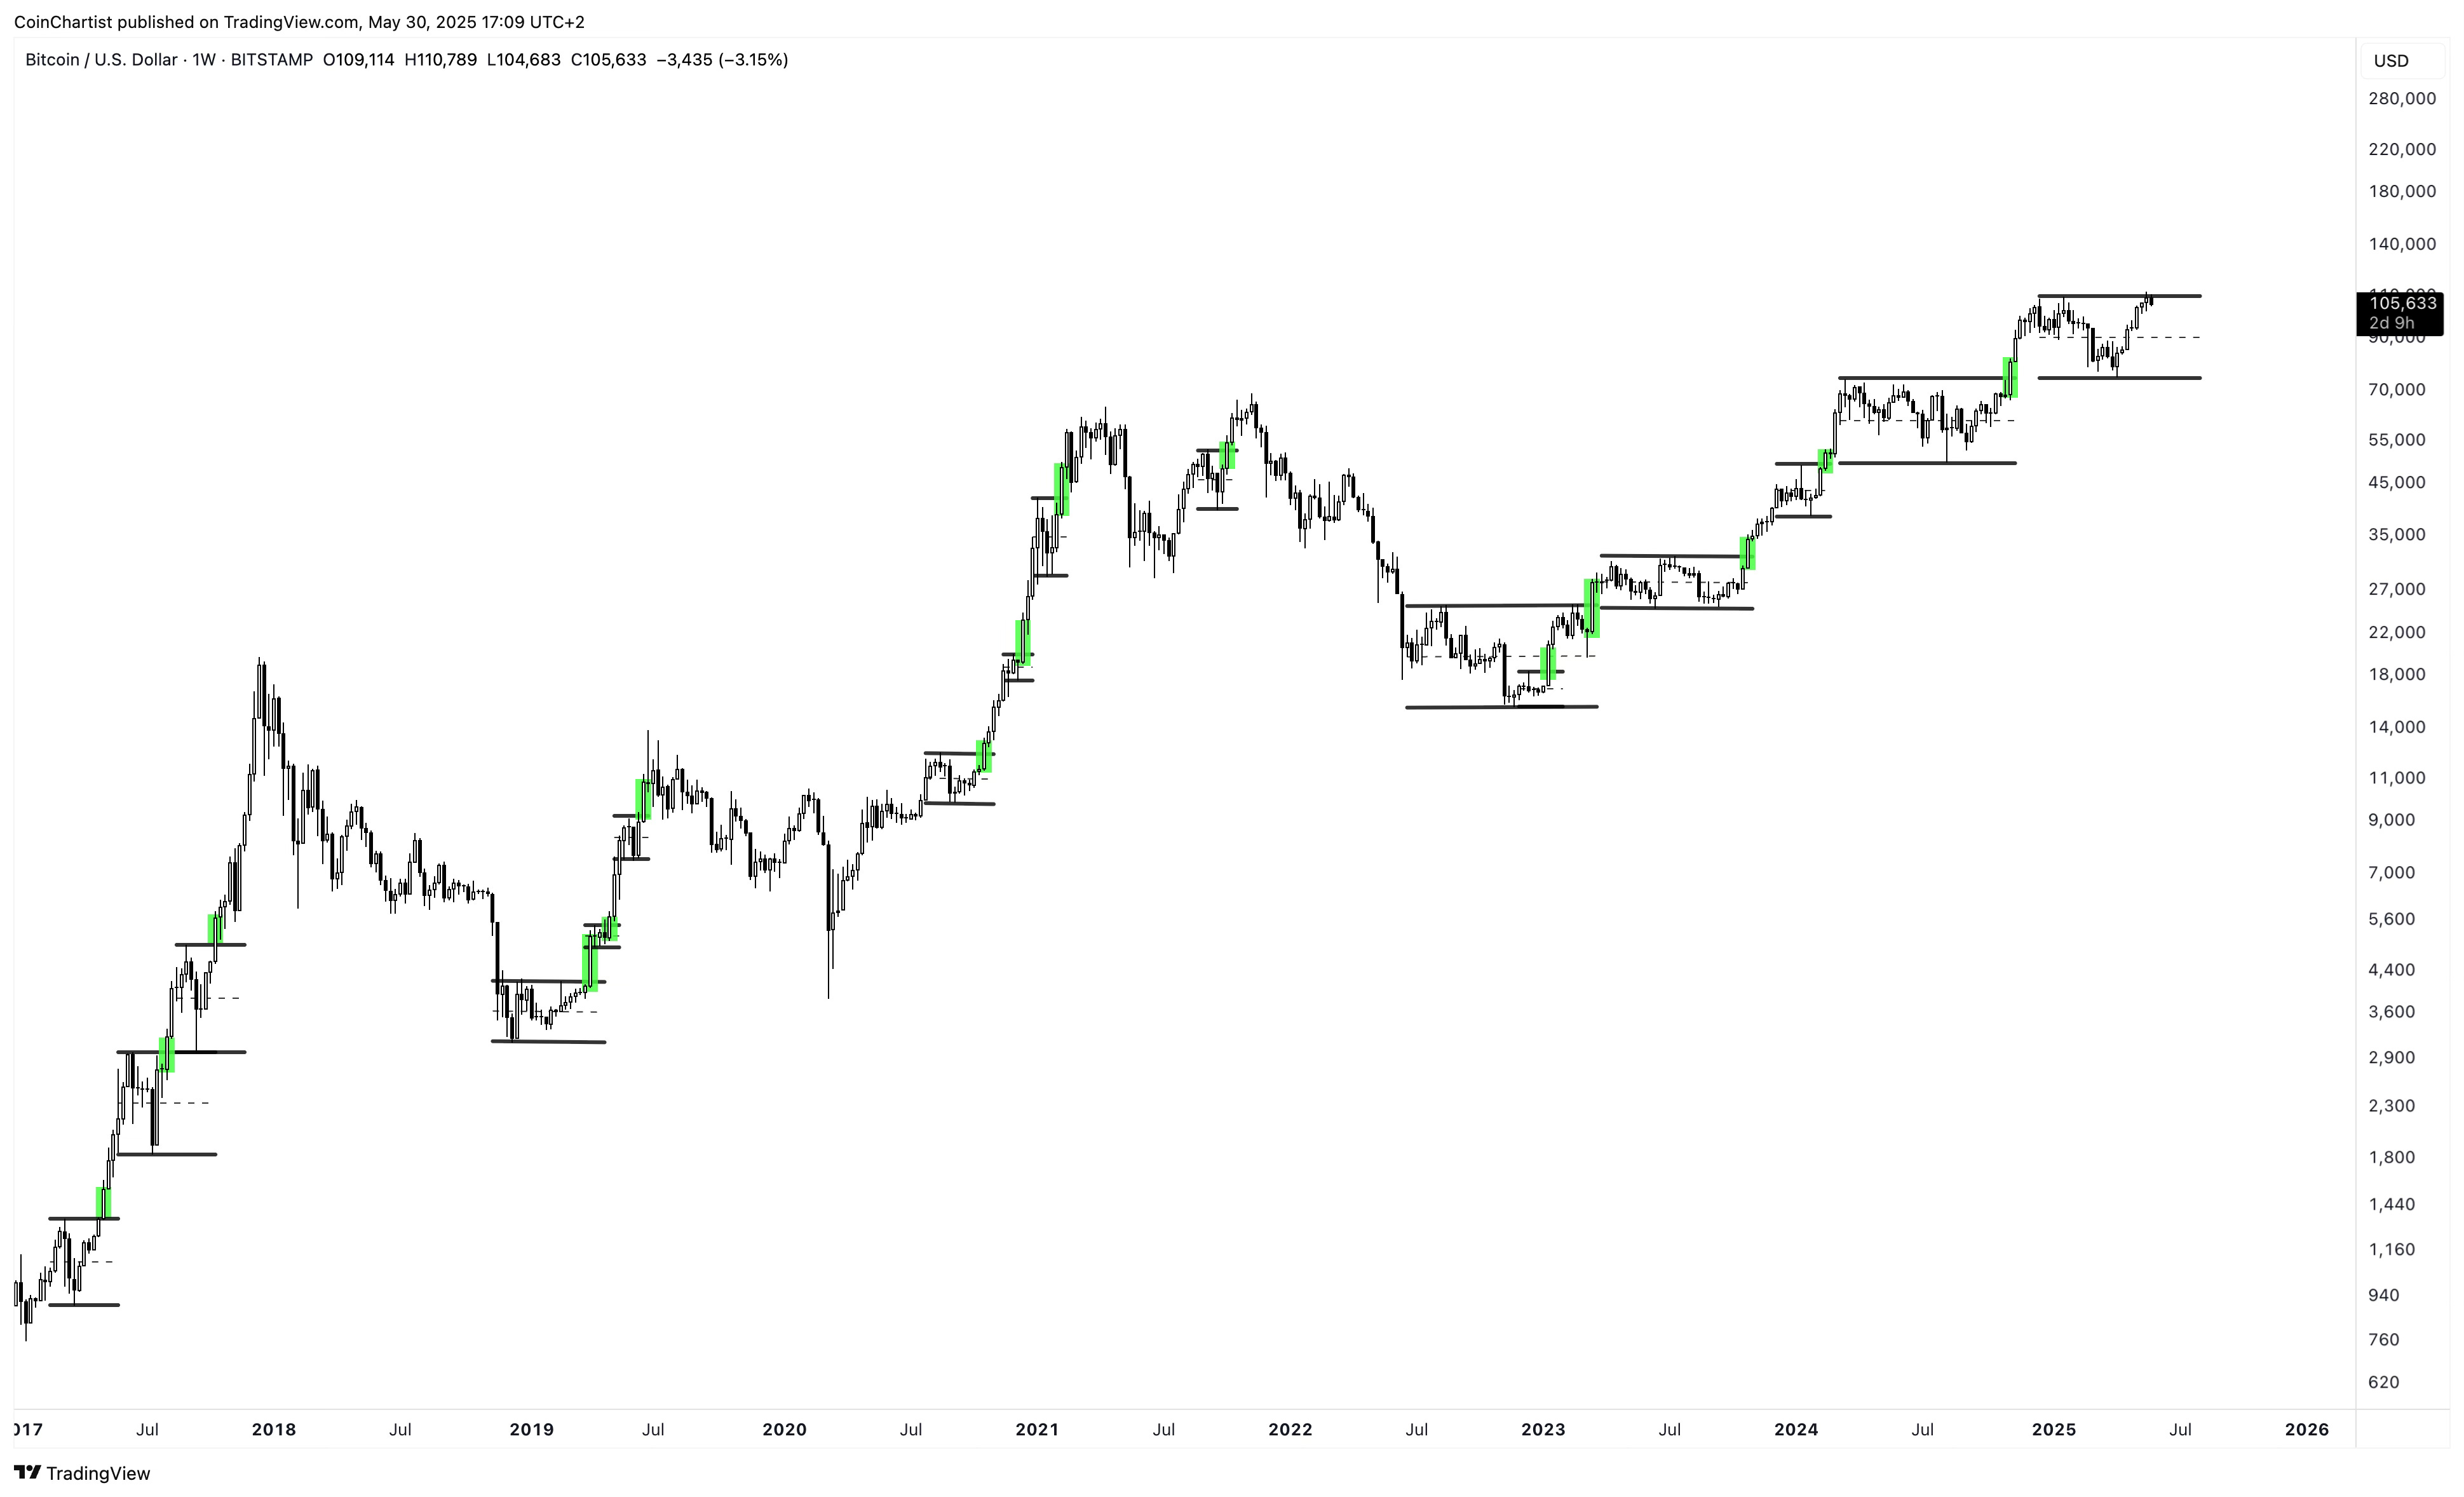
This chart shows fifteen different bullish range breakouts on the weekly scale. Every major weekly bullish breakout over the last seven years has resulted in a strong weekly candlestick that leaves the range long behind. This is the first time this did not happen, which suggests that this isn’t a range breakout we are dealing with here.
A Quick Heads Up
This higher high on the BTCUSD trading pair has everyone insanely bullish and for good reason. A higher high is typically a sign that an uptrend is still active. Until a higher low and lower low is made, it is hard to suggest we are in a downtrend.
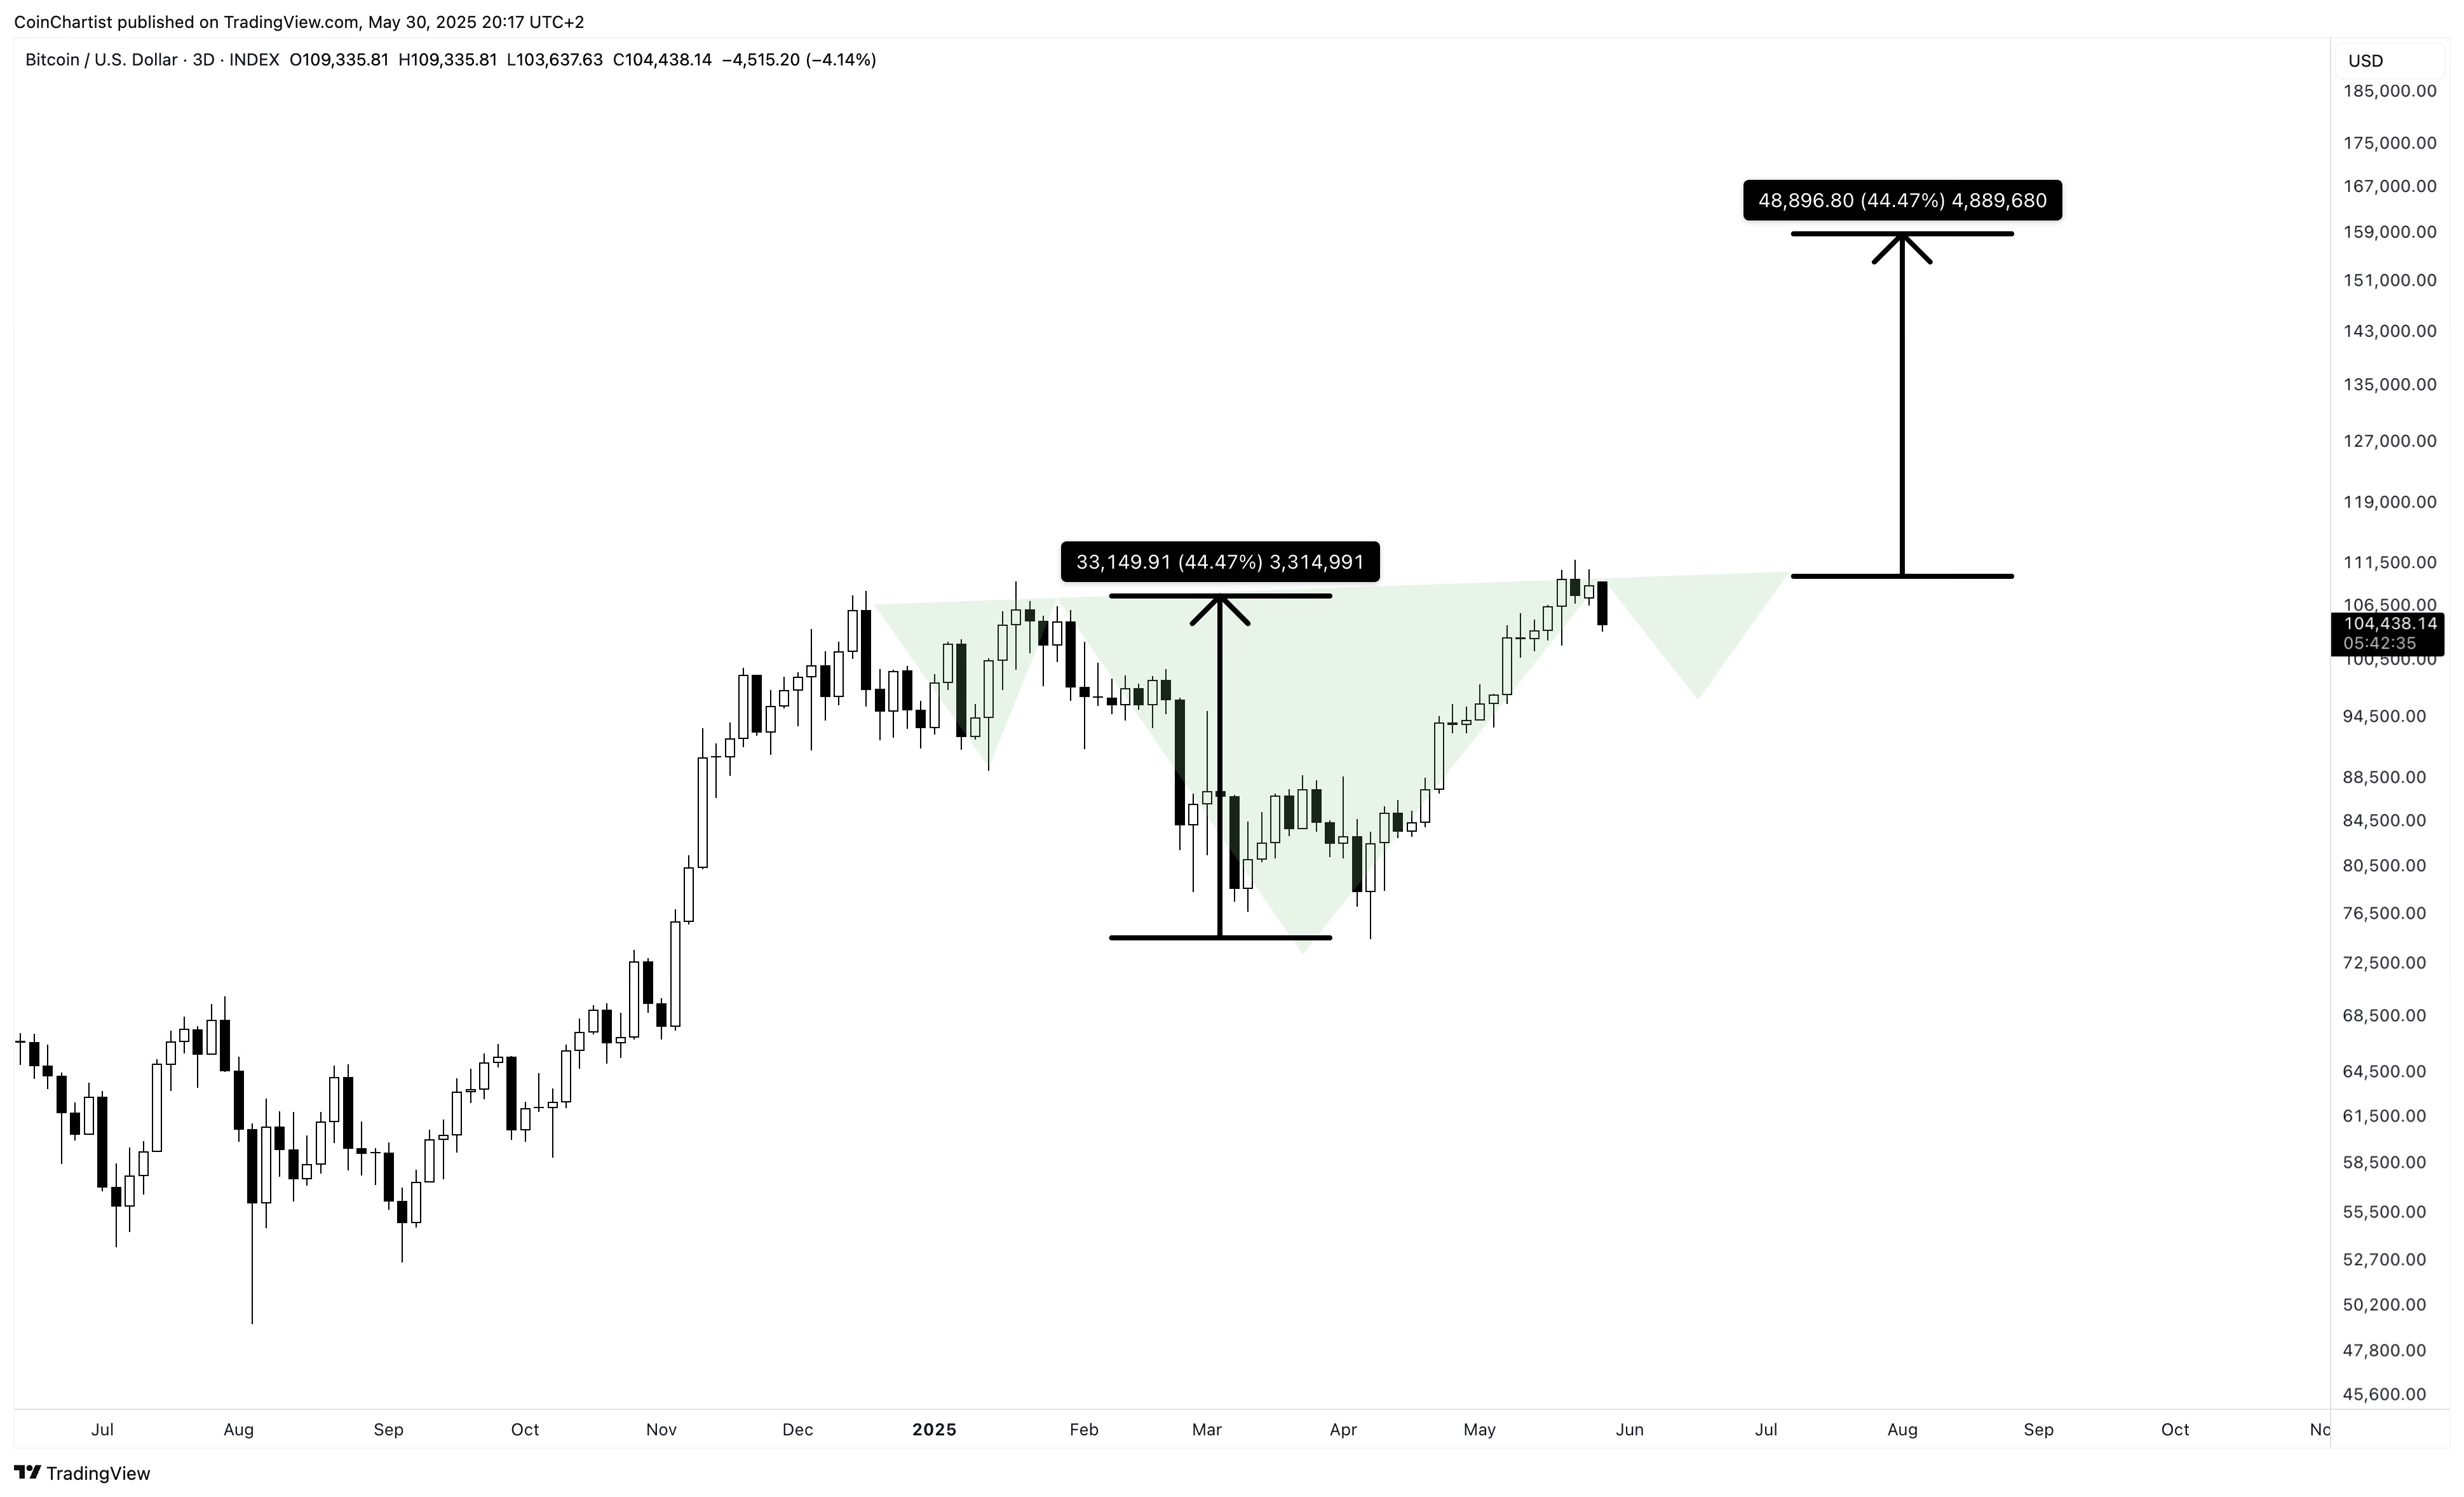
Because the expectation is that Bitcoin is very bullish, few are expecting a retest of the bottom of the range. Instead, bulls are going to be looking for longs around the level of a right shoulder in a large, inverse head and shoulders pattern. This is a very possible scenario, that based on the measure rule, would take Bitcoin to over $150,000. However, if everyone is looking to go long there – chances are that support level doesn’t hold.
Currency Comparison
BTCUSD made an important higher high that, as mentioned, suggests an uptrend is active. But what should we expect to happen if most of the other top currencies of the world didn’t make a higher high, and instead put in a higher low? I am genuinely unsure, but my instincts and the market’s behavior make me believe there's more to the charts below.
Keep reading with a 7-day free trial
Subscribe to CoinChartist to keep reading this post and get 7 days of free access to the full post archives.