

Feeling Moody
The US' credit rating was downgraded. Why this could benefit Bitcoin, and what it means for stocks and bonds.

Disclaimer: The information provided in this Substack newsletter is for general informational purposes only and should not be considered as financial advice. Investing involves risk, and past performance is not indicative of future results. Please conduct your own research or consult a financial advisor before making any investment decisions. The newsletter disclaims any liability for losses or damages arising from the use of this information.
Feeling Moody overview:
How Moody’s downgrade could impact financial markets
Bitcoin makes a new ATH, now what?
Is this a breakout or fake out? Analyzing potential non-confirmation
Not yet altcoins — Bitcoin season holds on
LTC looks ready, XRP remains strong, but ETH is still scary despite recovery
Stocks and bonds are reacting to Moody’s downgrade
This week, Bitcoin made a new all-time high. My invalidation levels were hit, and Elliott Wave counts have been nullified. So what now? All in, right? Not so fast. This weekend’s weekly close and the May monthly close will help clarify if this is a true breakout where we will see strong continuation, or if this is some type of false breakout that could lead to more retracement within the trading range.
Despite Bitcoin’s rally to a new record, financial markets are still in a fragile state. Bitcoin may finally prove its worth as a safe haven asset and a hedge against inflation alongside Gold. Because it is starting to look like something is going to break one way or another.
The cracks were already there. But after trading closed last week, the United States’ credit rating was downgraded by Moody’s from Aa1 to Aaa. Past downgrades led to mixed reactions in the stock market. The stock market mostly shook off the news, but suddenly bond yields started to climb to local highs – potentially ready to make a move up.
Treasuries represent government debt. Much like individuals pay a higher interest rate if they have a lower credit score, investors demand higher yields on riskier government debt. And as such, yields began to rise.
Higher yields make it more expensive for the US to issue new debt. Budget deficits grow faster, worsening fiscal sustainability. The budget situation in the United States is already dire.
The Federal Reserve may need to step in and become the buyer of last resort for the bond market – but this creates inflationary pressure. Turning back on the money printer will push inflation higher and risk currency debasement. Nearly every major superpower has fallen out of power due to currency debasement. The fear is that history is repeating itself.
Bitcoin was born during the 2008 financial crisis because of the growing risk of currency debasement. The finite supply was designed so Bitcoin price would grow further as currencies lost value. Gold led the way with its strongest rally in over 40 years. Will Bitcoin prove itself here after all? Or will it succumb to the weight of toppling traditional markets? And if Bitcoin is ready to rally further, does this mean altcoins will also finally perform? This issue explores all of these themes.
Side note: In addition to this Substack newsletter, I am over at Slice where I am posting three videos per week, trade setups, and other education. For Memorial Day weekend, I am offering 30% off with the promo code TONY30. Visit Slice to secure your spot.
All-Time Highs
Bitcoin made a new all-time high this week, and more importantly, made a higher high — which is a characteristic of an uptrend and continuation.
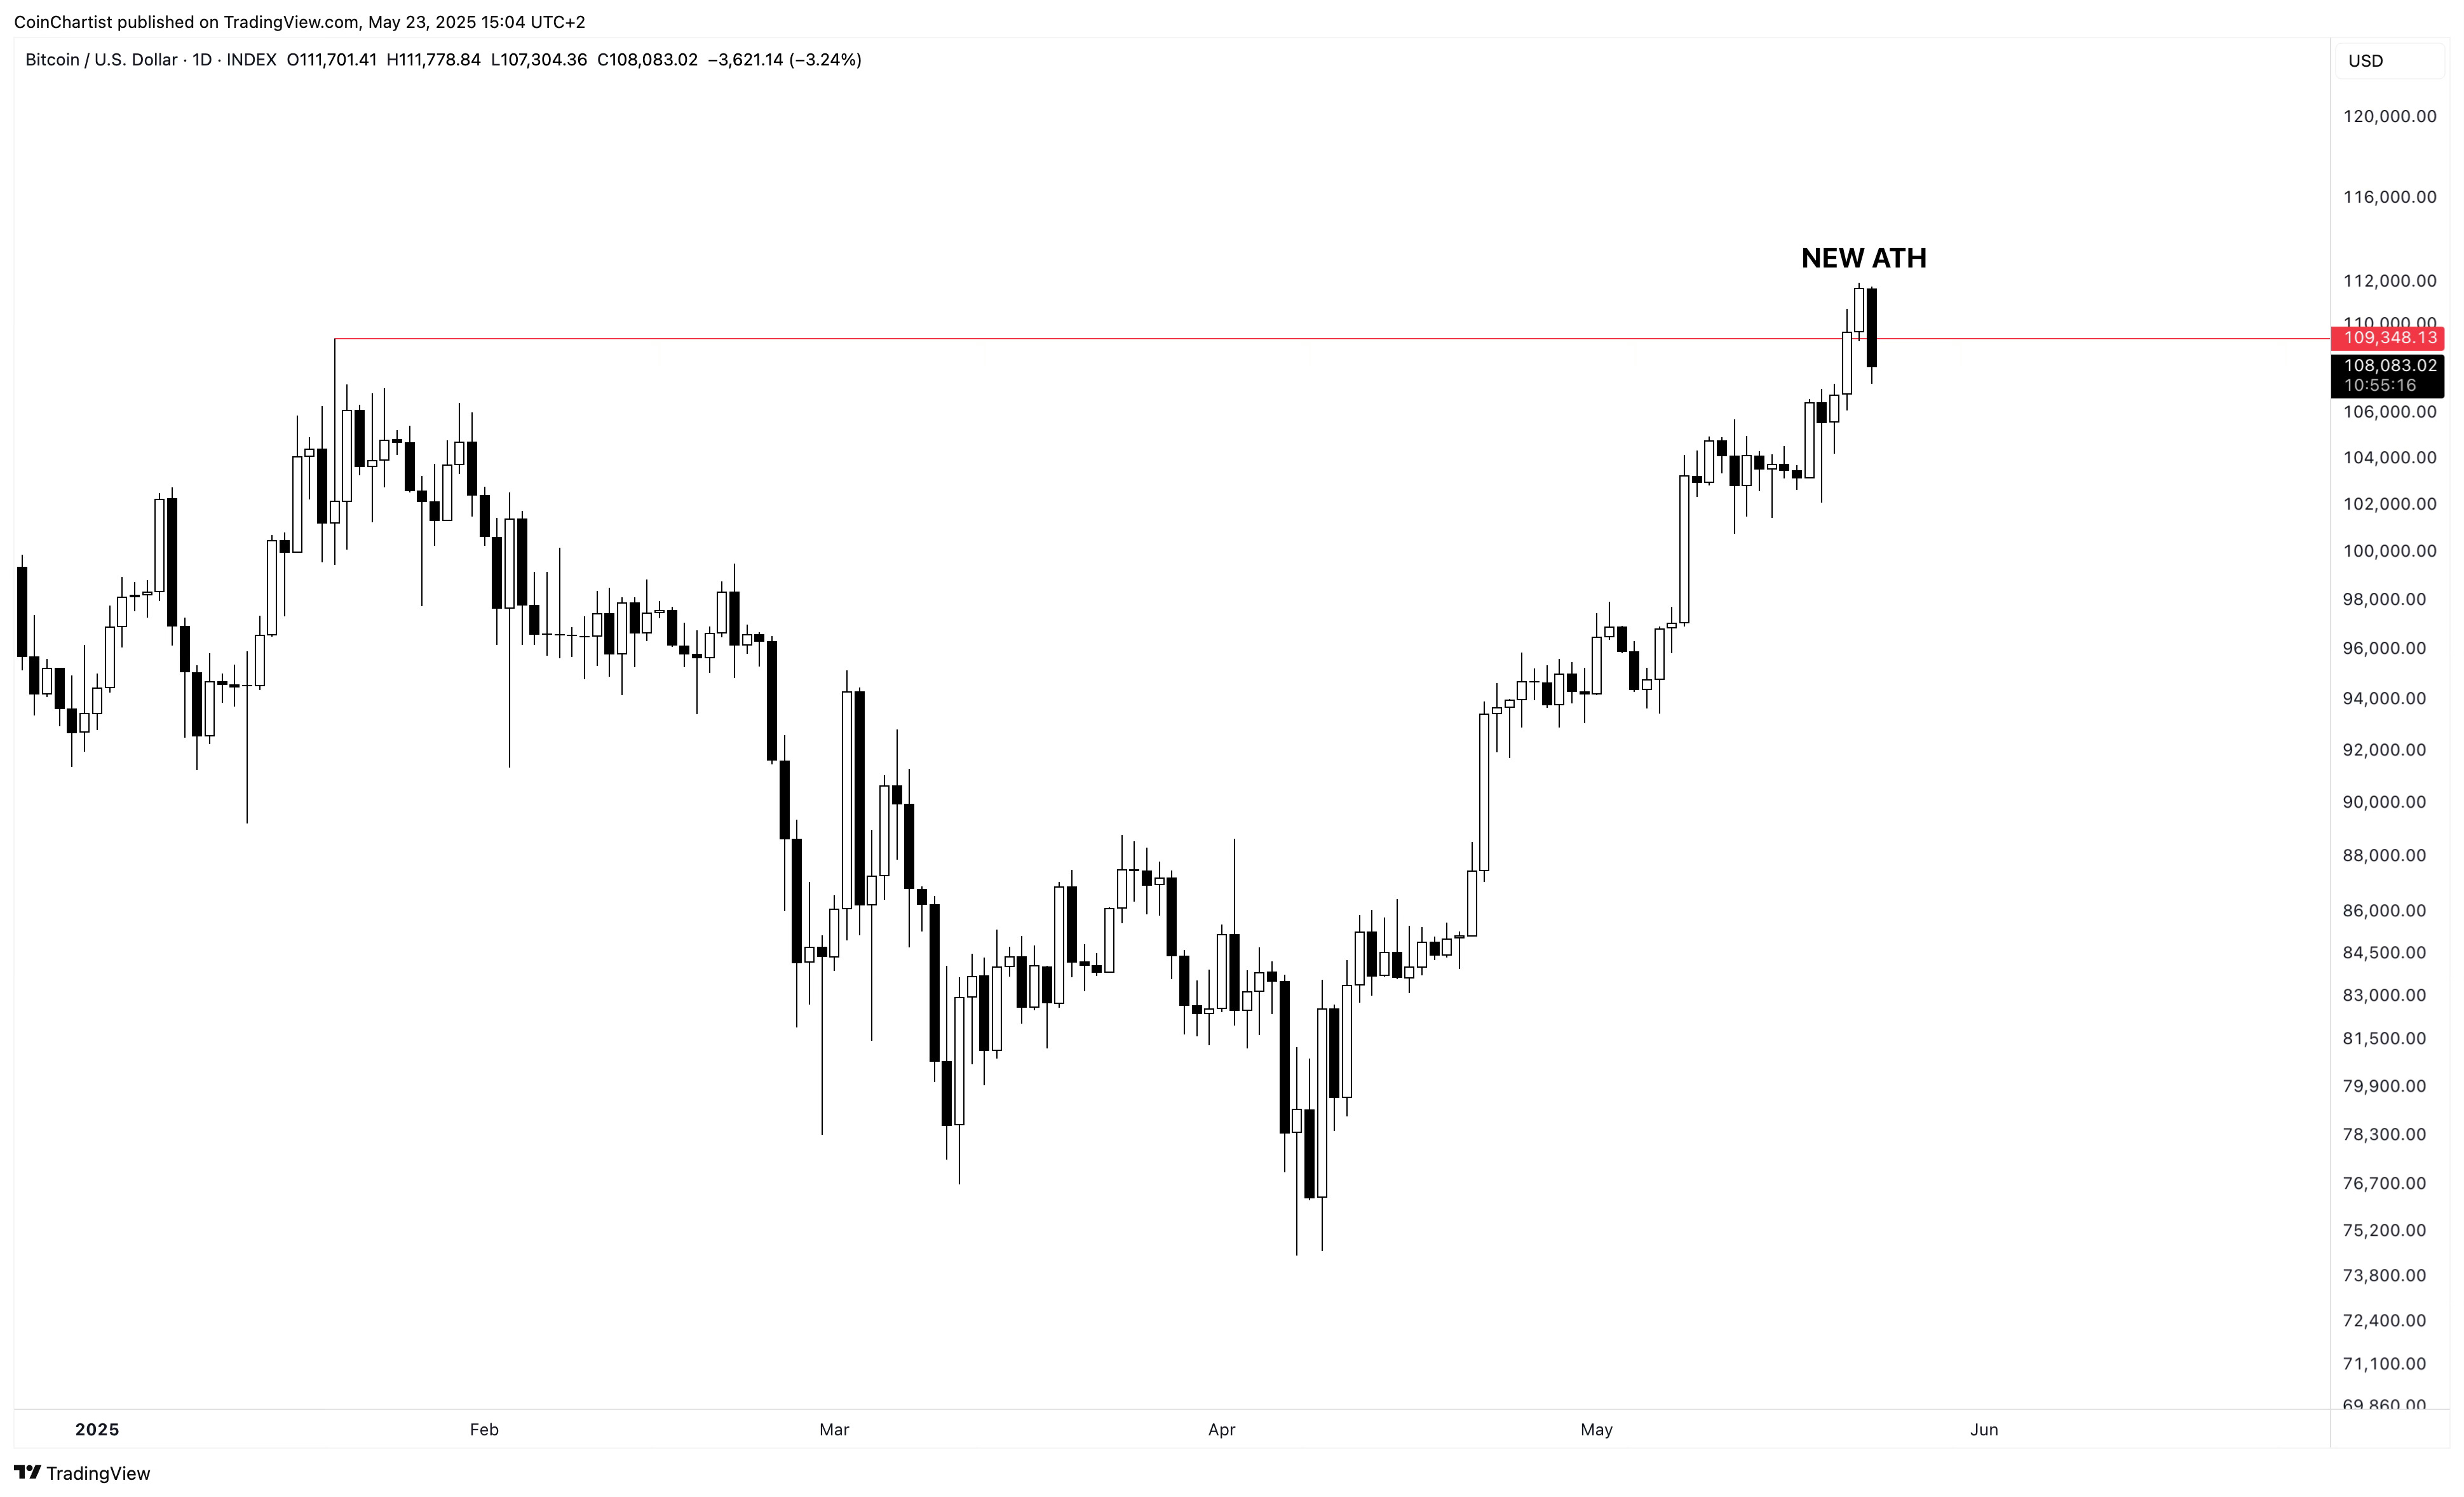
A new all-time high and higher high is a significant development. It does invalidate bearish wave counts. But to be really sure Bitcoin is ready to trend higher, we need to see several things happen.
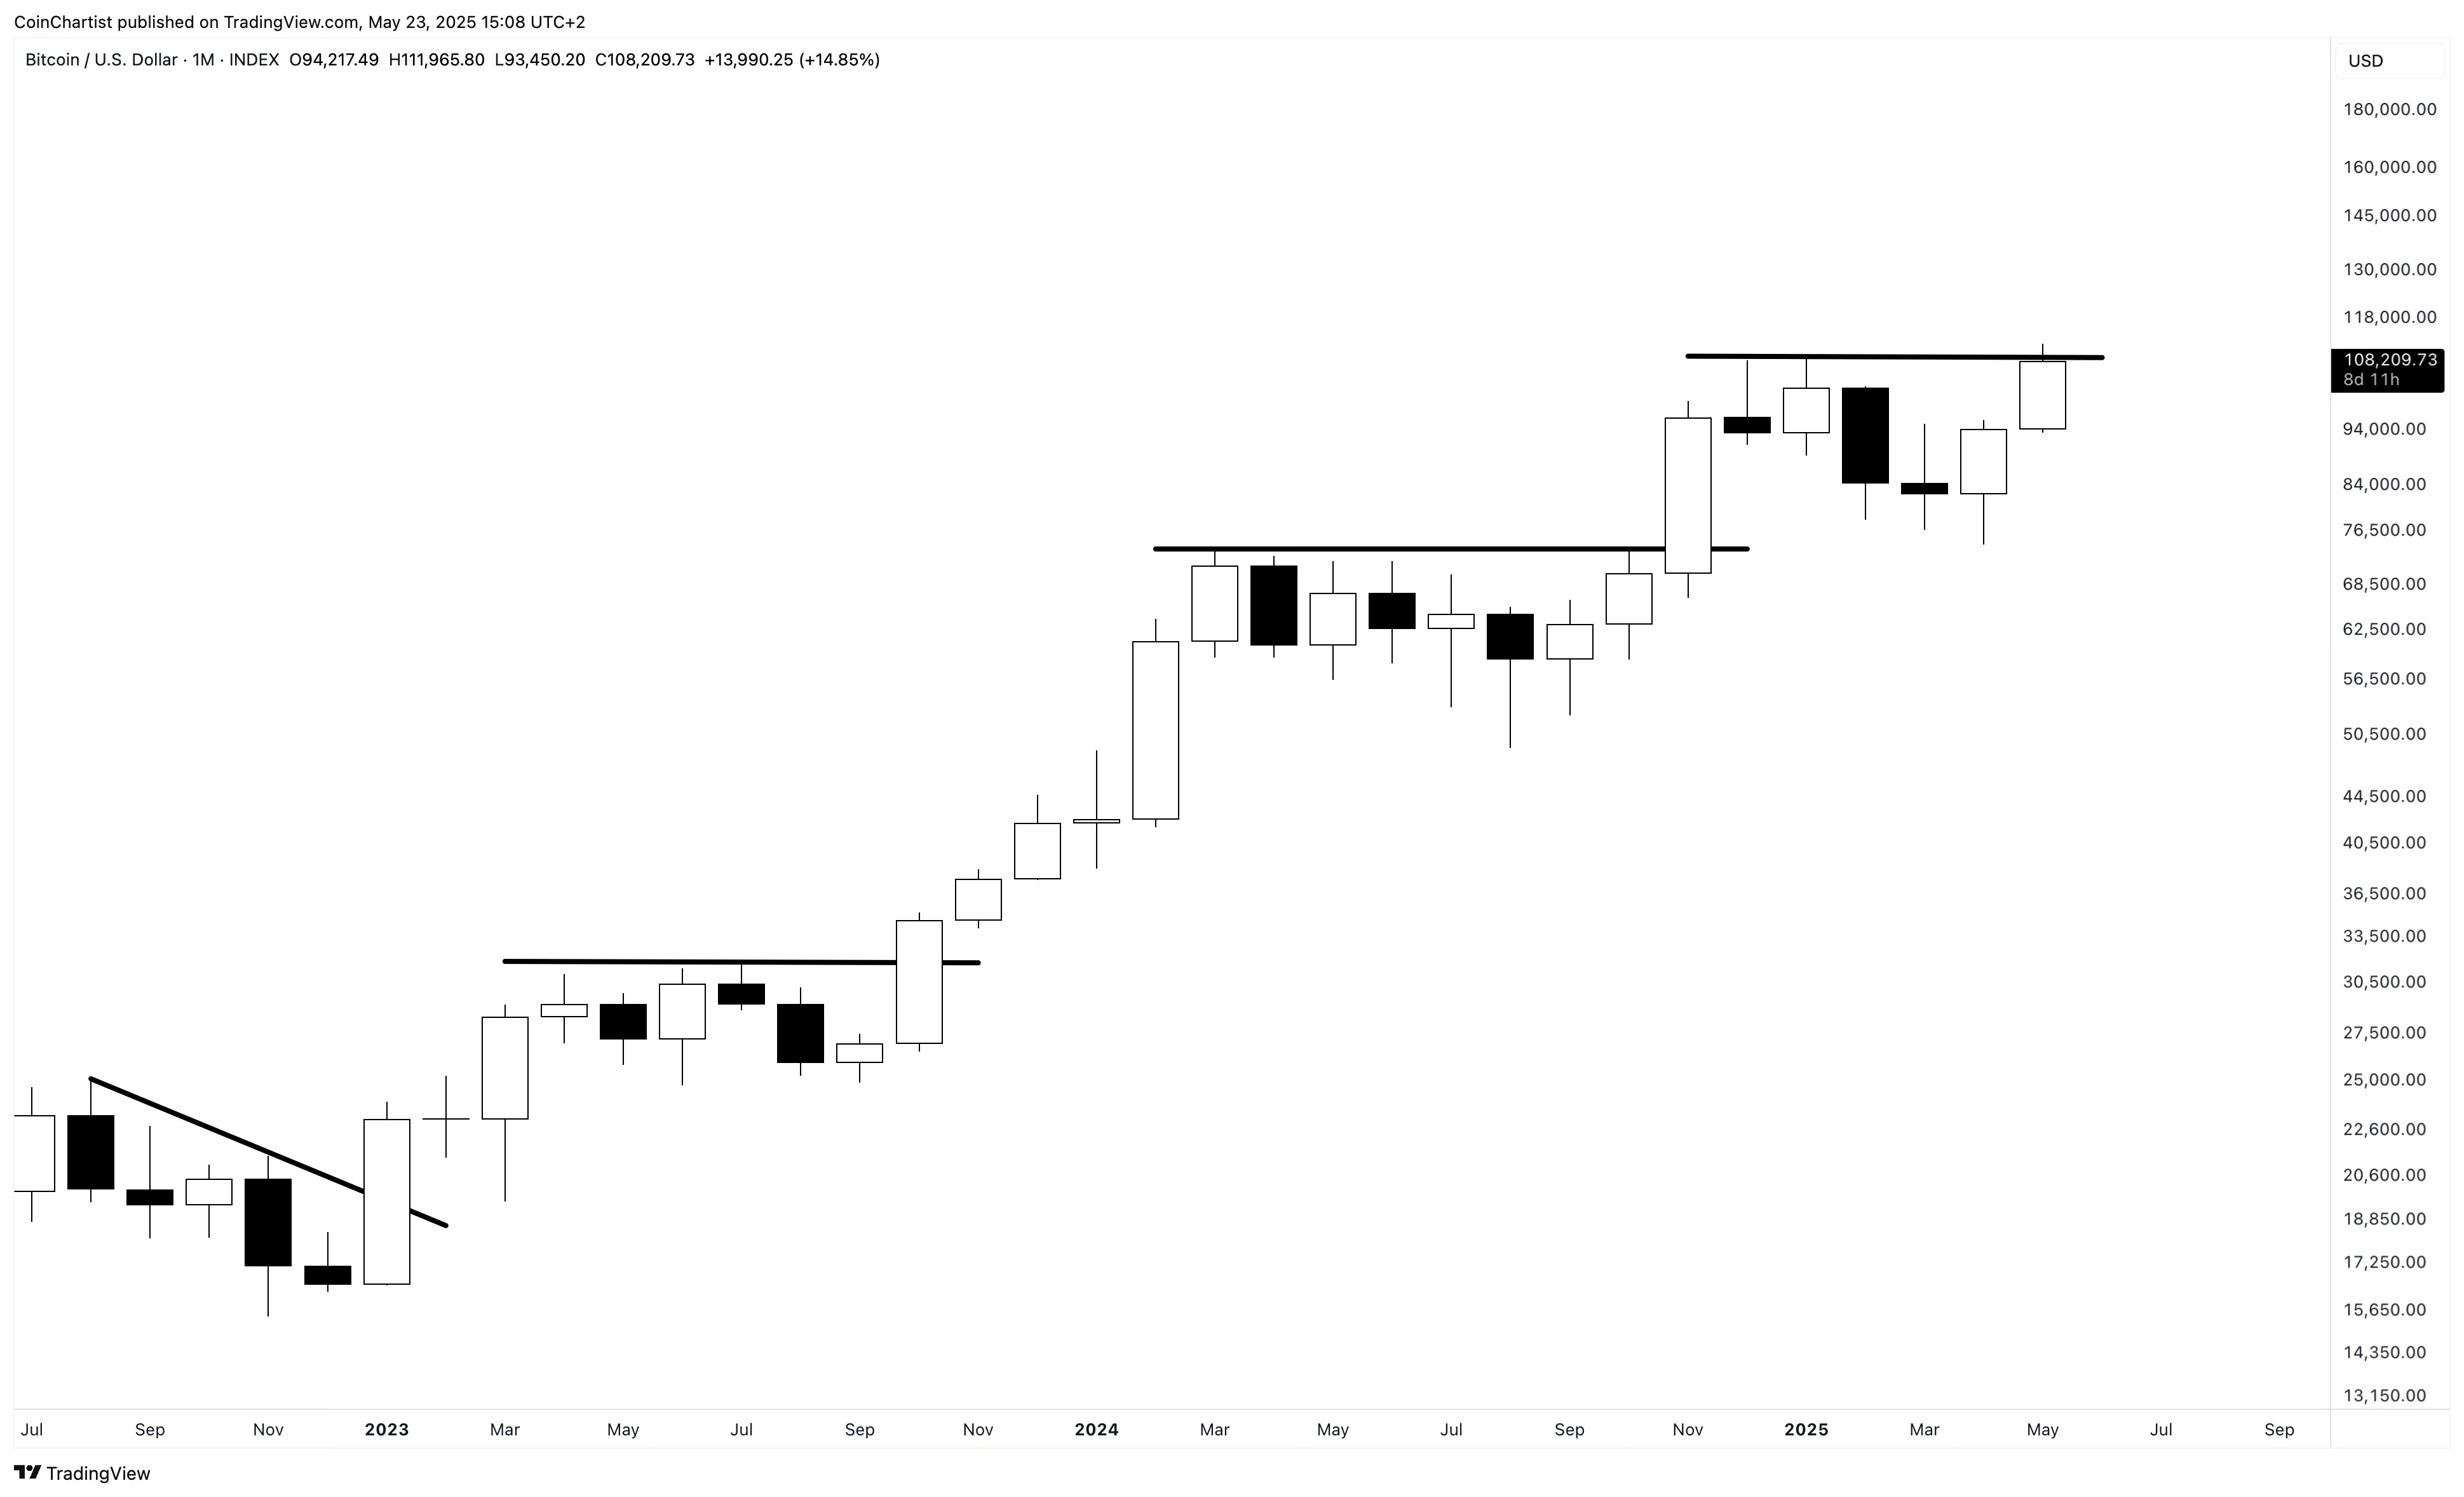
While not imperative, ideally Bitcoin will close its May monthly candlestick above the former all-time high. Each higher high and range breakout led to a massive white candle by the time the monthly closed. May’s candlestick should look like other monthly candles where a range was broken.
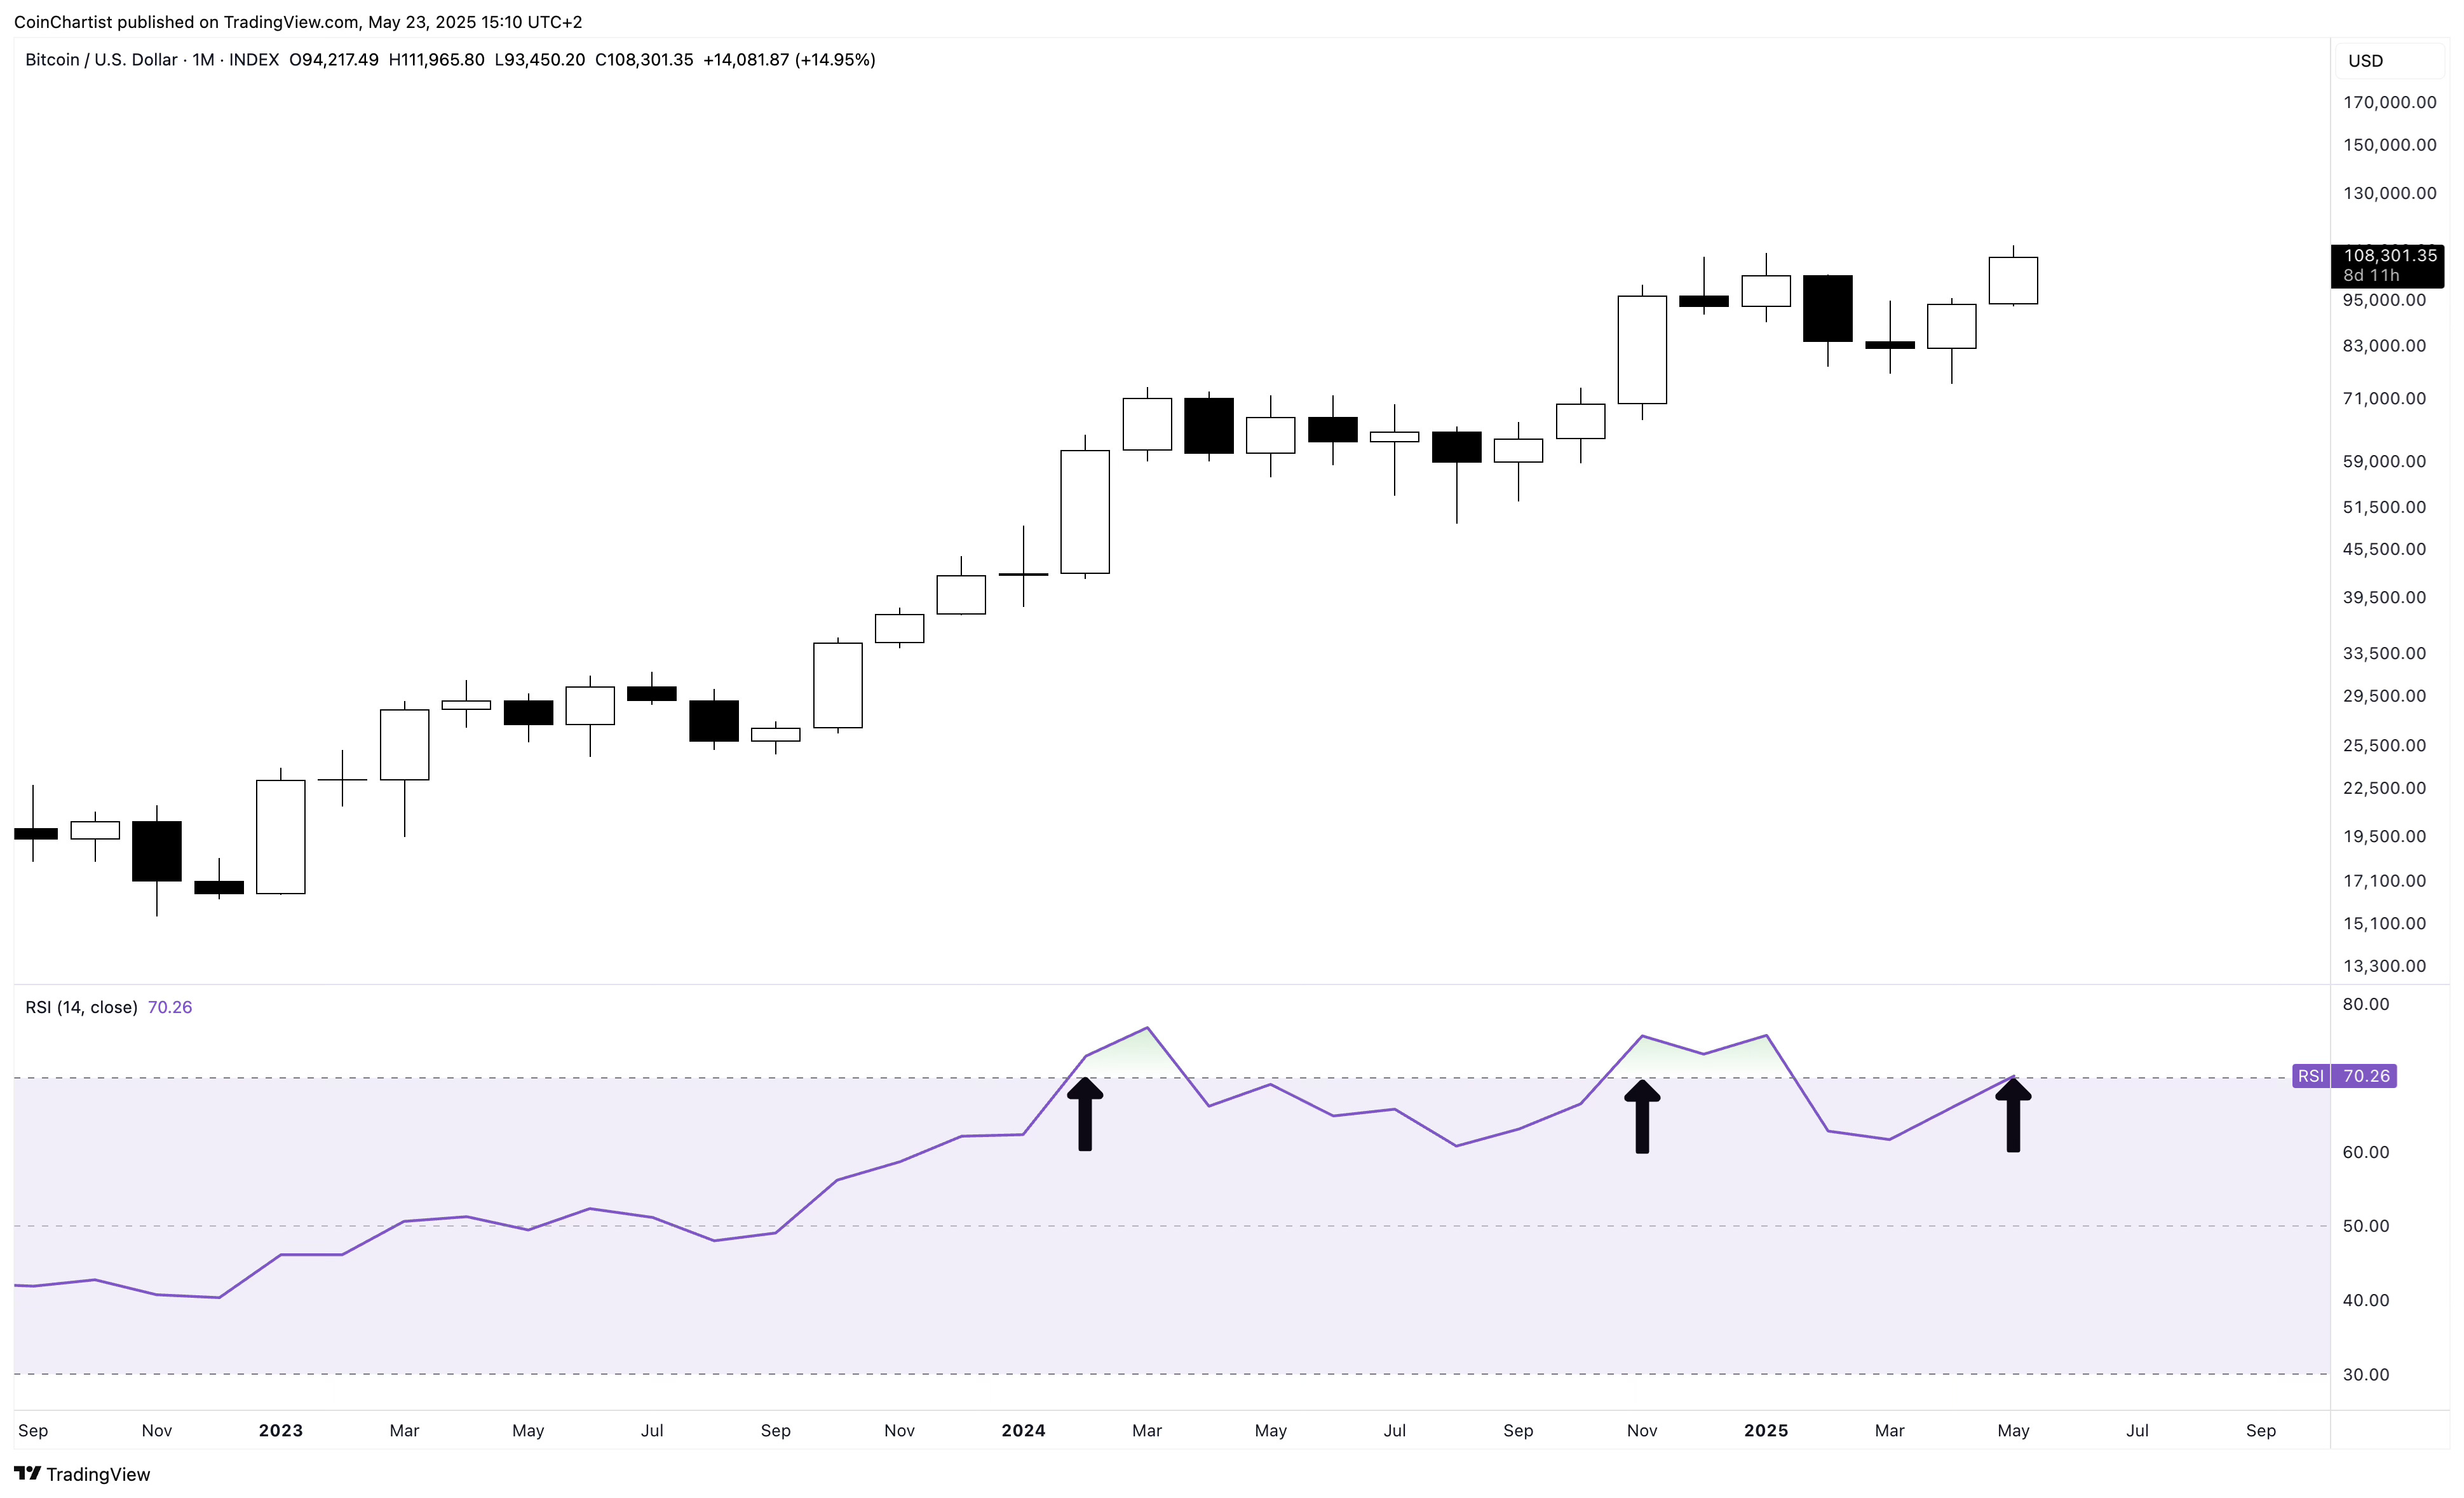
Bitcoin will need to remain at current levels or move higher by the time May ends to ensure the RSI confirms above 70. Readings of 70 or higher are overbought conditions, but these are the strongest phases of each Bitcoin bull run. Failure to confirm could suggest more consolidation is coming before Bitcoin goes parabolic. If we get the confirmation, a rally for the history books should be next.
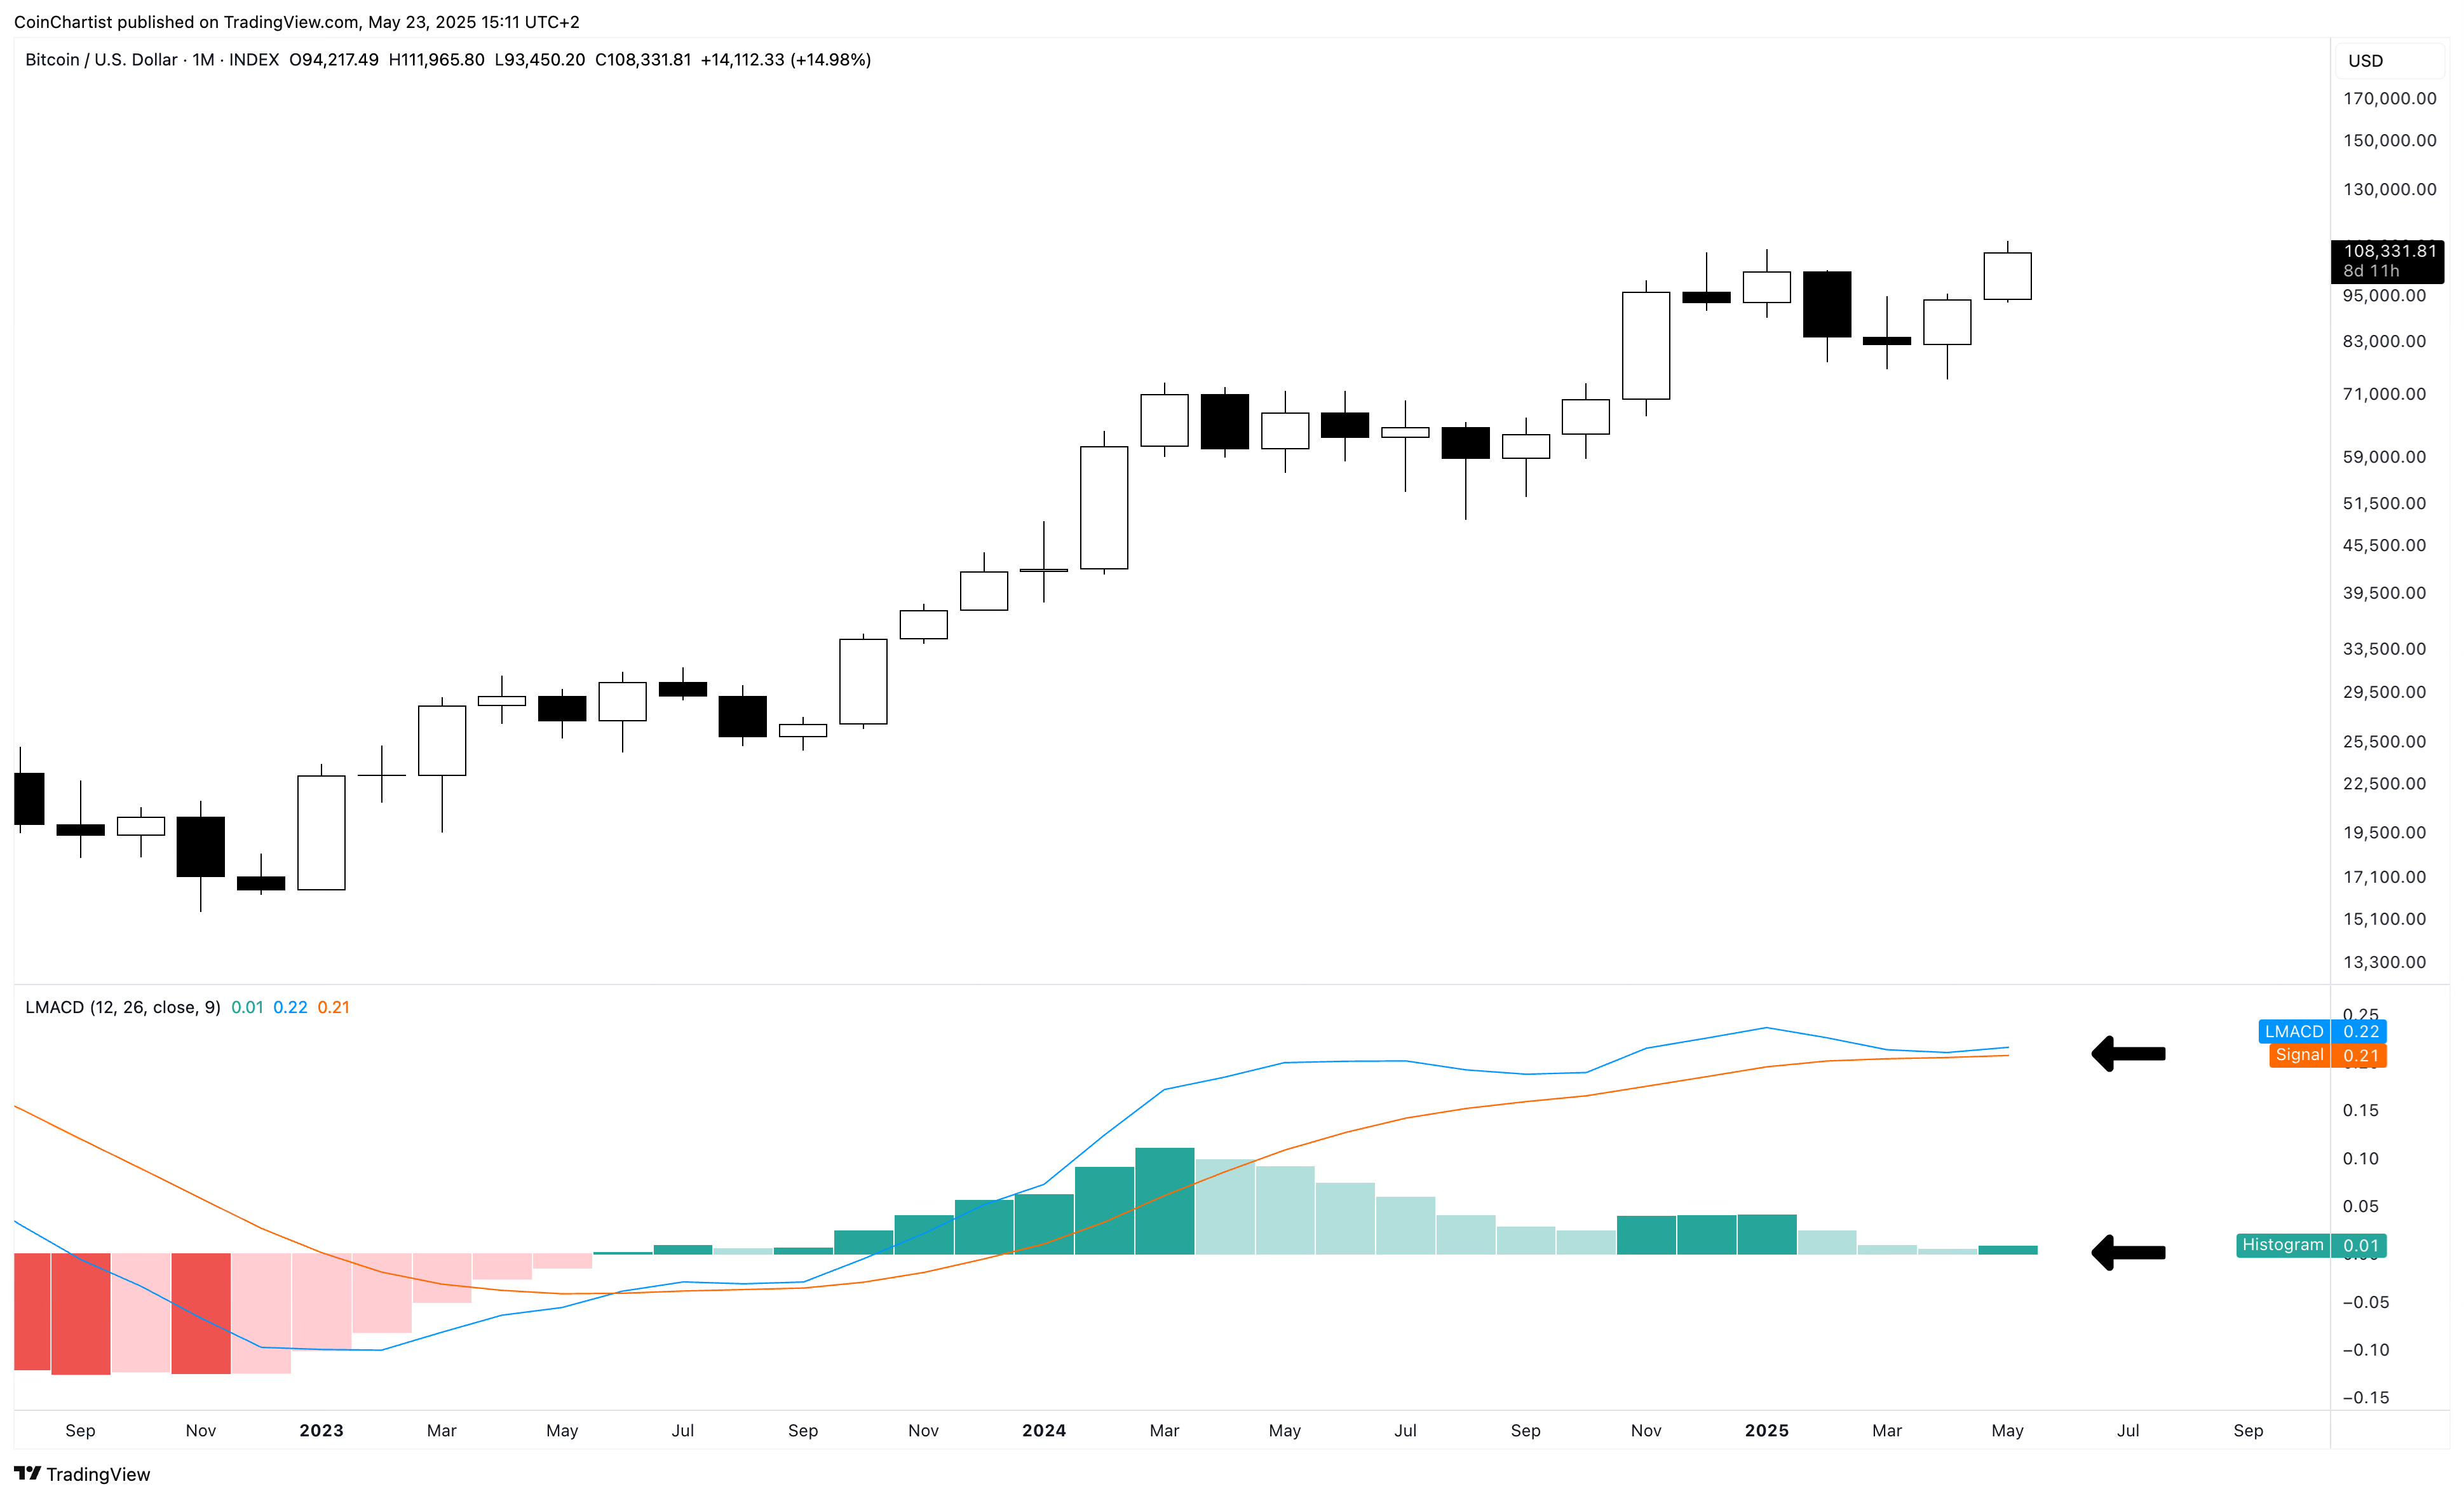
Closing May at this level cements this dark green tick on the LMACD histogram. This would suggest strengthening bullish momentum. I do want to continue to warn that a $5,000 drop in Bitcoin would turn this tick to light green, and a $10,000 drop would turn it red. Bitcoin just climbed $37,000 in a handful of weeks. A retracement of that magnitude isn’t out of the realm of possibility.
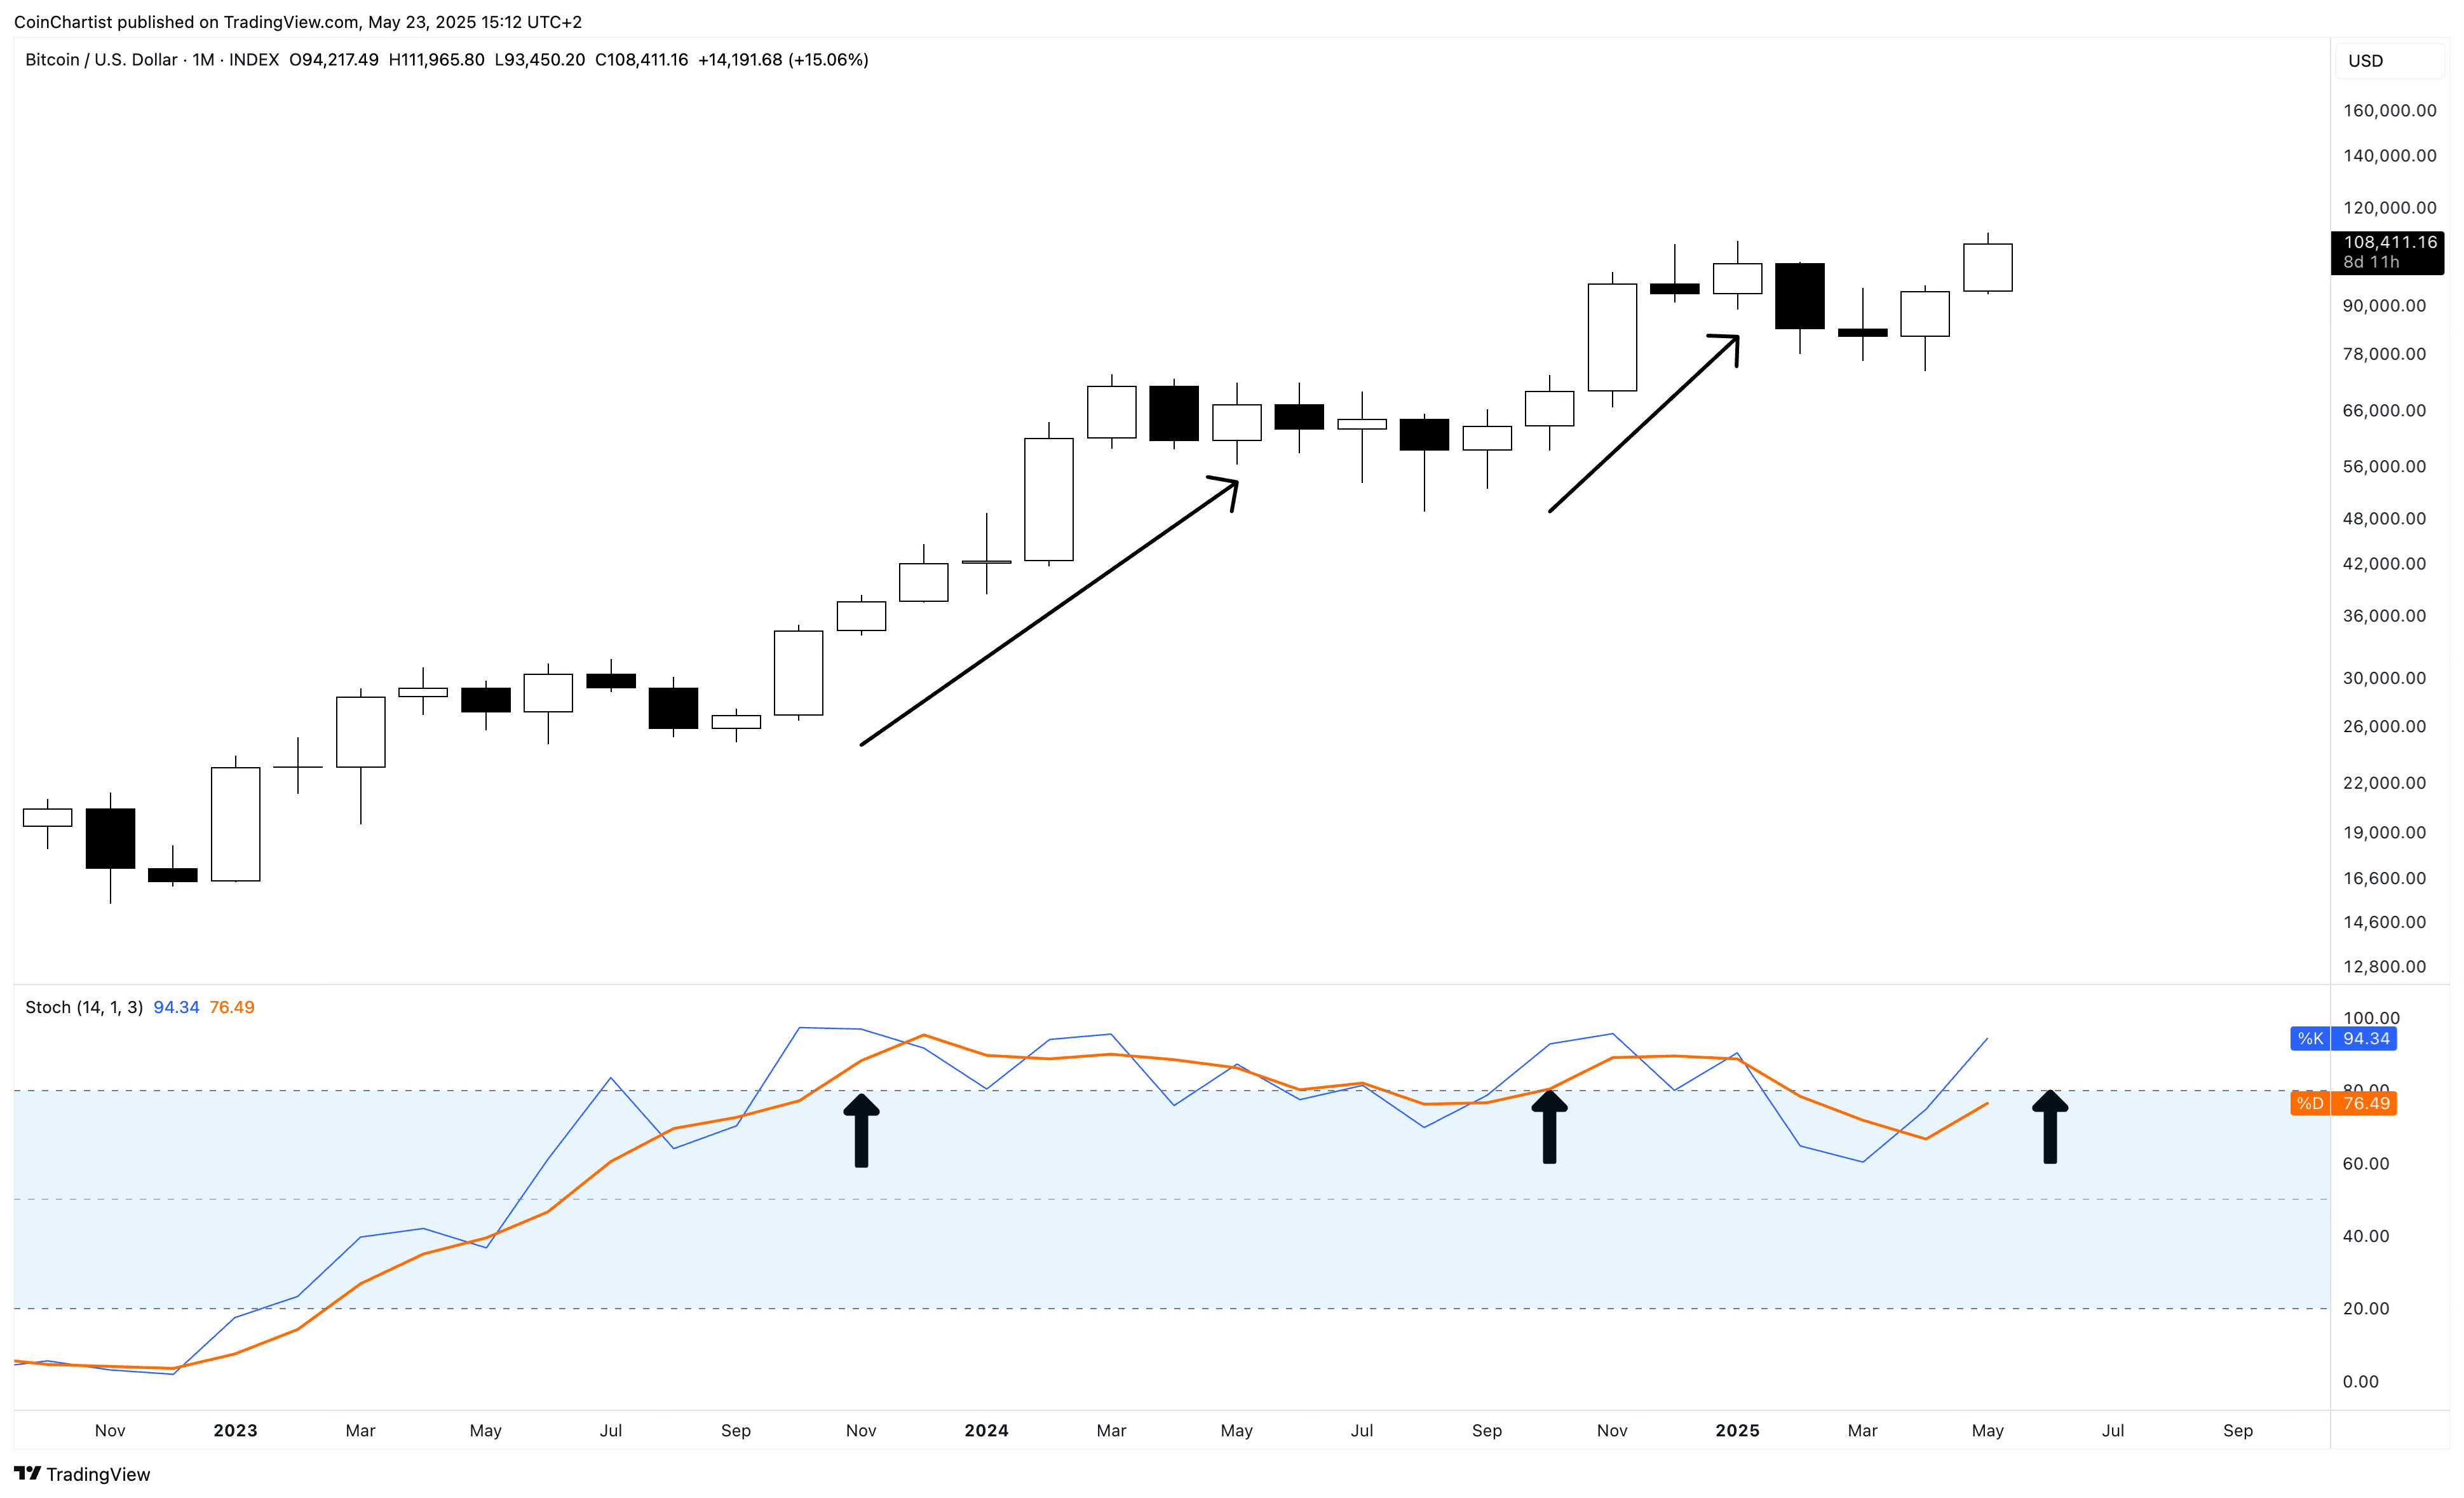
A strong May close should push the slow Stochastic (orange) above 80 where Bitcoin shows the most price appreciation. Dropping below 80 was a bearish signal, but recovering it will be very bullish. A correction here means more time will be needed to reach above 80, if it happens.
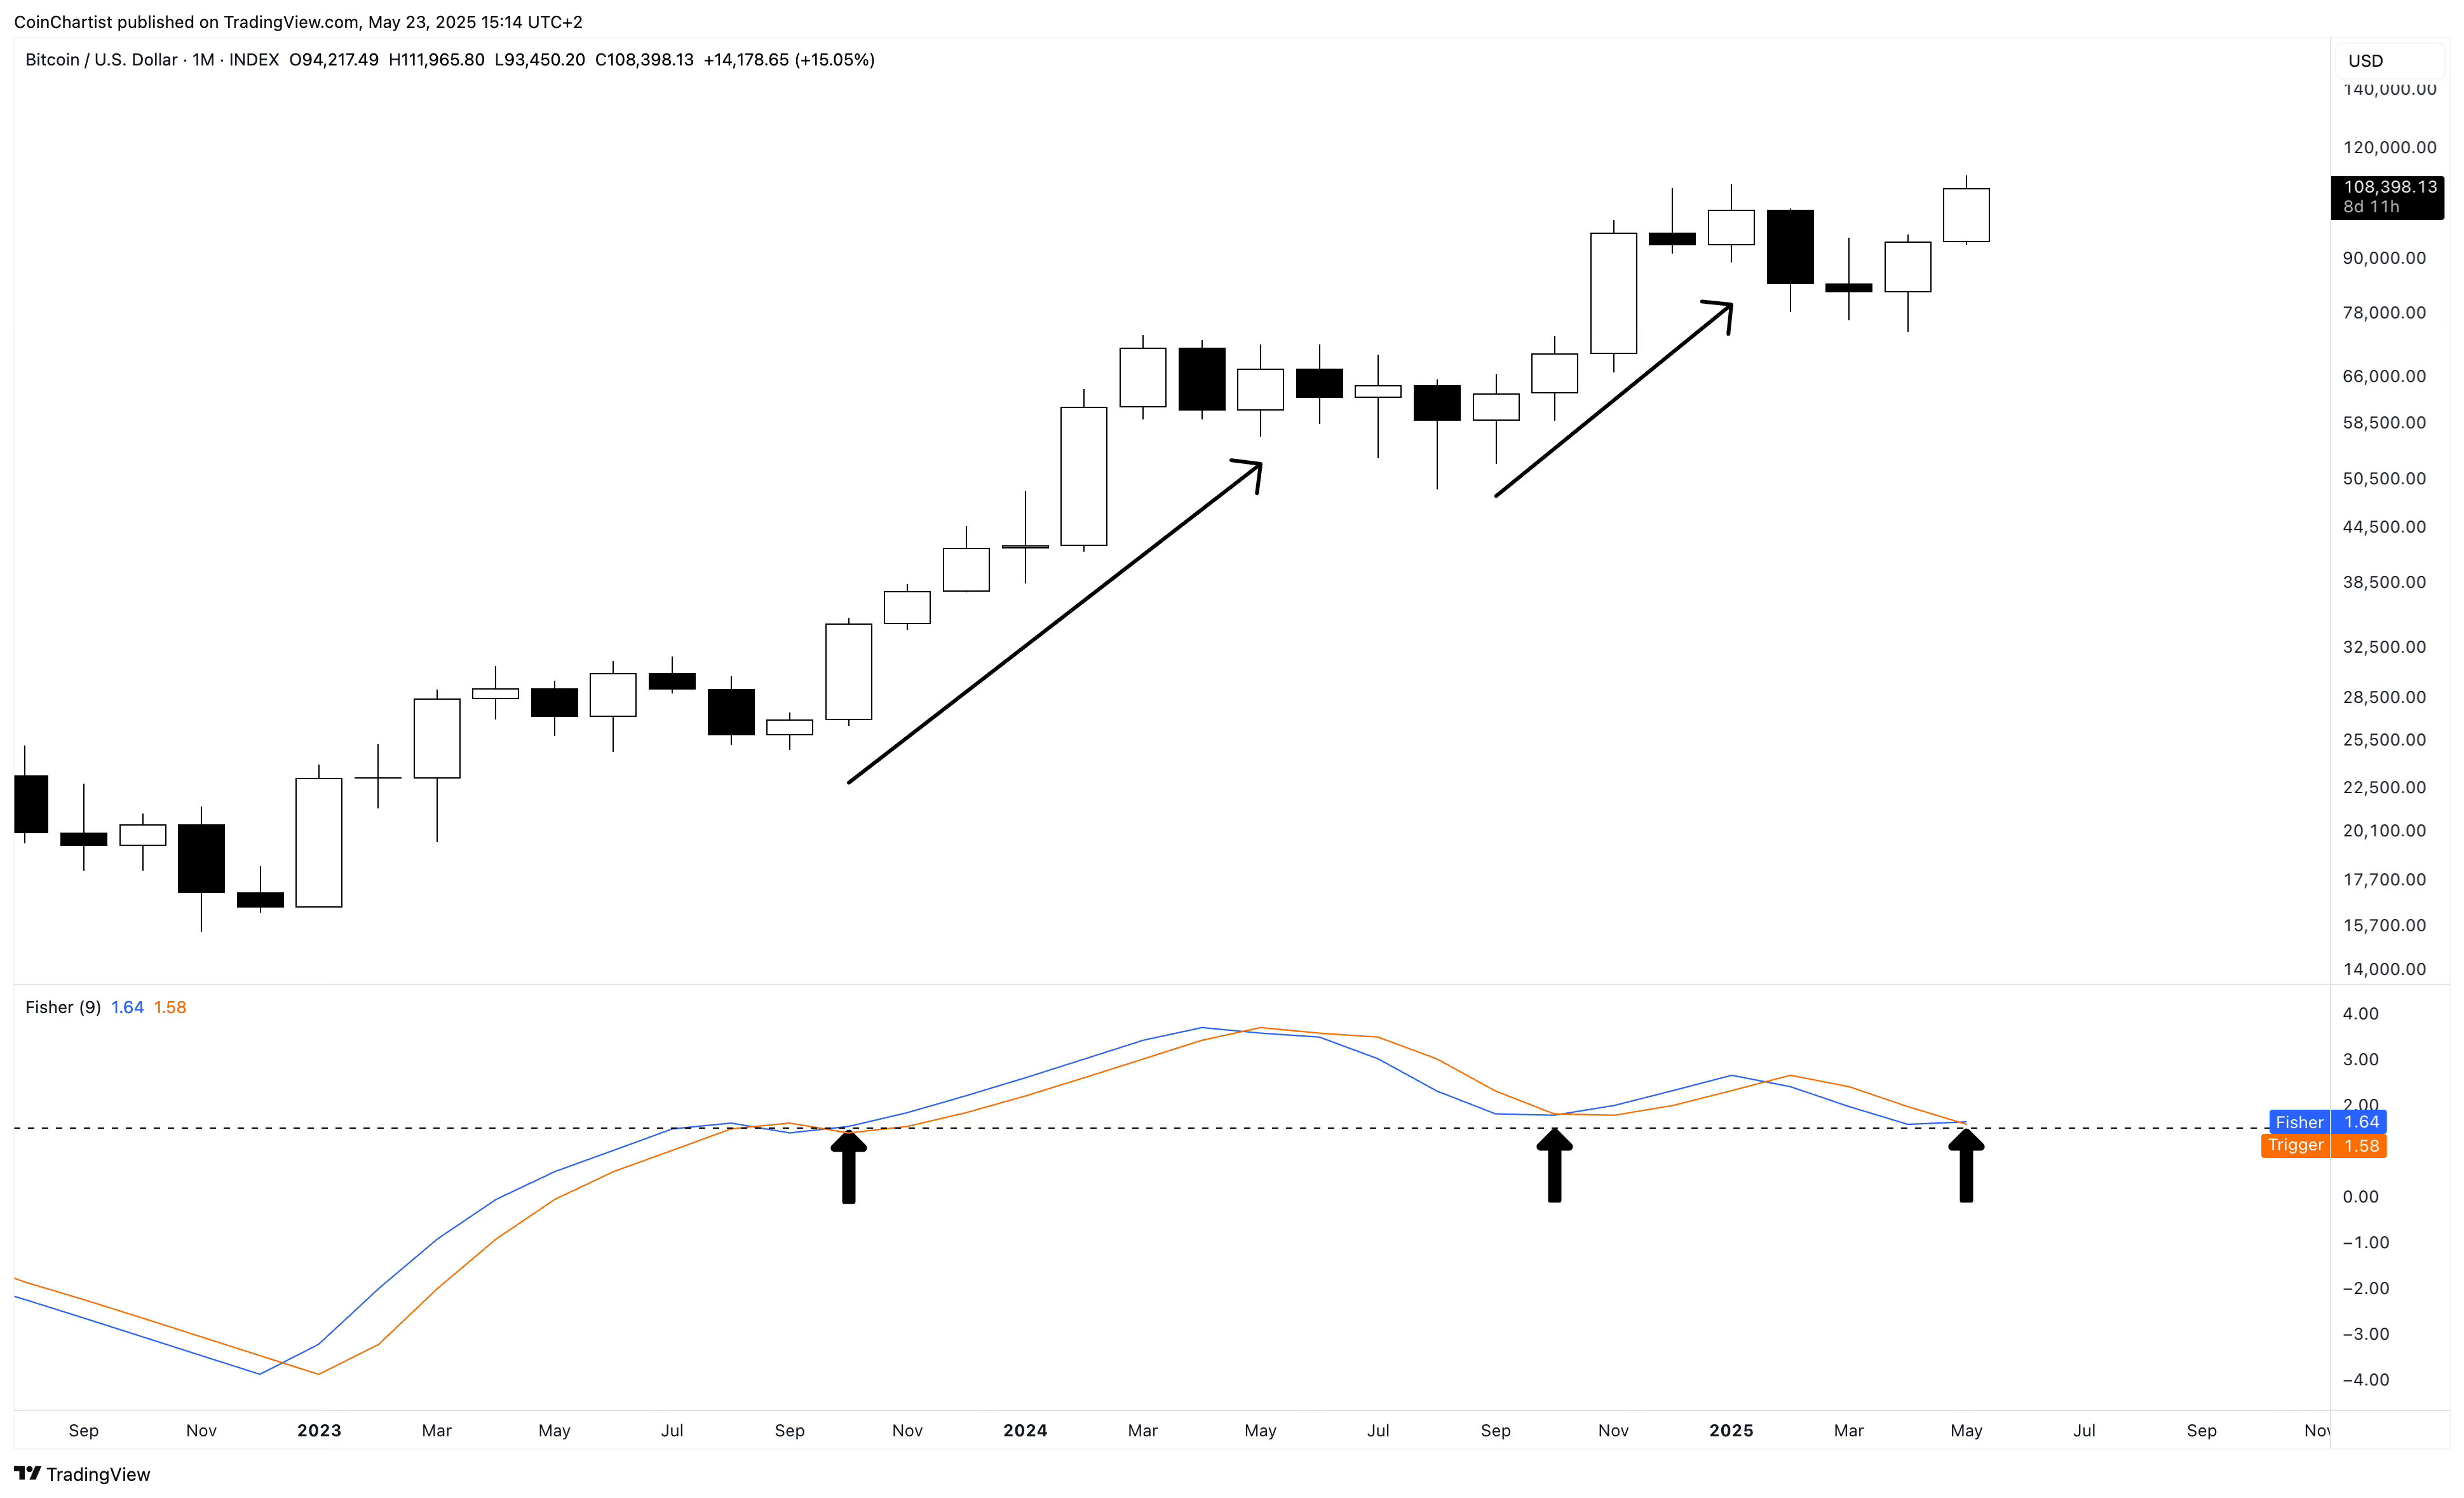
Bitcoin’s monthly Fisher Transform is turning back up above the +1.5 standard deviation. Once again, the biggest rallies happen above this level, much like the other indicators are showing. Below the line tends to lead to bear markets.
Breakout or Fakeout?
There is no denying Bitcoin made a new ATH and that alone invalidated some bearish scenarios. But I am still concerned by the lack of a clear breakout supported by technical confirmation. The confirmation and breakout could come this weekend, or at any point next week or in the weeks ahead. But it isn’t here yet.
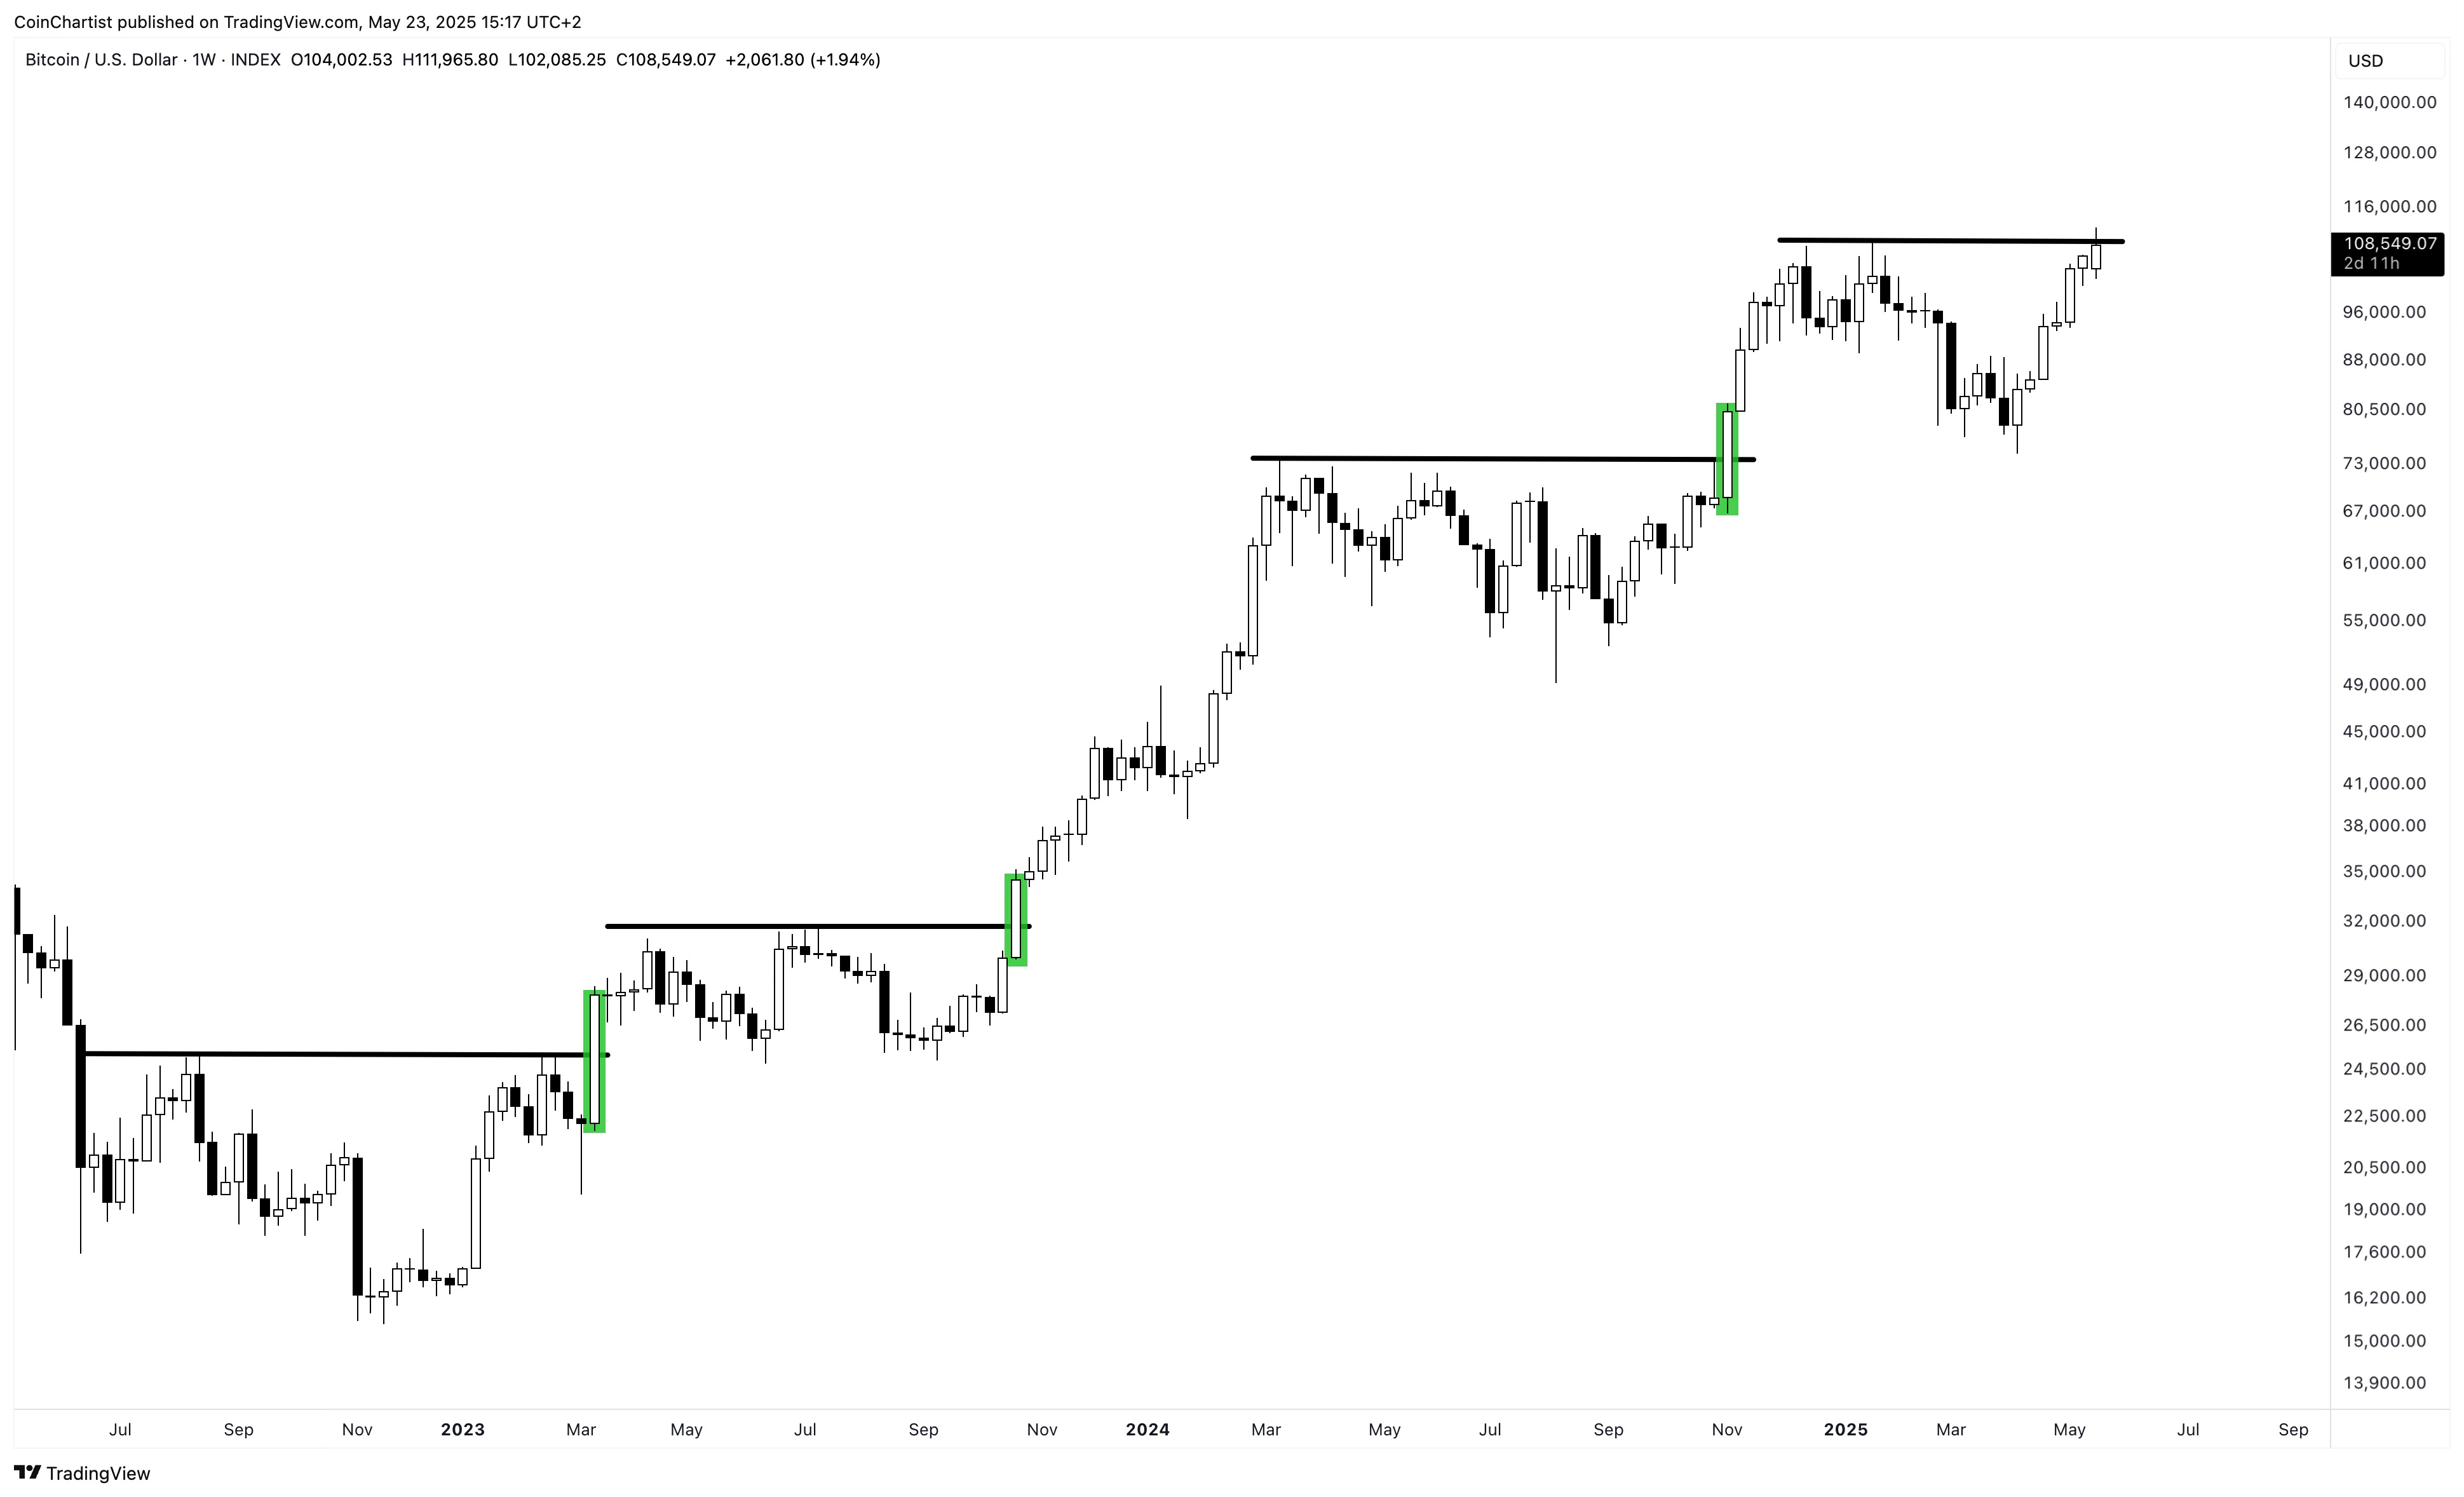
Looking at Japanese candlesticks alone, we can see that when ranges are broken, there is a large, white weekly candle and then the range is left behind. There is a distinct lack of this type of breakout candle on the weekly.
Keep reading with a 7-day free trial
Subscribe to CoinChartist to keep reading this post and get 7 days of free access to the full post archives.