


Good, Bad, & Ugly
A spotlight on the best and worst chart in the crypto market, plus an update on Bitcoin.

Disclaimer: The information provided in this Substack newsletter is for general informational purposes only and should not be considered as financial advice. Investing involves risk, and past performance is not indicative of future results. Please conduct your own research or consult a financial advisor before making any investment decisions. The newsletter disclaims any liability for losses or damages arising from the use of this information.
Good, Bad, & Ugly overview:
An entire issue dedicated to comparing technicals on Litecoin, Bitcoin, and Ethereum
Litecoin currently has one of the best looking charts in crypto
Ethereum, meanwhile, has one of the worst charts
Bitcoin is somewhere in between, experiencing some waning momentum
Learn how to compare and contrast indicators across three cryptocurrencies
Updated wave counts with zoomed-out and zoomed-in perspectives, plus a bearish alternative count for each crypto asset
Plus, what the Dollar has to do with it all
As a Chartered Market Technician, I learned from the very best in the technical analysis industry. To this point, I like to spread knowledge and include an educational flair to almost everything I do. This issue was always going to feature Litecoin and Ethereum in some capacity due to the urgency I see in their charts. I also haven’t released a single issue without Bitcoin. During the production of this issue, I came up with the idea to use exactly the same technical indicators on each coin, so that I could teach the differences between a bullish or bearish chart. You’ll also be able to visualize subtle differences that show a weakening versus a strengthening chart.
The Good: Litecoin
Litecoin is among the most hated coins in the entire cryptocurrency space. It’s been widely given up on and has next to zero hype behind it. It is one of a handful of top cryptocurrencies to have failed to set a significant new all-time high in 2021. What it does have, is a limited supply like Bitcoin’s, a long history of uptime as a network, and better regulatory support compared to other cryptocurrencies. It also has the highest odds out of any altcoin to be approved for an ETF. Litecoin already has strong fundamentals, and now that technicals are showing some strength, it is the cryptocurrency I am most excited about at the moment. I haven’t been this focused on a specific coin since XRP.
The Bad: Bitcoin
Bitcoin is looking bad compared to the past and compared to Litecoin because it has already appreciated so much over the last three years. Unlike Litecoin which is still trading at roughly 25-30% of its former all-time high, Bitcoin is $30,000 higher than its former all-time high. Although I do not think Bitcoin has topped for the cycle and could have more to go, technicals are showing early warning signs of weakening strength and momentum, which could lead to an unexpected and early peak. There’s even some probability that the top might already be in. And if it isn’t, it likely will be after the next short-term rally to new all-time highs where my targets remain $160,000 to $190,000 per BTC.
The Ugly: Ethereum
Ethereum has one of the worst charts in the entire space currently and is facing a do or die situation. Almost all of Ethereum’s charts suggest it is entering a bear market. What is throwing me off, is the fact that sentiment is so bad in Ethereum, and short positions are the highest ever on record. When the crowd is so on one side of the trade, something contrarian happens instead. Could the extremely negative sentiment and dangerous technicals end up putting in a bottom here, or is Ethereum going to plunge to its doom? It could come down to the February monthly candlestick close.
The Bollinger Bands
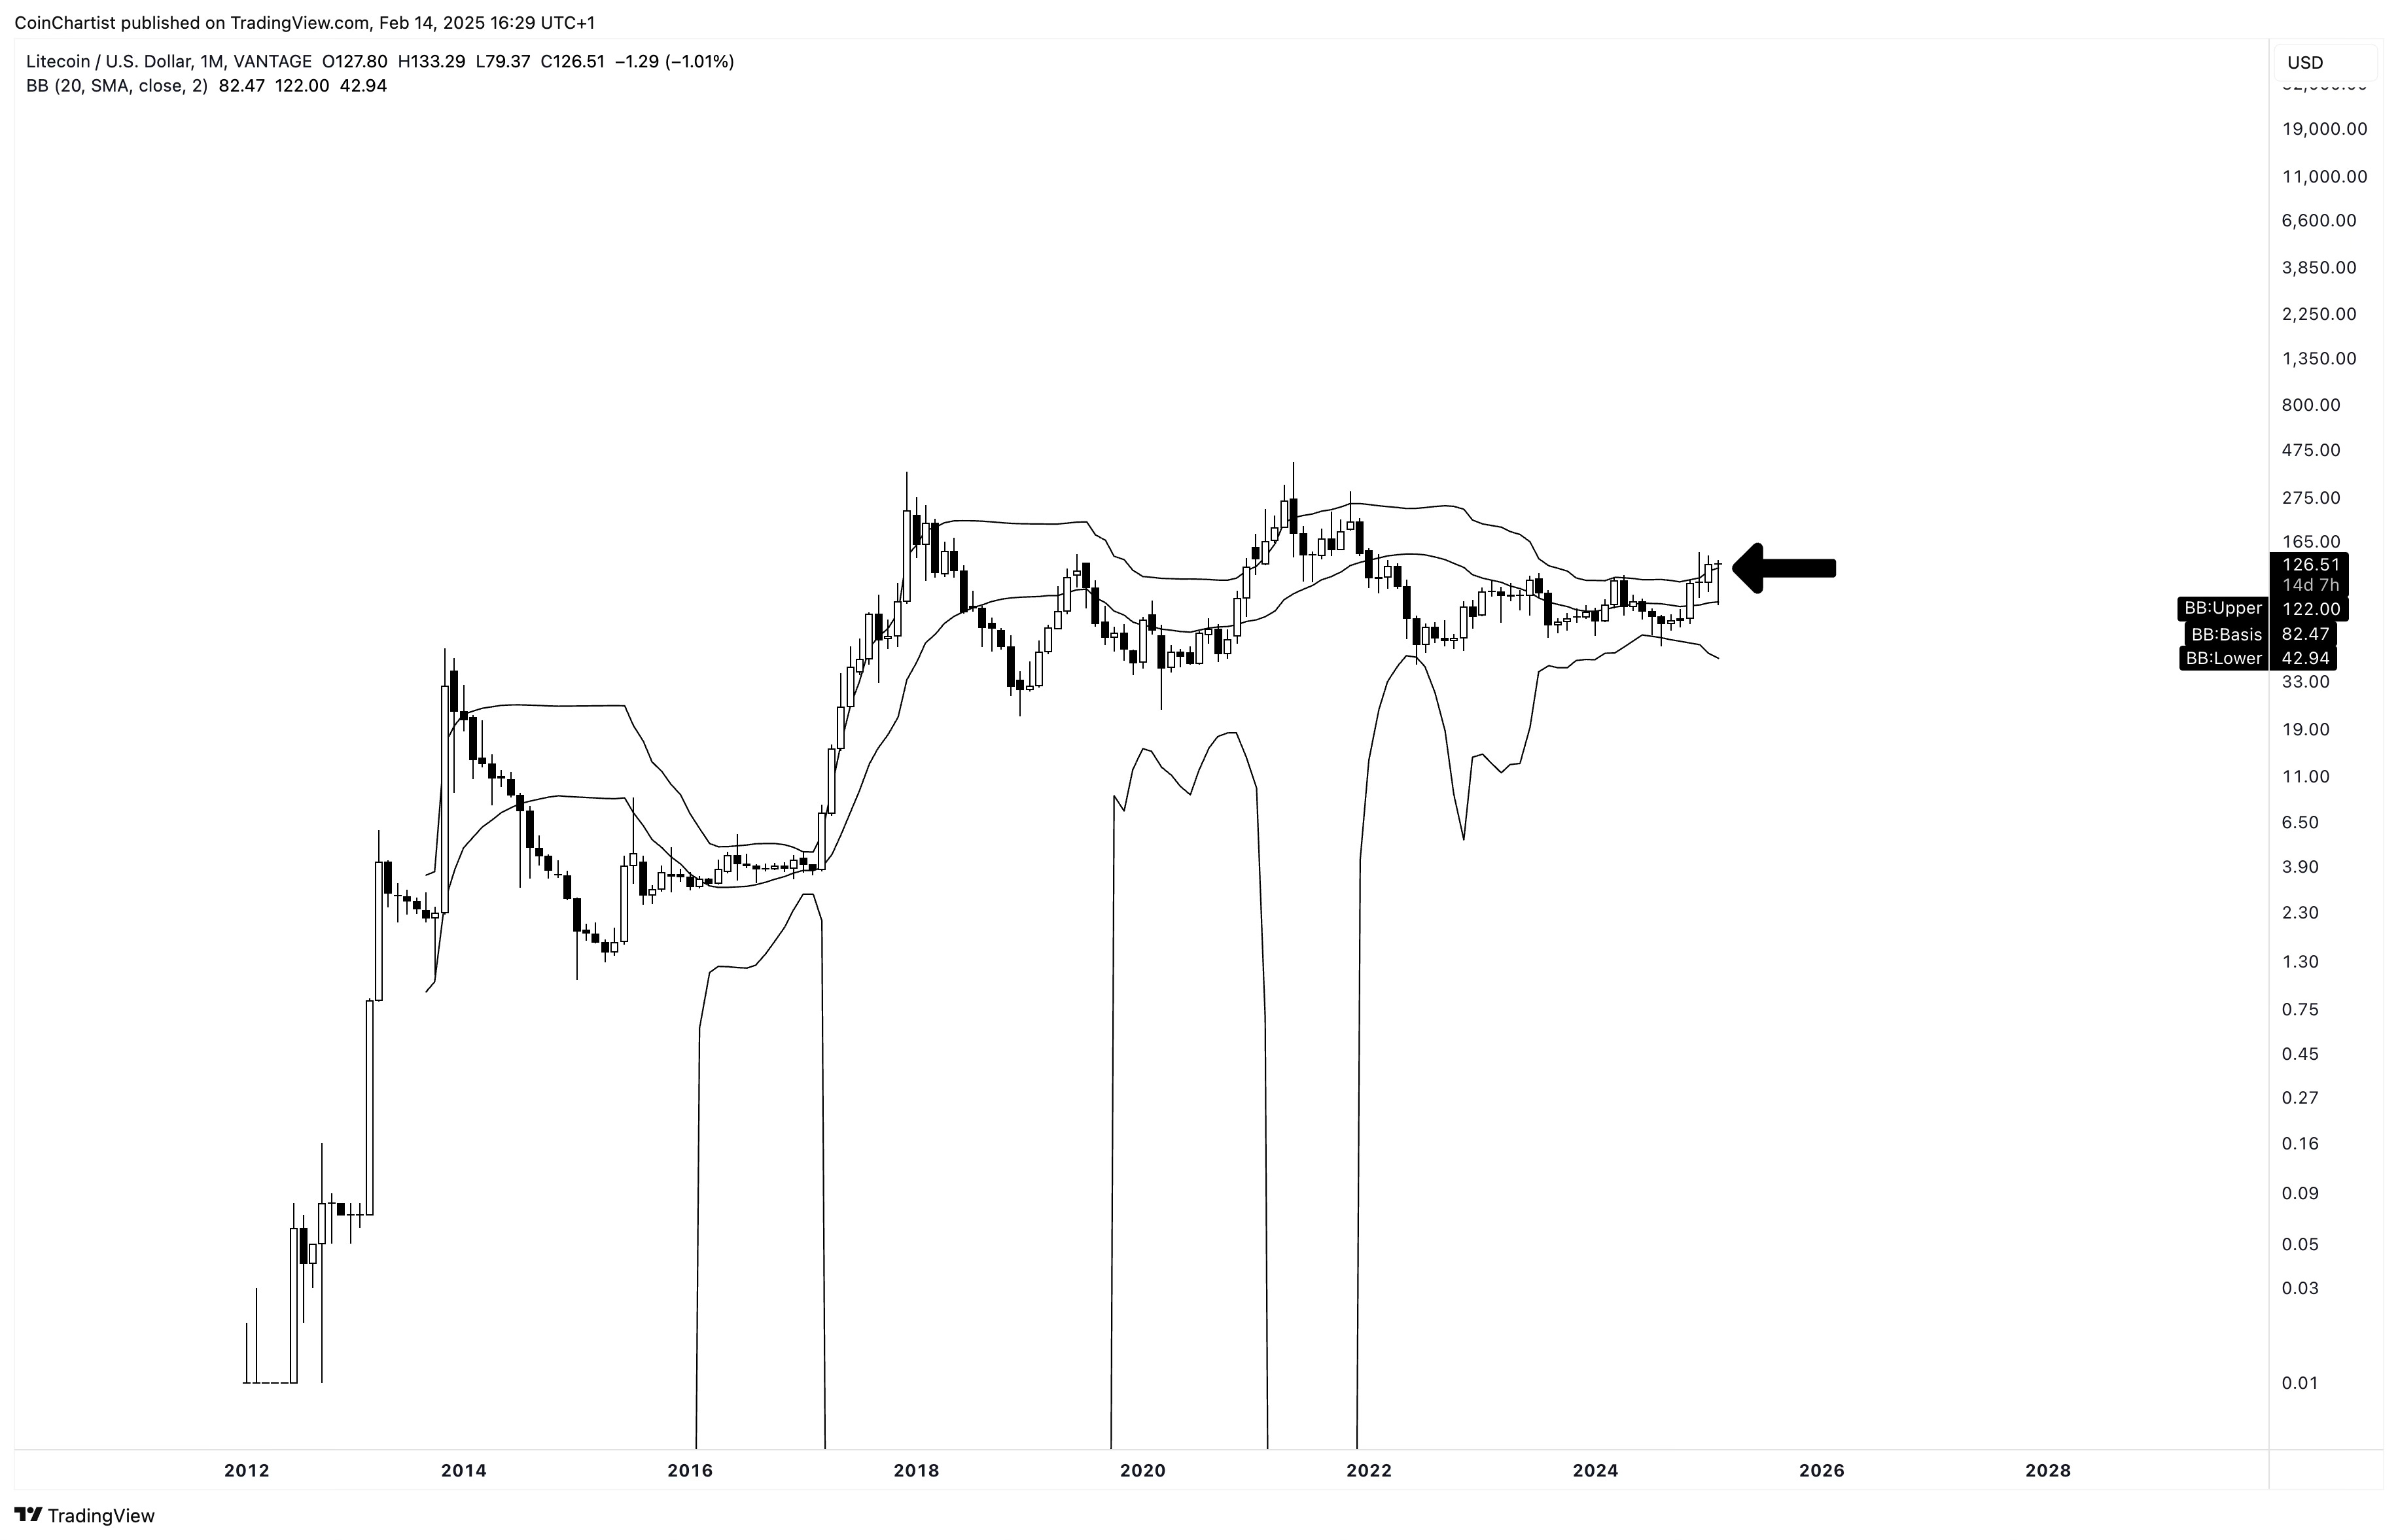
Litecoin’s monthly Bollinger Band setup is by far the best out of the three coins chosen for this issue, with the February monthly candlestick currently holding above the upper Bollinger Band. If Litecoin can close the monthly above the upper Band, there’s a chance LTC walks the bands higher and higher. The Bollinger Bands are also starting to expand after a year-long squeeze.
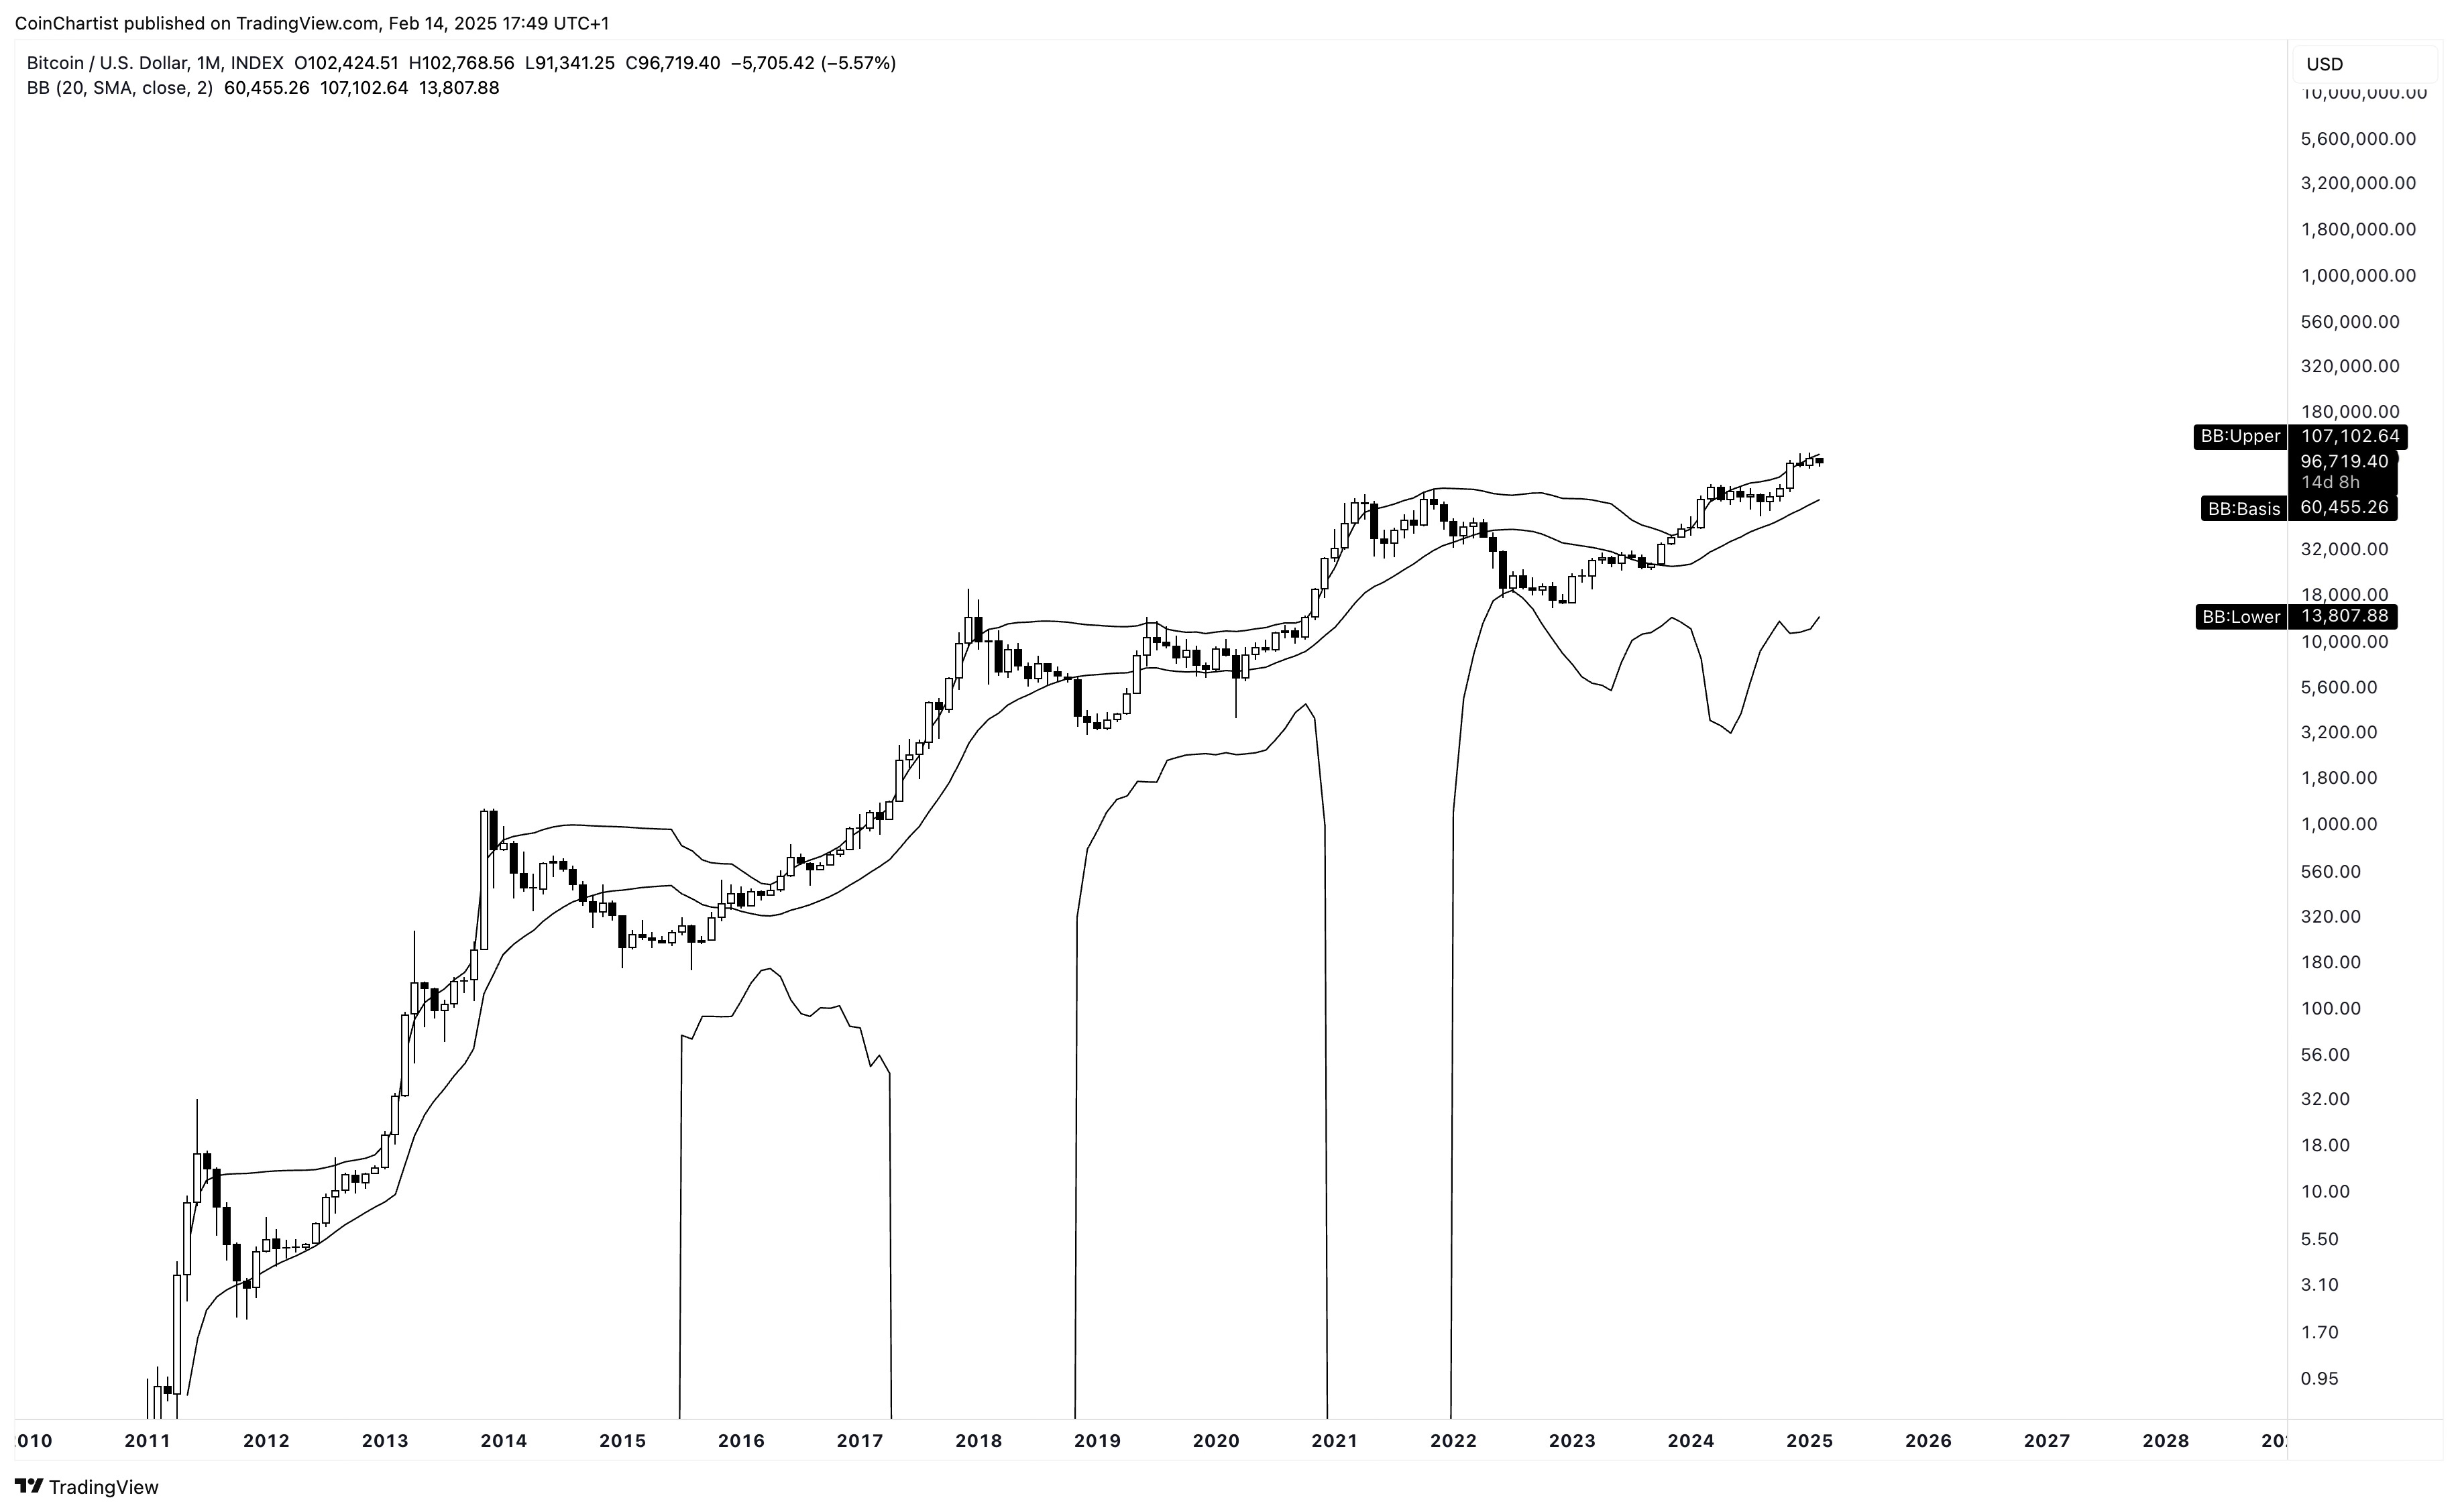
Bitcoin’s near the top of the upper Bollinger Band on the monthly, showing that it isn’t quite as strong as Litecoin at the moment, but it also isn’t in a precarious situation like you’ll see next from Ethereum. Ideally, Bitcoin closes above the upper Bollinger Band at the end of February and continues to walk the bands higher.
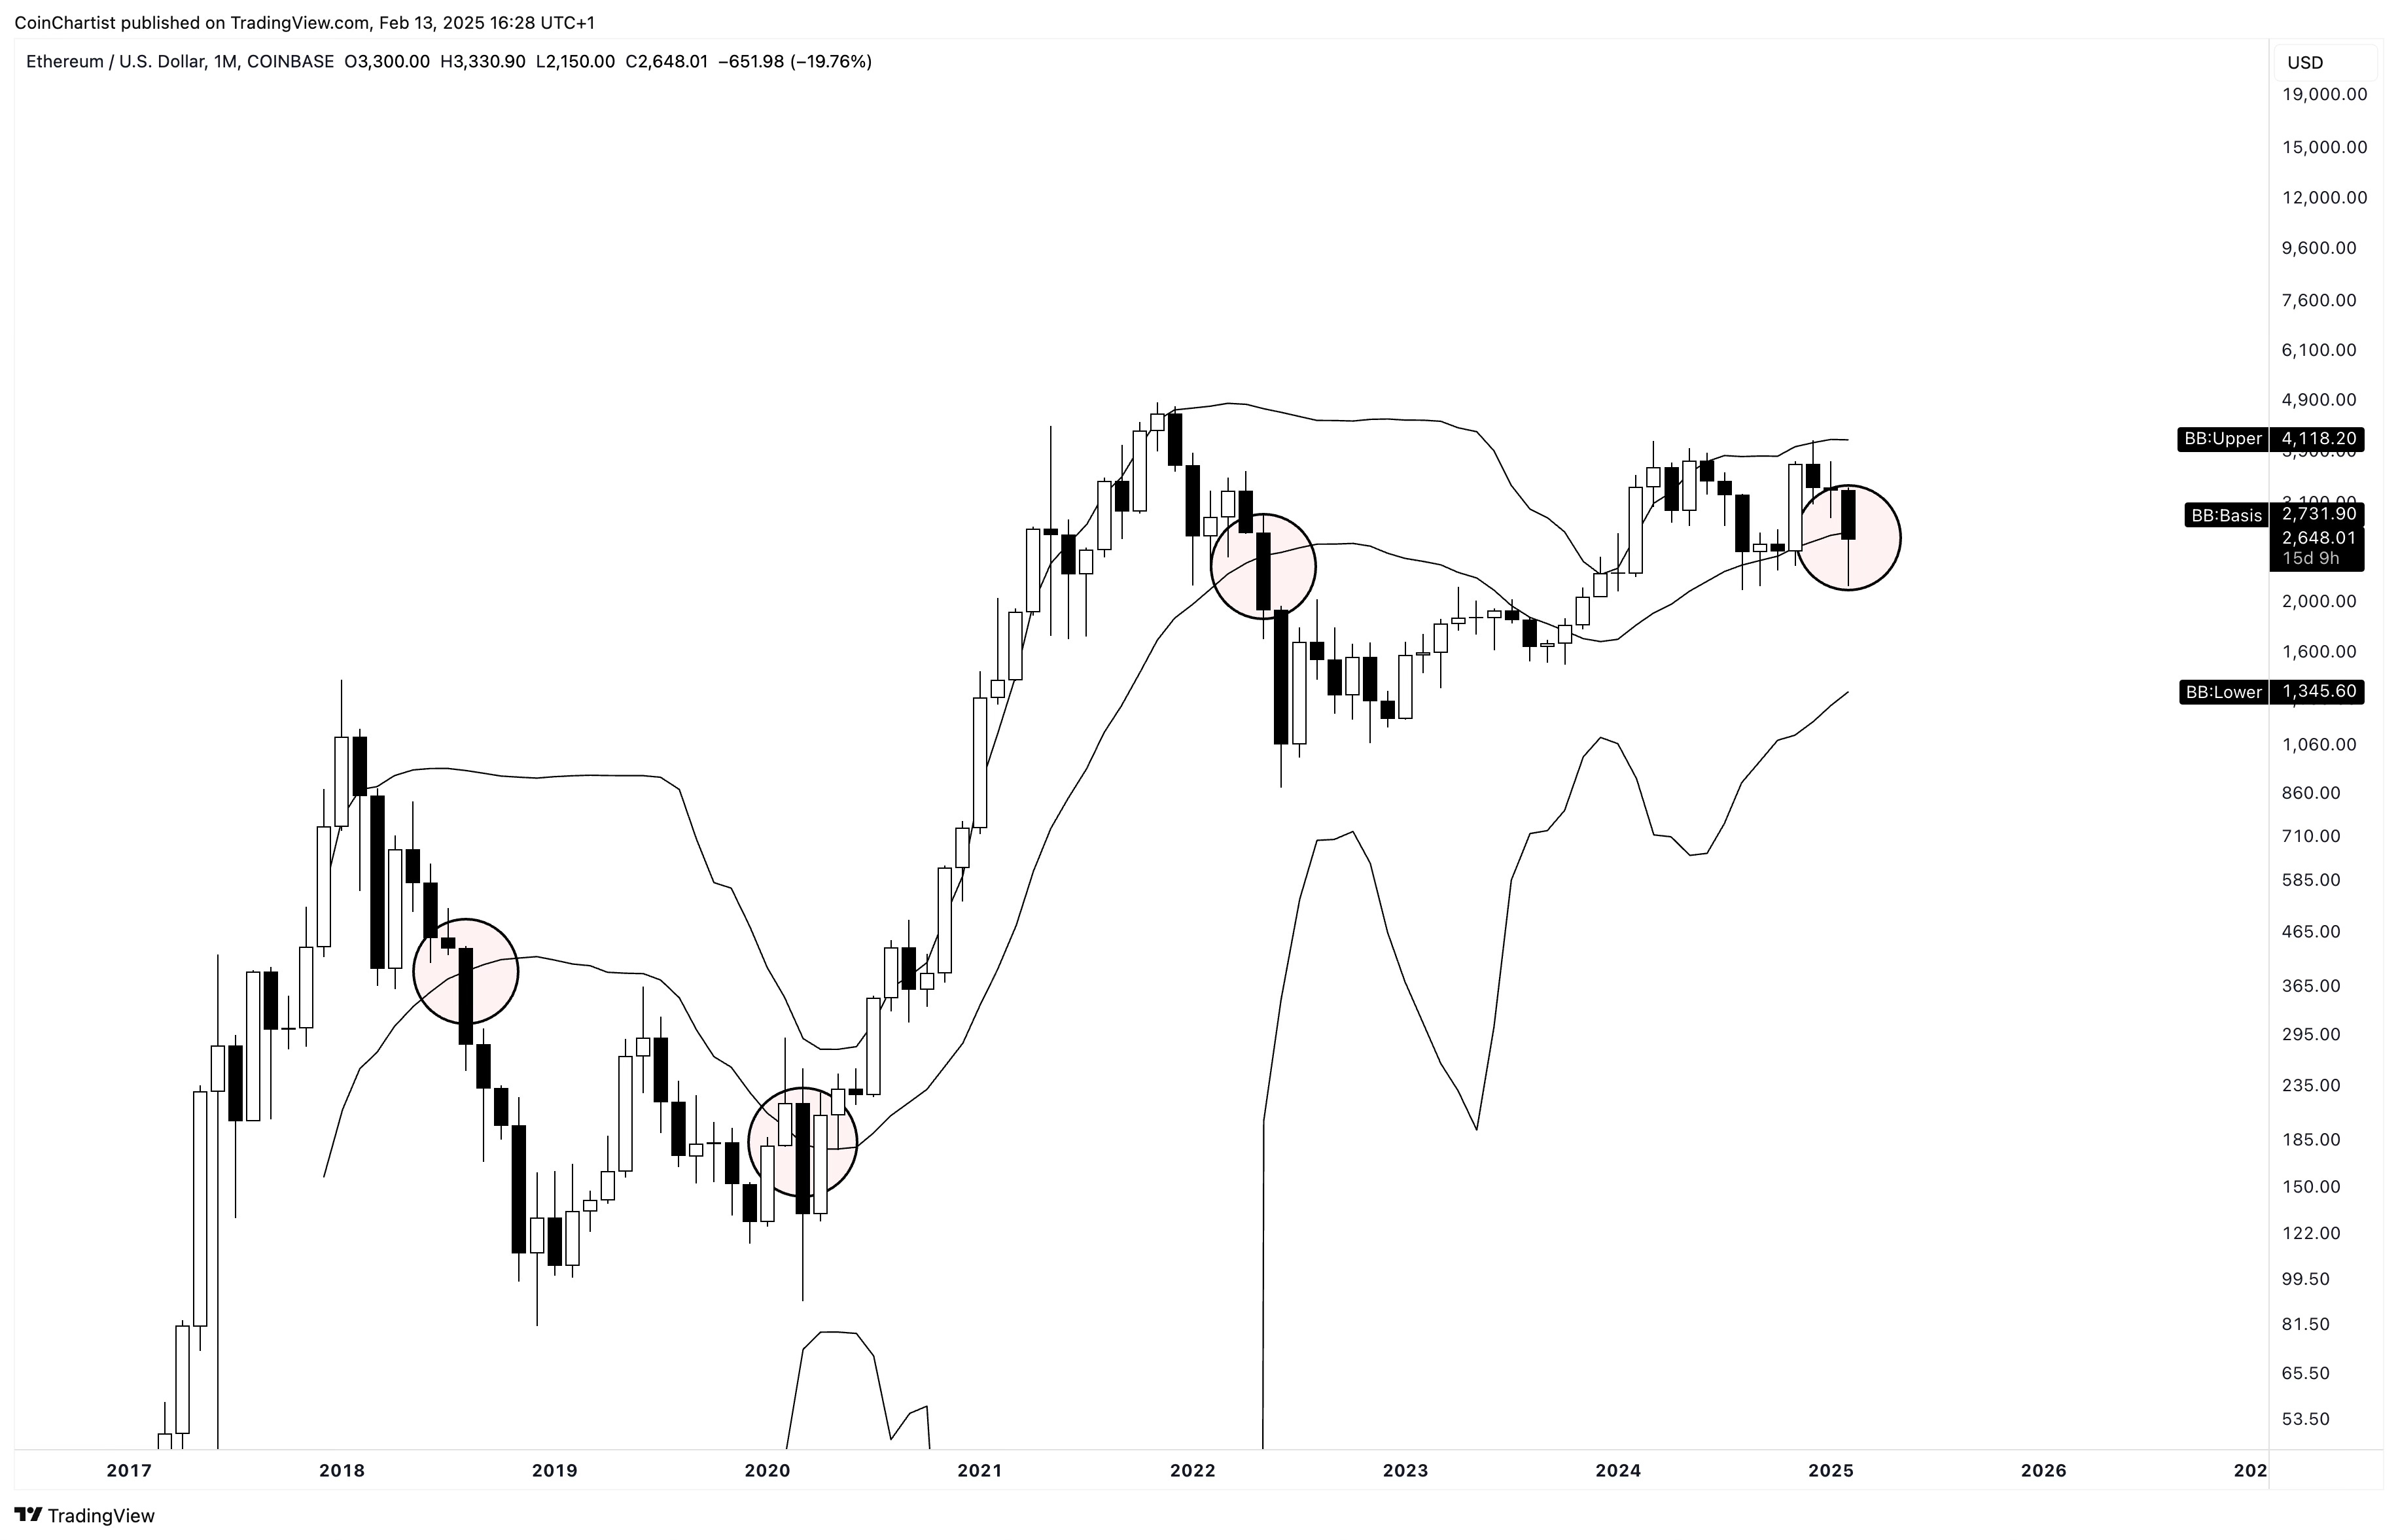
The monthly Bollinger Bands on Ethereum provide a frightening look at what could be the start of a bear market. Each time Ethereum lost the monthly Bollinger Band basis, it kicked off some of the deadliest moves in crypto history, including the COVID crash and two extended bear markets. At the time of this writing, Ethereum is above the monthly Bollinger Band basis at $2730ish and needs to close February’s candle above the basis to keep a bullish bias.
Keep reading with a 7-day free trial
Subscribe to CoinChartist to keep reading this post and get 7 days of free access to the full post archives.