


Invalidation
At what levels will Tony throw in the towel on his bearish thesis? Find out when it is officially back to bull mode.

Disclaimer: The information provided in this Substack newsletter is for general informational purposes only and should not be considered as financial advice. Investing involves risk, and past performance is not indicative of future results. Please conduct your own research or consult a financial advisor before making any investment decisions. The newsletter disclaims any liability for losses or damages arising from the use of this information.
Invalidation overview:
Are we in a bear market or bull market? Tony breaks it down
Clear bearish invalidation levels based on wave counts and technicals
Bitcoin technical signals that will confirm a bull market is back on
Full details about Tony’s short BTCUSD trade including why it was taken, stop loss levels, and more
A glimmer of hope for altcoins, finally – BTC.D reaches key level where past reversals took place
The Golden Days of the Digital Gold narrative might be over – new charts
Bitcoin is currently trading above $97,000 per coin at the time of this writing. This is only a 3% move away from $100,000. $100,000 is the most important psychological number for Bitcoin at this time. Reclaiming this level would be an important signal that the bull run will continue, while failure to do so would also be an equally important signal that a bear market may have started.
From an actual technical standpoint, $100,000 isn’t that important at all. A higher high above the current all-time high, for example, would be far more significant in reestablishing a bullish trend. Several technical indicators also suggest other important levels above $100,000 would need to be tapped before confirming the bull trend is back on.
All of these key levels, along with updated wave counts, are revealed in this issue. In addition, I’m revealing several other technical signals that don’t involve a price target, that would further support the idea the bull run is back on. Failure to trigger the signals covered below would see Bitcoin teetering back into full bear territory.
Other topics this issue discusses include why I publicly took a short position on Bitcoin and walks you through why I took it, and how I plan on managing my stop loss levels.
There’s also a signal in Bitcoin dominance triggering right now that appeared right before the last altcoin season. If I’m wrong, and Bitcoin is about to resume its bull run, there’s a greater likelihood of a risk-on environment returning as well, which could finally cause altcoins to overperform – even if it doesn’t turn into a full blow alt season.
Finally, we’re looking at some XAUBTC charts, comparing Gold versus Bitcoin that might hint at a larger trend change taking place.
Bear or Bull Market?
Bitcoin began its bull market in November 2022 after the FTX collapse caused widespread capitulation and put in a cyclical bottom. Until a lower low is made, Bitcoin continues to make higher highs and higher lows – the pure definition of an uptrend. However, because Elliott Wave counts to five have been satisfied, I’m of the mindset we’ve switched into a corrective phase. We won’t know if I am wrong or not until long in hindsight. We can only attempt to predict, anticipate, and prepare accordingly.
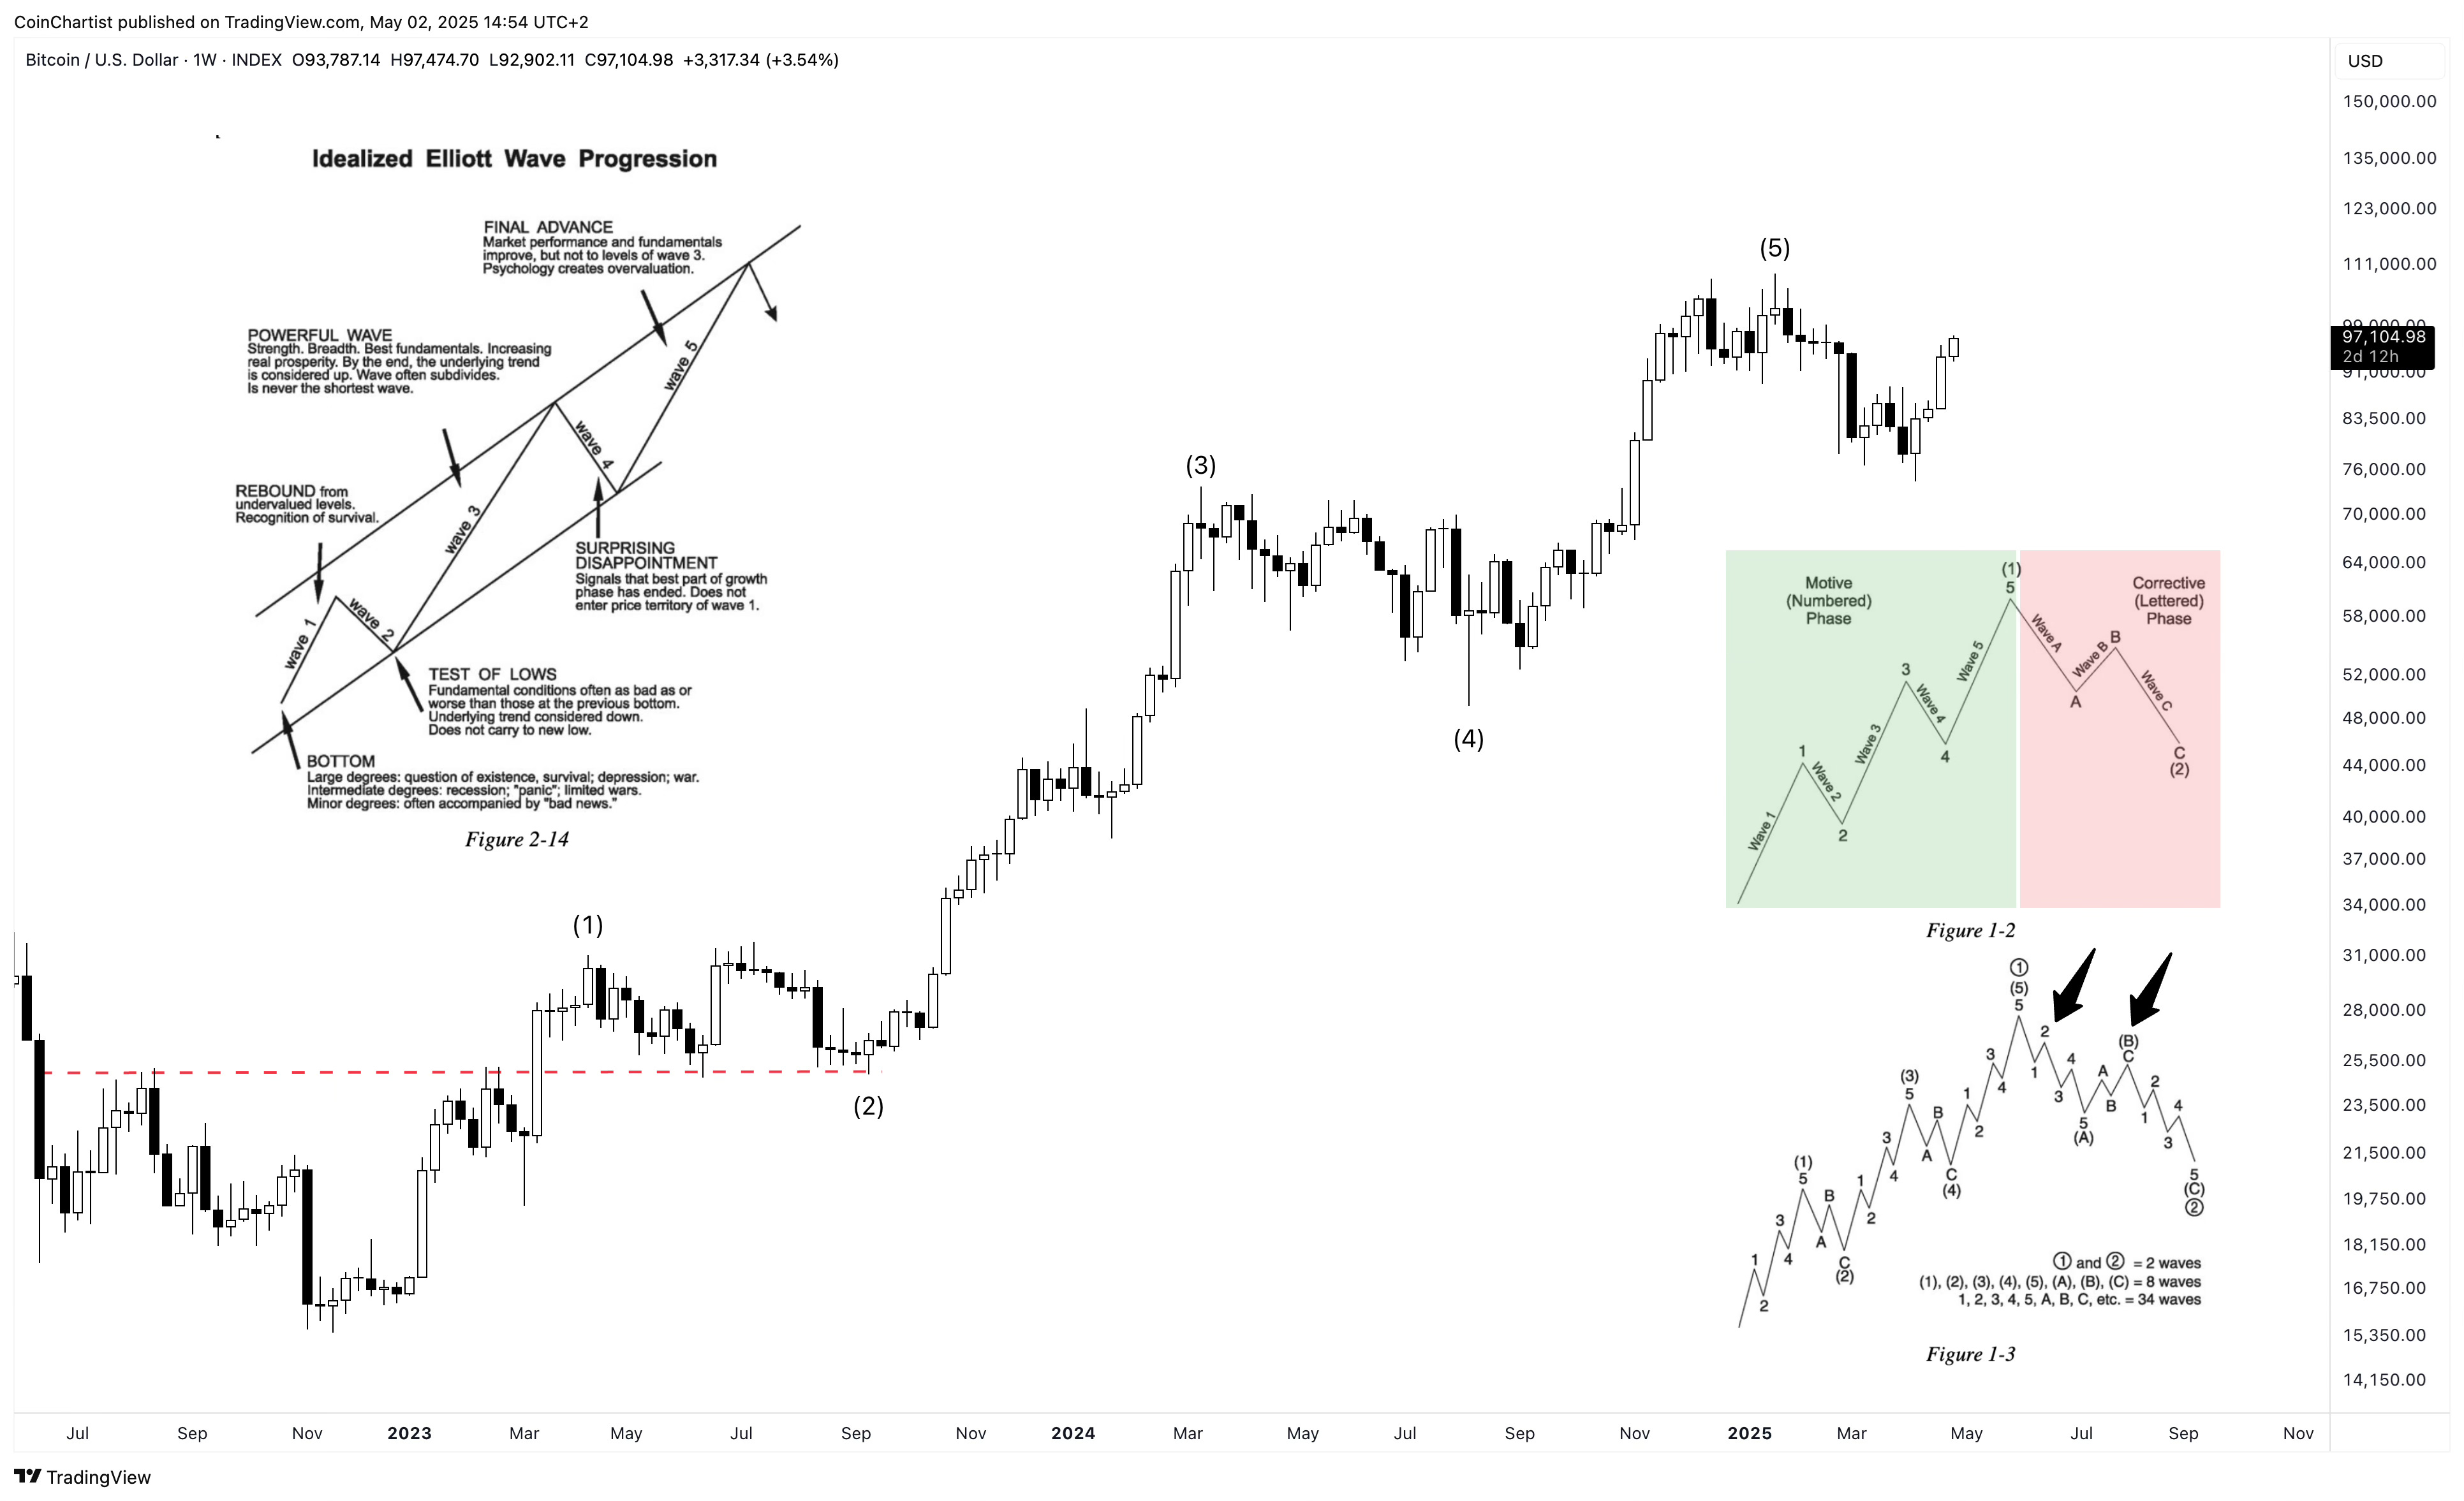
Pay close attention to the diagrams in each chart. In the Idealized Elliott Wave Progression diagram, it explains how each wave personality should behave. Wave 1 was a rebound from the bottom. Wave 2 literally retested lows, as the dashed line shows. Wave 3 was a powerful wave, and wave 4 was surprising disappointment. Wave 5 climbed beyond wave 3, but lacked the same strength that wave 3 did. These personalities fit perfectly, if you really think about how the waves look and the sentiment that took place across the market during each wave. All wave counts must have the right “look” and fit personalities, guidelines, and rules. If we have indeed satisfied all five waves we have moved into a corrective phase, we are now trying to understand if we are in wave 2 of A, or wave B of an ABC correction.
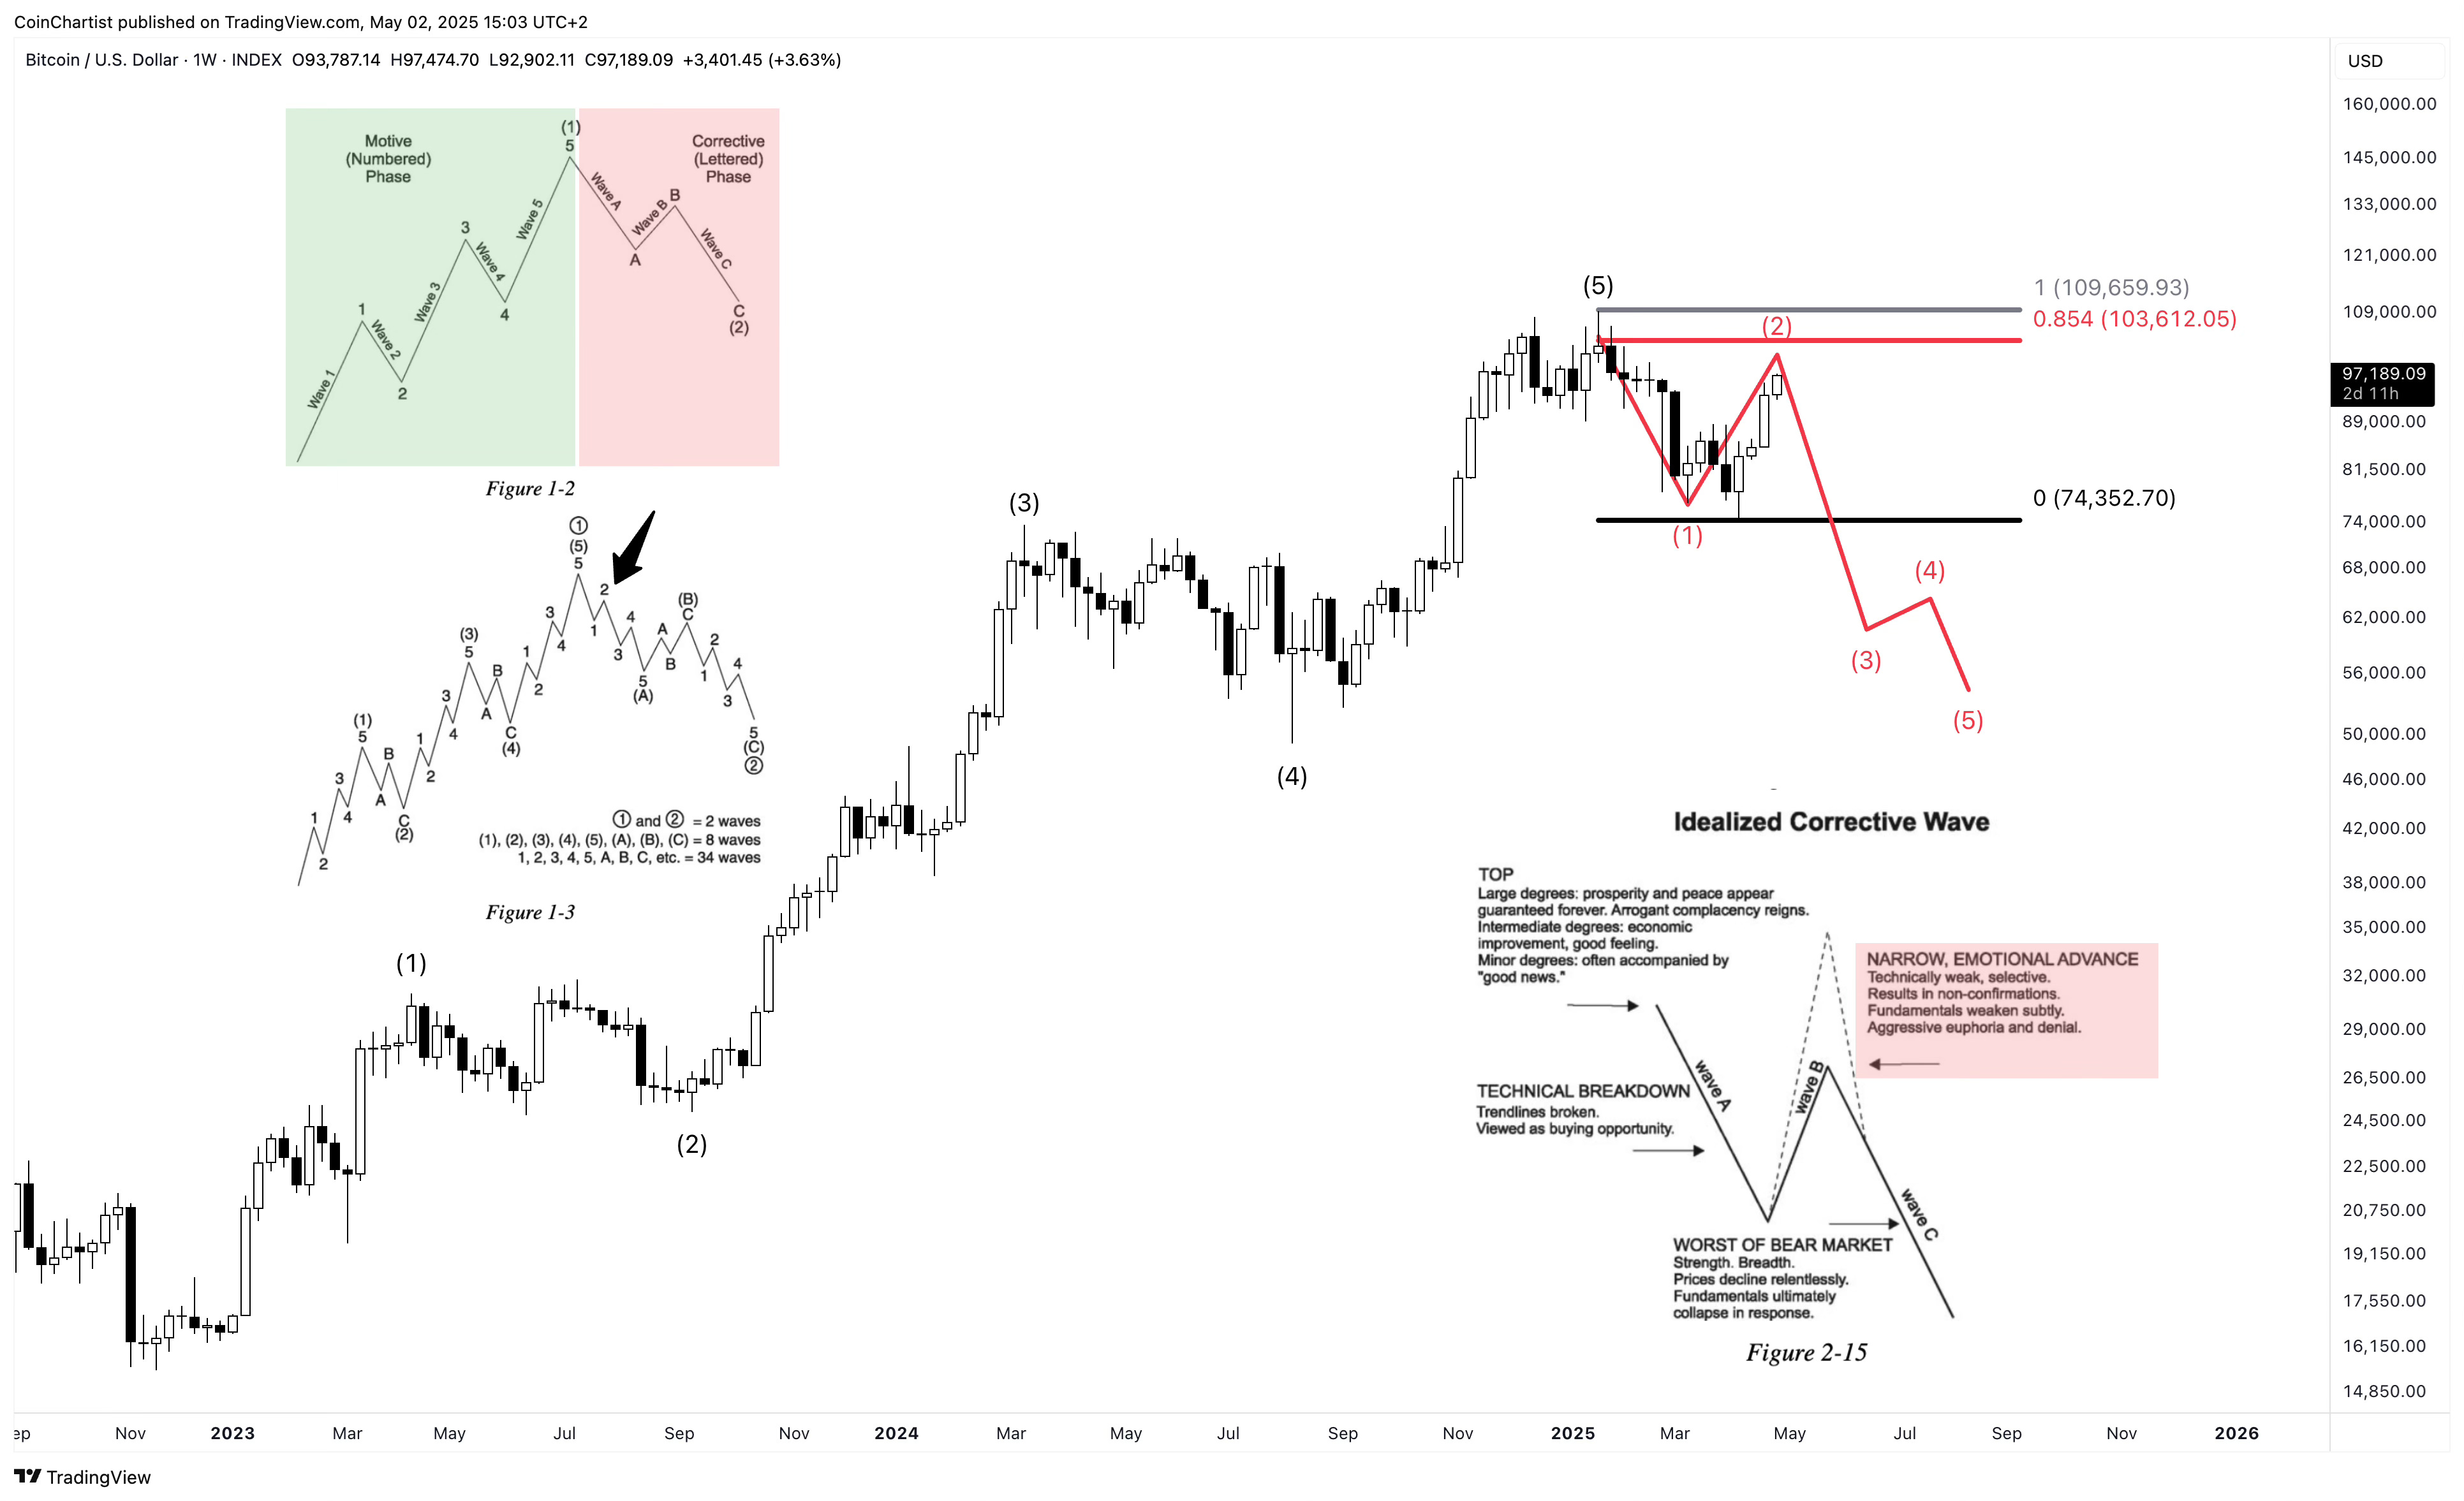
In this example, we are focusing on the wave 2 of A scenario. A five-wave move down to complete a wave A is the first major leg of a zig-zag correction. Wave 2s cannot retrace more than 100% of wave 1. This is a really tough aspect of Elliott Wave counts and it helps to explain why wave 3s are so strong. The challenging aspect relates to how far you must allow price to retrace before confirming a wave 2 isn’t in play. When price fails to make a new extreme during wave 2, it confirms to the market that the trend has changed and causes a more powerful wave 3. It might appear I am simply being stubborn allowing Bitcoin to come all the way back towards $100,000 and sticking with a bearish thesis. But I am truly just sticking to the rules and guidelines that fit my wave counts and supporting technicals. This can of course change, but for now, I have no reason to deviate from what has worked for me for several years now.
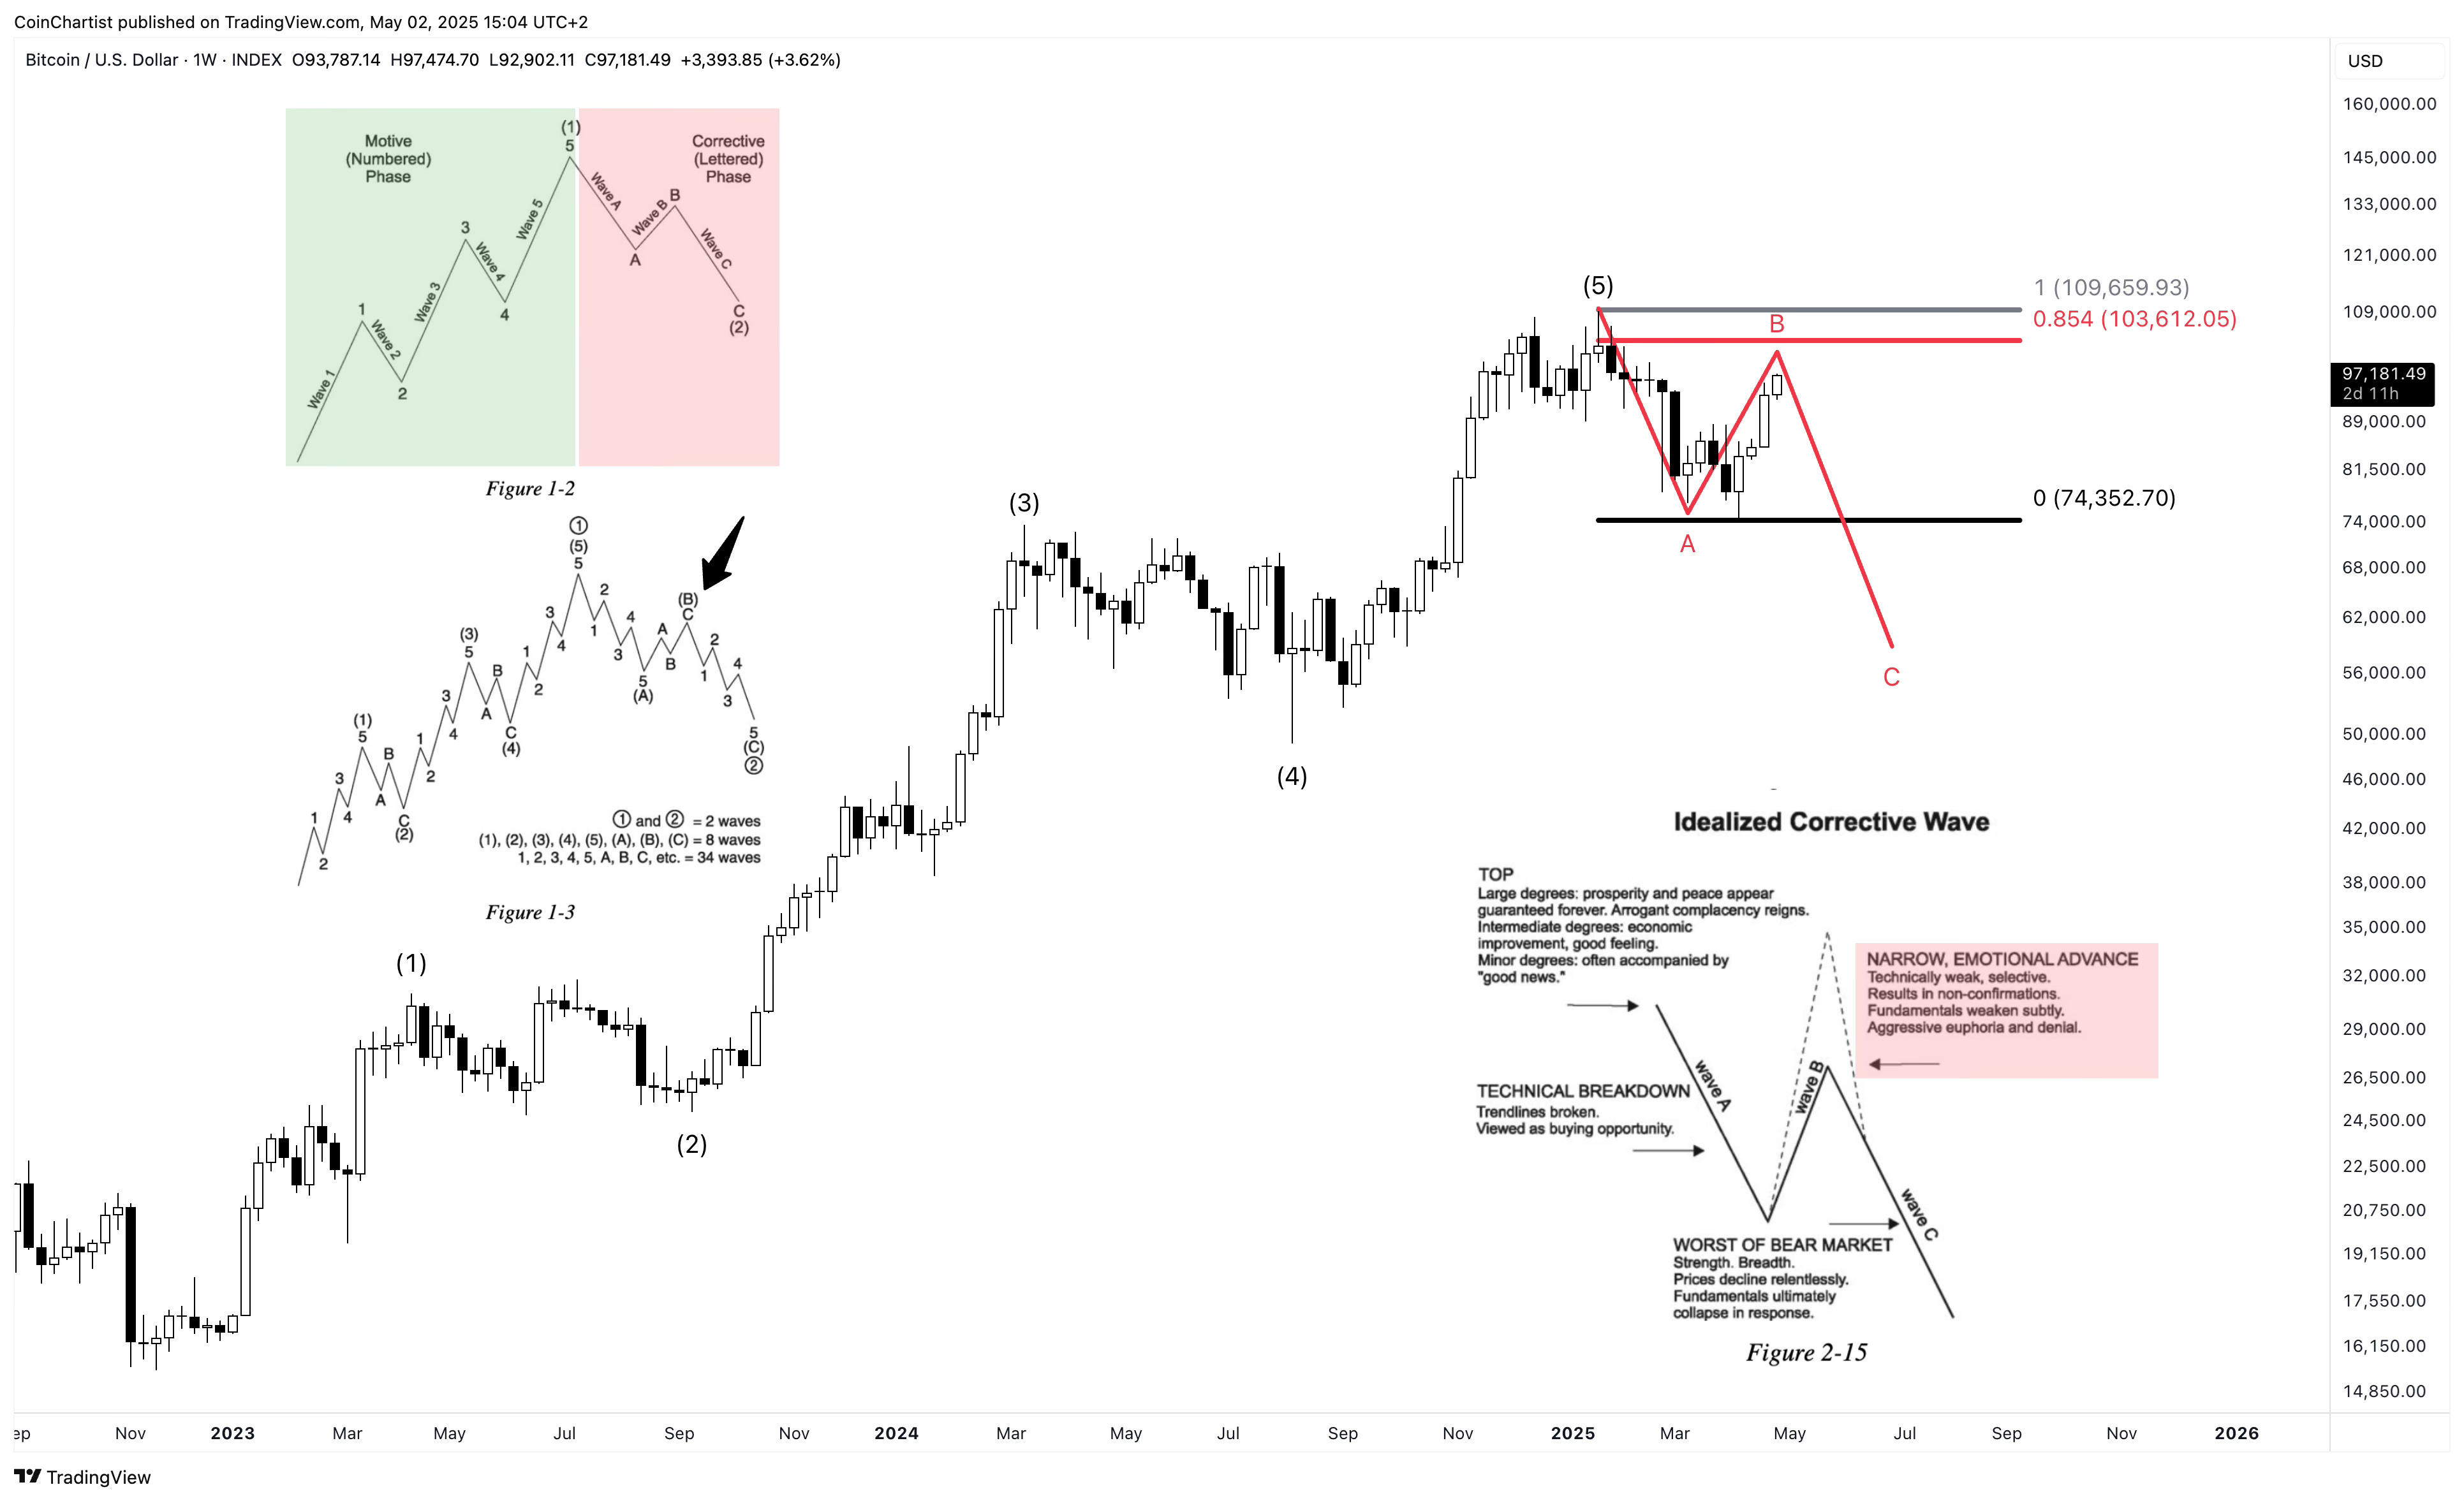
In this example, we are looking at the wave B scenario – which has us a little further along in the correction. Although we can allow 100% retracement for wave 2, a wave B shouldn’t retrace more than the 0.854 Fibonacci level. This is what I consider the “bear market rally” Fib level that I’ve added custom to my retracement tool. The Idealized Corrective Wave diagram explains that B waves are recoveries that are narrow, emotional advances. They usually involve heavy leverage and result in non-confirmations, like a lack of volume. I truly have never seen this market more emotional, with bulls and bears arguing everywhere. I’ve also never been so attacked in my career for having a bearish stance, which tends to tell me that bulls are the more emotional market participants at the moment. I cannot say that confirms the technicals or wave counts/personalities, but it is an observation to make.
B waves are tricky, and can make a higher high above the previous all-time high. However, I assign this a very low probability, because Bitcoin’s last cyclical peak was an Expanded Flat correction. I wouldn’t assume we’d get two Expanded Flat corrections in a row. Flats can appear in a wave 2, but more commonly appear in the wave 4 placement. The last Expanded Flat helped tell us a fifth wave in Bitcoin was next. If this was our fifth wave, we would move into an ABC correction of a larger degree. And because B-waves result in non-confirmations of technical signals, I have a bevy of signals and price levels that I would combine with wave counts to better understand if a higher high was a B-wave or the real deal bullish continuation.
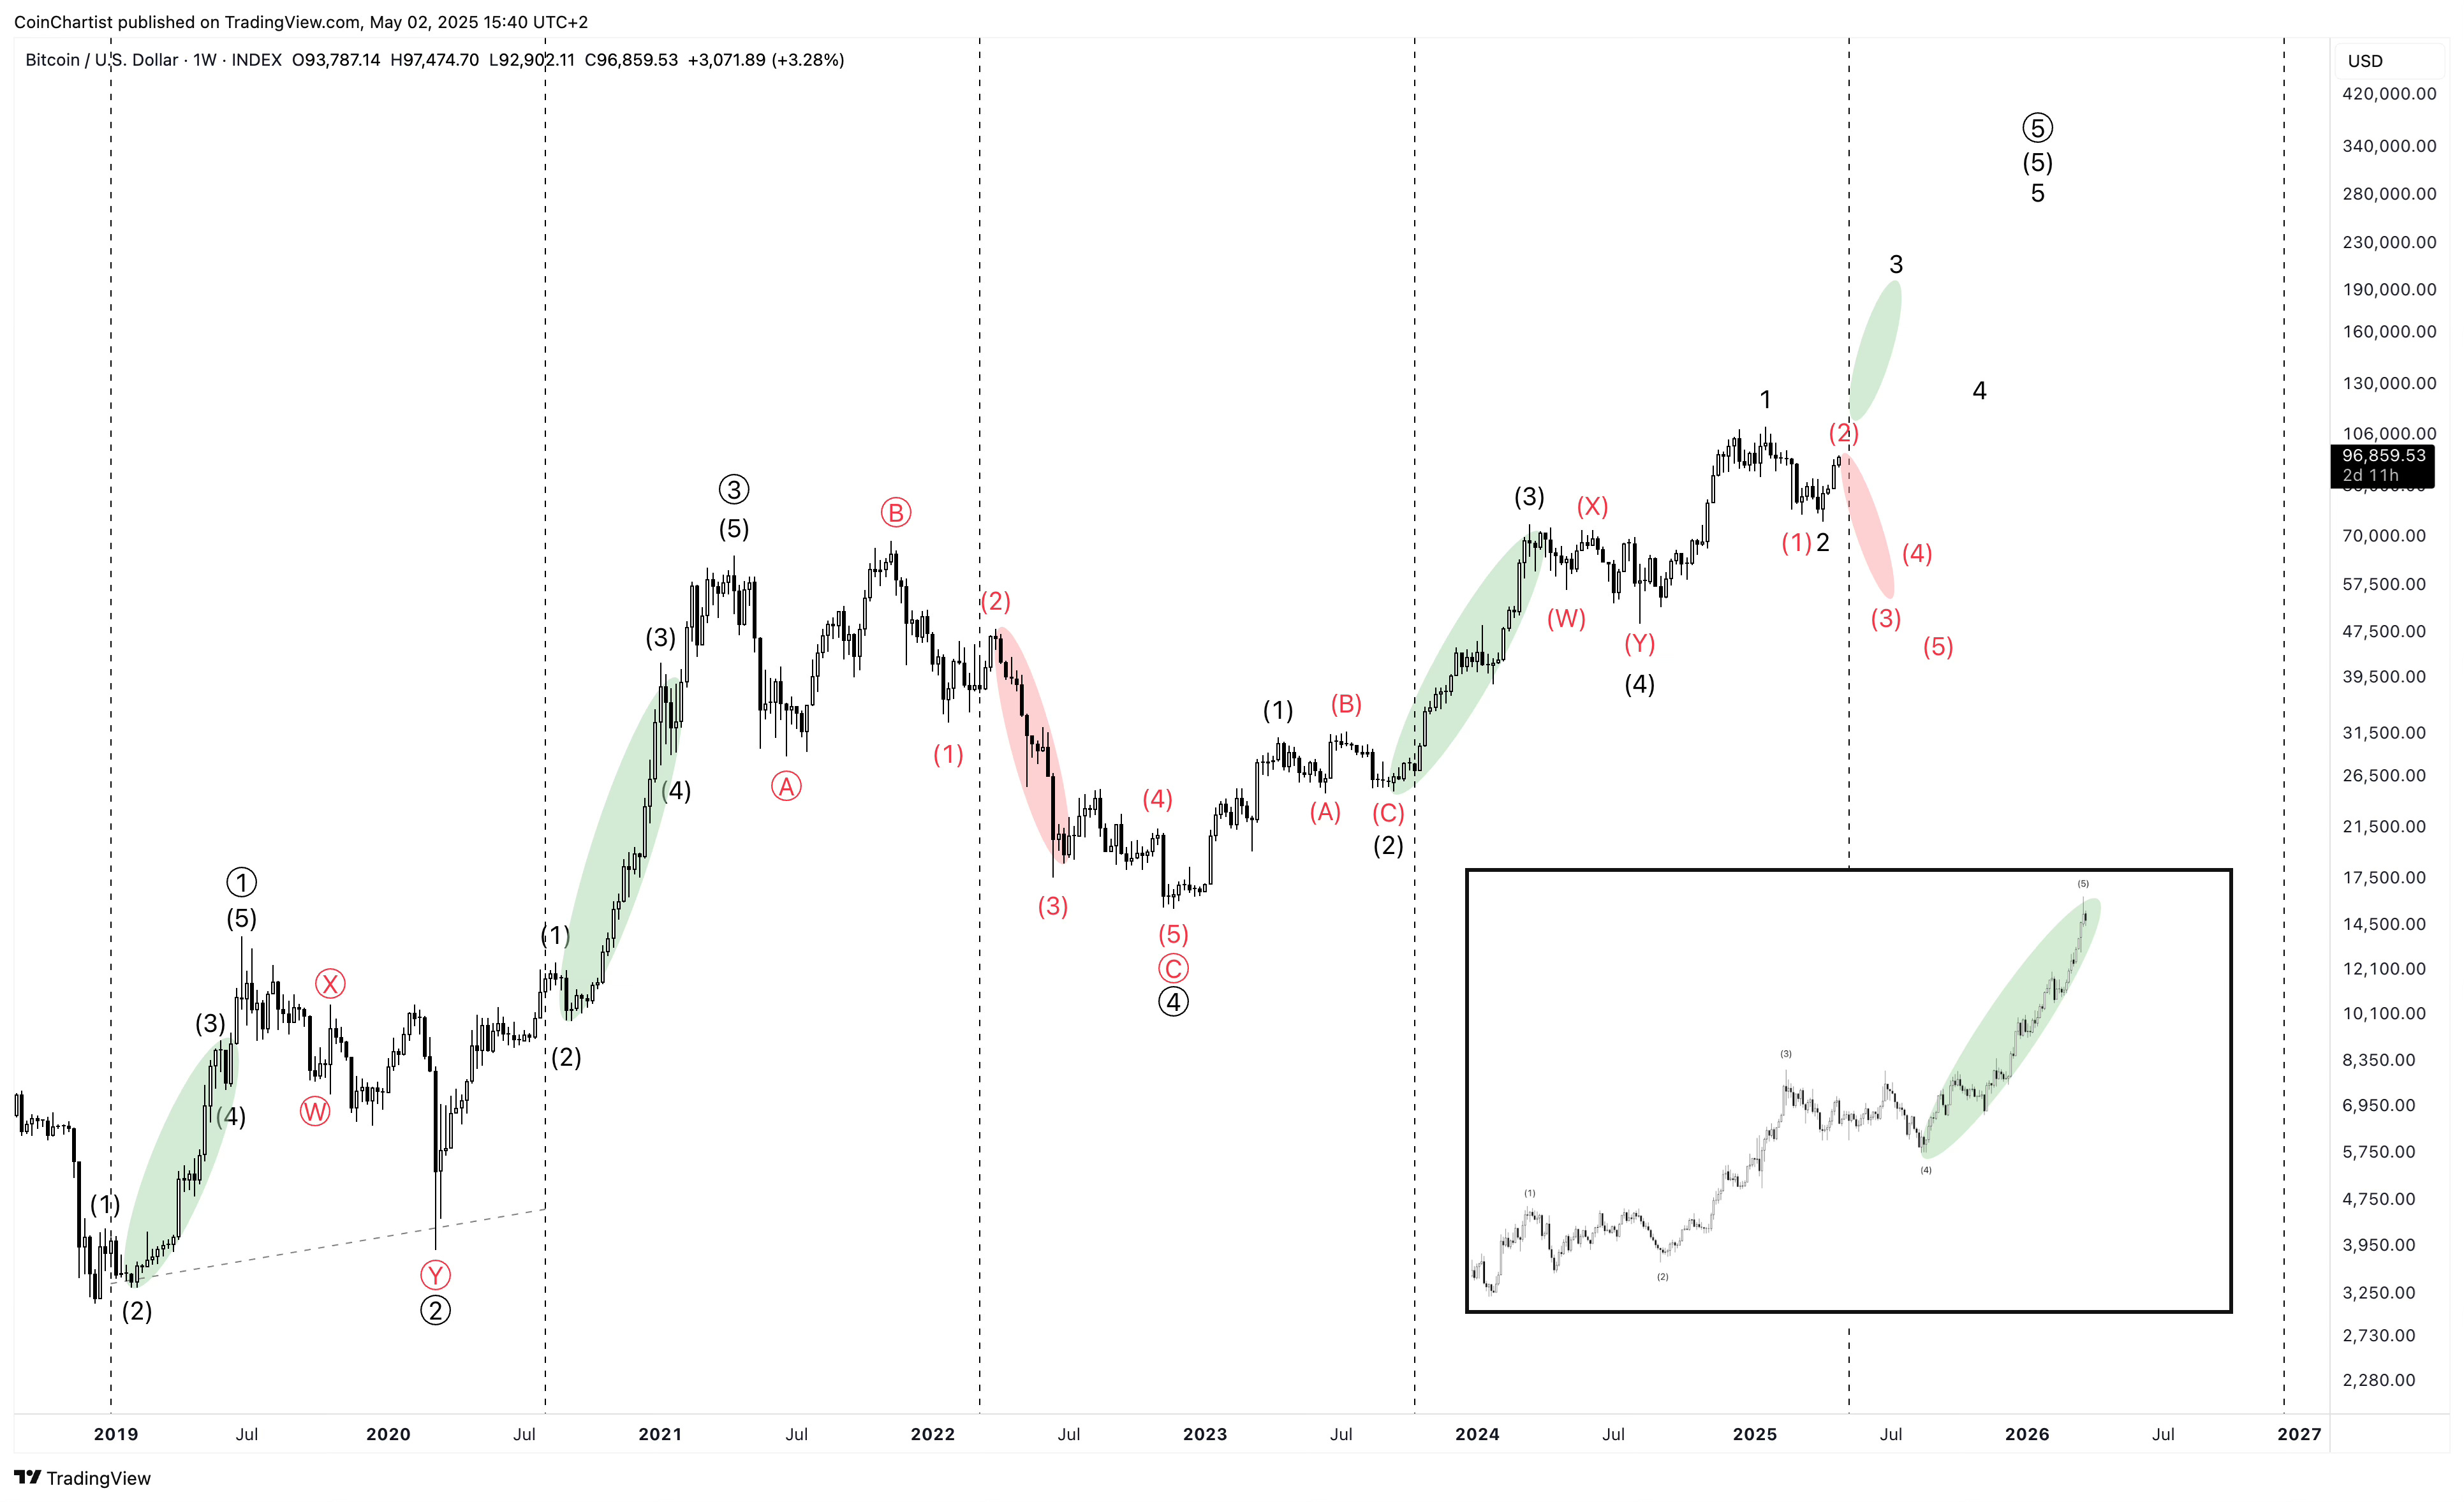
If we do move up to a new all-time high and there is bullish confirmation of volume and technical strength, I will have no choice but to admit I am wrong and point to the “extended fifth of a fifth” in Bitcoin that bulls are subscribing to as a theory. In this longer-term, fully counted out chart, I show both bullish and bearish scenarios. If we are bearish, we could more than likely be beginning a wave 3 impulse to the downside. If this is an extended fifth of a fifth scenario, then we’d instead be starting a smaller degree wave 3 impulse to the upside. Either way, we are getting a very strong impulsive move next, which we can see by the equally drawn distances between each dashed line. The green and red ellipses are shown to highlight that extended waves and impulses in Bitcoin always appear in the wave 3 position. This is why I give much more weight to us moving into a bear market versus moving into some extended third wave of an extended fifth situation.
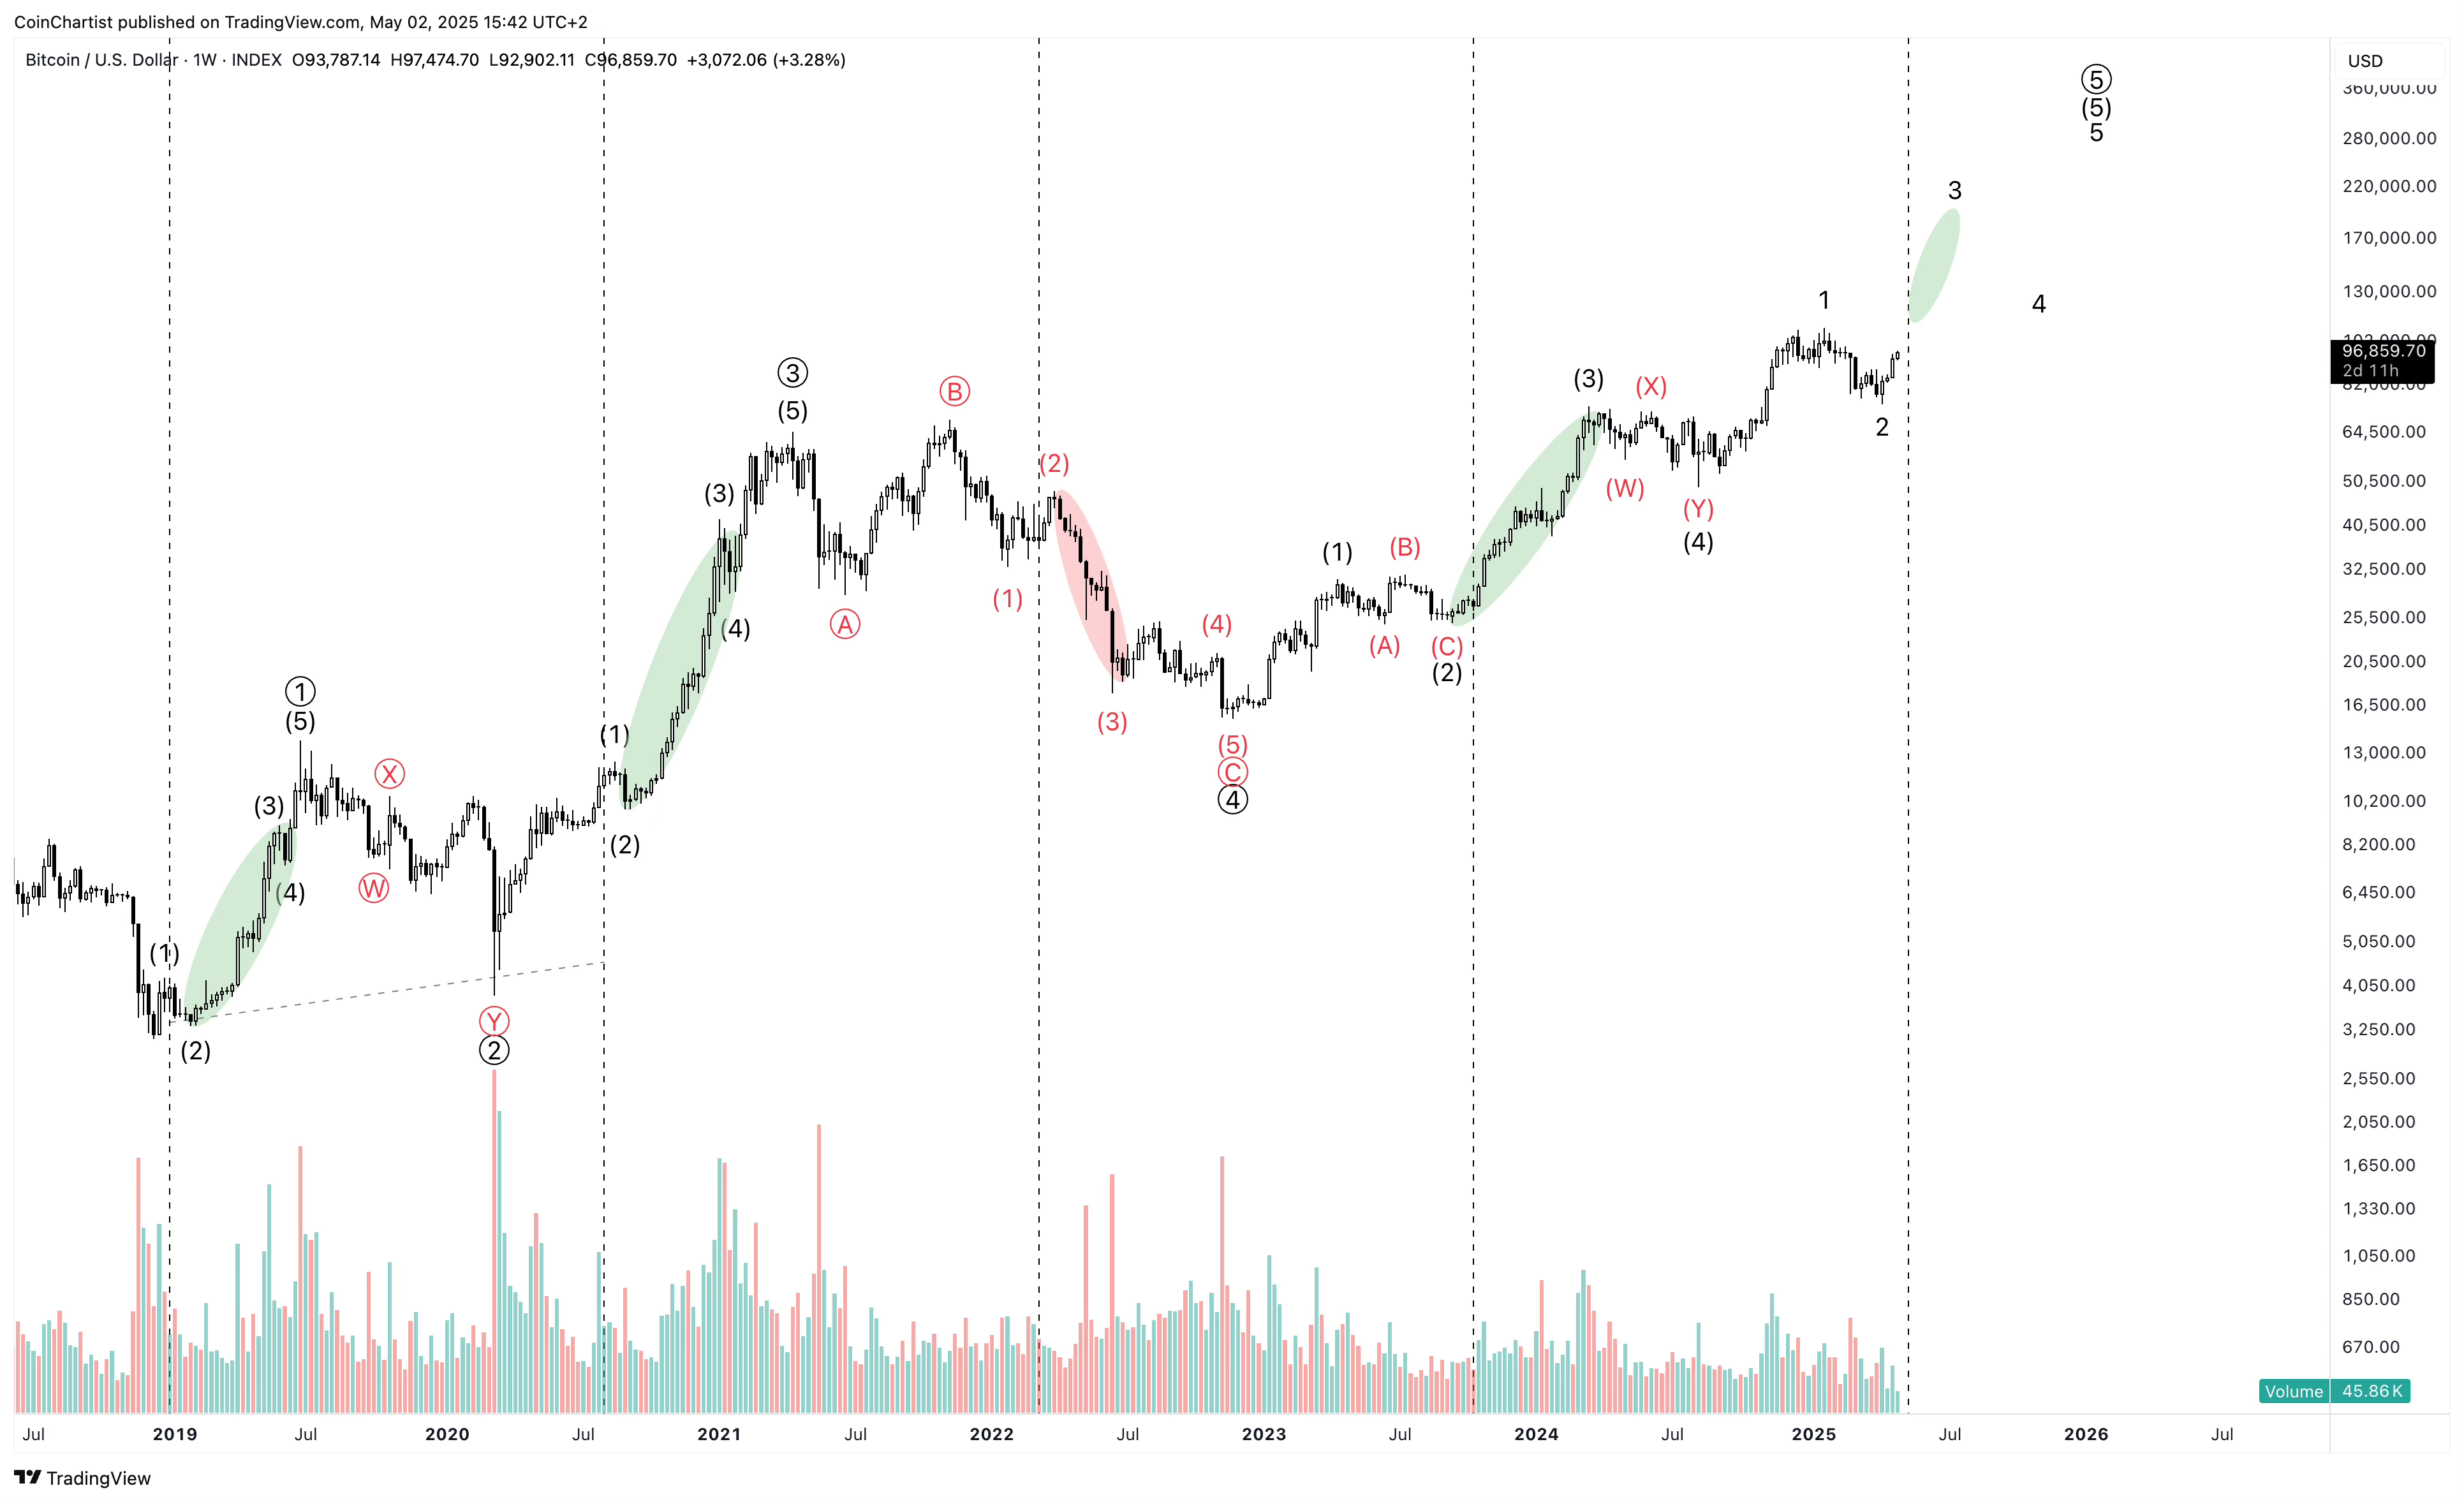
Here is a better view of the fully bullish version, where the fifth wave of the fifth wave is extended. Other than the fact that Bitcoin shows extensions in the wave 3 position, another reason I don’t see the proper setup for an extended fifth wave is due to a lack of volume. Volume spikes during an extended fifth wave.
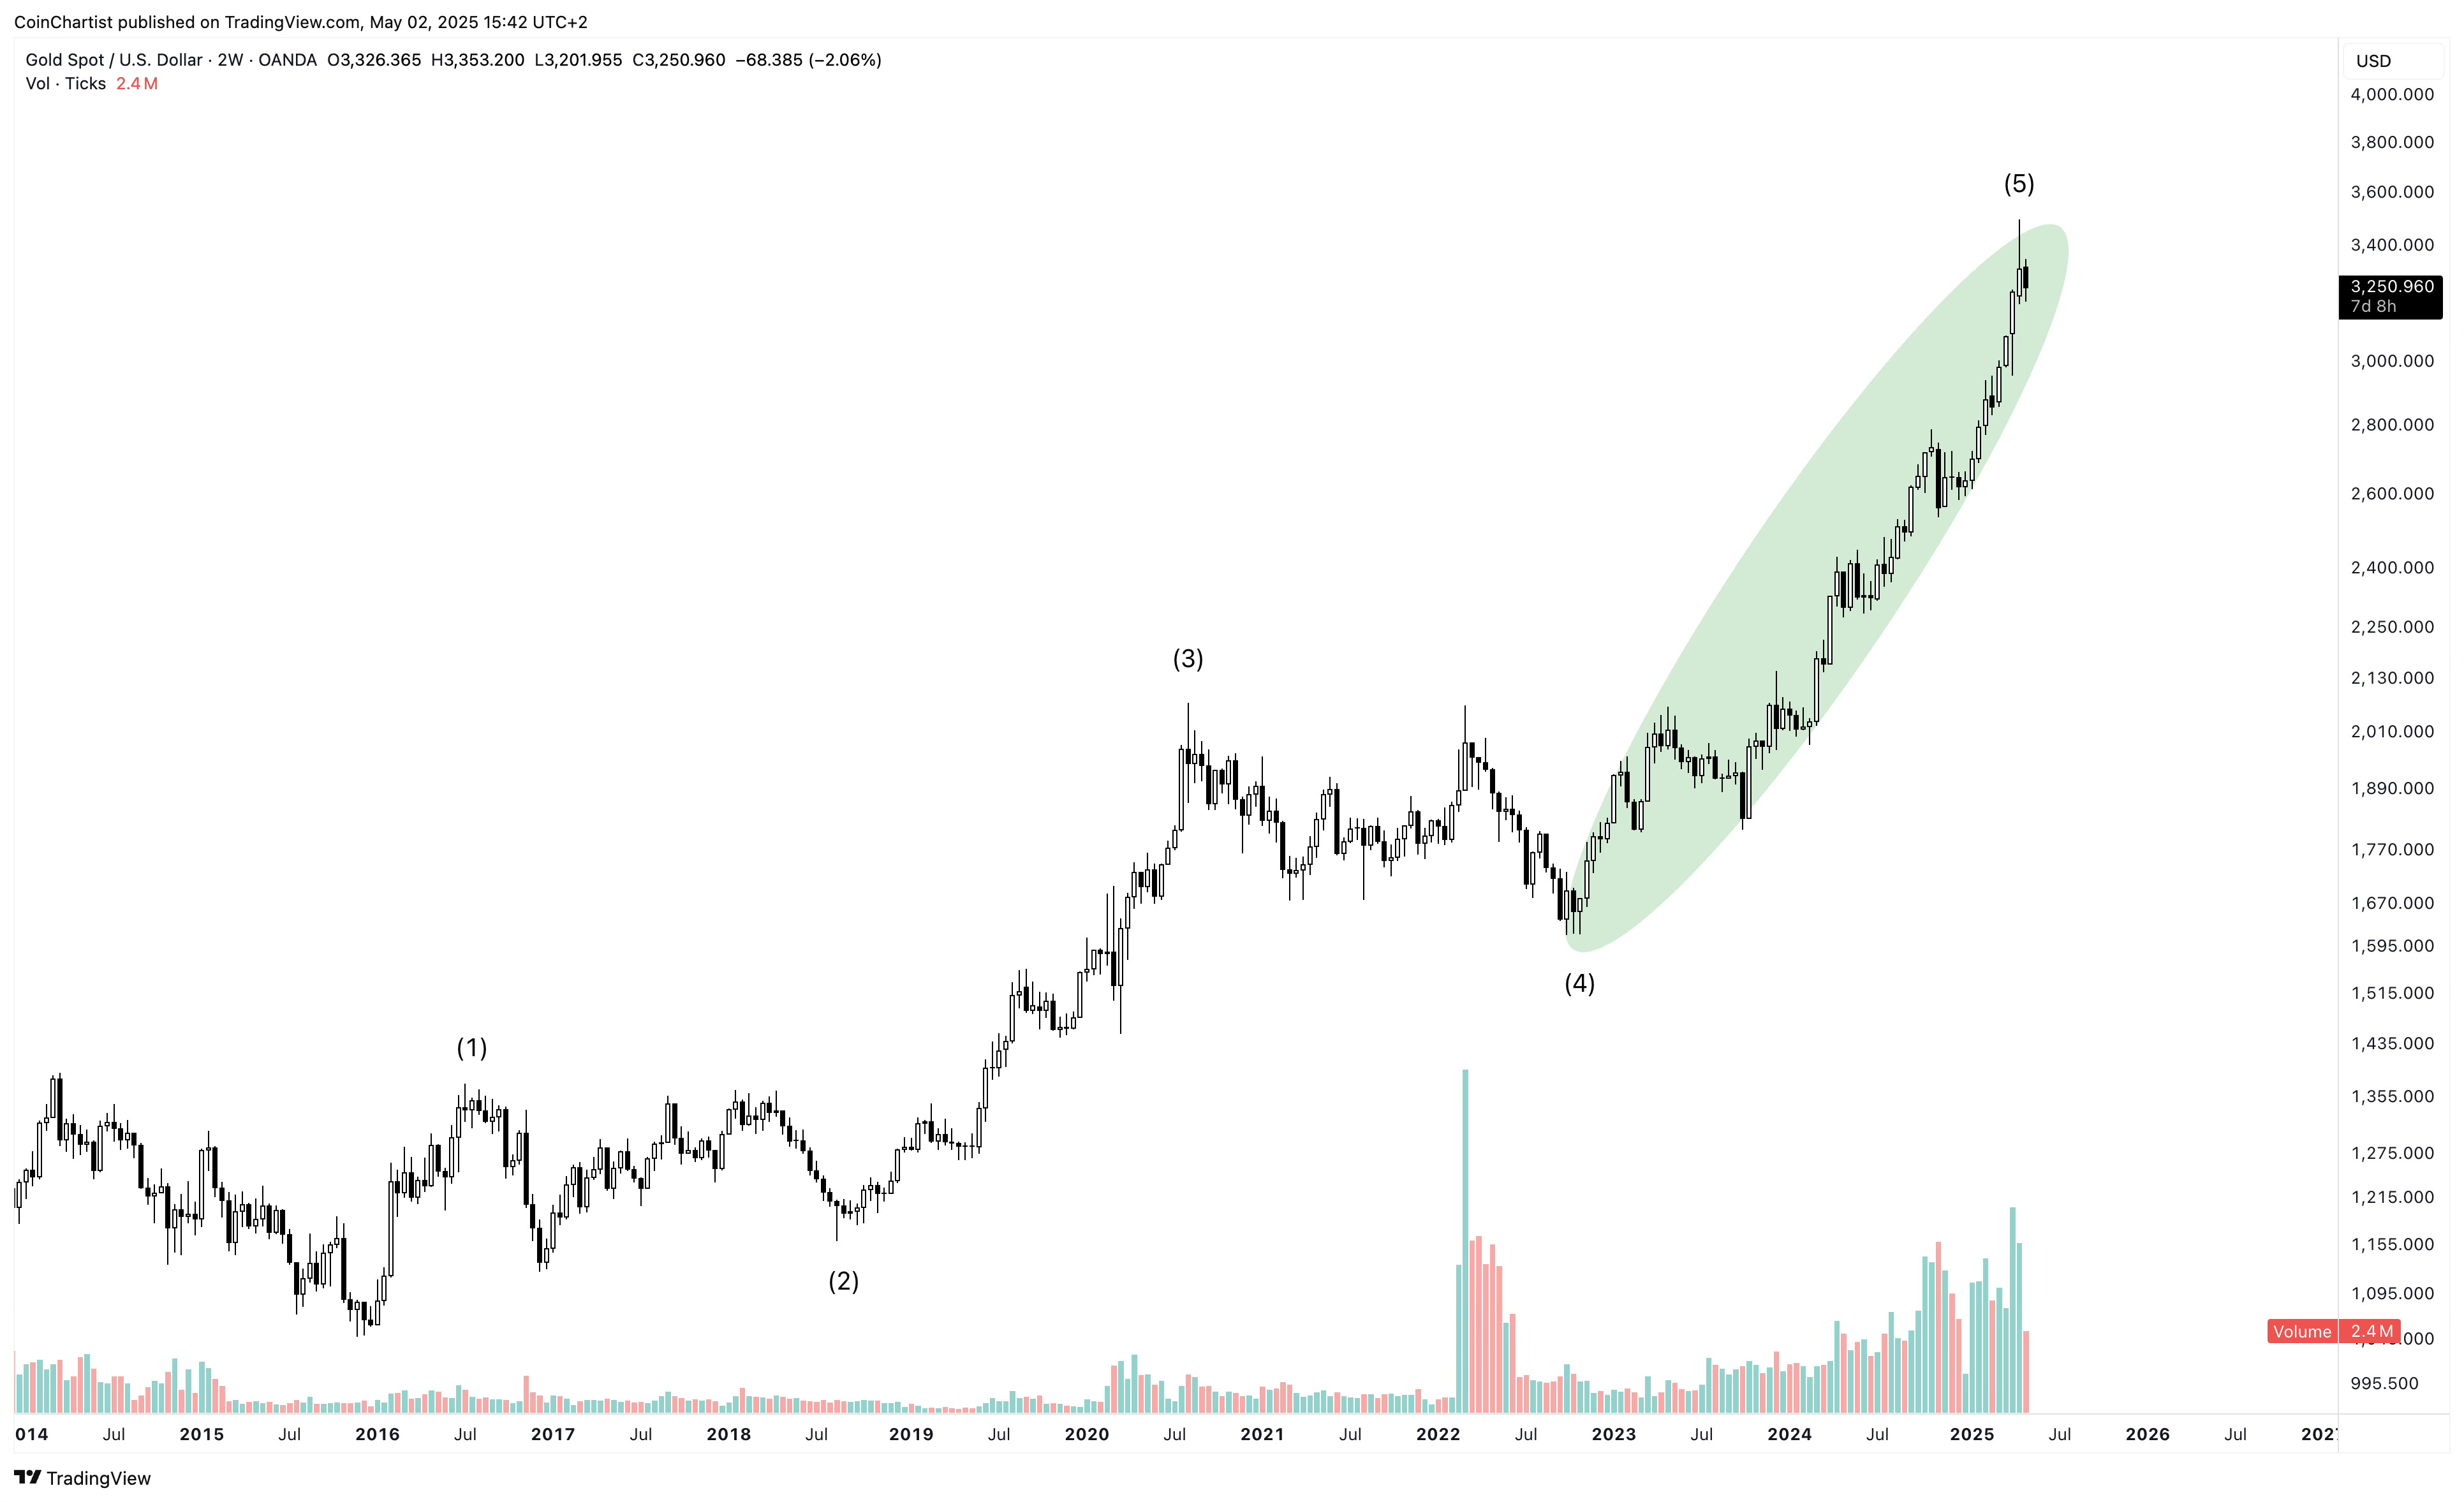
Here is Gold, showing a proper fifth wave of a fifth wave extension. Gold’s fifth wave looks a lot like Bitcoin’s third waves where the entire rally is very elongated with few corrective phases. Also, take note of the increasing trading volume spiking during the extended fifth wave. This is how Bitcoin should look if it were truly in an extended fifth wave. Maybe it’s coming. Maybe it is not. A lack of volume would be the non-confirmation signal of a B-wave forming and not continuation.
Clear Invalidation Levels
The problem with Elliott Wave analysis is that it doesn’t consider technical data, only wave counts. Combining EW counts with technicals can significantly improve the probabilities of successful trades and risk management. EW helps us anticipate changes in the market, and technicals help to improve this predictive power and provide potential confirmation. That’s why I wouldn’t solely rely on an EW count for establishing my invalidation levels or thesis.
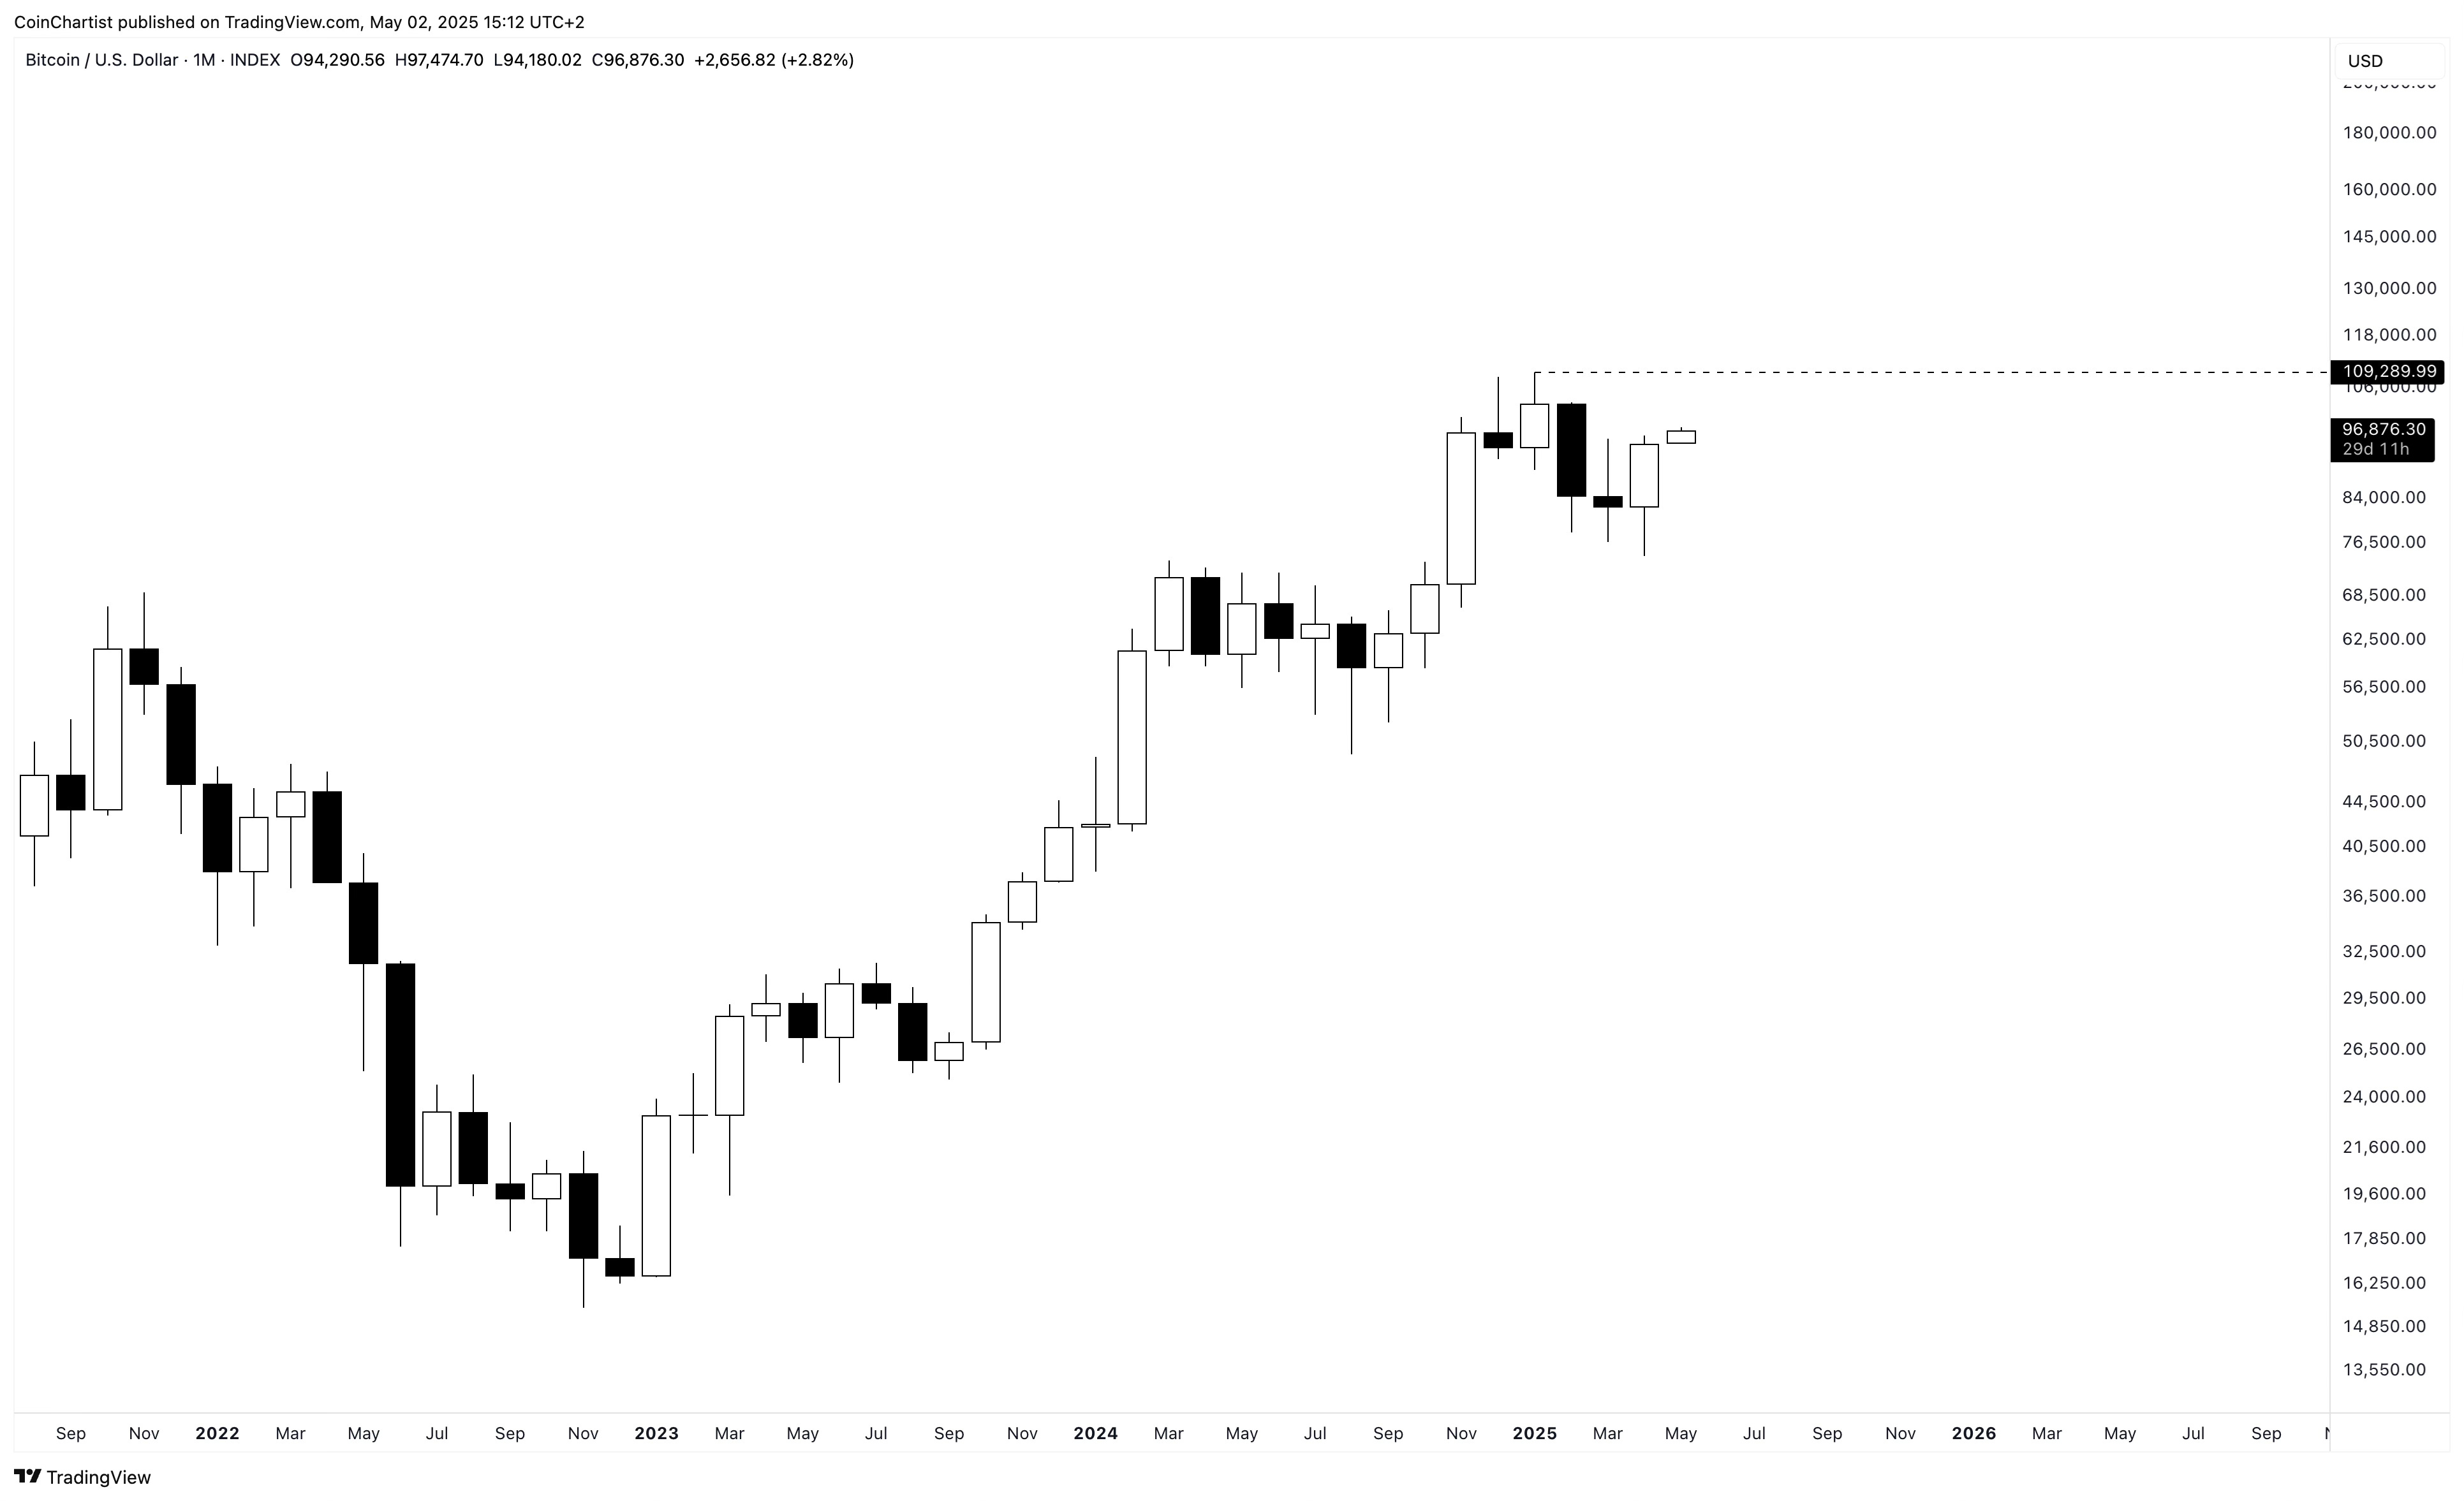
Plain and simple, an uptrend is a series of higher highs and higher lows. Until Bitcoin puts in a new ATH over $109,289, I’m looking for a lower low ultimately instead. This will likely take a while, even if I end up being correct. A lower low would be 50% drop from here above $97,000. This would be devastating for any bull who gets trapped here, which is why I prefer being on the side of caution. If I have to buy back in, I don’t lose money – I only missed out on some minor upside.
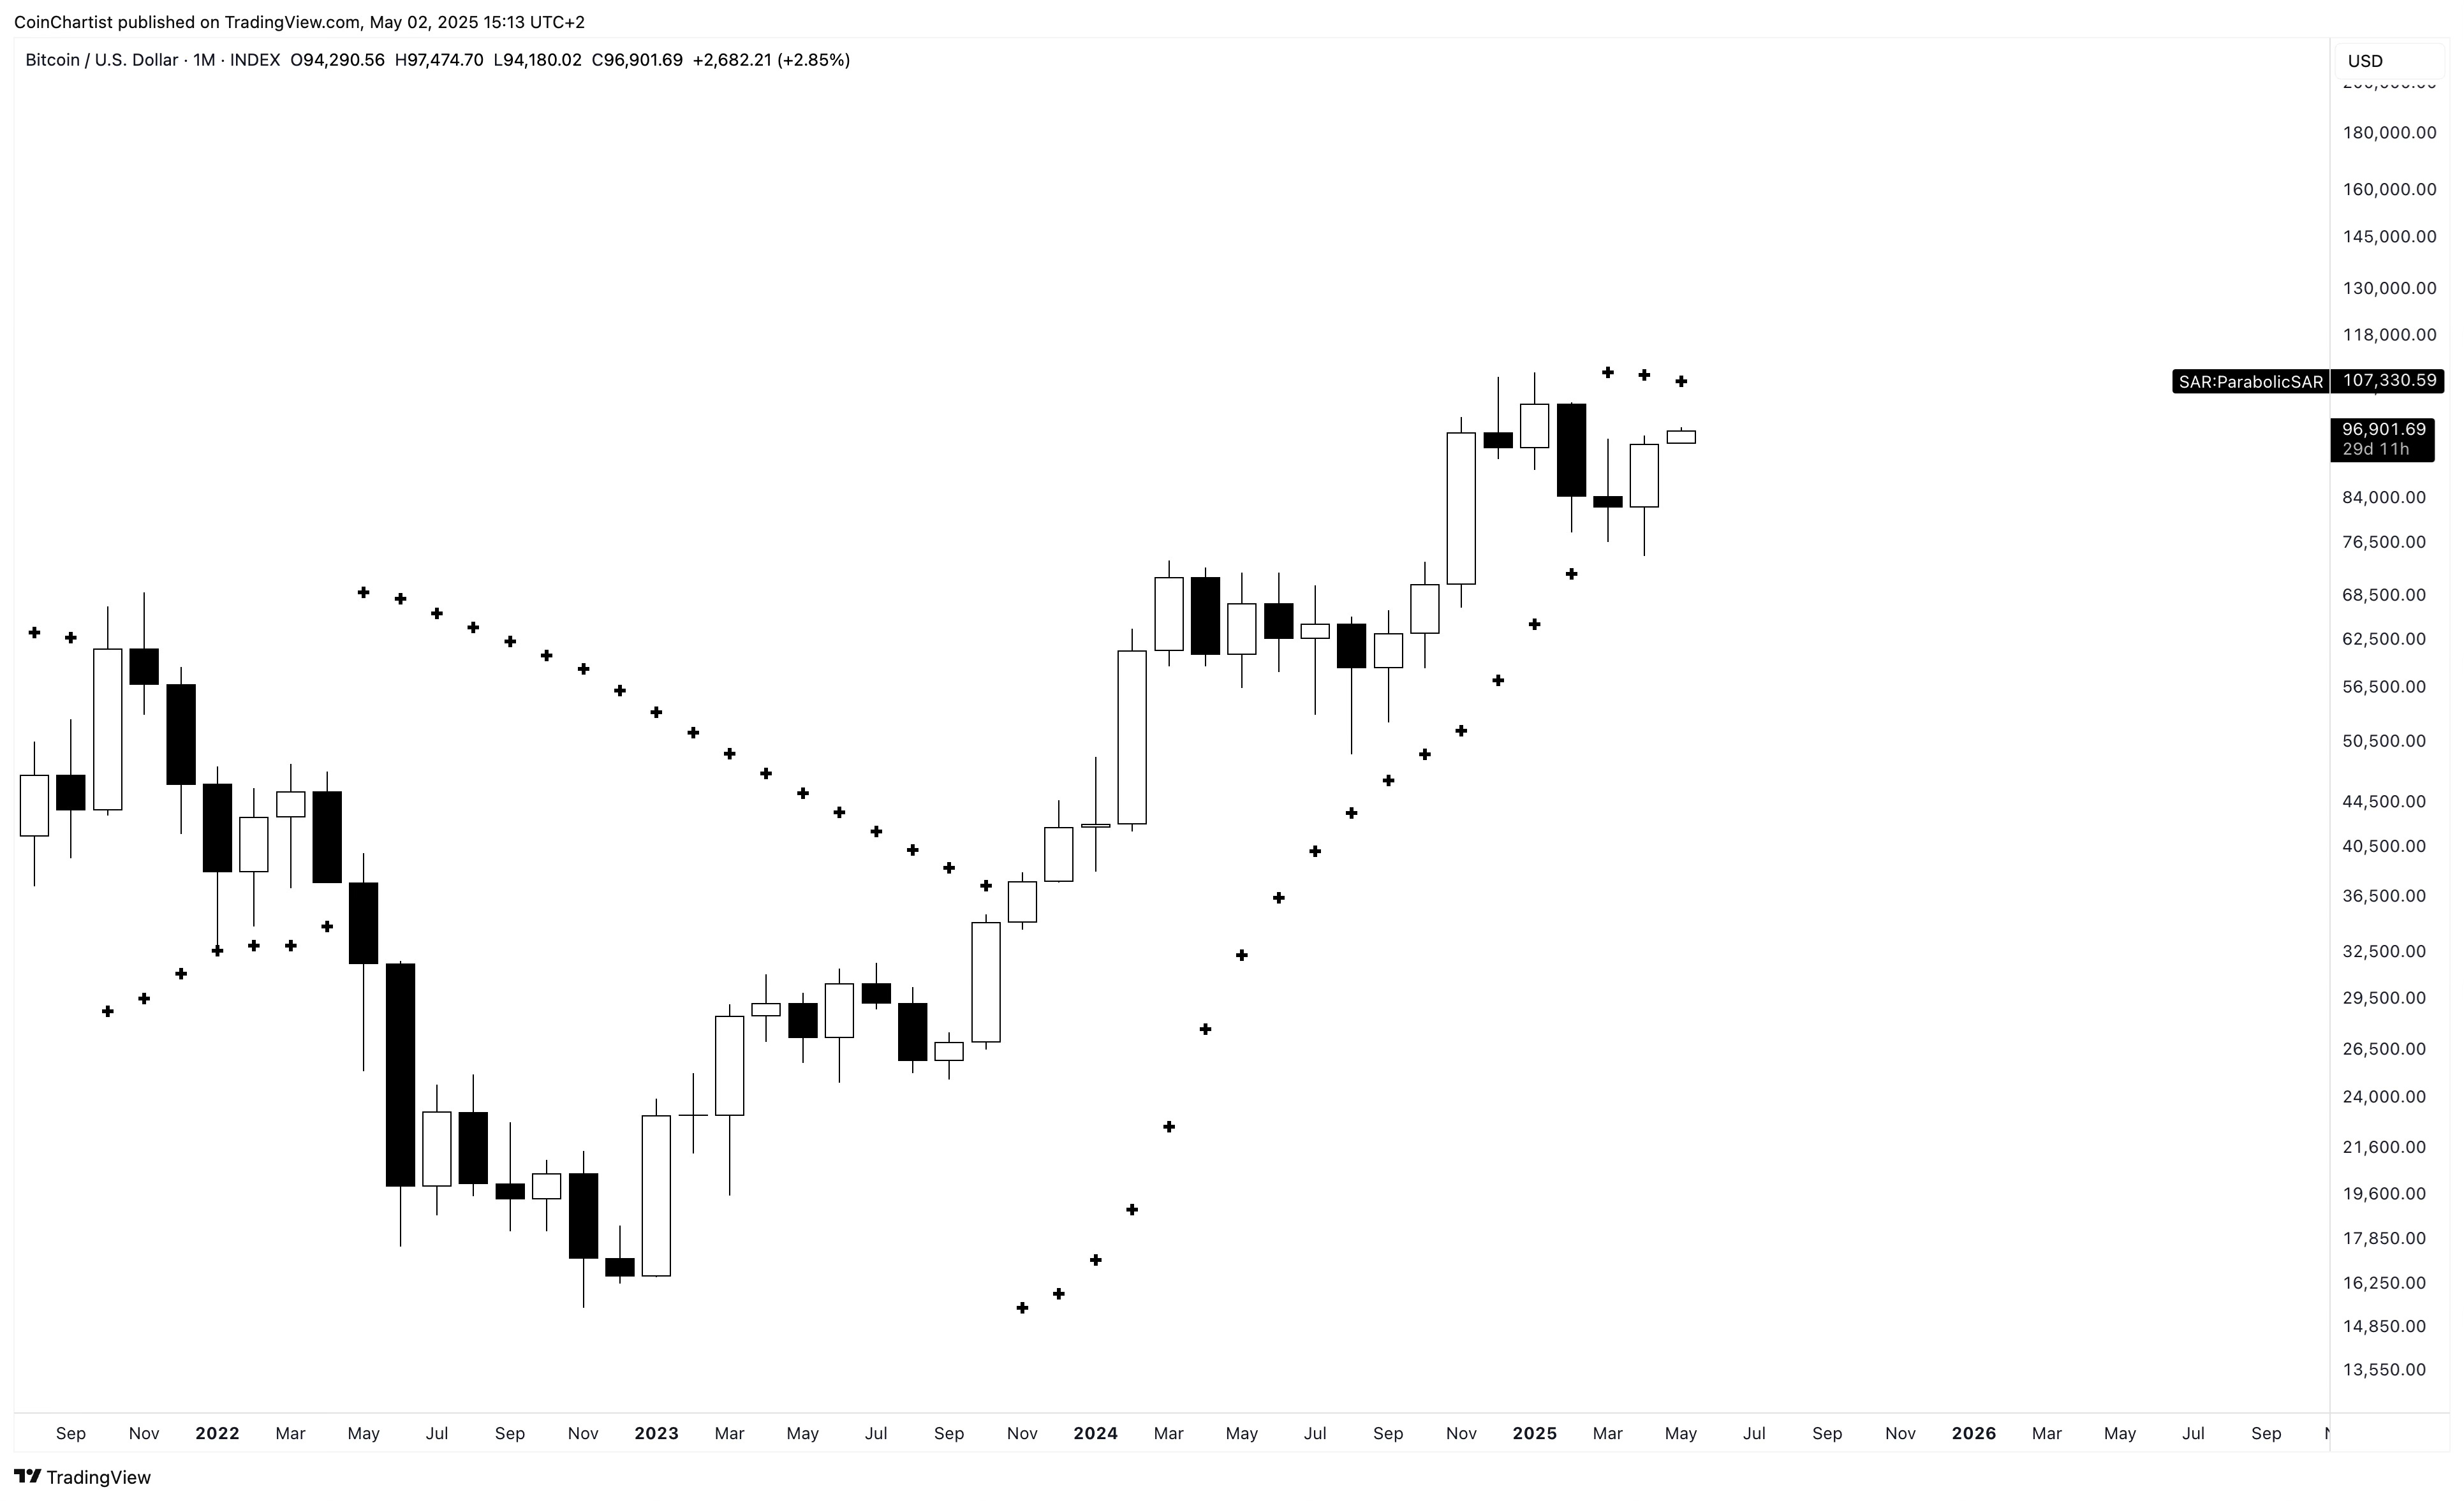
$107,330 is the first level that must be tagged before I would consider changing my stance. This would hit the monthly Parabolic SAR, which flipped bearish with February’s Bearish Engulfing candlestick. This is one of a handful of signal that turned me bearish in the first place. The combination of the timing with the Bearish Engulfing added more credence to the bearish signals I was seeing.
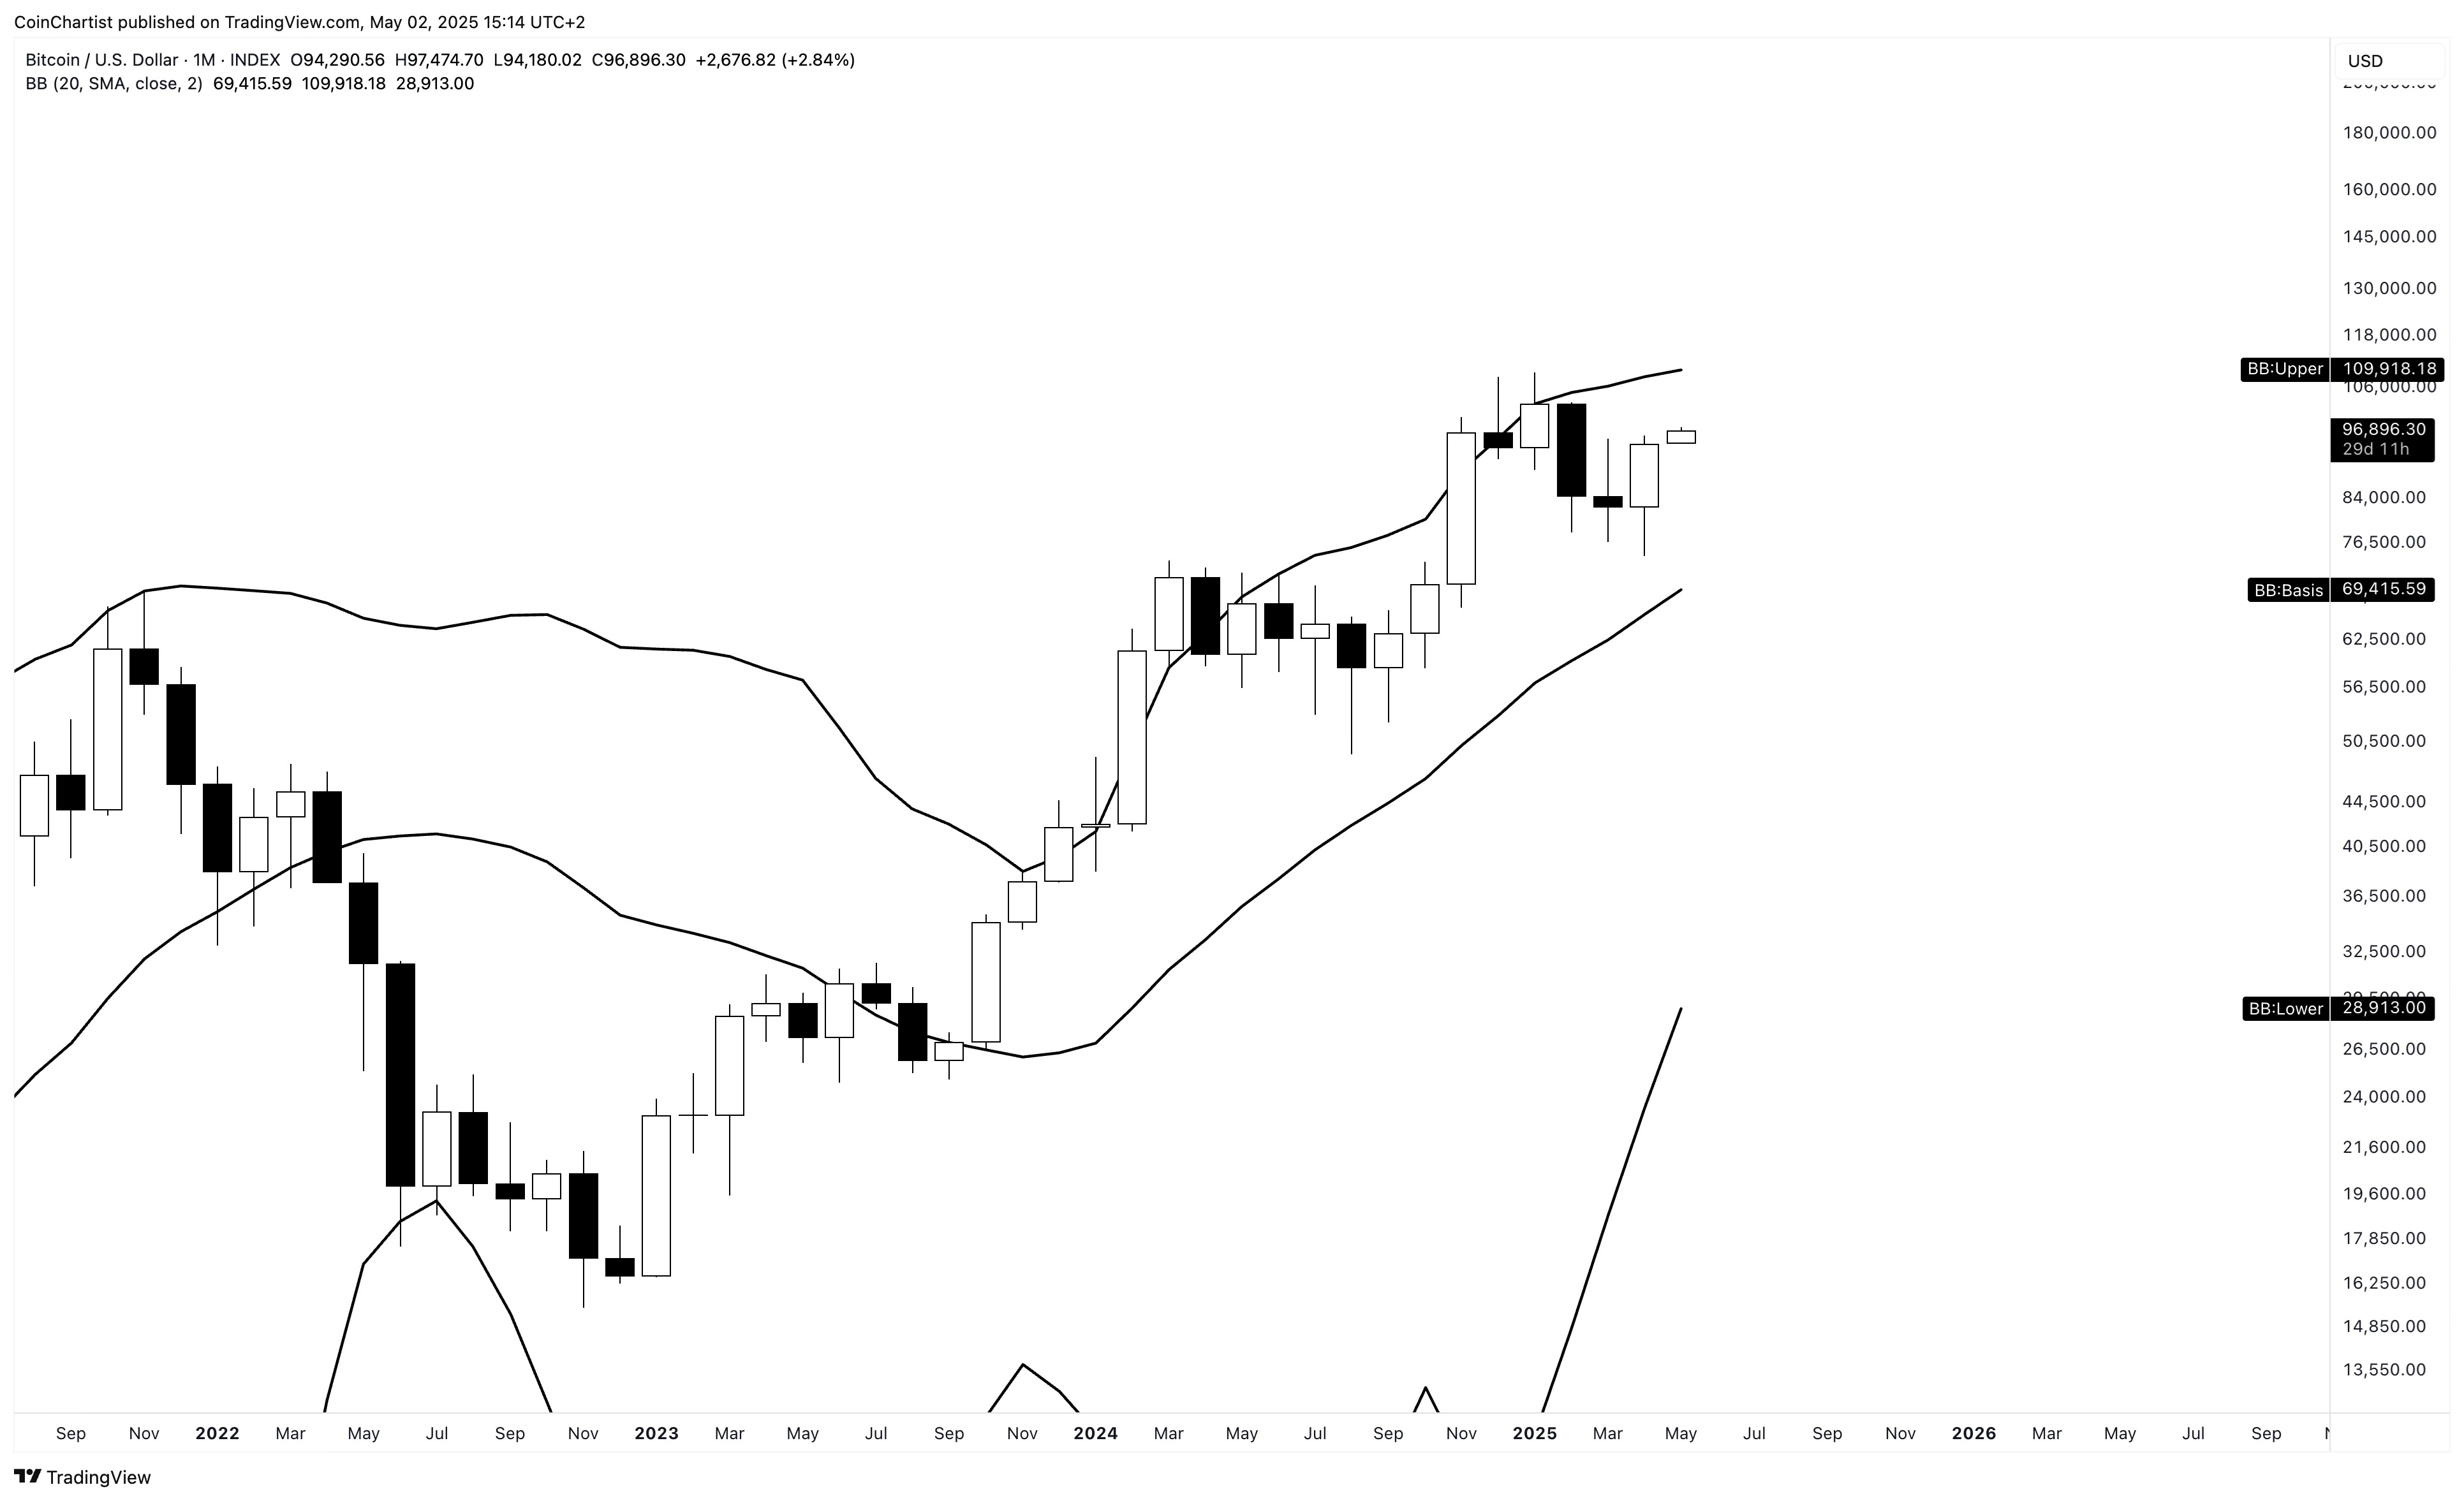
Above $109,912 would generate a buy signal on the monthly Bollinger Bands, which are the tightest ever while considering a Bitcoin peak. They expand and contract with volatility, so this is showing the lowest late-cycle volatility ever. Closing back above the upper Band would be a confirmatory signal that the bull trend is resuming, especially if it happens on breakout volume. Notice that the second 2021 peak did not close above the upper Bollinger Band. This is another reason I have selected this level specifically as one that must be triggered before I am no longer worried about a B-wave taking place.
Call it a Comeback
This is quite the comeback, even for someone who is bearish like myself. It takes a lot of patience and focus to avoid all the noise and naysayers, and instead focus on what the charts are telling you. But that’s what I have done, am doing, and will continue to do, no matter how much hate I get or how often I am told I am wrong. Only I am responsible for my own success. The below signals aren’t price-based, but certainly would add to the invalidation levels outlined above and help to confirm the bull run is back on. Or, if these signals stay bearish and don’t confirm, it could be more clear we have a B-wave or wave 3 of a deeper correction that is nowhere near done.
Keep reading with a 7-day free trial
Subscribe to CoinChartist to keep reading this post and get 7 days of free access to the full post archives.