

Issue #13 | A Surprisingly Sideways Summer
Sideways Bitcoin, altcoins recovering, and a stock market pullback. Plus a special guest appearance from Crypto Bull God and a lesson on log and linear scale.

Welcome to issue #13 of CoinChartist (VIP). This week’s drop includes:
The brutal reality regarding Bitcoin price action
Tech stocks are pulling back, is the bull trend over?
A guest appearance from Crypto Bull God
Updated wave counts in BTC, BTC.D, and the stock market
Altcoins (LINK, UNI, XLM, etc): signs of sell pressure diminishing
A lesson on using logarithmic scale and the LMACD in BTCUSD
Disclaimer: The information provided in this Substack newsletter is for general informational purposes only and should not be considered as financial advice. Investing involves risk, and past performance is not indicative of future results. Please conduct your own research or consult a qualified financial advisor before making any investment decisions. The newsletter disclaims any liability for losses or damages arising from the use of this information.
At the moment, we are experiencing what most would consider the “max pain scenario". Sideways. In a market as exciting and as volatile as cryptocurrencies, sideways hurts the most. Neither bulls nor bears are validated, very little money is made, and in fact, much is lost in the chop as traders attempt to get positioned for whatever direction is ultimately chosen.
It is often when both sides give up that the move finally arrives. Despite the uncertainty about direction, one thing is certain. After a prolonged period of sideways always comes a decision, direction, and an extended trend.
Those glued to price charts the last several months have been left sorely disappointed with the outcome: we’ve gone nowhere fast. Until the moment volatility breaks, it is best to be patient, and trade the direction of the breakout versus trying to get into position now.
You can also follow CoinChartist on YouTube and Twitter. Don’t forget to also like and comment to let us know how we’re doing.

Like the headline of this issue says, Bitcoin has moved surprisingly sideways for most of this summer. A mid-June move revived bulls, but they’ve ultimately failed to push significantly beyond highs set in April of the year.

A lengthy period of consolidation, followed by a truncated move higher, reminds me of August and September 2020, right before Bitcoin rallied from $10,000 to $60,000. Price action is also beginning to look eerily similar. Sentiment, momentum, and wave counts all stack up similarly, as we’ll review further throughout this issue.
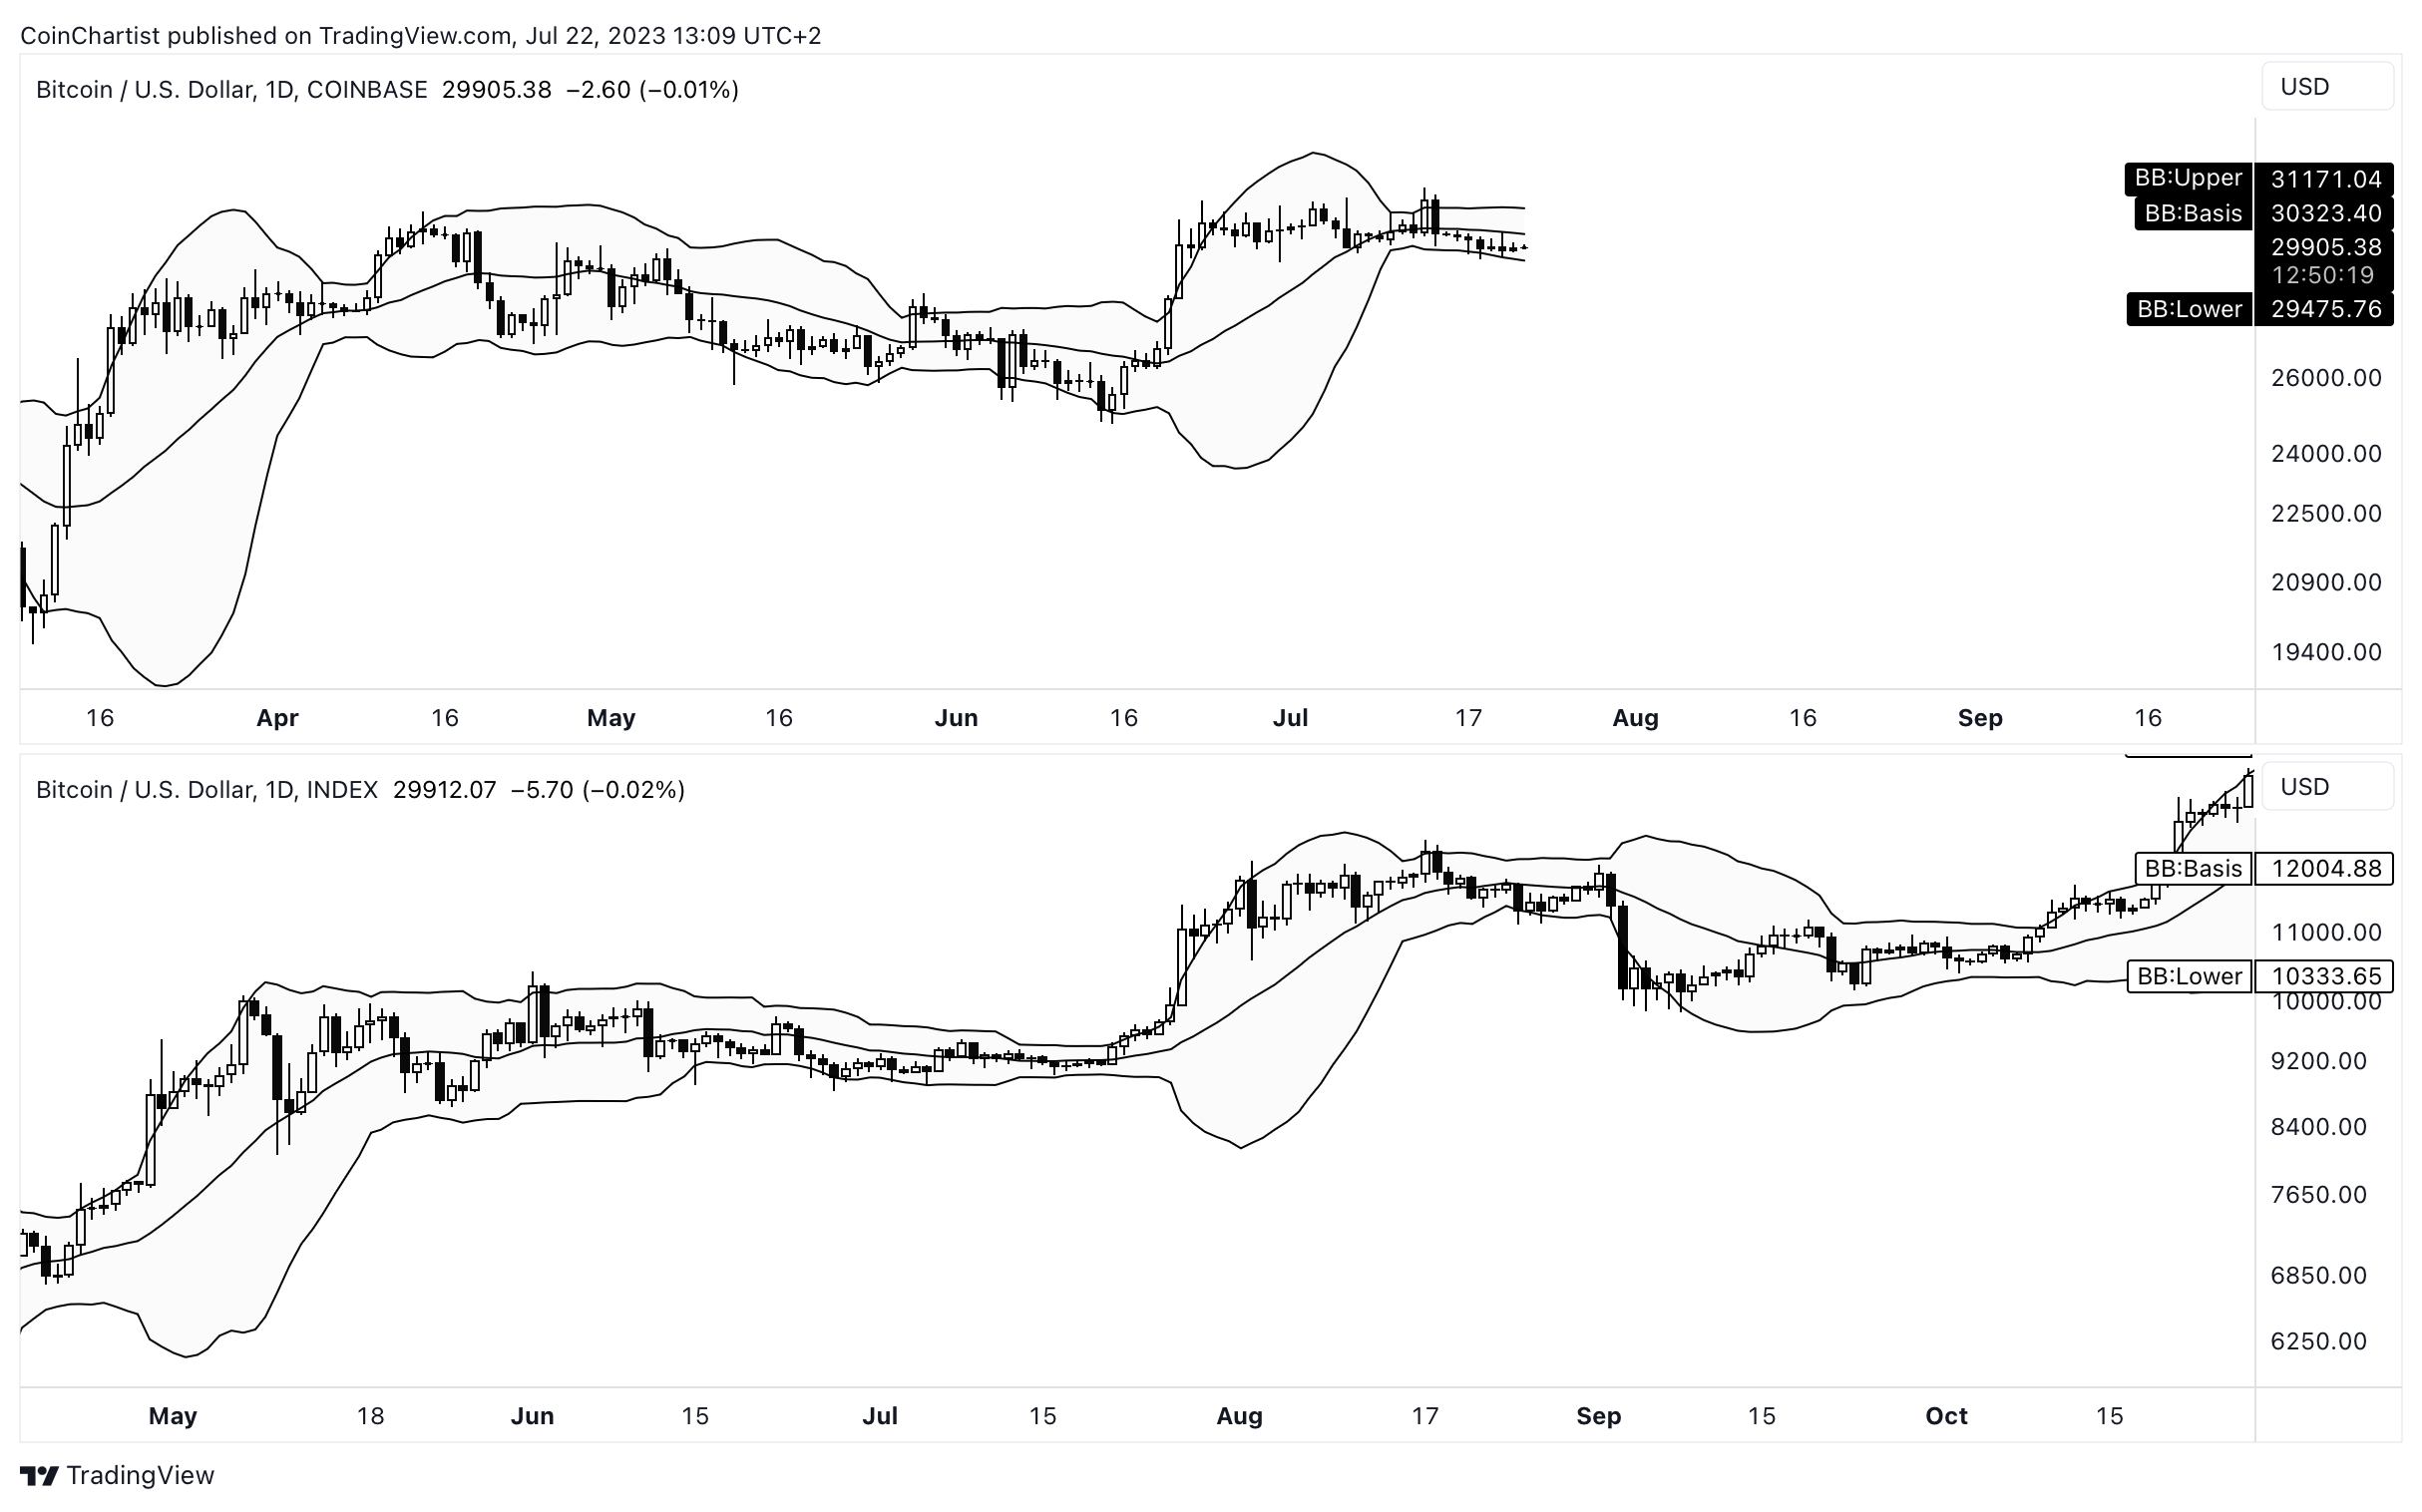
For example, the Bollinger Bands show that volatility is matching almost perfectly in the above comparison. If BTCUSD follows a similar trajectory, this period of painful sideways will end with a move lower, before ultimately rallying higher. Tightening of the Bollinger Bands represents a low volatility phase. When this phase ends, however, volatility expands. Simply put, this sideways state cannot go on forever.
Learn more about the Bollinger Bands here.
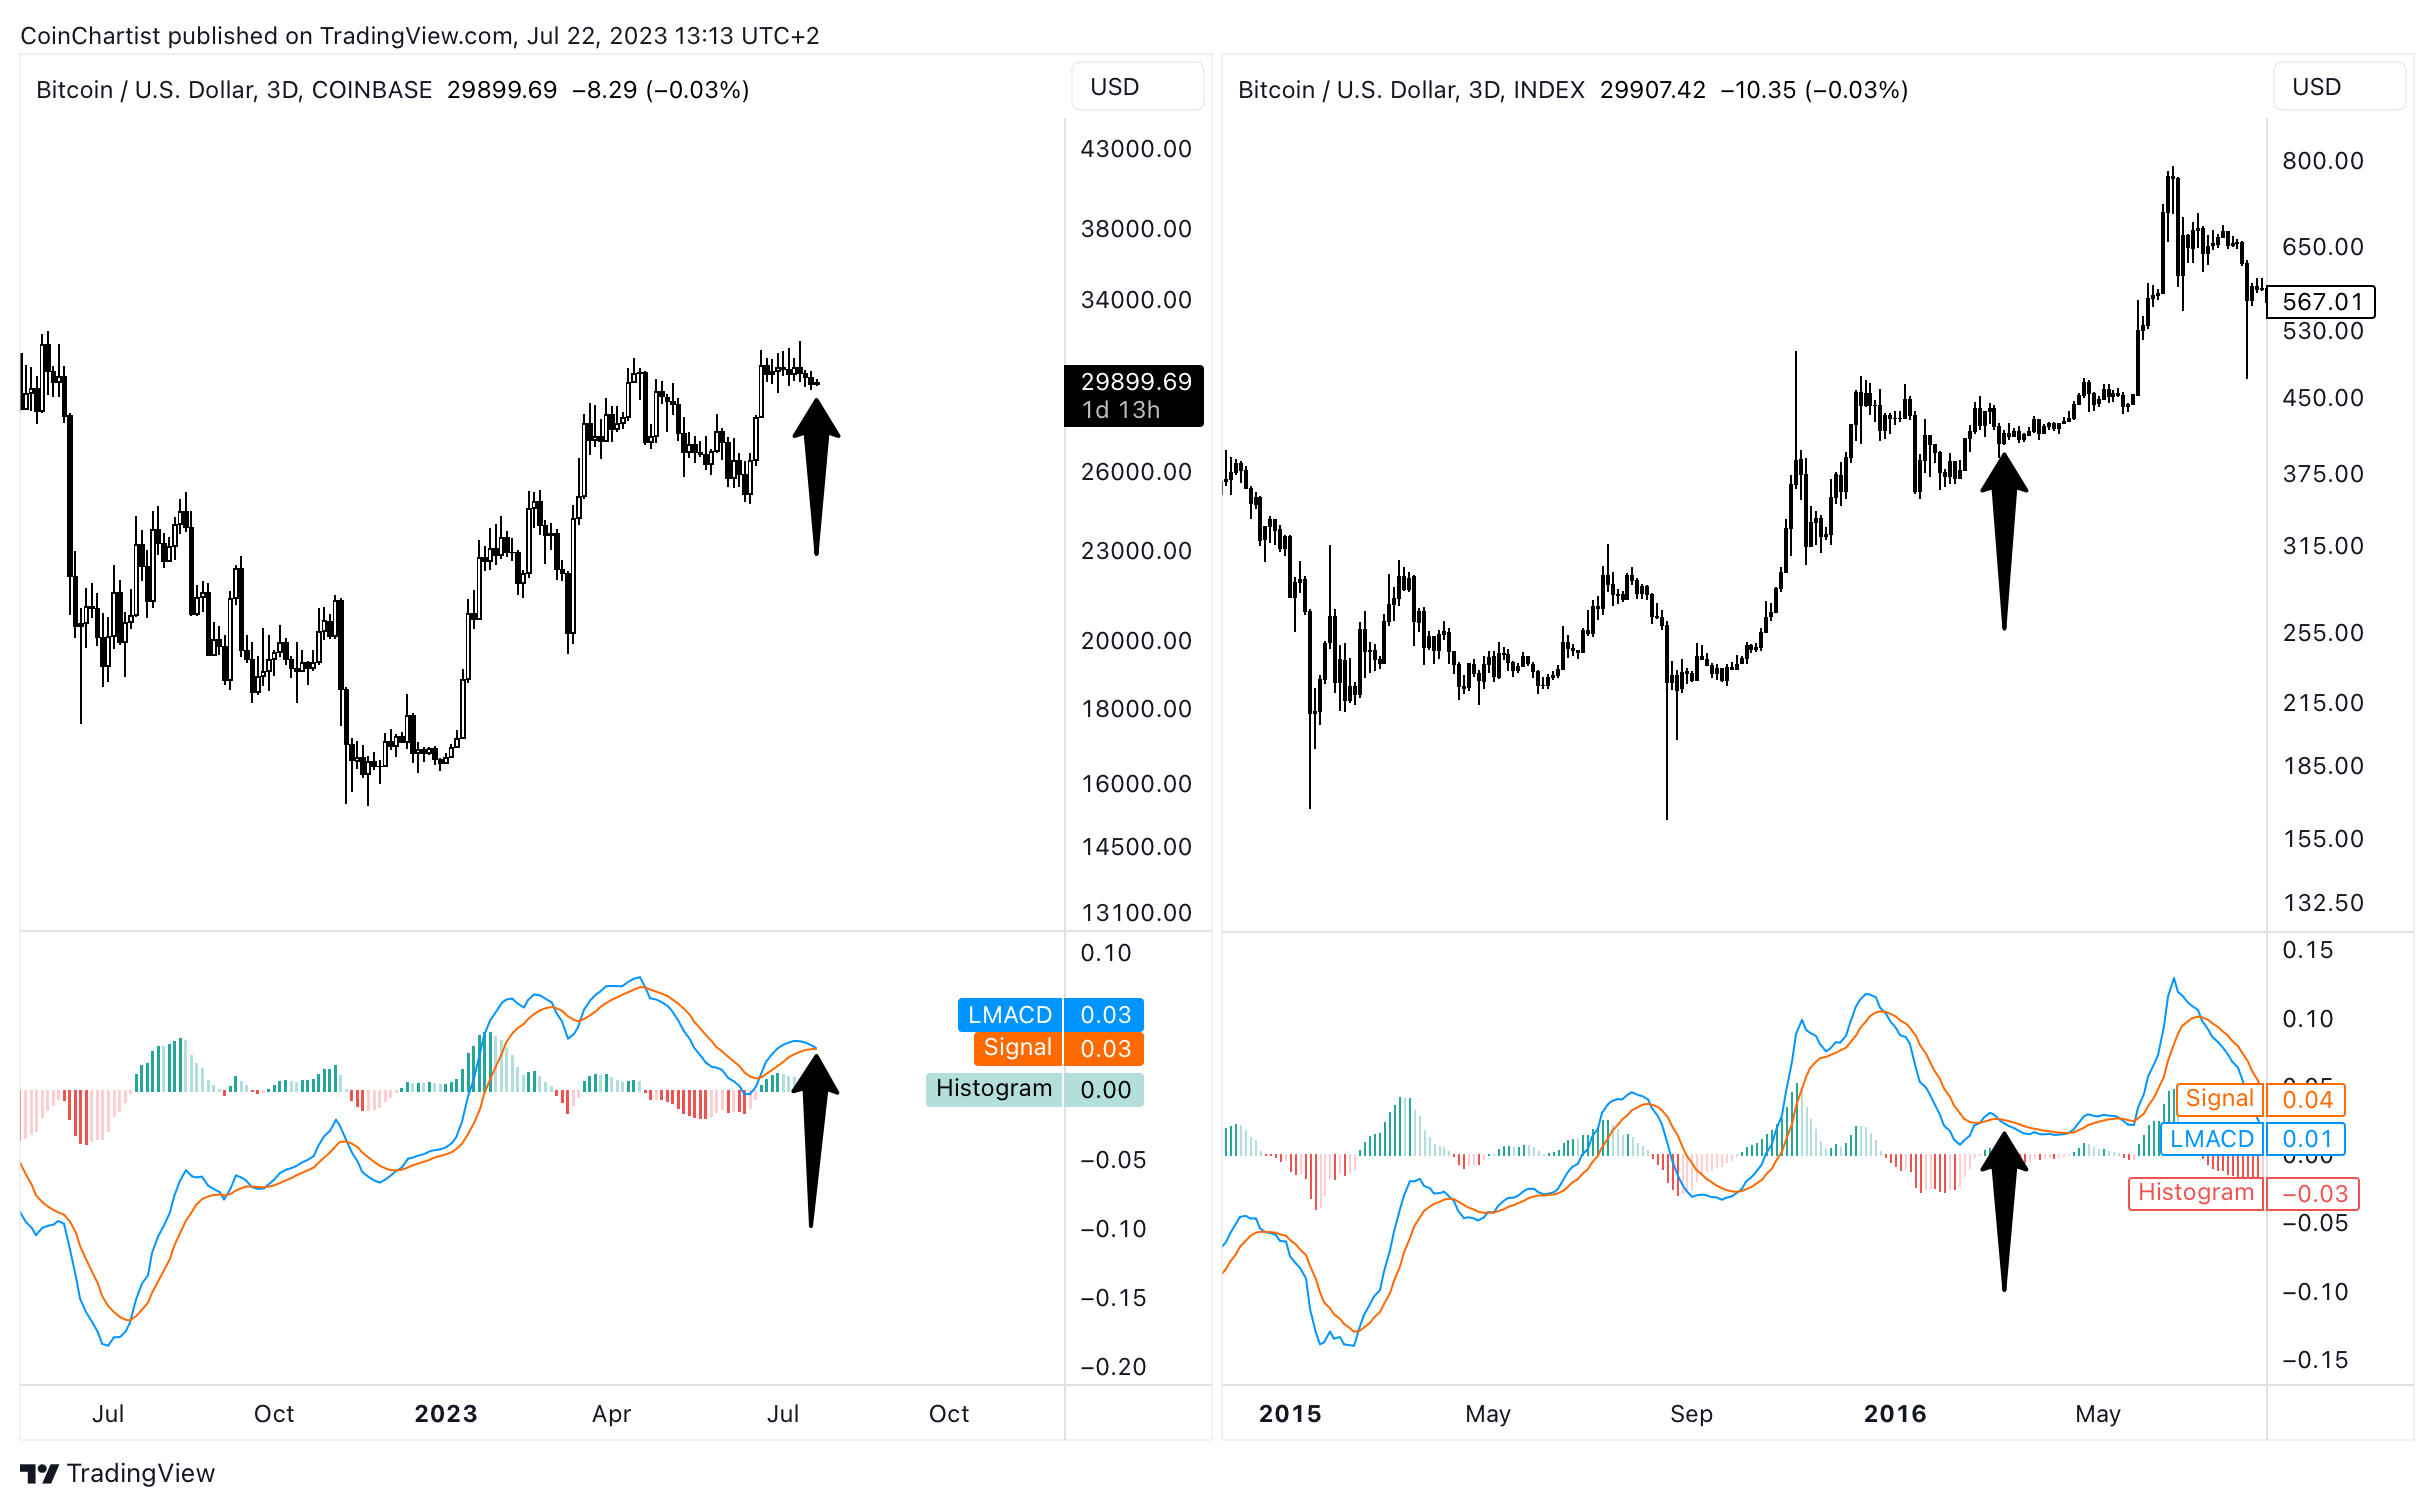
Unfortunately, sideways can go on for a lot longer than we want it to, if a comparison with the 2015 and 2016 market bottom is more accurate than the 2020 setup. Recently, BTCUSD 3-day charts closed with ten small-bodied candles in a row. This sort of low volatility price action is ultra rare for any cryptocurrency. The only other instance I could find such indecision on the same timeframe, was in 2016. Take note of the LMACD and how momentum moves extremely similarly then and now.
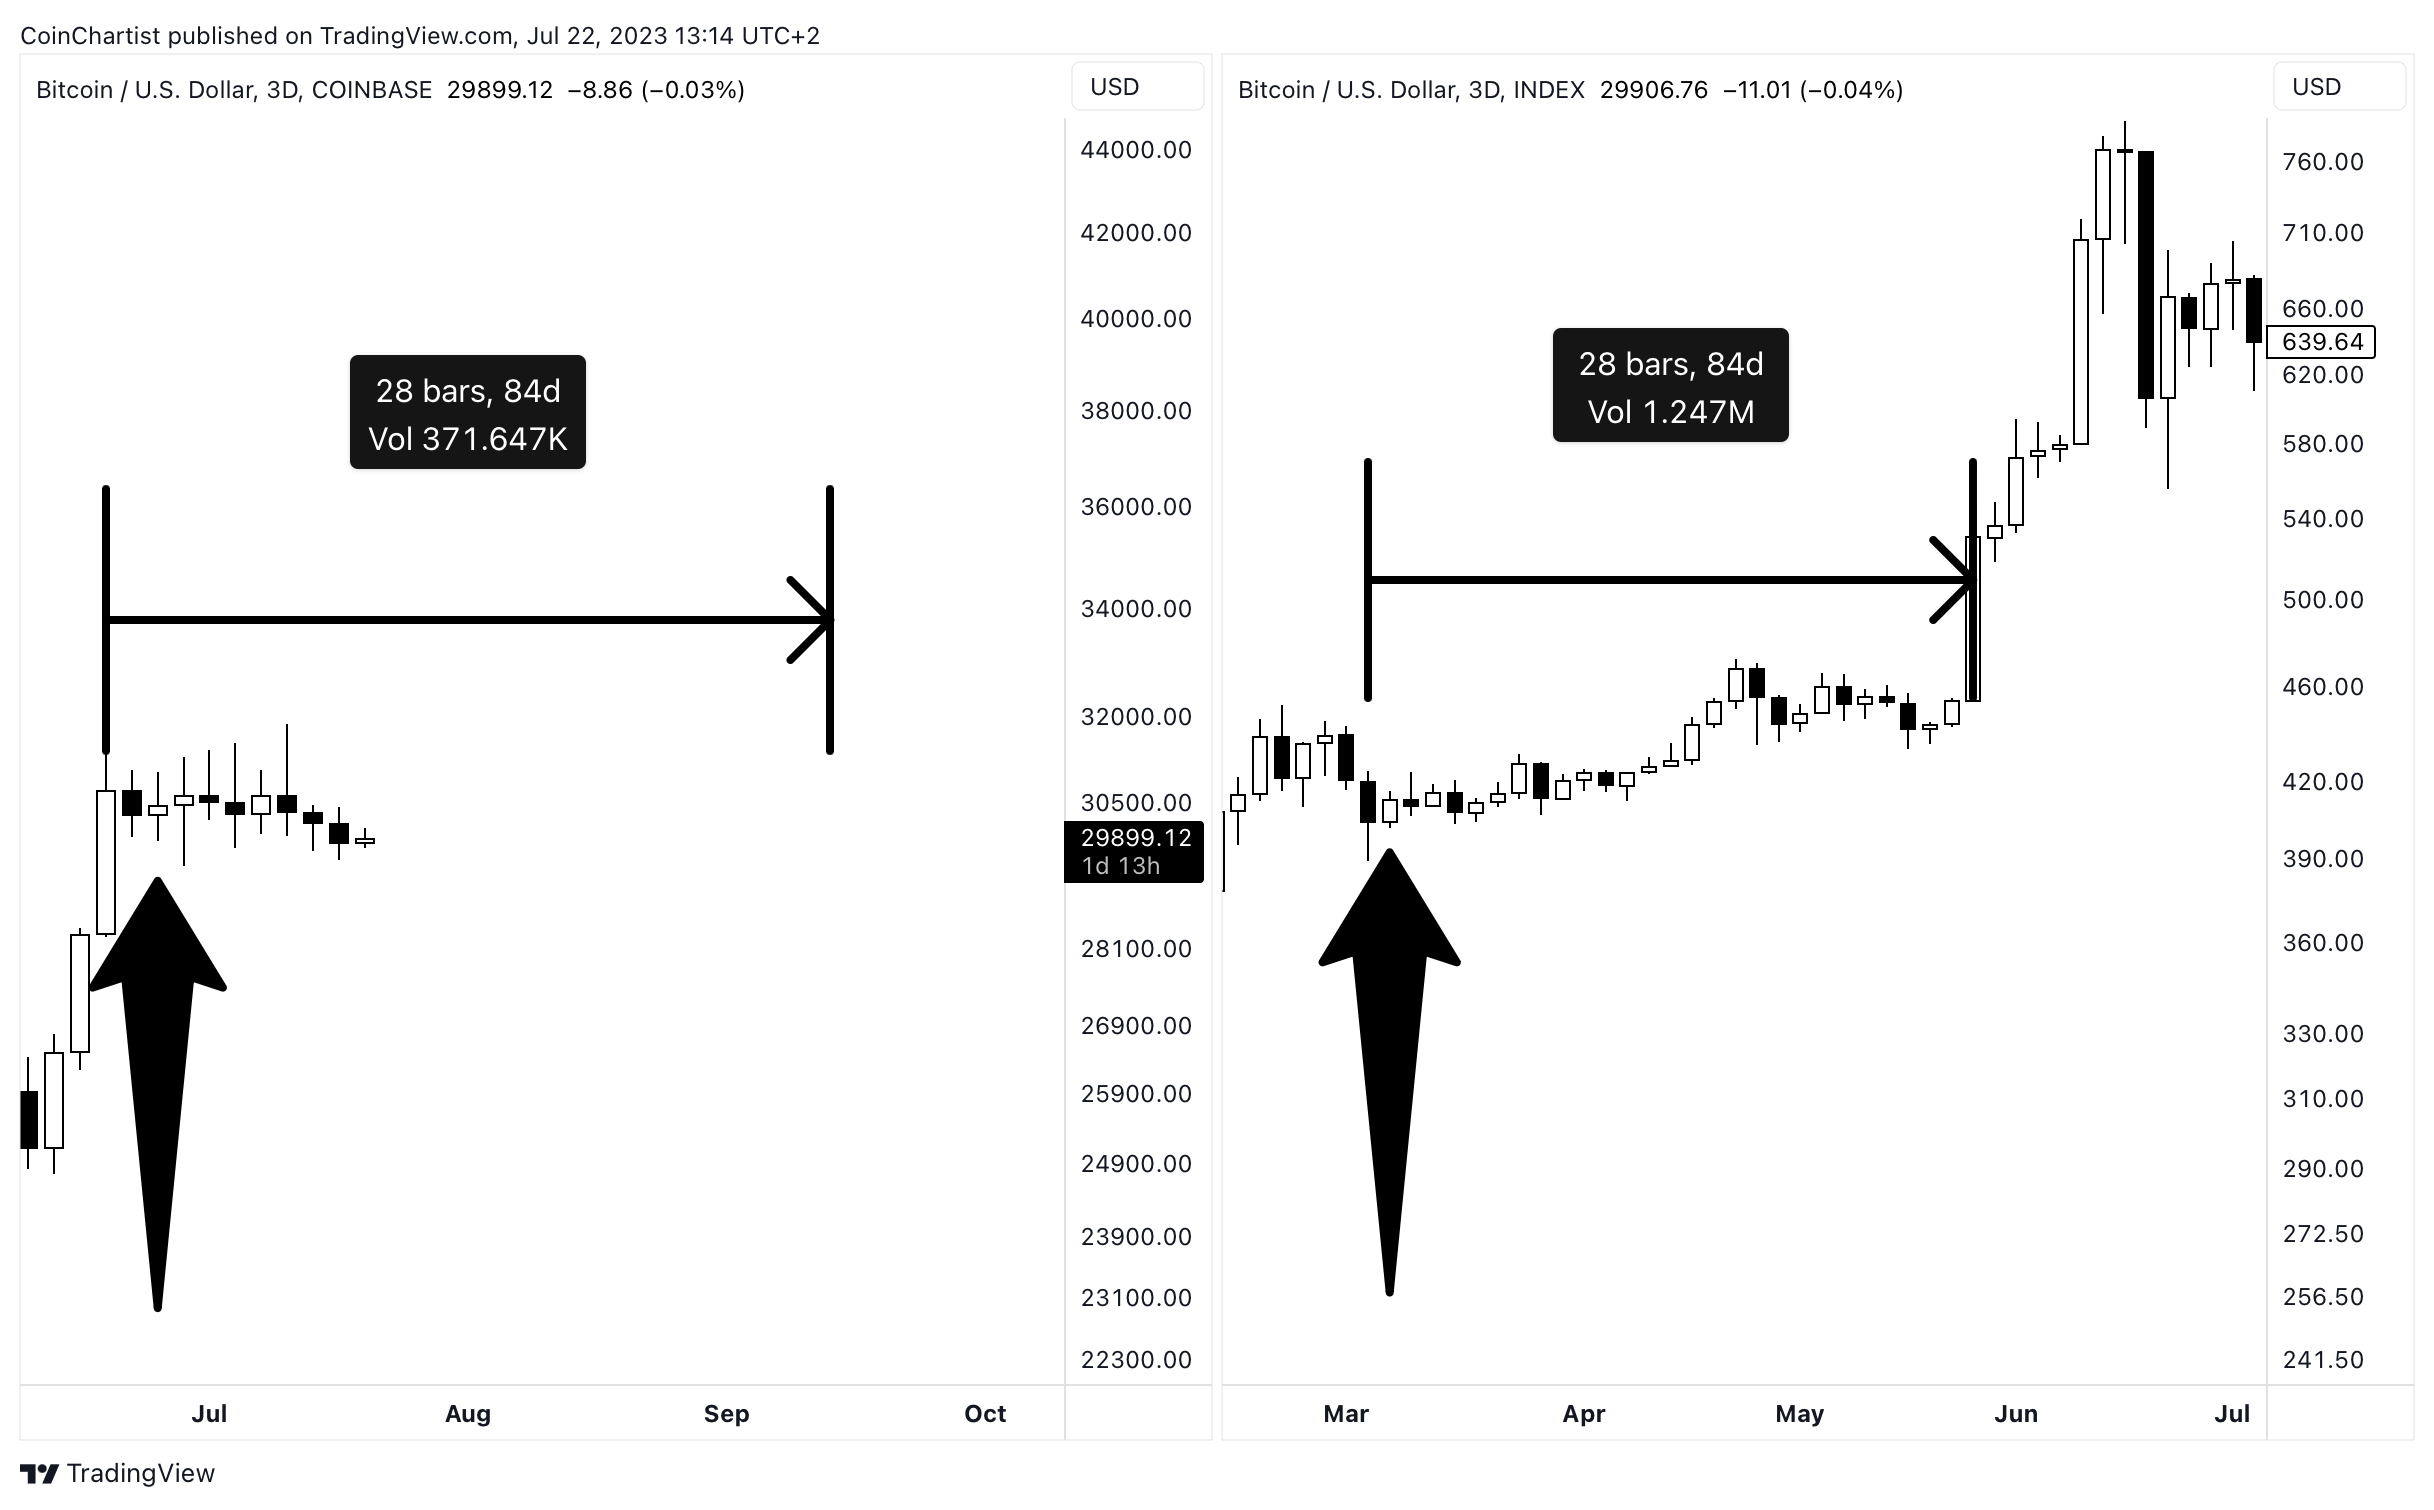
A closer look at the candlesticks alone, and we can see that it’s quite possible for BTCUSD to trend sideways for several months longer before making its move. If and when the breakout ultimately happens, the price analog would take Bitcoin to over $42,000 in a flash. Personally, I think there is too much interest in Bitcoin on an institutional level for price action to end up this drawn out. But it warrants considering changing your mindset for further patience.

One important ingredient continues to go missing that is required for a full bore Bitcoin bull run, and that is weekly Relative Strength Index reaching overbought conditions. In all previous impulses, BTCUSD reached this zone and remained there for weeks at a time. In 2017, BTCUSD kept pushing back into the overbought level leading to several impulsive extensions.

This behavior could soon appear, according to the Williams Percent Range (%R). Take note in particular of the technical indicator reaching a similar extreme during phases of lengthy sideways consolidation. This could suggest that Bitcoins is closer to the brink of a new bull run. It also suggests that the current setup less resembles 2019.
Learn more about the Williams %R here.
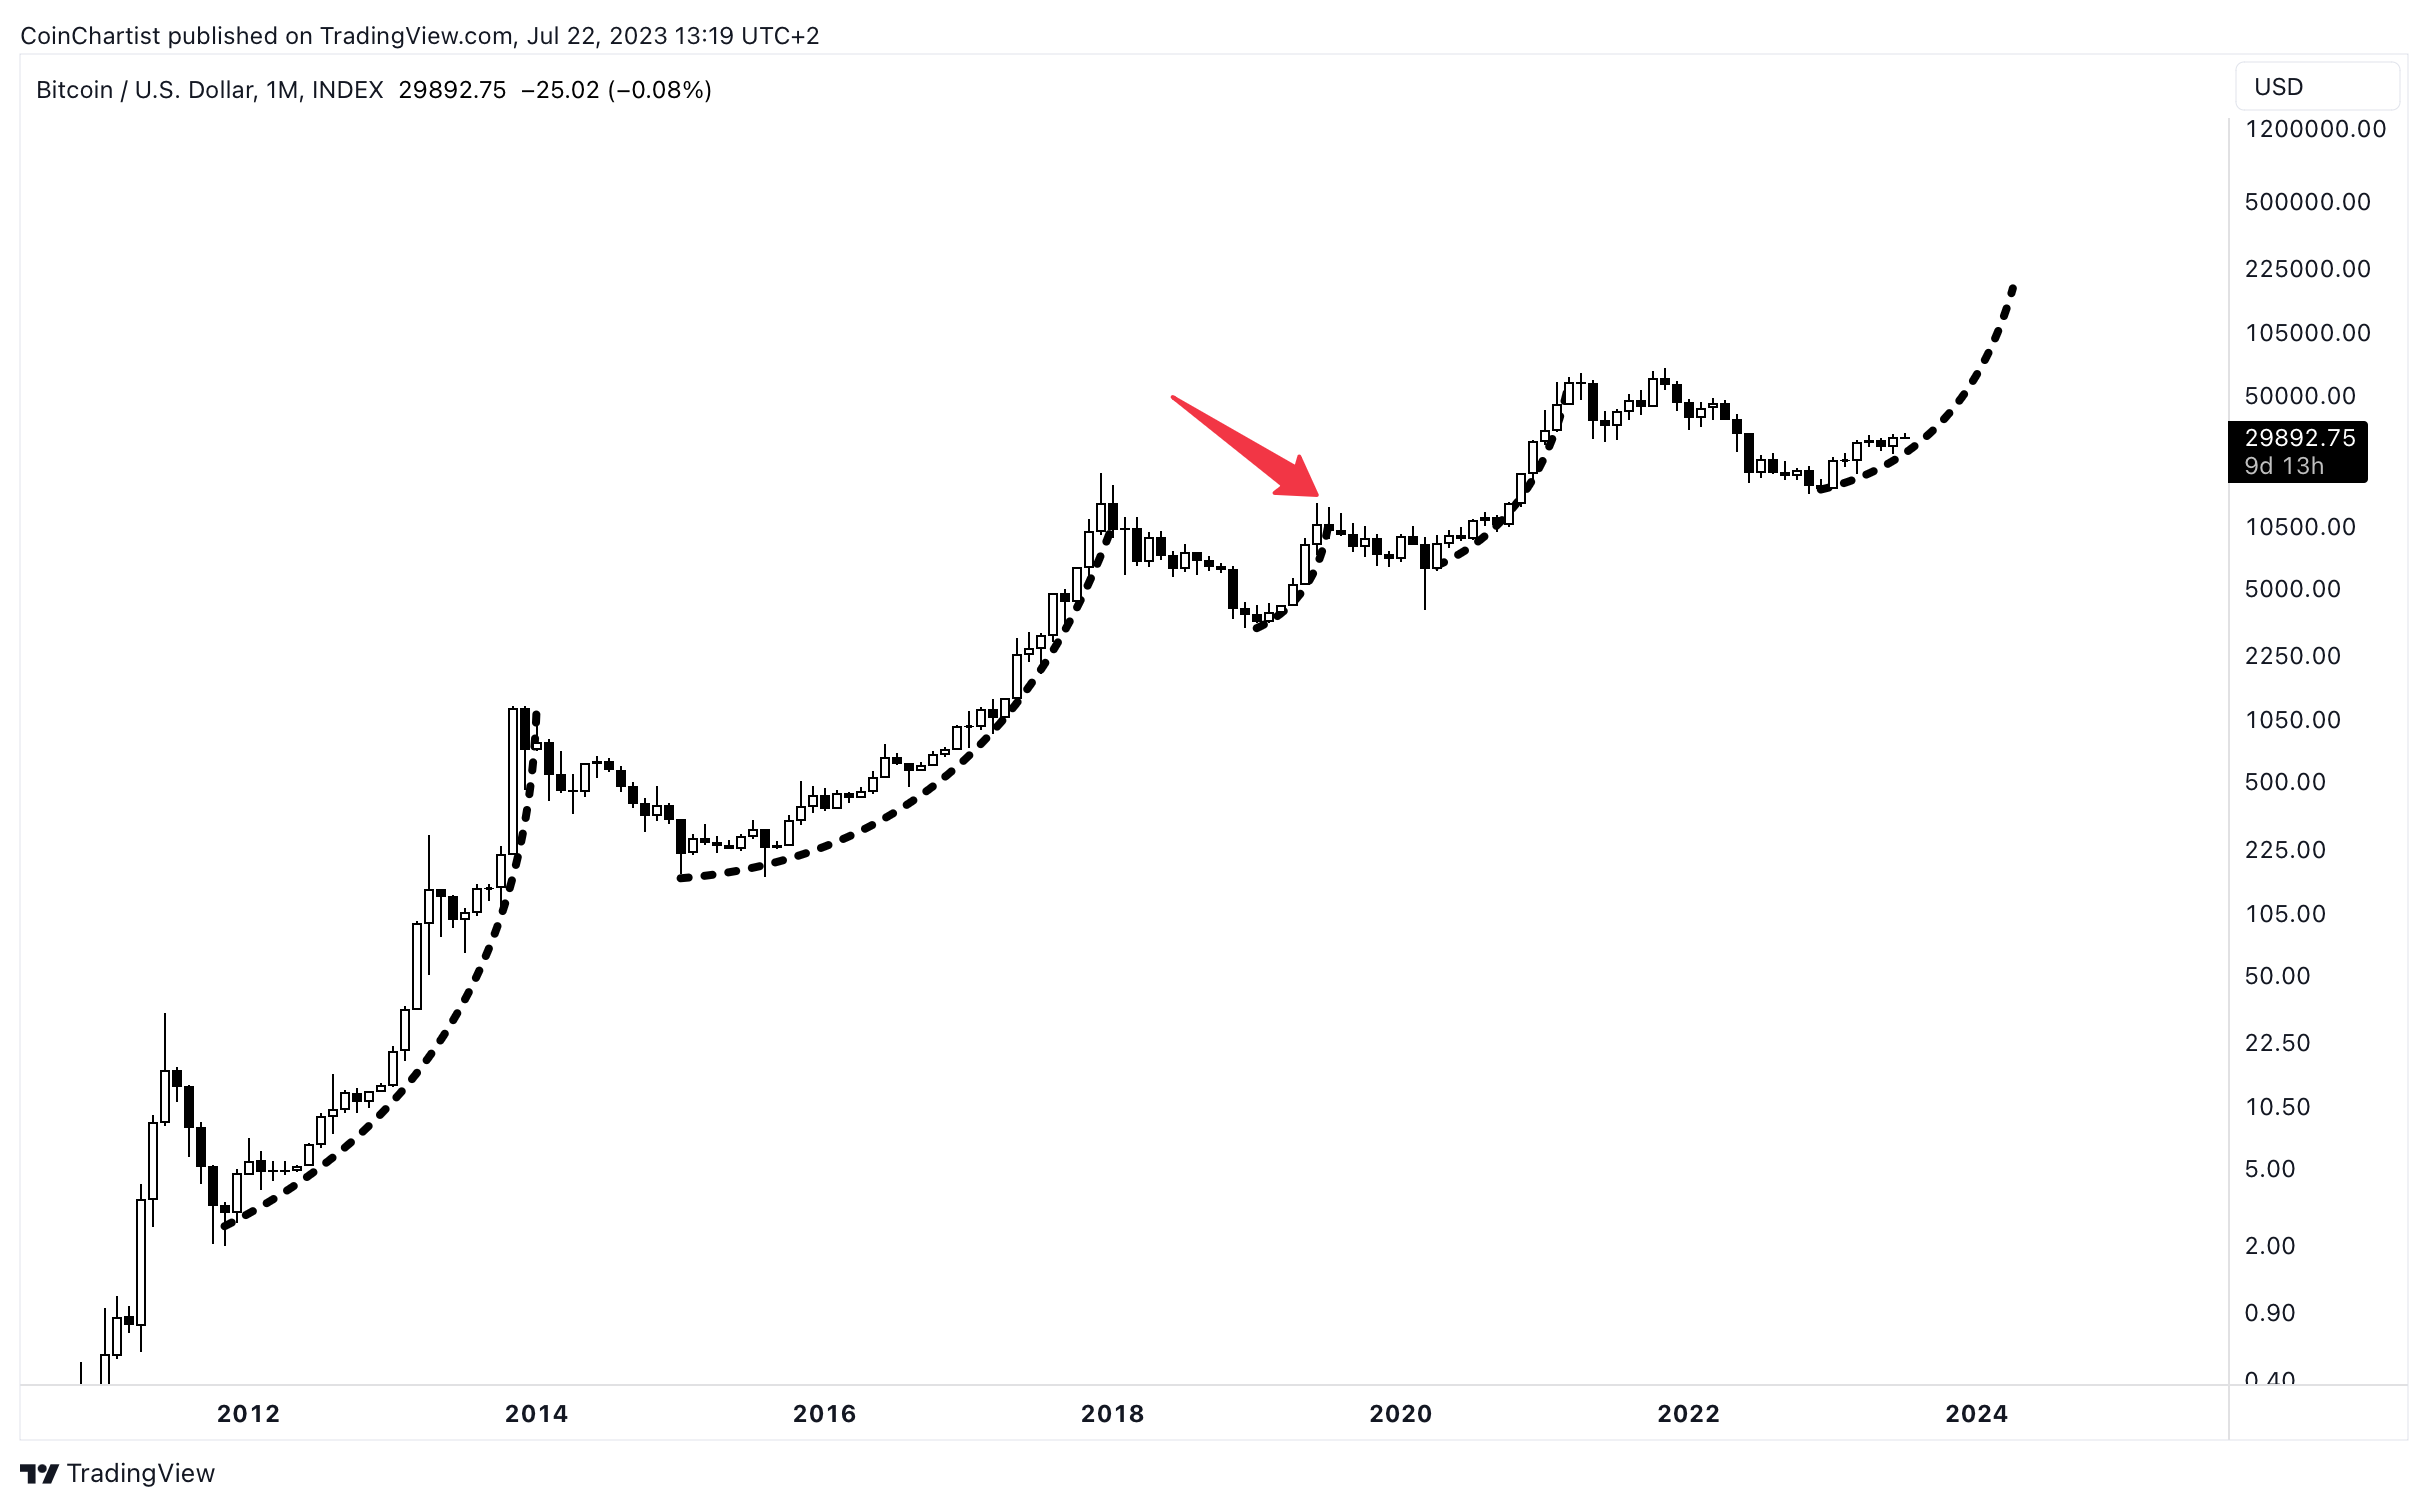
Oddly enough, the majority of people expect a situation like 2019 to repeat, when looking at Bitcoin price history as a whole, it is the one outlier. I was someone who bought Bitcoin at $3,200 in December 2018. I was Dollar Cost-Averaging in and terrified after the plunge from $6,000 to the bottom. I had expected a lengthy accumulation phase, yet was shocked when Bitcoin began to rally in 2019. It went from $3,200 to $13,800. This was a 335% gain less than 200 days from hitting the bottom. Today, Bitcoin is up around 90% after nearly 250 days. This is not the same, and expecting a repeat is foolish when 2019 is the outlier in the data. Since 2019 was the last rally from a bottom, recency bias has everyone expecting the same thing.

This week ended with the Dollar Currency Index (DXY) rebounding and the Nasdaq (NDX) giving back some recent upside. Importantly, a bearish signal is appearing just as the major US tech index approaches its all-time high record. Falling short of the target could be a blow to bulls and insinuate that the bear market might not have ended.

The NDX closed the weekly with a Shooting Star candle – a possible bearish Japanese candlestick reversal pattern. The pattern appears as a lower high is possible on the major US stock index, and right at a cluster of resistance from all-time highs.
Learn more about the Shooting Star here.
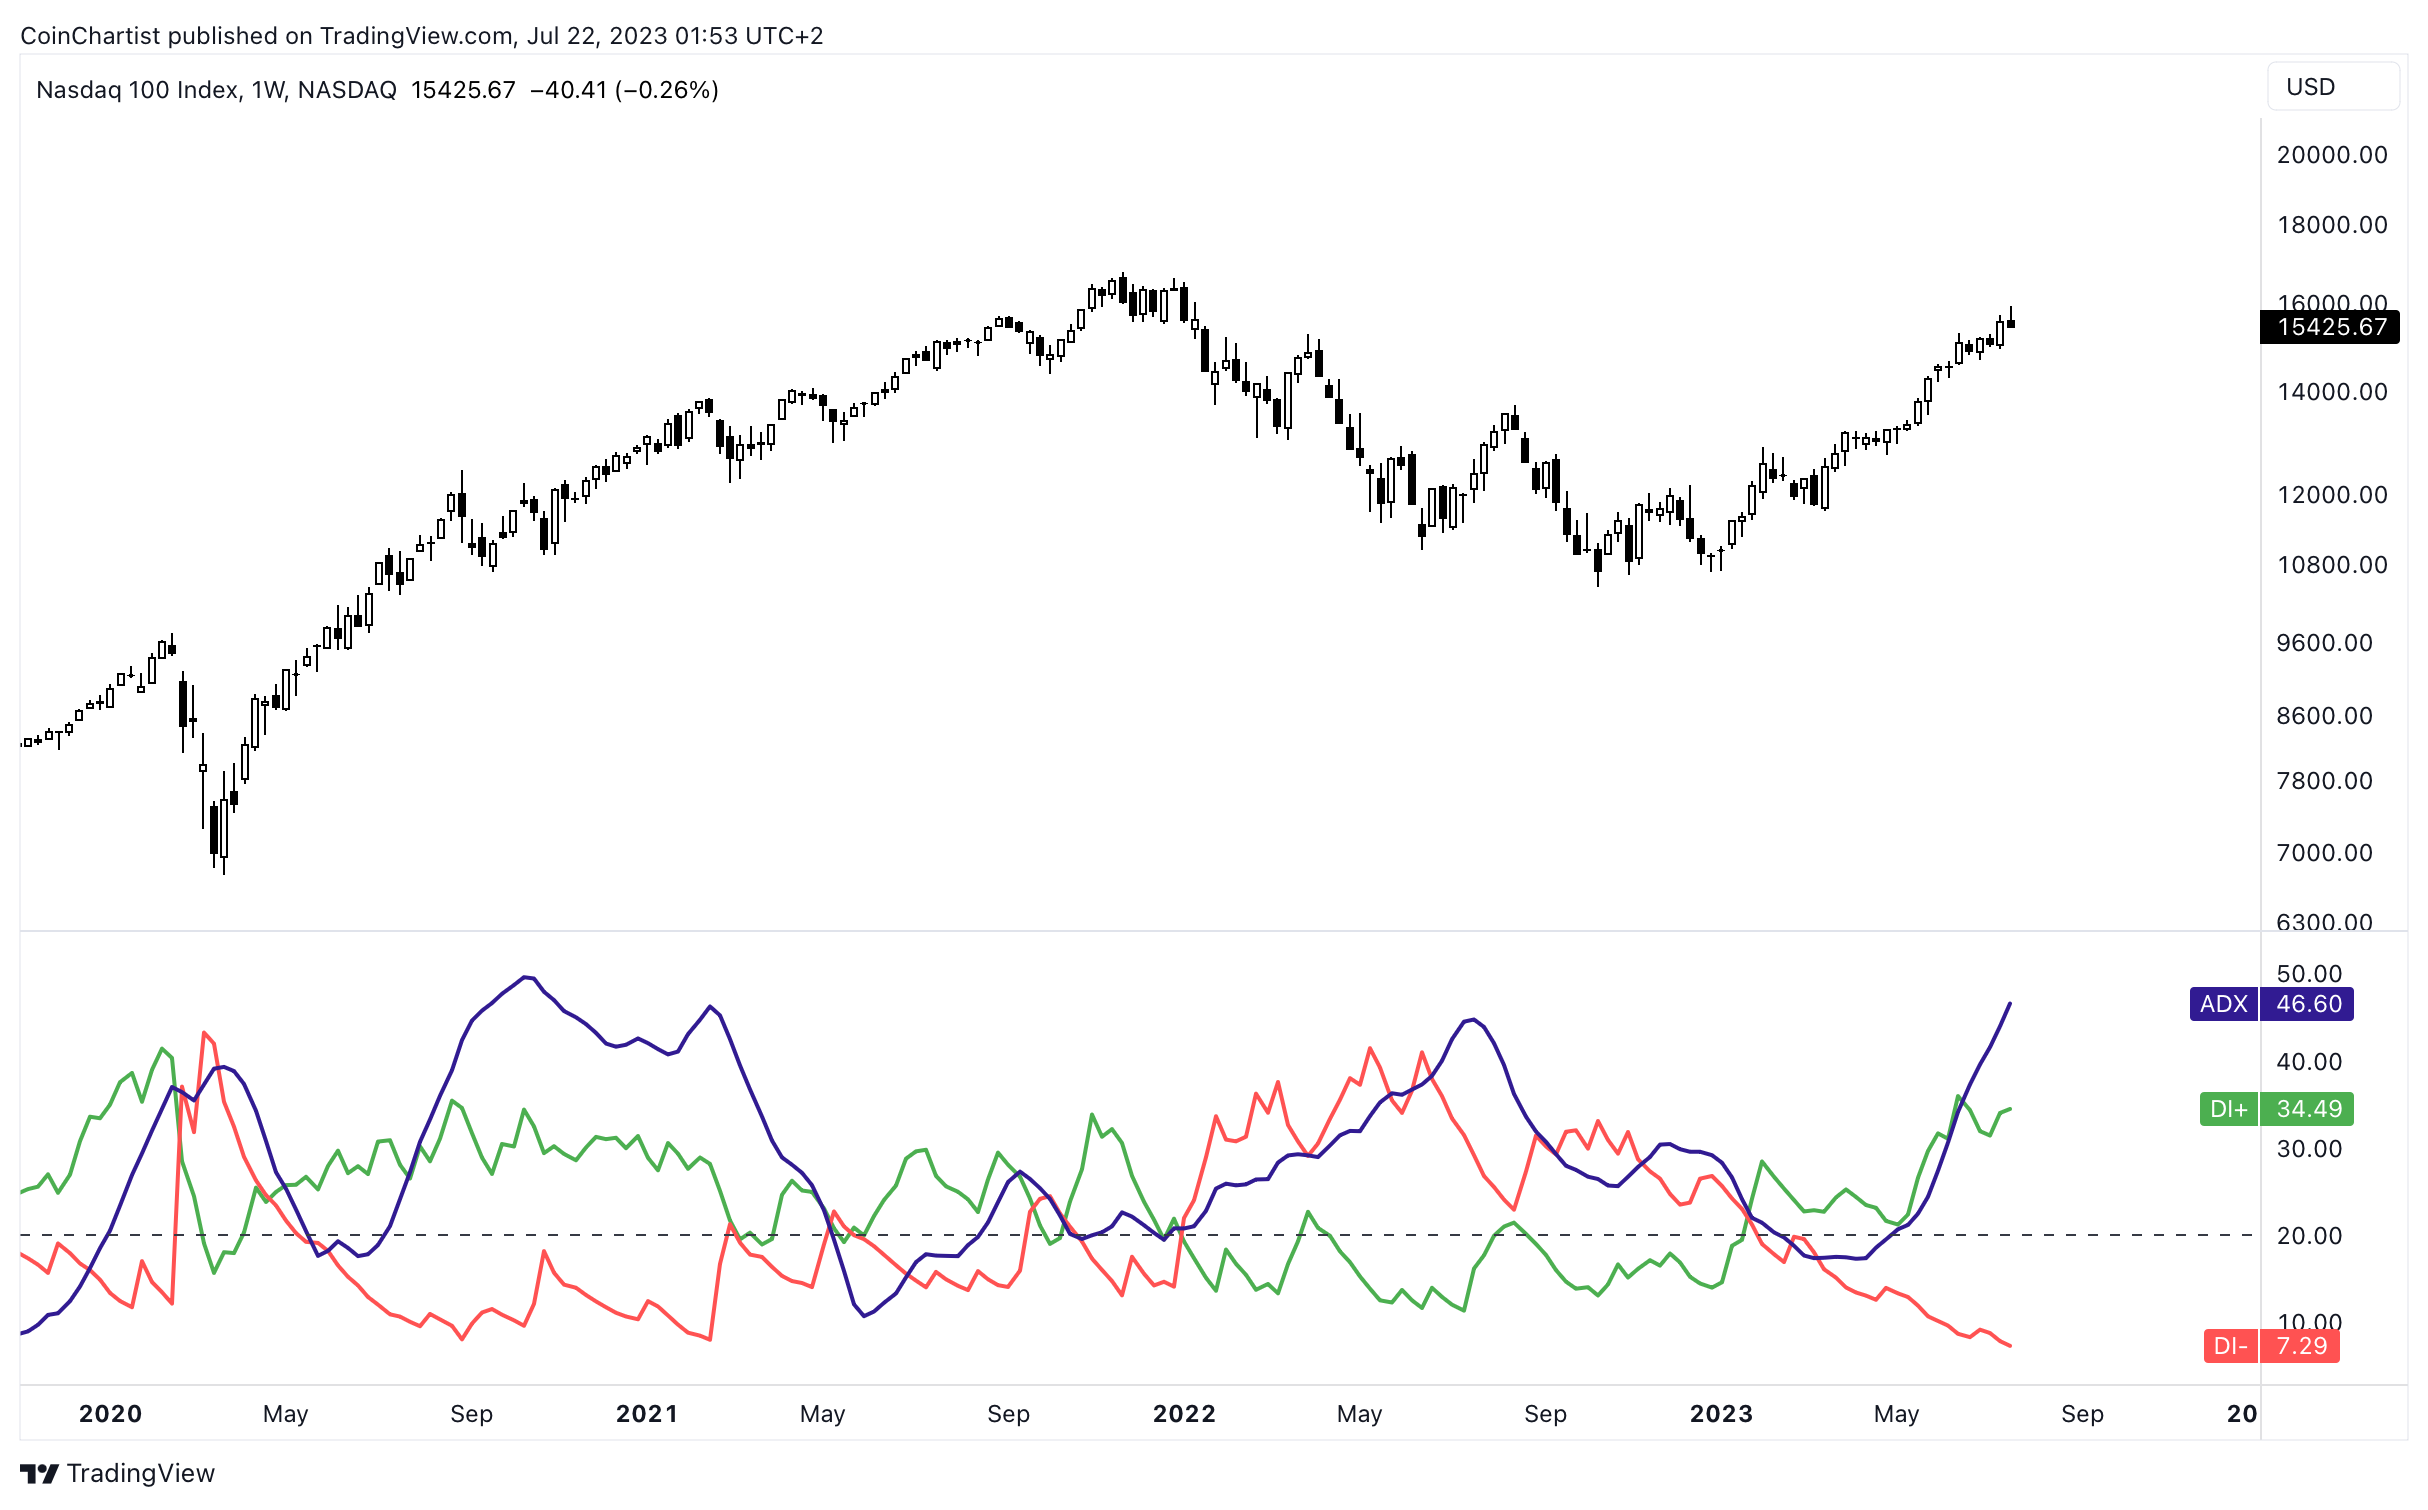
However, the Average Directional Index, which gauges the strength of a trend, is still pointed up and growing. The DI+ (green) is well above the DI- (red) which suggests bulls are in control of the trend. Take note of the last time the ADX was this high and crossed bullish. Even though the ADX began to fall and made a lower high, price kept rising for several months. Considering the performance of the ADX in the past, its somewhat reasonable to assume that the NDX uptrend won’t be ending just yet, despite a possible pullback type scenario.

This situation bodes rather well for Bitcoin, if the setup in the NDX is the same as August 2020. The Average Directional Index indicates the same trend strength as 2020 in the NDX and in Bitcoin. The vertical dotted line represents the then-and-now examples in BTCUSD from earlier in this newsletter. To put it more clearly, this NDX chart and comparison with Bitcoin further adds credence to the idea BTCUSD could see a short-term pullback before a mega-rally. After these technical levels were reached in 2020, Bitcoin then outperformed the NDX by a large margin.
Learn more about the Average Directional Index here.
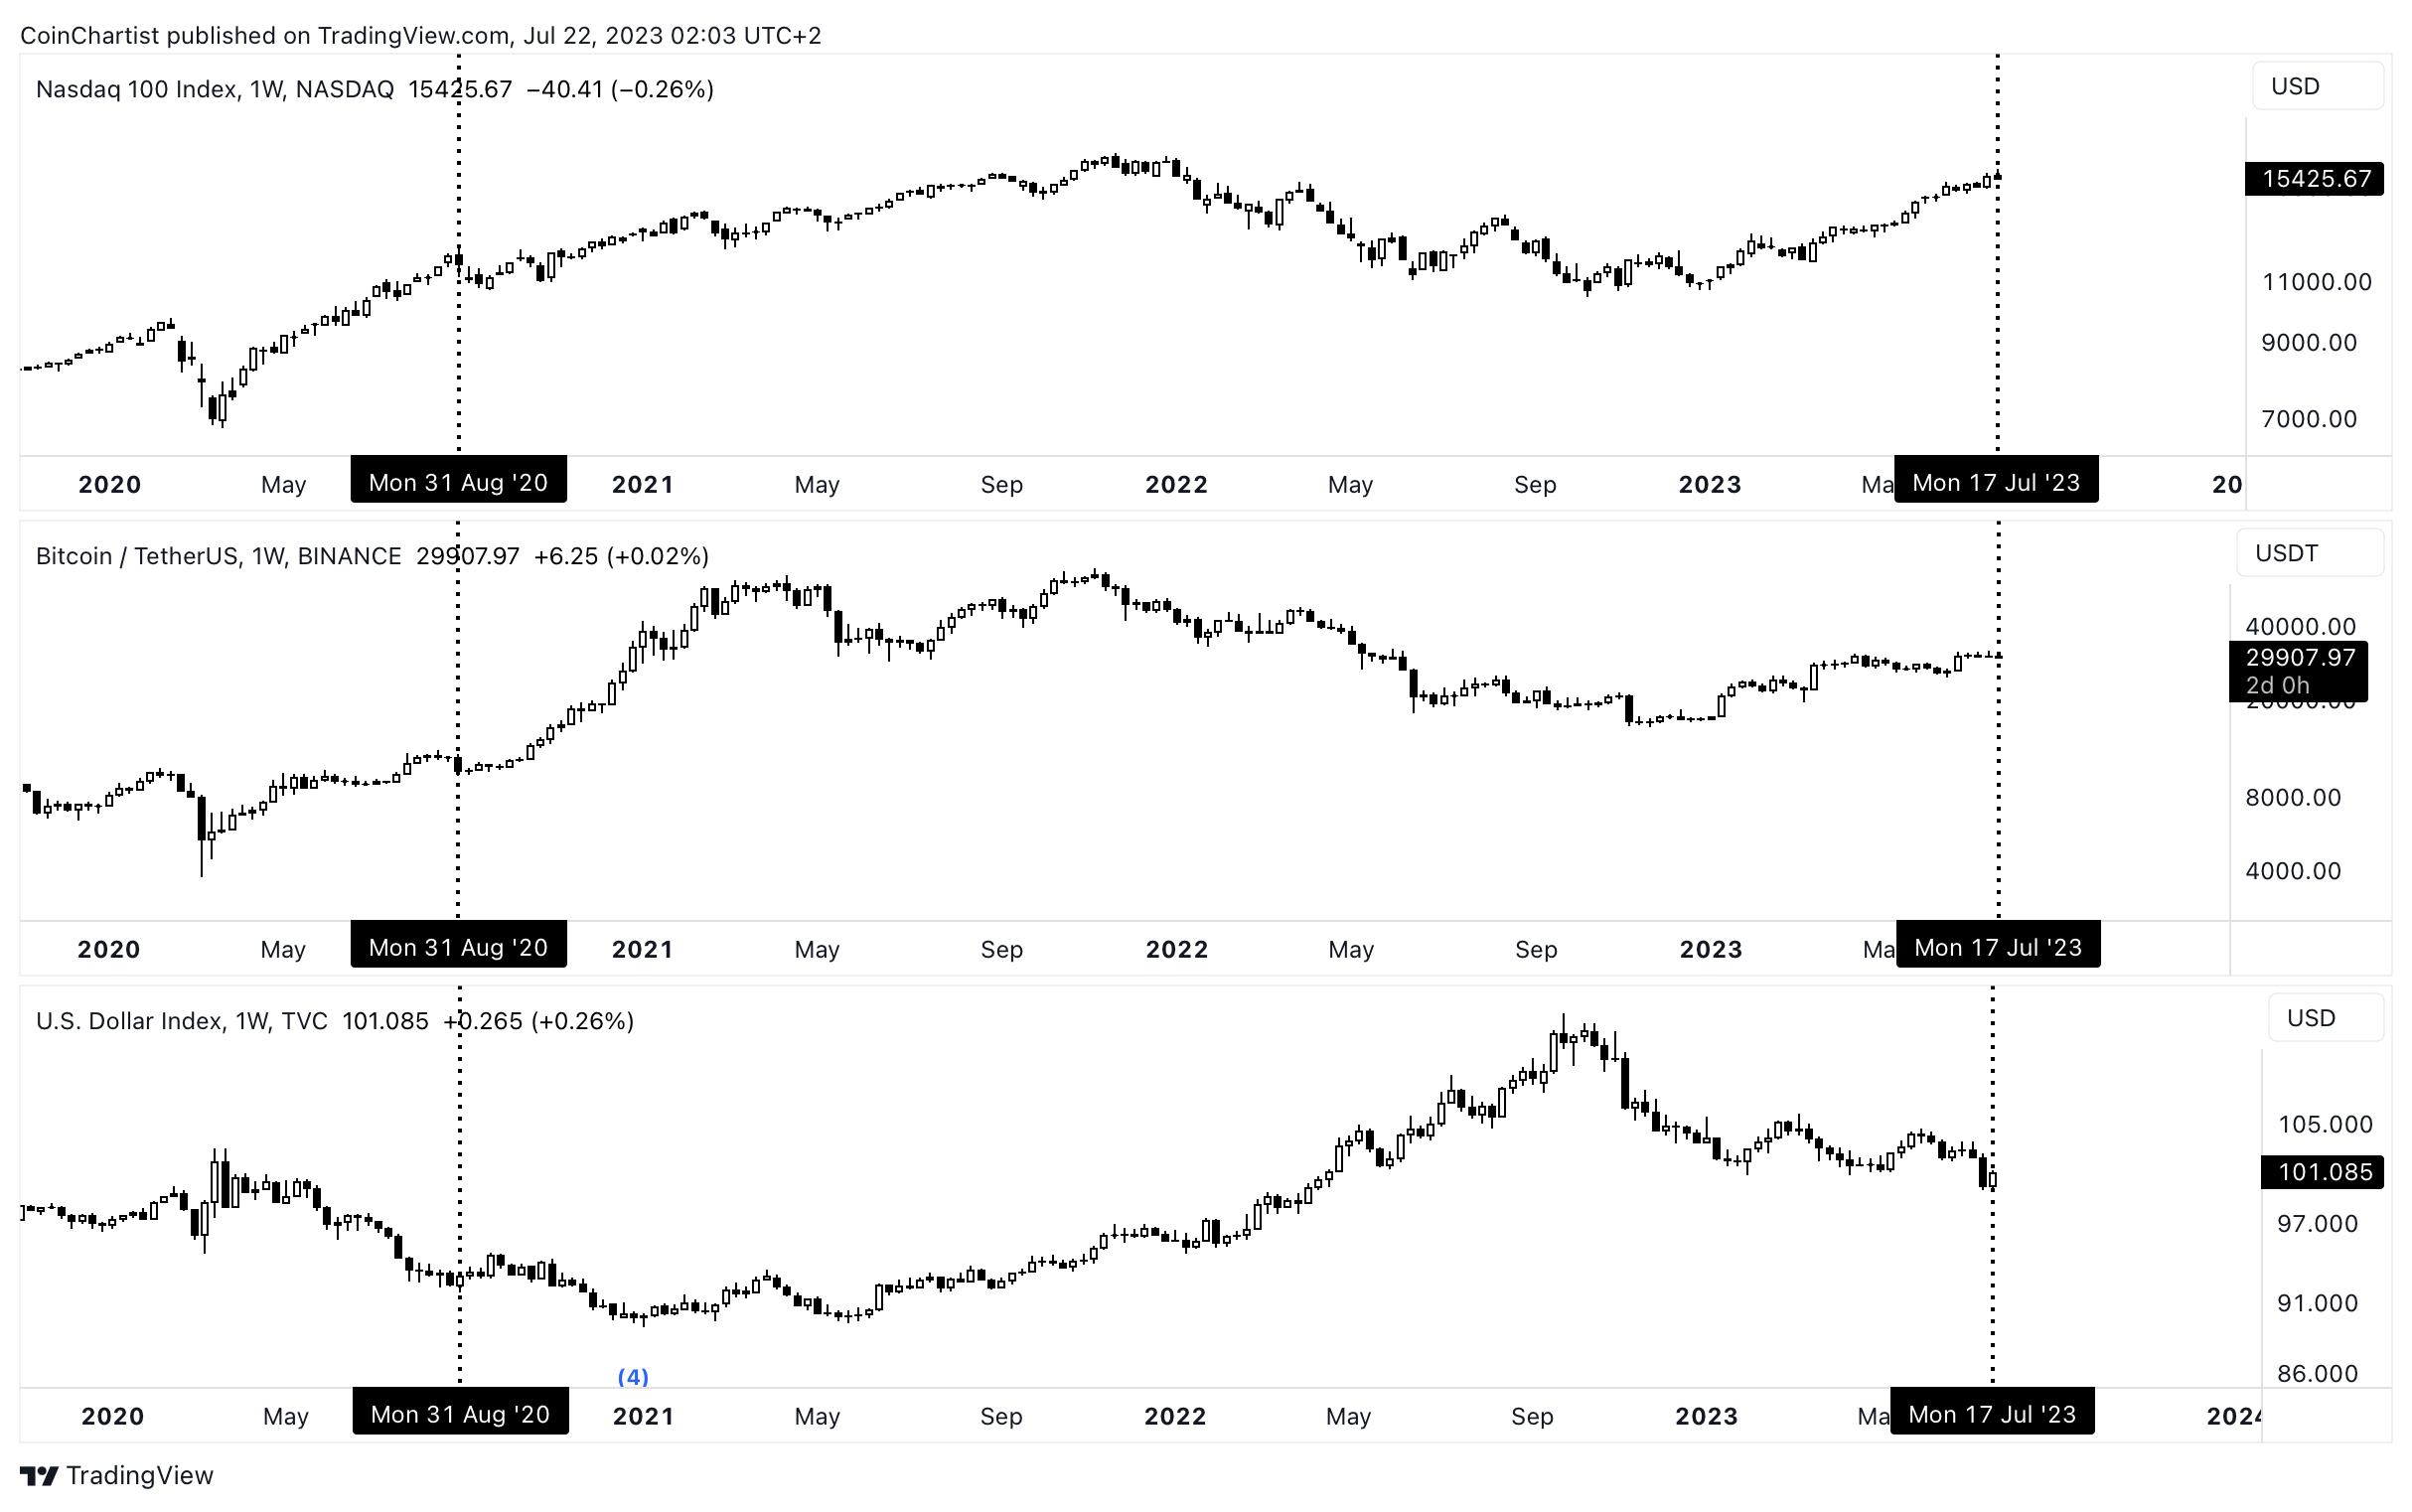
Adding in the DXY and we can see more possible validation of a retracement in risk assets like stocks and crypto. The DXY recovered shortly after the dotted line, only to fall another full level lower to its bottom. If the DXY follows a similar recovery, followed by a rapid fall further, then the environment supports a bull run in stocks and crypto.
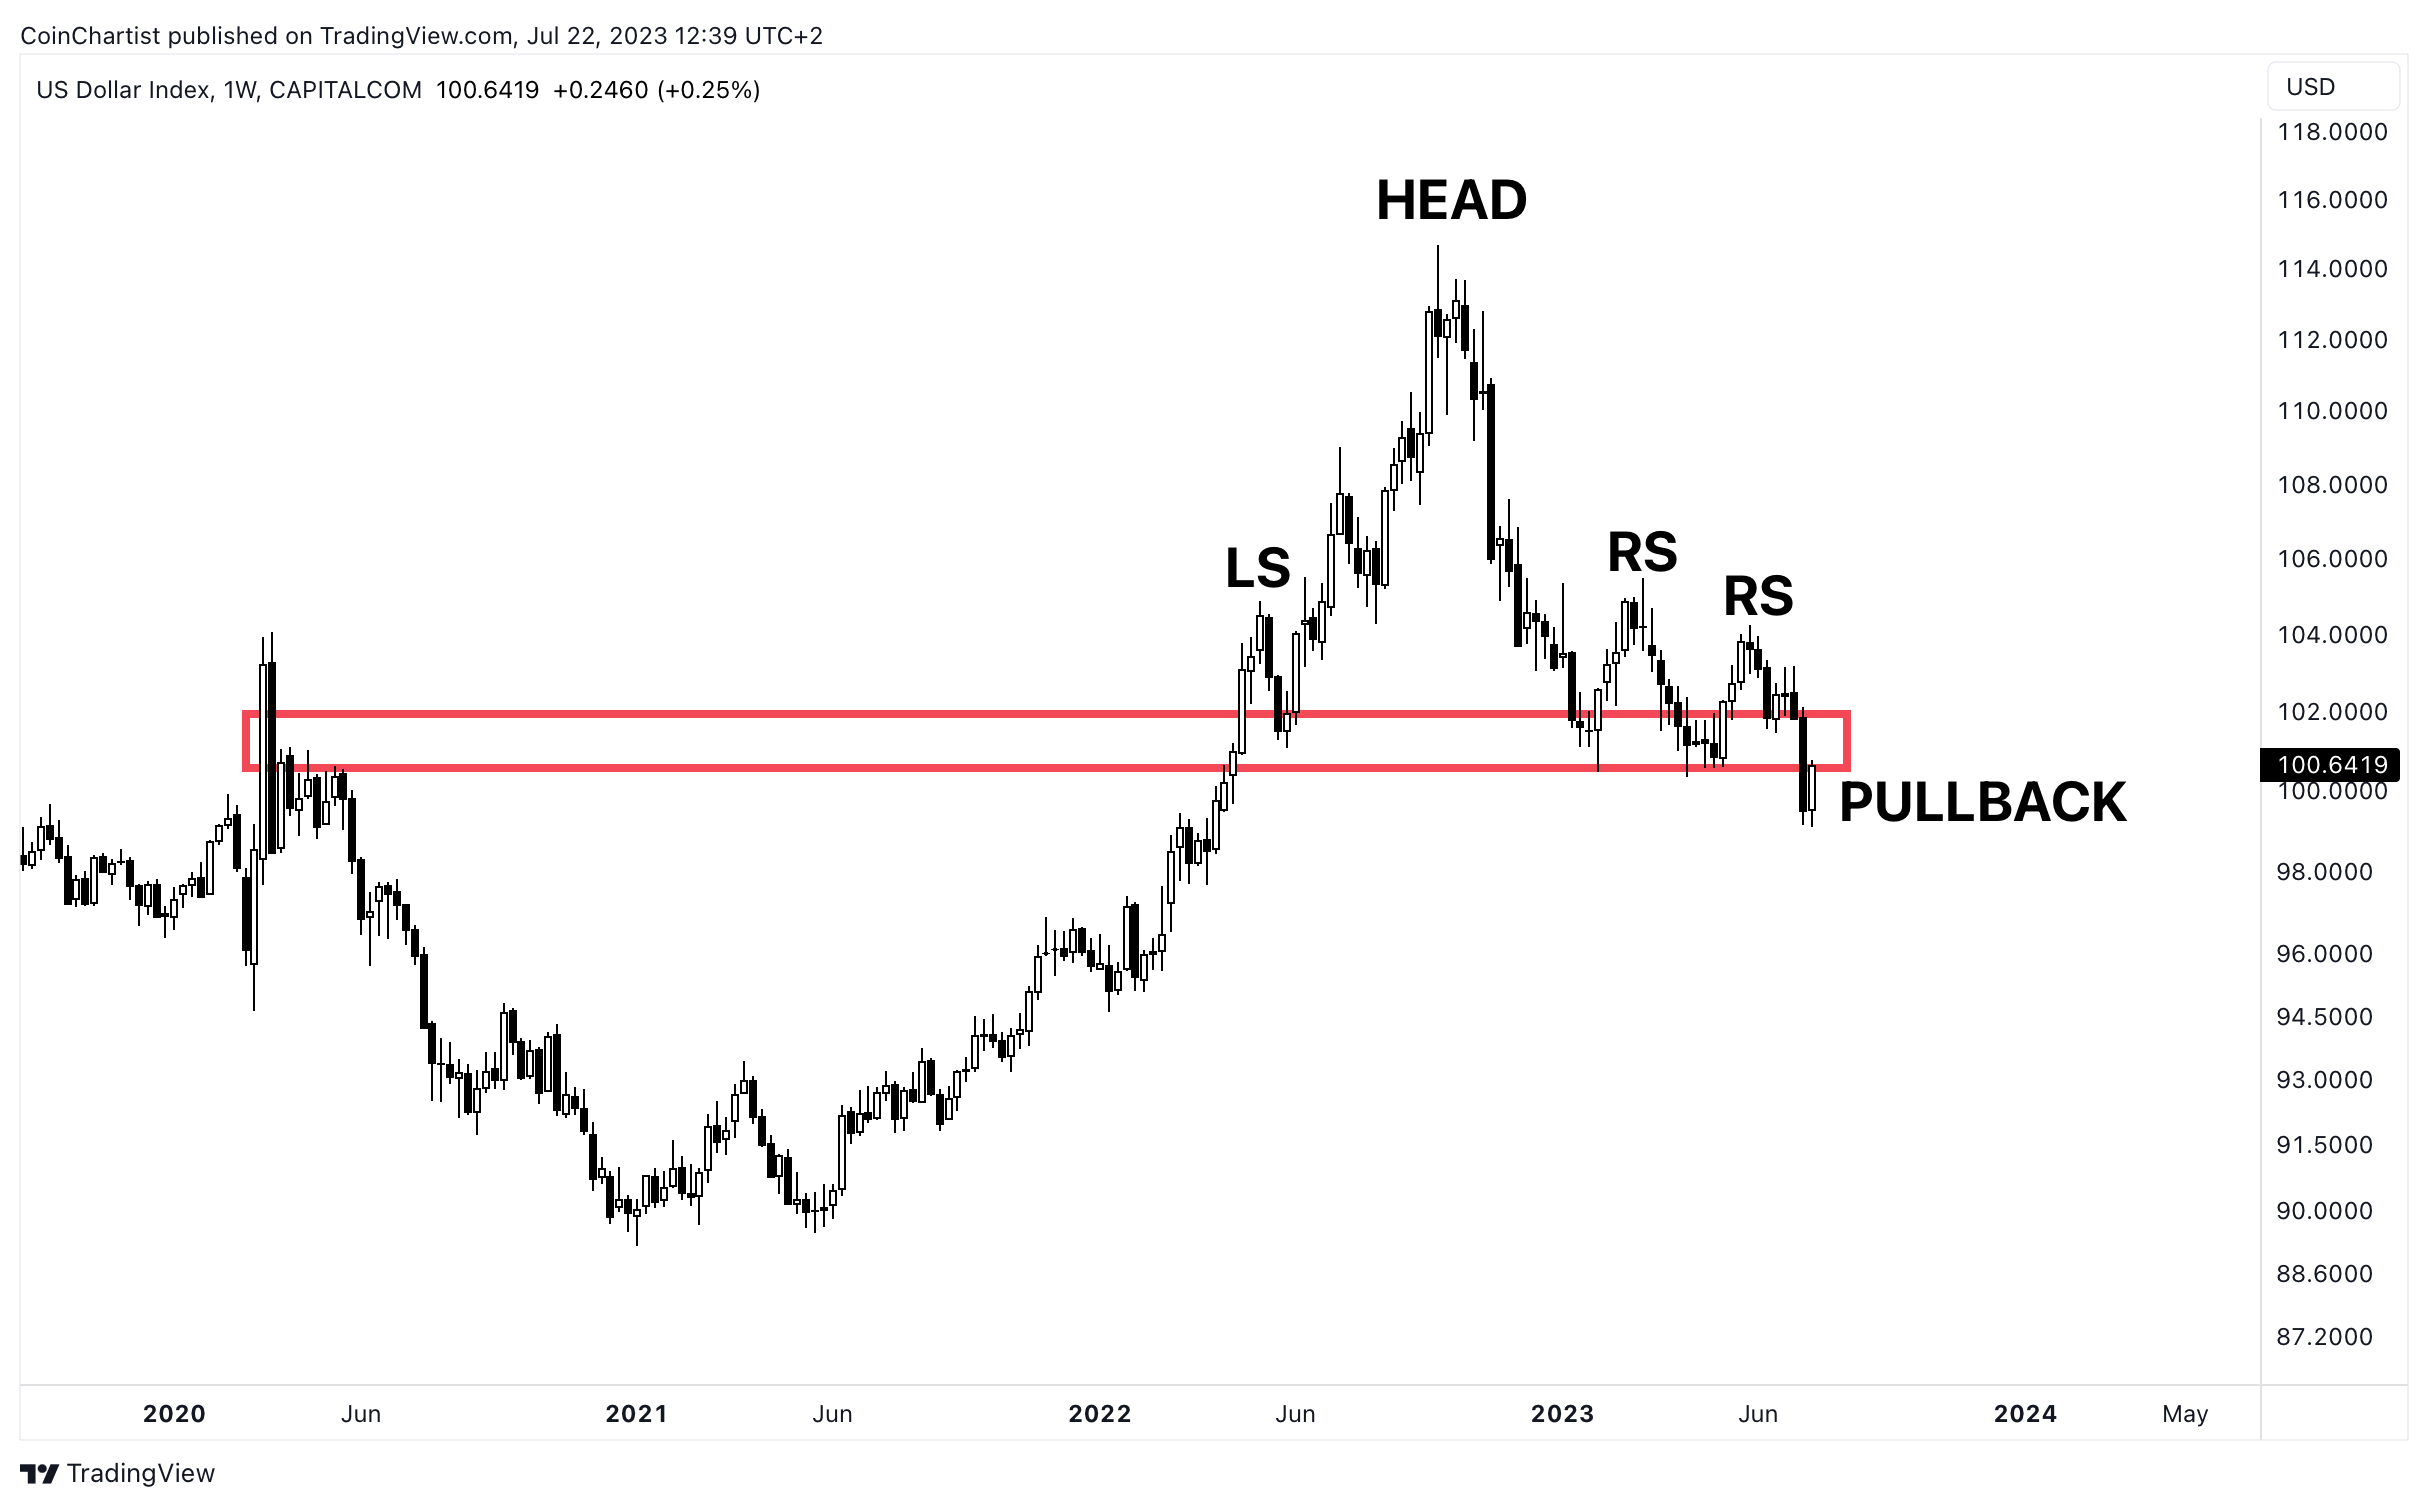
Looking at the DXY by itself, the recent rise could merely be a retest of former support now turned resistance. As long as it doesn’t reclaim the red box, the price action is nothing more than a textbook pullback after a breakdown from a Complex Head & Shoulders reversal pattern. The target of the pattern is the low 90s, which again would be supportive of further bullishness in risk assets like crypto.
Learn more about the Complex Head and Shoulders here.

The rise in the DXY this week could be traders front-running into the safety of the US dollar, with the Federal Reserve’s rate decision coming this week. This week also has updated GDP figures for Q2, PCE for June, and Initial Jobless Claims. All of this points to a highly volatile week. A rate increase could result in the pullback discussed in stocks in crypto in the short or even longer term. What happens as support gets retested will be telling about the future.

Before I move into my own updated wave counts for the week, I’m proud to feature Crypto Bull God this week for an alternative look at his personal wave count – which like my own – expects a peak in Bitcoin prior to the upcoming halving. Be sure to tune into his YouTube channel this week on Wednesday, 7/26 where I’ll be joining his livestream to give my thoughts around the wave 5 theory, cycles, and sentiment, and more.

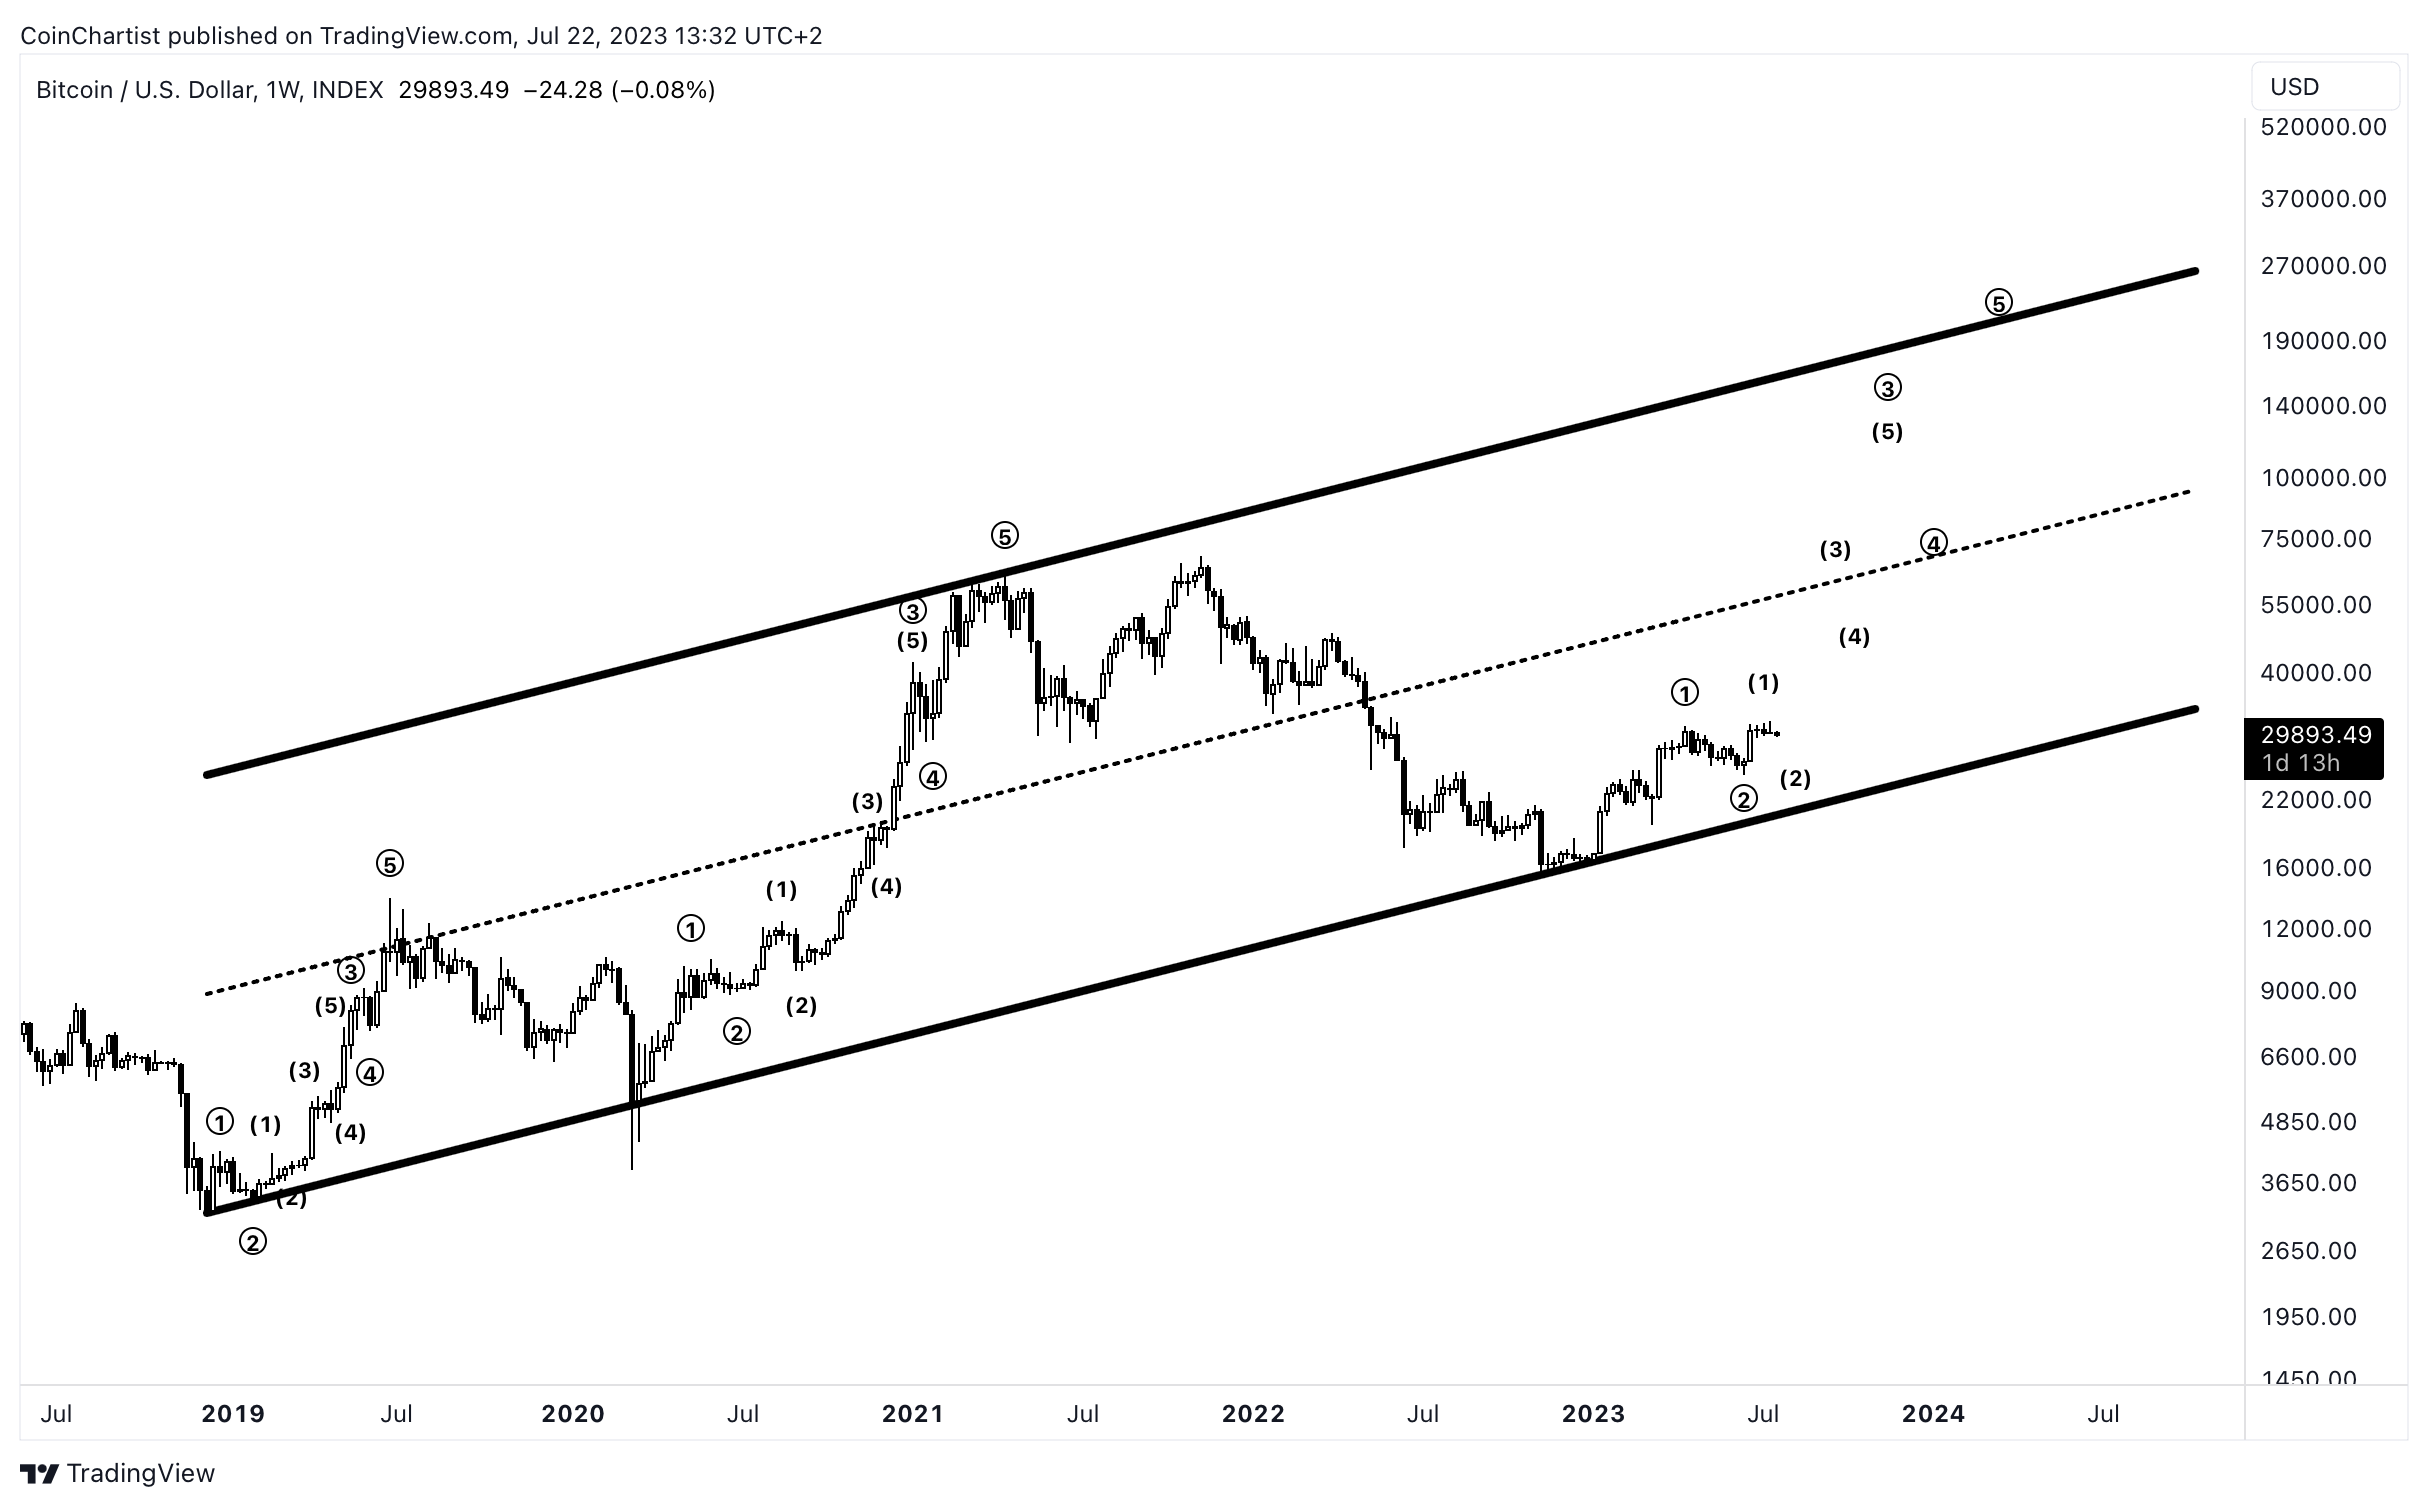
The photo above depicts the 2 most likely scenarios I see playing out for Bitcoin going into the 2024 halving (orange dotted vertical line). You will see that both views depict the completion of the parabolic 5th wave in the broader EW count shown which began in early 2019. I just published a video on my youtube channel 7/19/23 explaining both in greater detail:
I will, however, note my primary hypothesis is the top chart depicting a blow-off top & subsequent 5th wave completion in 4Q23.
Please note I have self-taught myself EWT and I am not a certified EW analyst. I am however looking into becoming a CEWA by early 2024.
Special thanks to Crypto Bull God for collaborating! Follow him on Twitter here.

With that, we’ll move onto this week’s Wave Watch, which looks again at Bitcoin and the NDX. I’ve also got a small educational segment highlighting the different corrective wave degrees.
In the past, I’ve counted out the 2020 rally differently. But based on the recent structure in BTCUSD, it’s possible the above count is more precise. In this new example, the 2020 wave count would perfectly match the current wave count, leaving plenty of time and room left over for a rally and peak before the end of the year. More and more, however, I am leaning into early Q1 2024 as a possible peak for Bitcoin based on this trajectory.

In this scenario, I have fully counted out the NDX since the bottom of the dot com bubble collapse. The point of this chart is to demonstrate wave degree. Note how the orange boxes are of a similar length of time and corrective depth. Meanwhile, the red box was devastating by comparison. Corrections inside the blue and purple were less severe, as lesser degree waves. This gives me confidence that the stock market still has a wave 5 left in it, that it could be well into already.
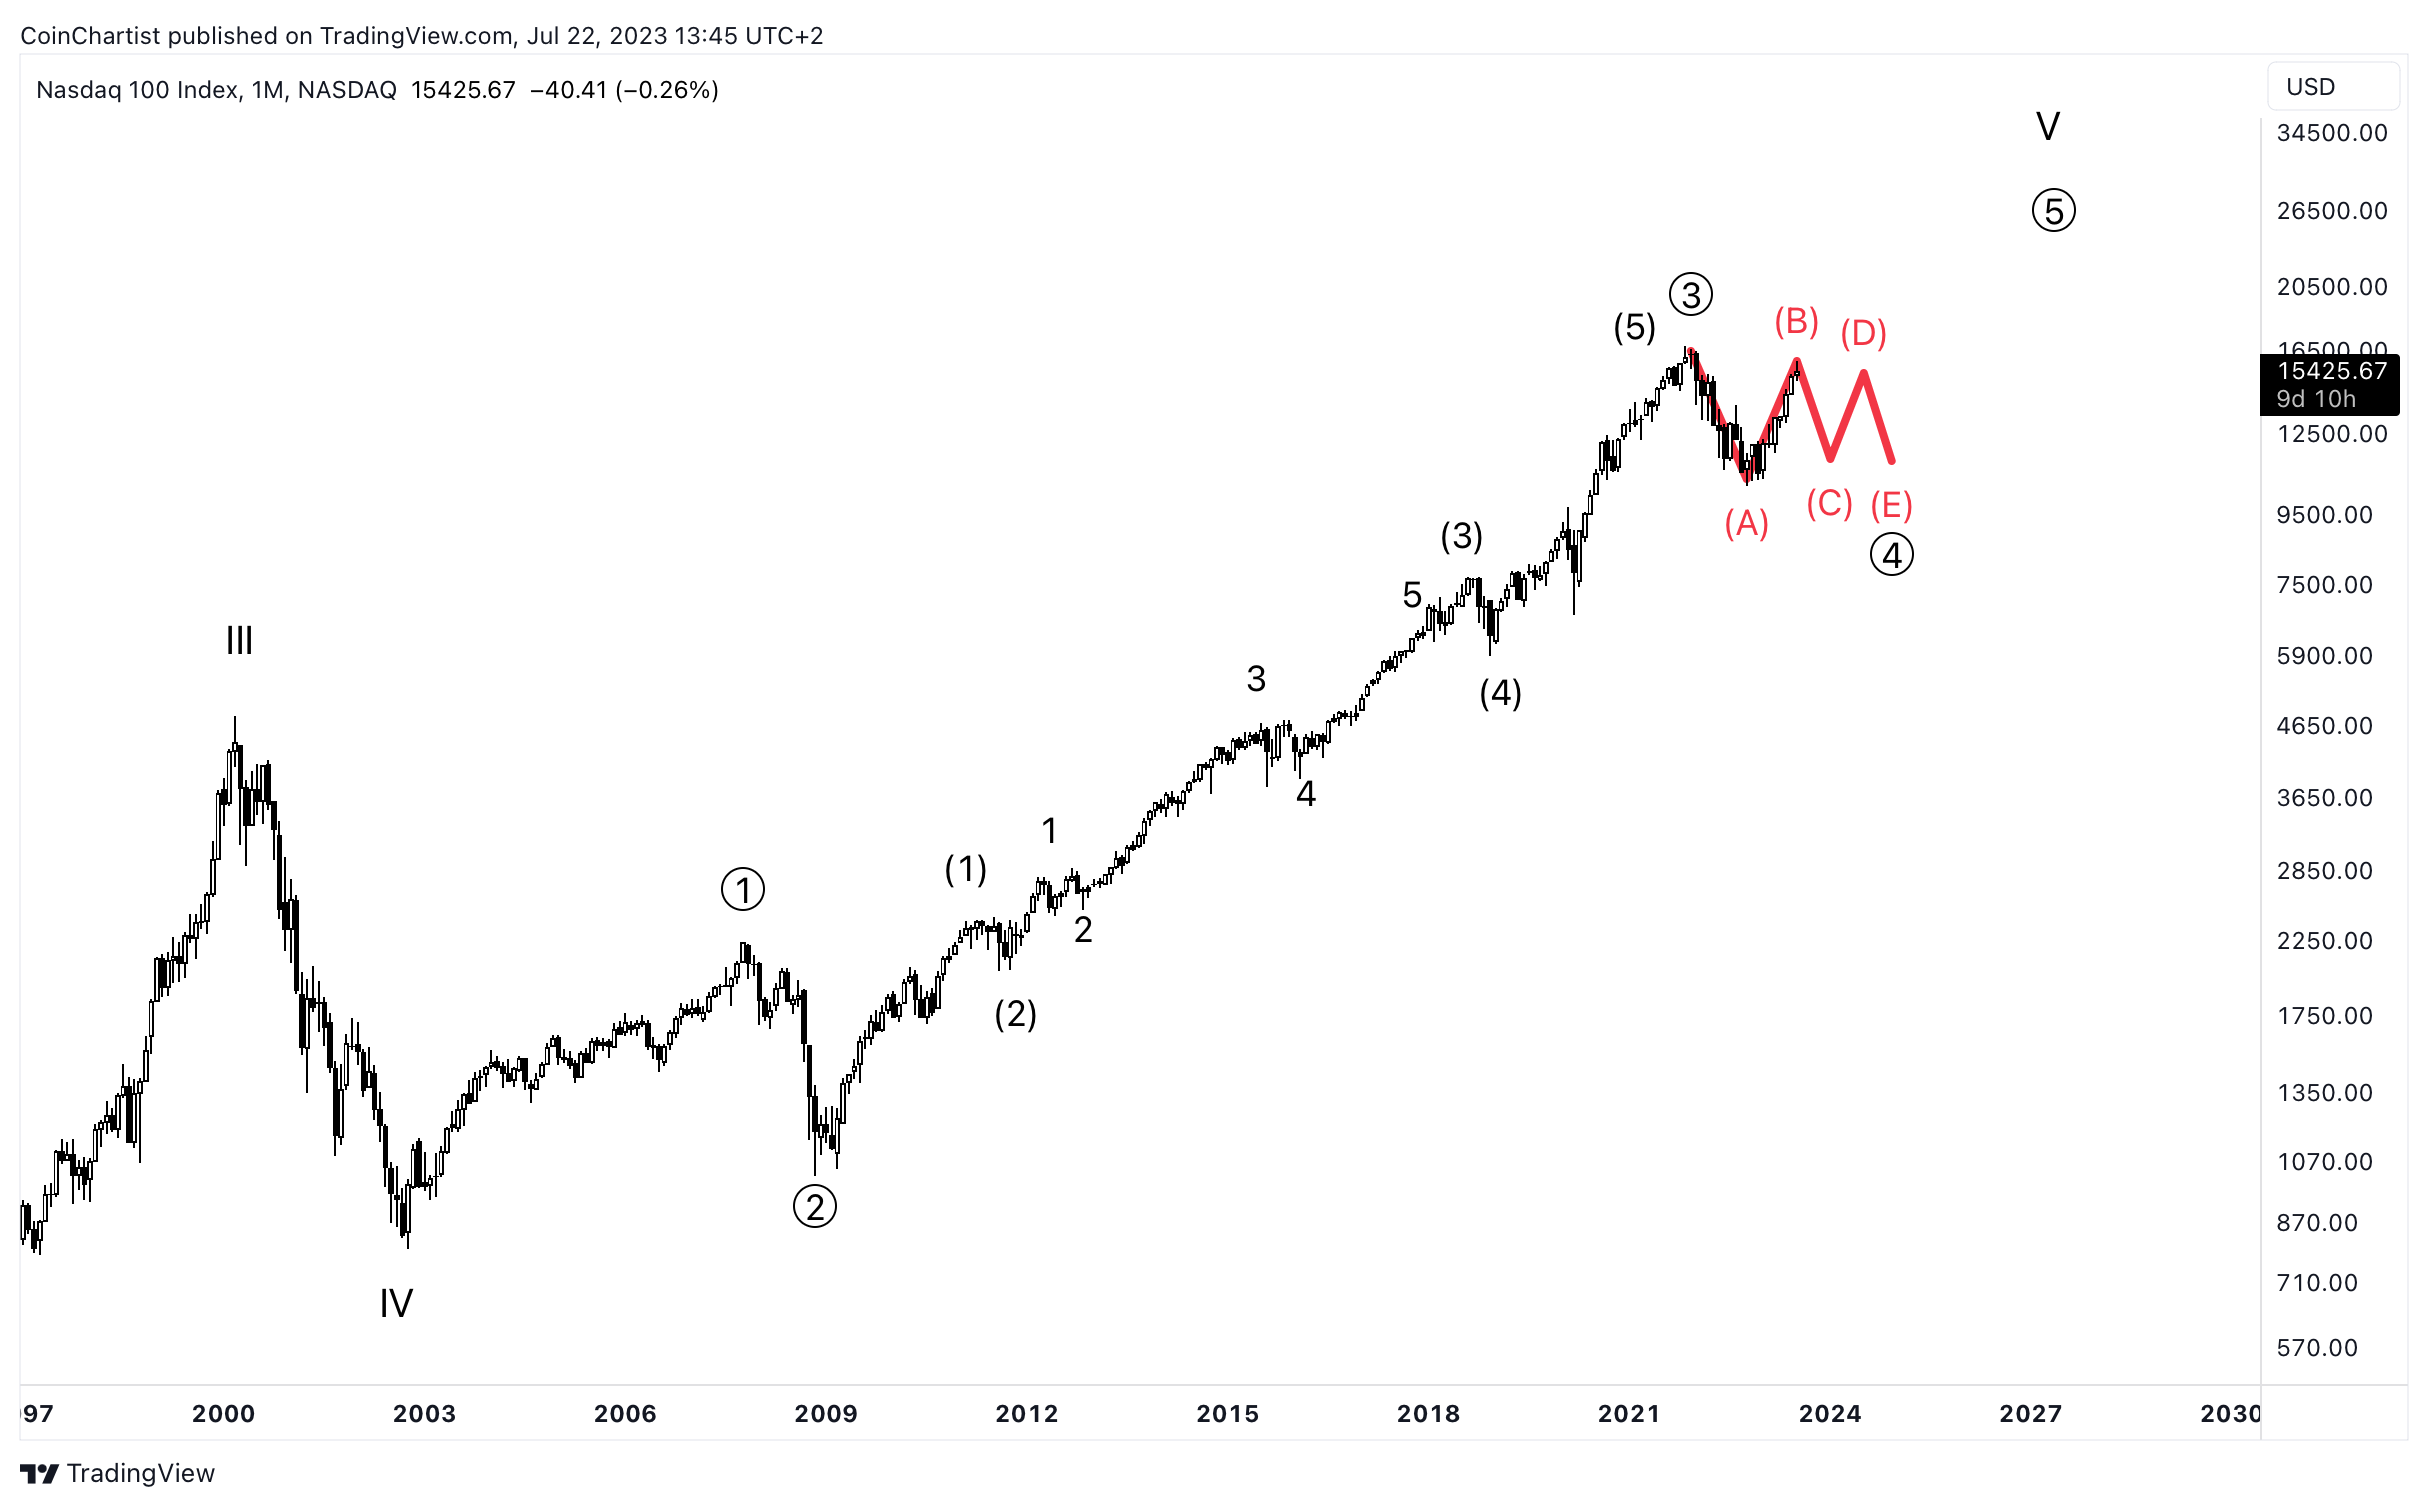
Much like the Expanded Flat in Bitcoin at the wave 3/4 placement was deceivingly sideways, there is still room for a larger degree triangle to form in tech stocks, which would keep the recession fears alive a lot longer. In this scenario, the NDX would make two more lower highs, while also making higher lows. Oftentimes in a proper Elliott Wave triangle, the E-wave can overshoot the trend line and make it appear a breakdown is happening before reversing upward, hence why I’ve placed the E-wave slightly lower than the C-wave. Despite the confusing consolidation in the stock market, it would still indicate a fifth wave up at some point in the future.
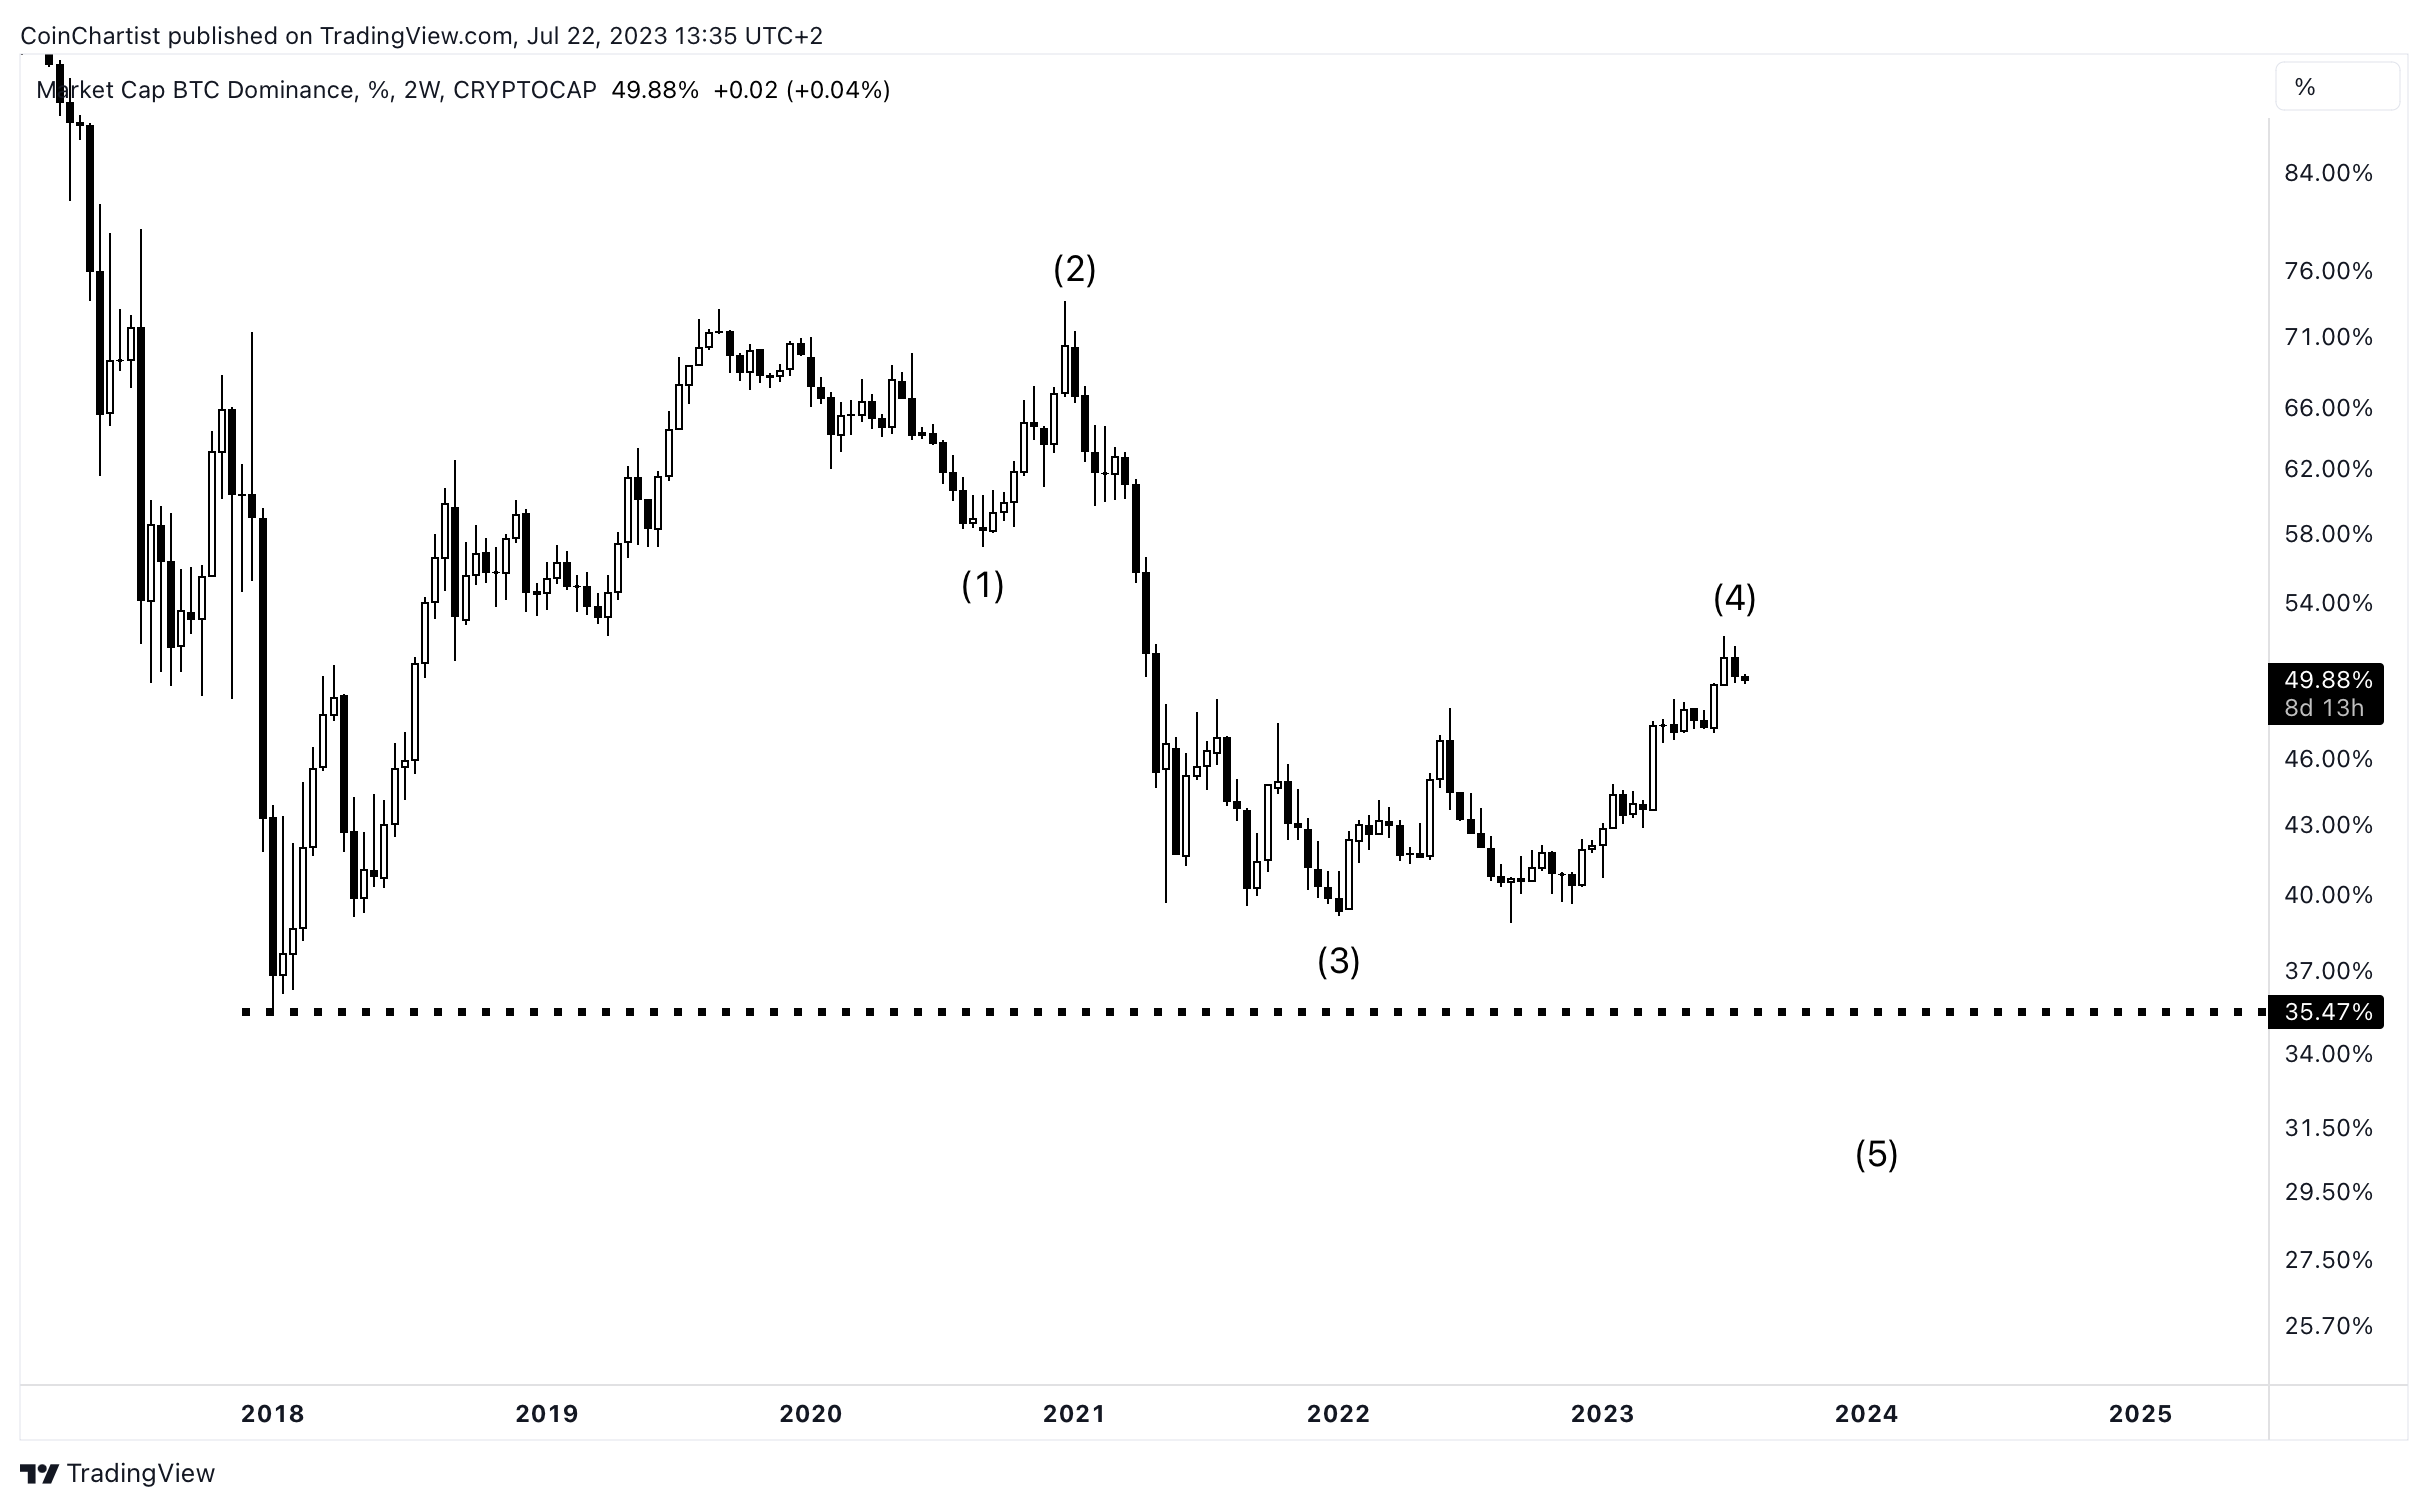
My final wave count this weeks goes to Bitcoin Dominance (BTC.D). I’m becoming increasingly convinced that Wave 4 against altcoins is over and soon we will see a Wave 5 and altcoin season. However, there could be one more leg up in BTC.D before the reversal begins.
Learn more about Elliott Wave Principle here.

The altcoin space is coming back to life after the dark clouds were lifted by XRP weeks ago, following a US judge ruling it wasn’t a security. Since then, positive developments in the industry are fueling reversals in certain cryptocurrencies.
Keep reading with a 7-day free trial
Subscribe to CoinChartist to keep reading this post and get 7 days of free access to the full post archives.