Issue #16 | The Worst Bear Market Ever
Bitcoin reclaims key level, altcoins about to go parabolic, stock market ATHs around the corner, and much more.
Issue #16 of CoinChartist (VIP) overview
A multi-timeframe look at the most important line in Bitcoin and why
Could several top altcoins go parabolic before BTC and ETH?
Why the stock market could set a new ATH – or reverse – before the end of the month
A spotlight on Ethereum and the Trend Wrangler
Updated wave counts and projecting the worst bear market ever
An advanced lesson on the Bollinger Bands
Remember, a premium subscription comes with access to custom technical indicators like the Raging Bull, Trend Wrangler, and more.
Disclaimer: The information provided in this Substack newsletter is for general informational purposes only and should not be considered as financial advice. Investing involves risk, and past performance is not indicative of future results. Please conduct your own research or consult a qualified financial advisor before making any investment decisions. The newsletter disclaims any liability for losses or damages arising from the use of this information.
You can also follow CoinChartist on YouTube and Twitter. Don’t forget to also like and comment to let us know how we’re doing.
As Bitcoin volatility reaches an inflection point in its record low phase, the dust appears to be settling on one very important line. This line is visible across just about all timeframes, which I’ll walk you through next.
To begin, we’ll start with a chart you might have seen at this point. It is the 1W Bitcoin Bollinger Bands at the tightest the bands have ever been. This is evident in the Bollinger Band Width tool below. The so-called “dust” of the last two years of volatility is finally settling down and it’s settling on an important line. Pay extra attention to the dashed line labeled CLOSE.
Moving along to higher timeframes, the 1M BTC CME Futures chart, which I’m using for the sake of the gap that’s now visible in the price chart. Gaps occur due to price action closing over weekends on BTC CME. However, these gaps in Japanese candlesticks are referred to as a rising or falling window, which is an important area of potential support and resistance. The 1M price action met resistance in April, but found support in May. June’s 1M candlestick closed above the dashed line, and July’s candle held above it.
This is especially important because this level on the 6M BTC CME Futures has been fully reclaimed, and is being retested on the highest timeframes. Although is nearly missed the trigger, the Morning Star pattern did make it above the 50% point of the massive black down-candle in H1 2022. It is important to note, however, that the Morning Star pattern only barely made it above this level, making it a relatively weak signal.
On the 9M chart, BTC CME Futures is still working on a Morning Star pattern, and has 1M and 18 days left before it closes. This is notable, because a fully filled out pattern involves completely engulfing the black candle. If it does, Bitcoin price could find itself above $46,000 within six or so weeks – possibly sooner, as you’ll learn throughout this issue.
Learn more about the Morning Star pattern here.
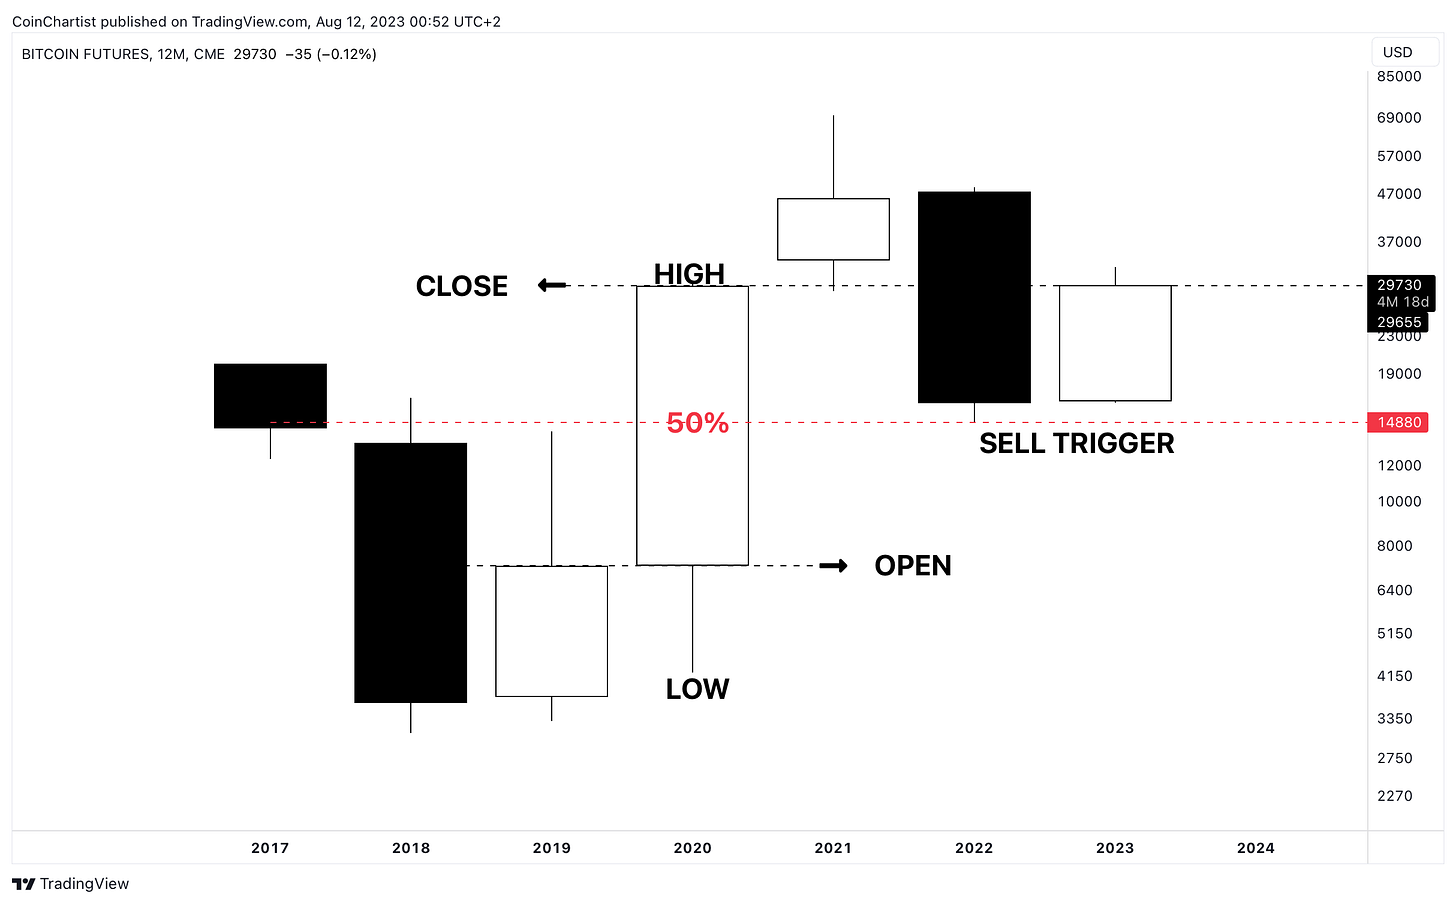
So why then is this level so important, Tony? Because this is the last bullish close on the 12M chart, which represents and entire calendar year. 2020’s candle is a Bullish Marubozu candlestick, which has little-to-no upper wick.
In Japanese candlesticks, wicks represent the high and low of a session, with the close being the most important data. The next most important piece of data is the open. 2021 opened with a gap and then formed a doji. The black down candle representing 2022 failed to wipe out more than 50% of the white Marubozu representing 2020. This means that the sell trigger requirements were never satisfied.
Finally, we can see the the 2023 candlestick is stuck at the same 2020 close that’s causing all this resistance. If BTC can push above this line cleanly, there is very little high timeframe resistance above and it’s quite possible that 2023 finishes with new all-time highs. If not, signs point to early 2024 as I’ll tackle in the Wave Watch section later in this issue. Followed by the worst bear market ever.
Learn more about the Bullish Marubozu here.
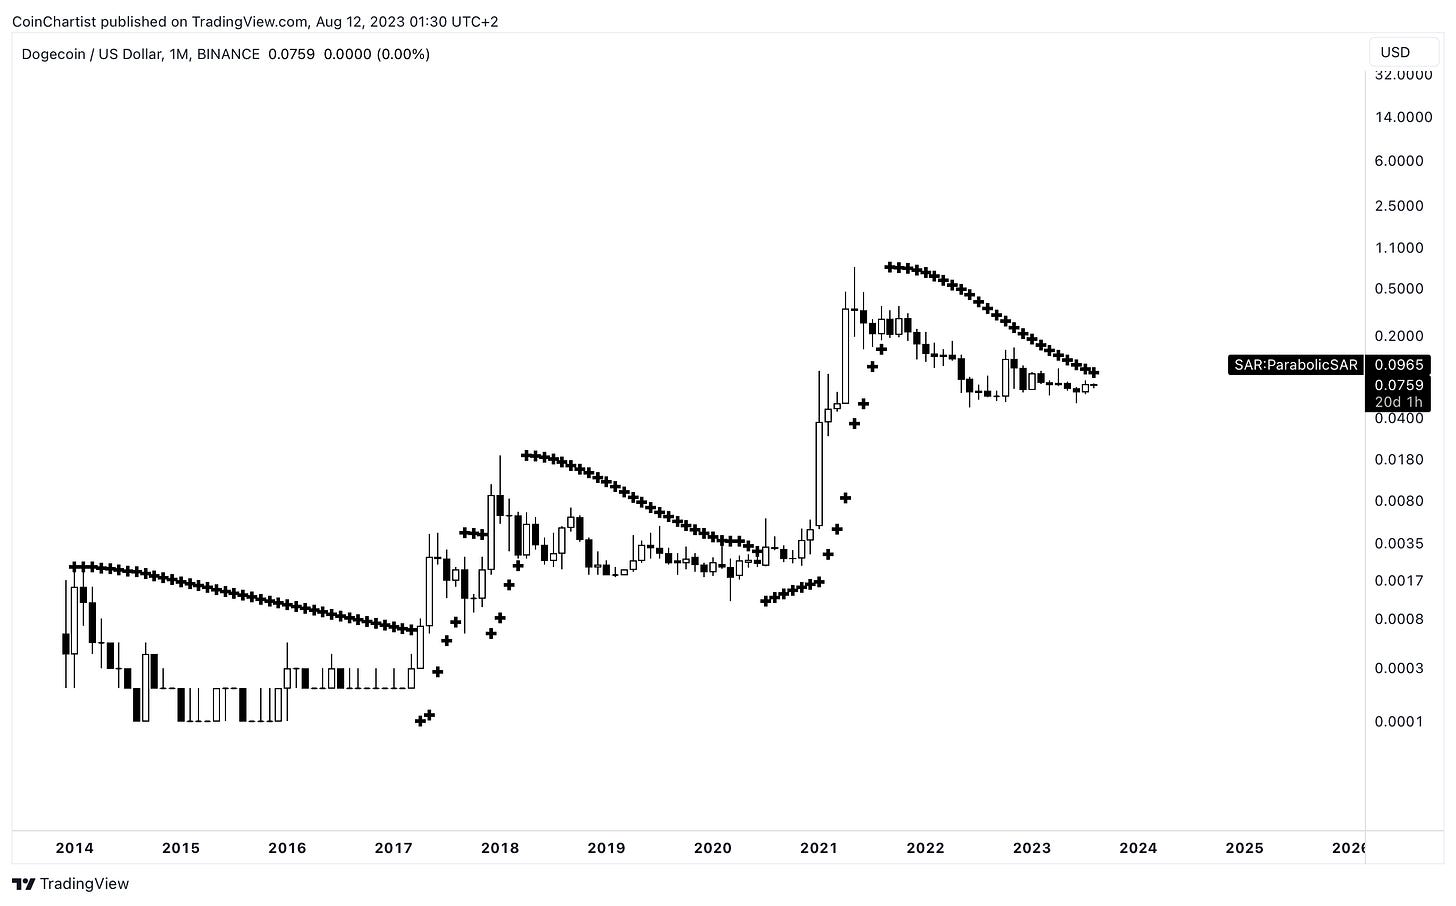
When cryptocurrencies move into a clear uptrend, they tend to go “parabolic” which simply means price action gets increasingly steep until it’s nearly vertical. Several dominant altcoins are about to trigger a buy signal on the 1M Parabolic SAR.
Probably the most exciting signal this month goes to Dogecoin, which is mere pennies away from tagging the Parabolic SAR on the 1M timeframe. Why is this a big deal? Because Dogecoin is a one-way ticket to altcoin season. A buy signal has only been triggered three times in the past, causing a 500%, 225%, and 25,000% rally, respectively. Will this signal prove as reliable as man’s best friend?
Another sign altcoins could see some upside, is in Cardano. The cryptocurrency’s chart here only has one previous buy signal and it resulted in a 4,000% surge. The Parabolic SAR was created by J. Welles Wilder, Jr. who is the father of many technical indicators, such as the Relative Strength Index, the Average Directional Index, and Average True Range.
Another candidate within striking distance of the 1M Parabolic SAR, is Chainlink. This signal fired twice before, with the first rally adding 400% ROI, and the second more than 1,000%. SAR stands for “Stop and Reverse”, and the tool is designed — especially on the highest timeframes — to tell us when a trend has indeed stopped and reversed.
Traders who went short at the top could have used the placement of each decreasingly lower SAR dot as a trailing stop loss. When price ultimately tags the SAR, it’s a sign the trend has a high probability of reversing. Here, Uniswap has already tagged the SAR, suggesting that it is more bullish than any of the altcoins discussed above.
Furthermore, other top coins like Litecoin and XRP have already triggered the signal. Also of note, Bitcoin and Ethereum have yet to do so. Could these altcoins surprise and become breakout crypto market leaders?
Importantly, it could be an indication of increasing market participation across the crypto market.
Learn all about the Parabolic SAR here.
In last week’s issue, I outlined how back in 2020, Bitcoin and altcoins didn’t quite take off until a new stock market all-time high was made. That could once again be what crypto assets are waiting for before making their own more substantial rallies. Below I’ll explain why this could be coming sooner than most would expect. The alternative, is that a reversal is possibly underway in the stock market, and it is uncertain how that might impact crypto.
The S&P 500 is the most important index in the entire world. Why? Because it is used as the benchmark against everything else is measured. The term “alpha” in financial markets refers to the excess return above and beyond a benchmark and is used to describe how much a strategy or asset is outperforming the overall “market”. Nothing better represents that than the SPX. Currently, the S&P 500 1M chart is on a TD 8 sell setup – which can mean one of two things.
The Dow Jones is another important US stock market index, and is currently on a TD13 countdown. The countdown to 13 begins when the TD9 fails to predict a reversal. When this happens, the 13 can predict the reversal instead. This means that the stock market could reverse this month – especially when considering the confluence across each major US index.
Finally, the third most important US index is the Nasdaq 100, which is a basket of top tech stocks like Apple and Amazon. The NDX has triggered a TD8 sell setup also, but importantly has done so after closing above TDST Resistance. This resistance only appears on the 1M NDX chart and not the others. It is critical to note that the TD Sequential can reverse on a TD8 or TD9 count.
Also, these signals can be “perfected” by making a higher high. That gives the stock market between 1-2 months to potentially make a higher high, which would more than likely set a new all-time high across major US stock indexes. If the stock market does make new ATHs within one to two months, we have our rationale for why altcoins could suddenly surge.
Among the reasons for a thriving stock market, is because there is still tons of demand, and despite the rising interest rate environment, consumers aren’t defaulting on their debt. This can be seen at the delinquency rates in single-family residential mortgages. In 2008, there were mass foreclosures. Today, people are making their mortgage payments just fine. Remember, although rates are higher now, most homeowners are locked into much lower rates.
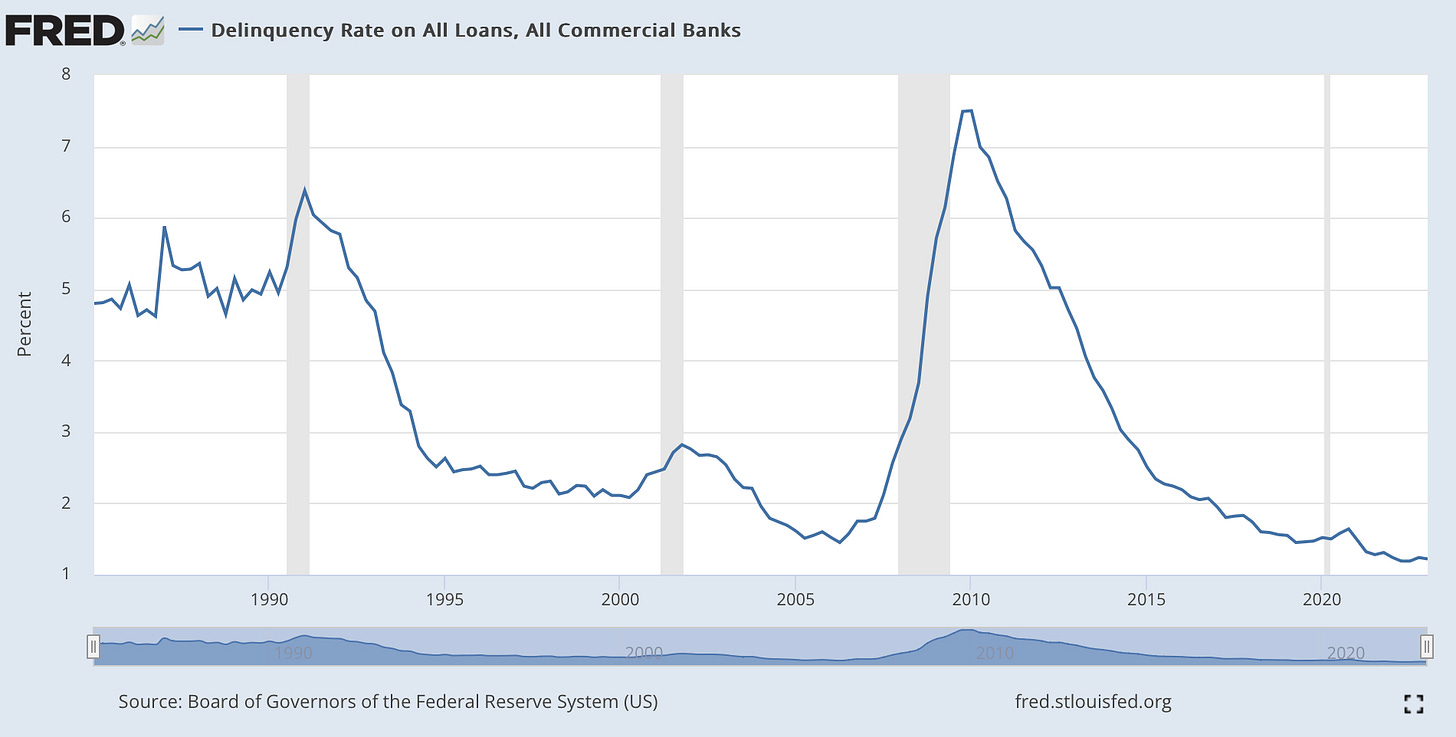
Delinquency rates on all types of loans are at all-time lows. Once again, people don’t appear to be struggling to pay bills in relation to outstanding debt. A recession is highlighted in grey in FRED economic data.
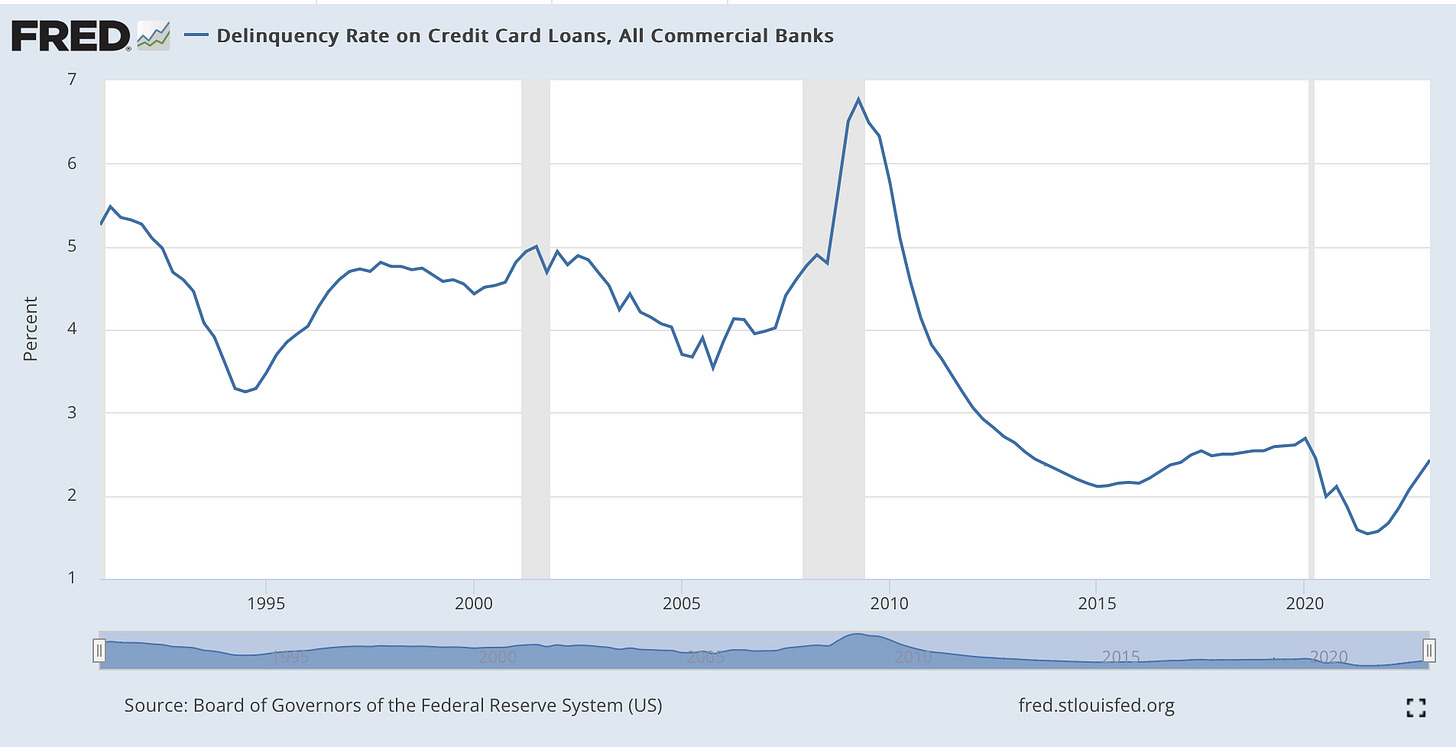
Where we are starting to see some trouble, however, is in credit card delinquencies. These are rising after reaching historical lows. The reason for this is because revolving credit comes at the cost of much higher interest rates that are subject to fluctuations in the Fed rate.
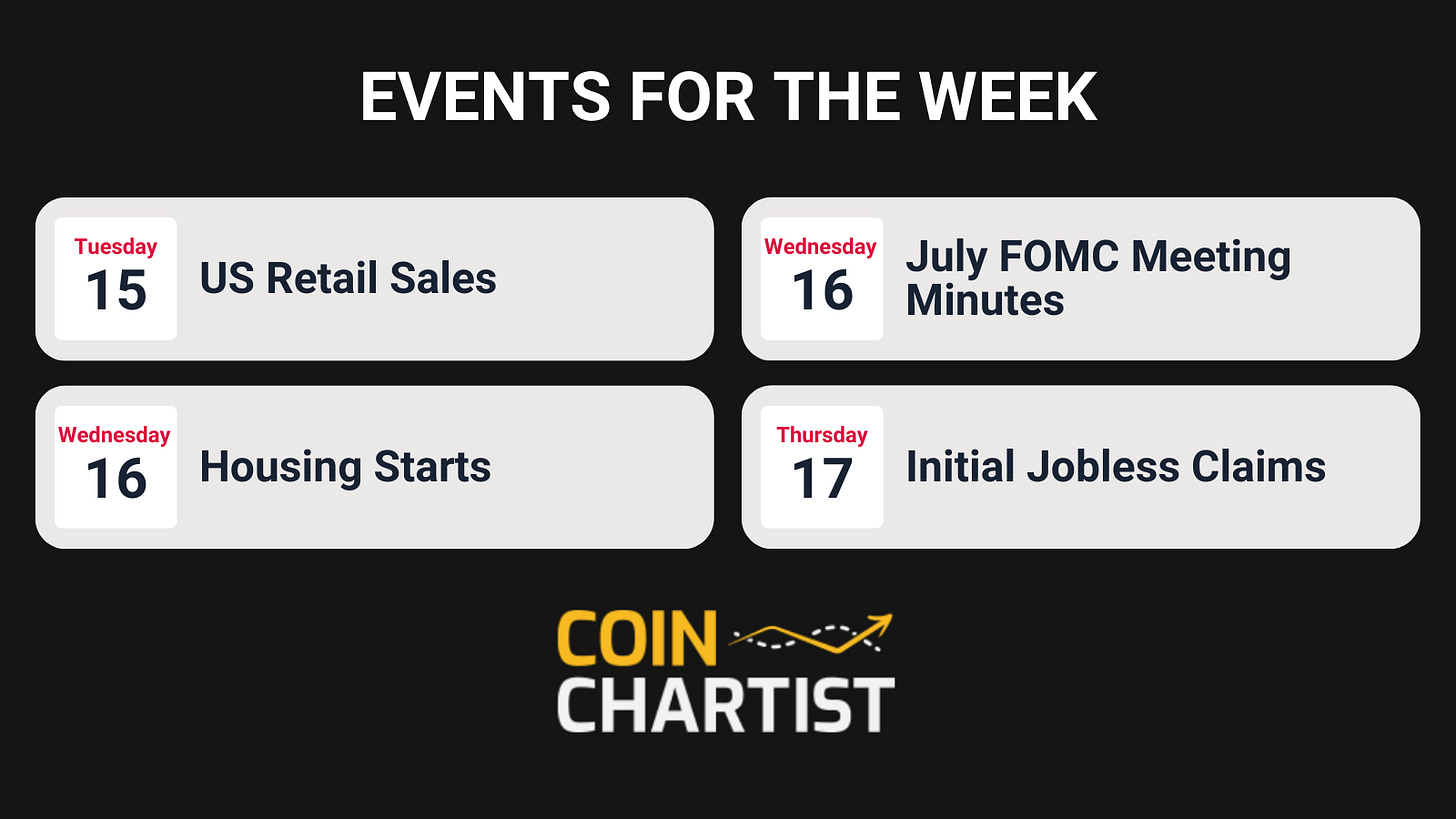
This week is more tame compared to last week’s CPI and PPI reports, but does provide more information around the July FOMC meeting with the release of the minutes. US retail sales and housing starts are also key economic indicators that can impact financial markets.
This week, I want to call out my custom Trend Wrangler tool that’s available when you upgrade to Premium. (Note: If anyone doesn’t have access who paid, please immediately get in touch)
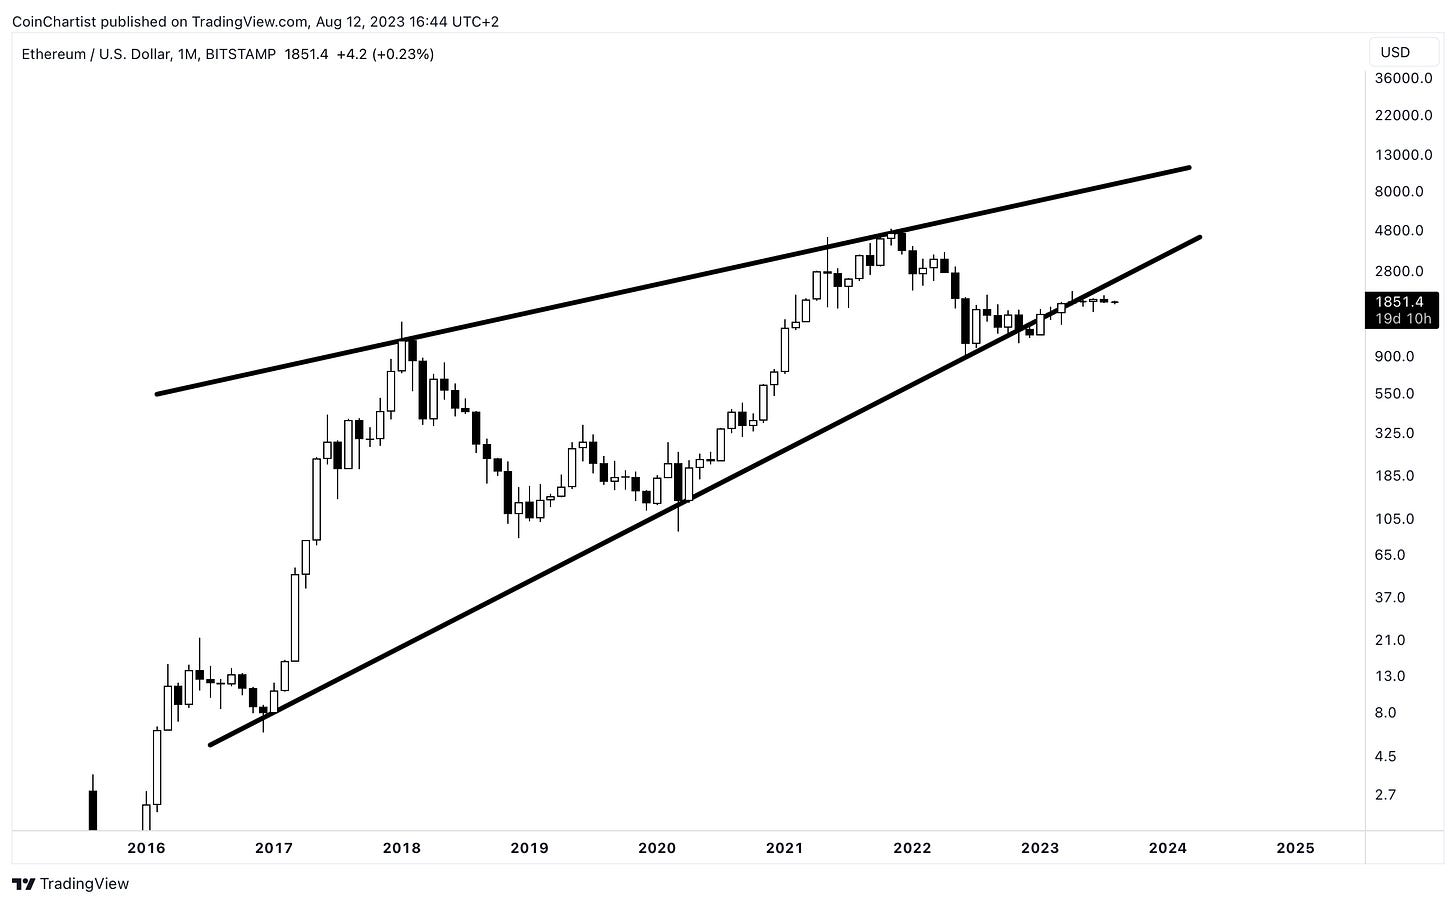
The reason for this spotlight on this trend-following tool, is because I can’t get this Ethereum chart out of my head. This is one nasty looking chart, if the pattern is at all valid. If it wasn’t for this chart, I would be firmly bullish on Bitcoin and crypto as a whole. But I’d be lying if I said this didn’t look pretty bad.
However, I take a lot of comfort in knowing that price continues to hold above the Trend Wrangler. The tool was specifically designed to filter out the noise from markets. It’s simple to use: bearish below, bullish above. The span itself acts and support or resistance depending on the direction of the trend. The direction the tool points is also important to understanding the where a trend is heading.
Turning off the price action shows a clear representation of a smoothed out trend over the last several years in Ethereum. Although the Trend Wrangler isn’t pointed sharply up like we want it to, it definitely isn’t pointed down like we see during downtrends.
That’s it for free content. The best content is always reserved for premium members and Founding Member VIPs.
Behind the paywall is an updated look at Bitcoin wave counts, where I follow up on a controversial chart I posted this week on X (formerly Twitter). In this exclusive follow up, I outline what the next major bear market looks like. This, you don’t want to miss.
In addition, I teach you how to customize the Bollinger Bands in a variety of ways to improve performance in cryptocurrency trading.
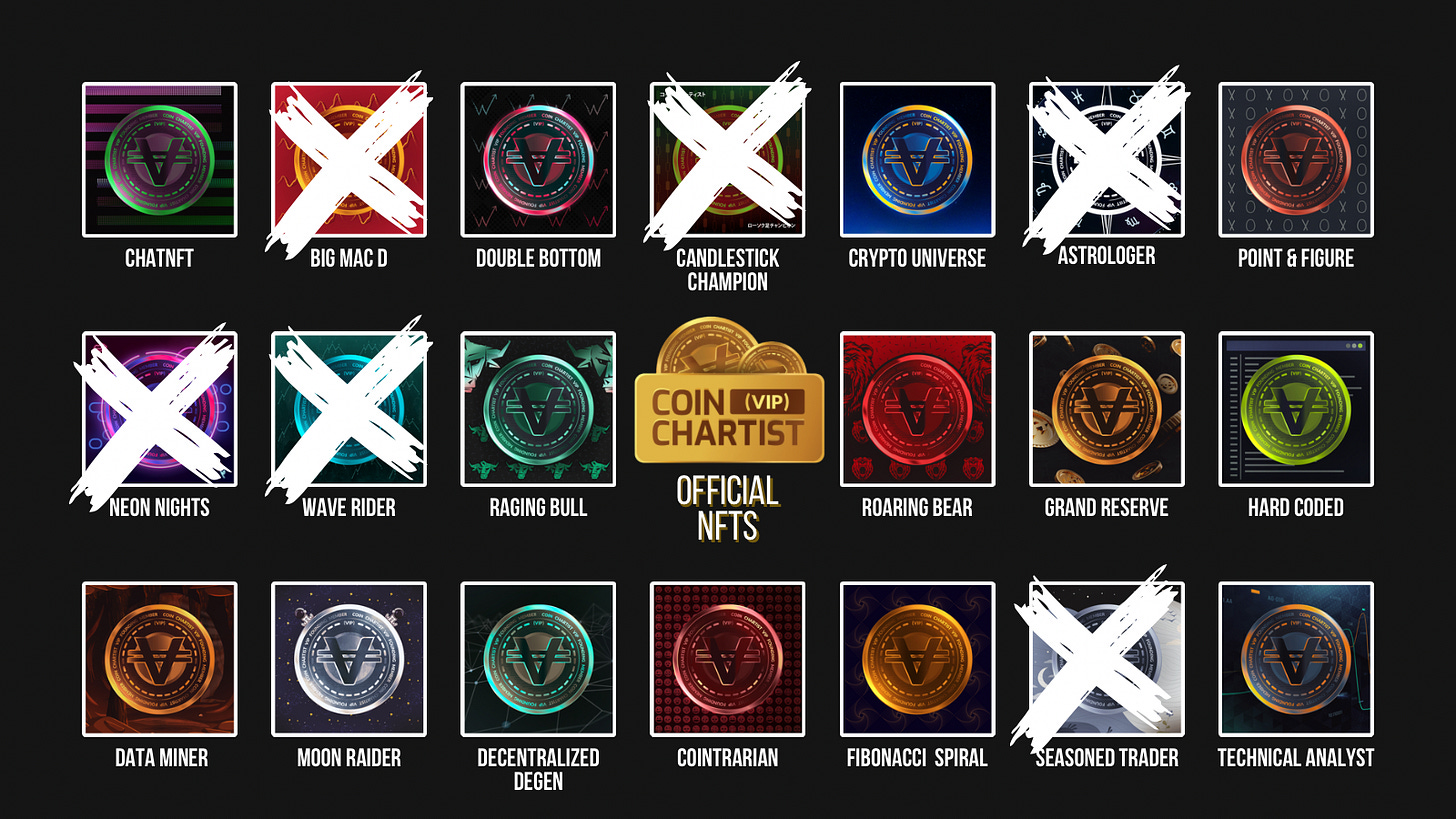
Note: CoinChartist (VIP) Founding Member Coin NFTs are available on OpenSea. Buy one there or sign up for the Founding Member subscription through Substack to secure your favorite. Above you’ll find a list of all currently available coins. Founding Member Coins enable access to a VIP Telegram channel, 1-on-1 TA training with Tony, and more.
Keep reading with a 7-day free trial
Subscribe to CoinChartist to keep reading this post and get 7 days of free access to the full post archives.


