Issue #17 | Bounce, or Back to a Bearish Trend
How the selloff shook altcoins, Evergrande’s impact on global markets, updated wave invalidation levels, and more.
Issue #17 of CoinChartist (VIP) overview
Taking a step back after the Bitcoin breakdown to reflect
Major altcoins look heavy, but hope isn’t lost
Evergrande and China’s impact on financial markets
New wave counts — two possible corrective scenarios and invalidation levels
An introductory lesson on the Point & Figure charting using Bitcoin
Remember, a premium subscription comes with access to custom technical indicators like the Raging Bull, Trend Wrangler, and more.
Disclaimer: The information provided in this Substack newsletter is for general informational purposes only and should not be considered as financial advice. Investing involves risk, and past performance is not indicative of future results. Please conduct your own research or consult a qualified financial advisor before making any investment decisions. The newsletter disclaims any liability for losses or damages arising from the use of this information.
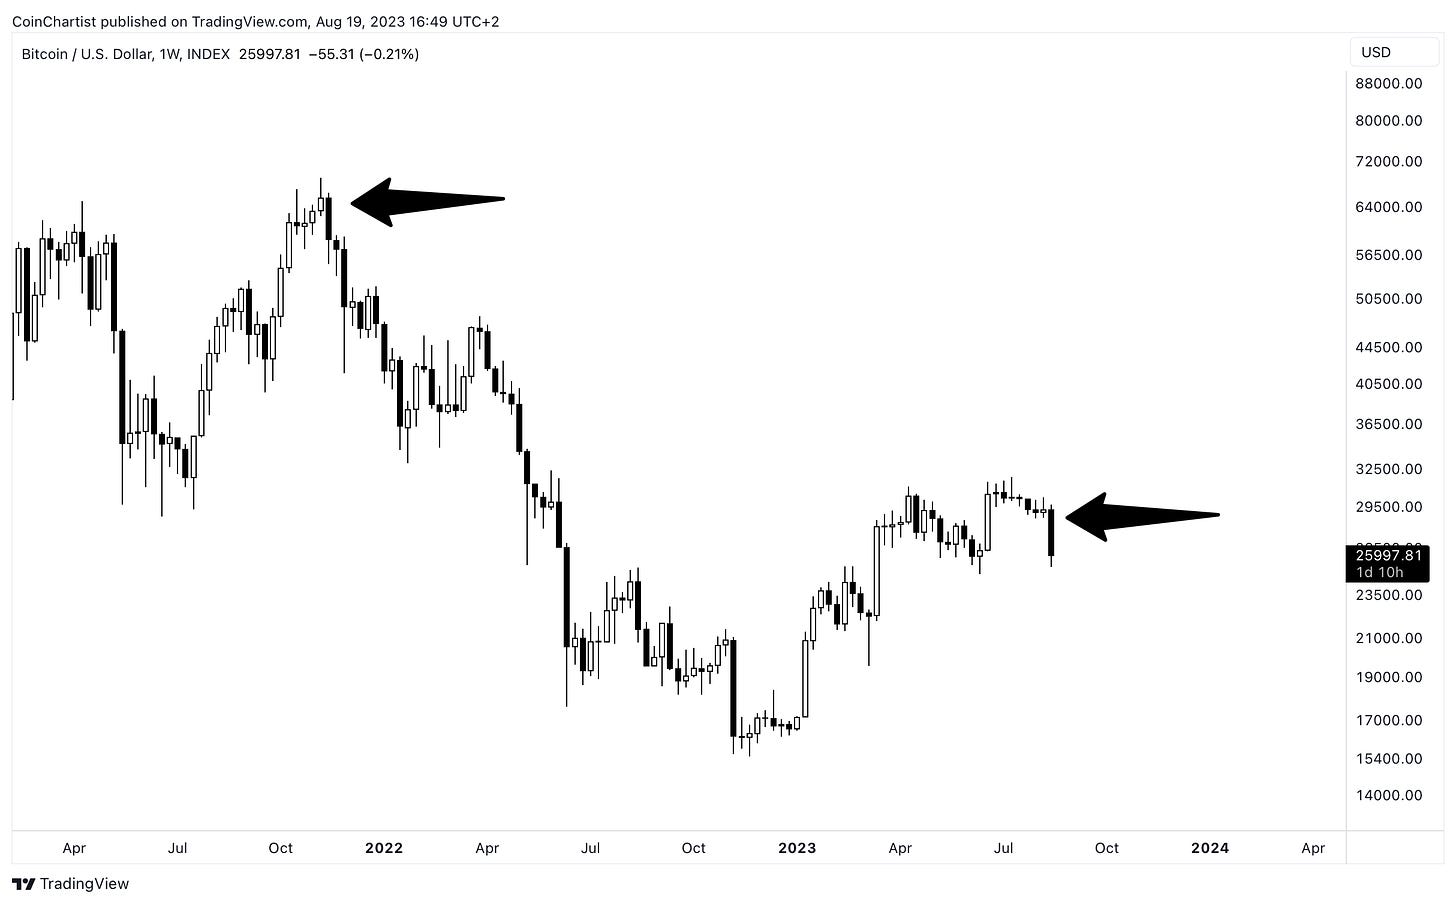
This week, we had a breakdown of the tight trading range that Bitcoin spent the better portion of several months in. As had long been promised, volatility is finally back in a major way. But BTCUSD broke down instead of up. Does this mean back to the bearish trend, or is this an opportunity to buy before a bounce?
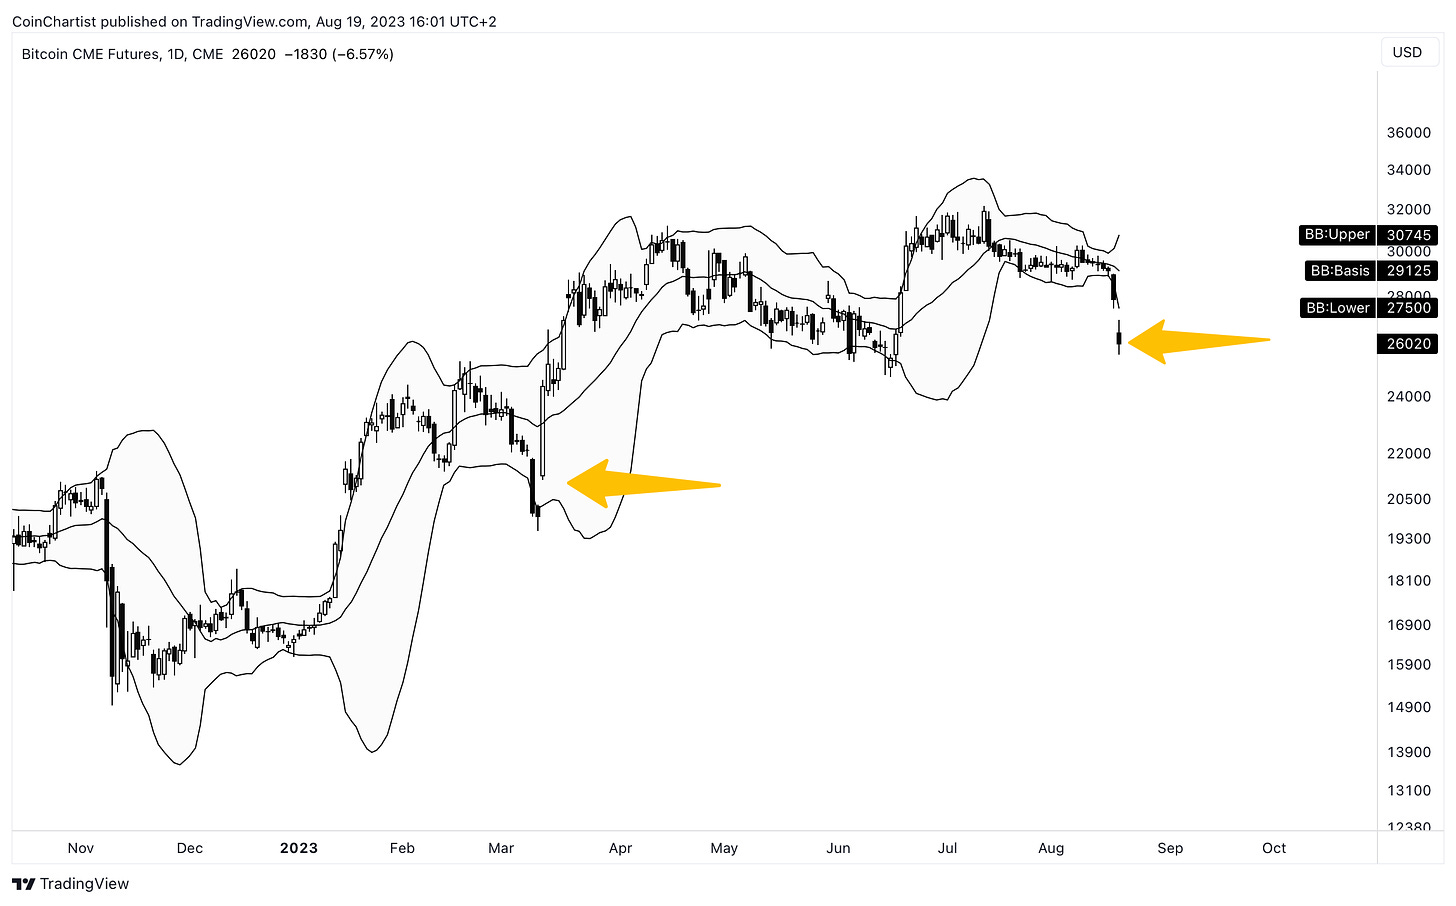
BTC CME Futures is the most dominant chart for technical signals across all Bitcoin exchange and trading platforms. This chart is currently closed down for the weekend. But when it reopens on Monday, one of two things should happen: Price will continue downward aggressively, or price will reverse back into the bands. Not pictured, but %B is the lowest in the history of the chart, meaning that Bitcoin is the furthest below the lower Bollinger Band in CME Futures history.
Learn more about the Bollinger Bands here.
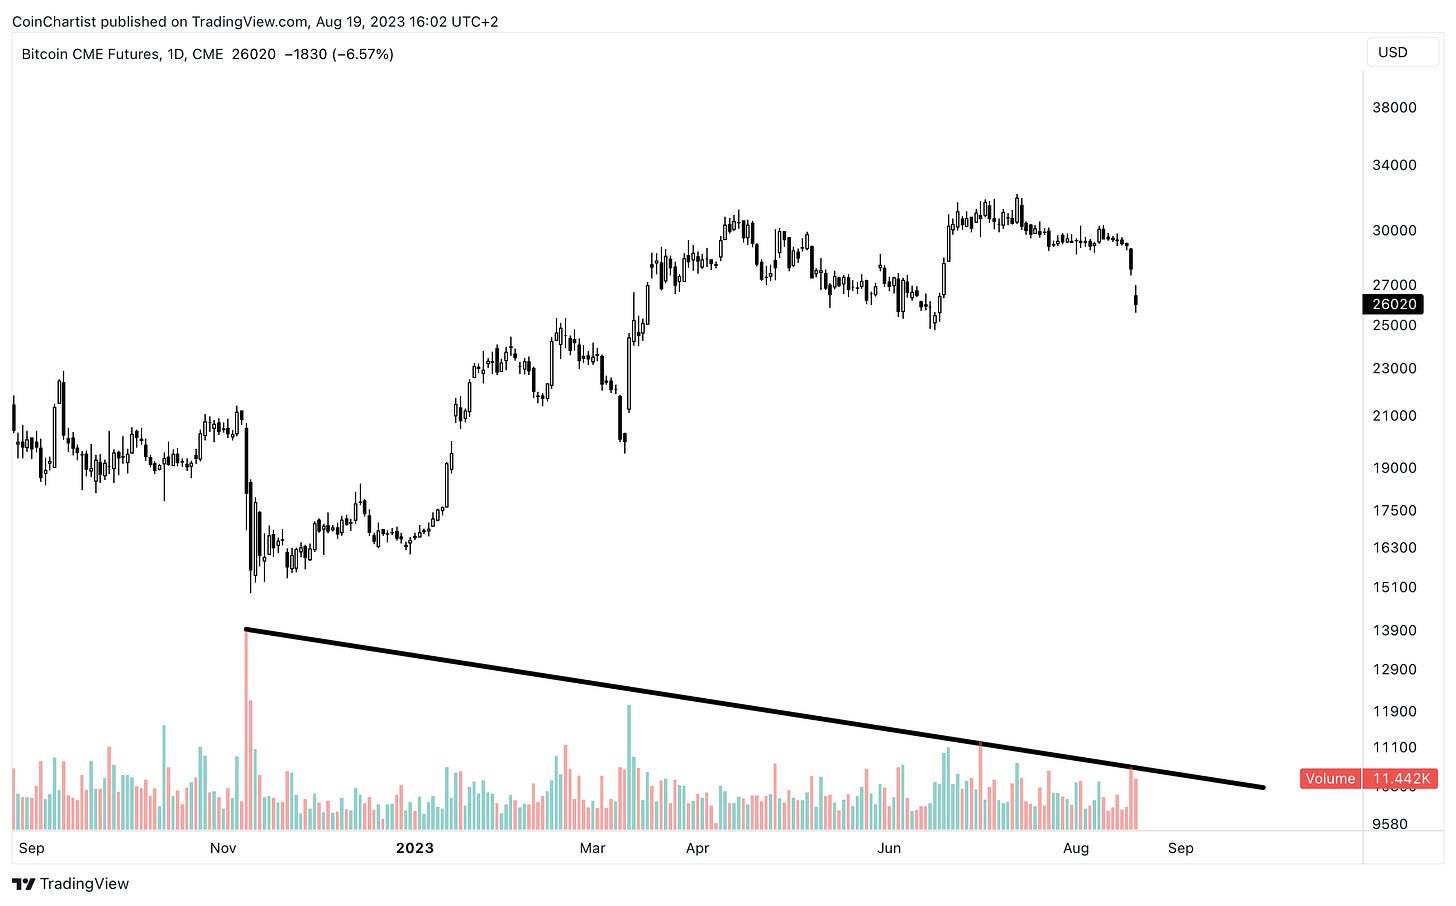
One sign that price could indeed reverse back into the Bollinger Bands is due to the lack of breakout trading volume on the way down. Considering it was one of the fastest breakdowns in Bitcoin ever, it should have come with much more of a volume surge. This could still arrive on Monday, however.
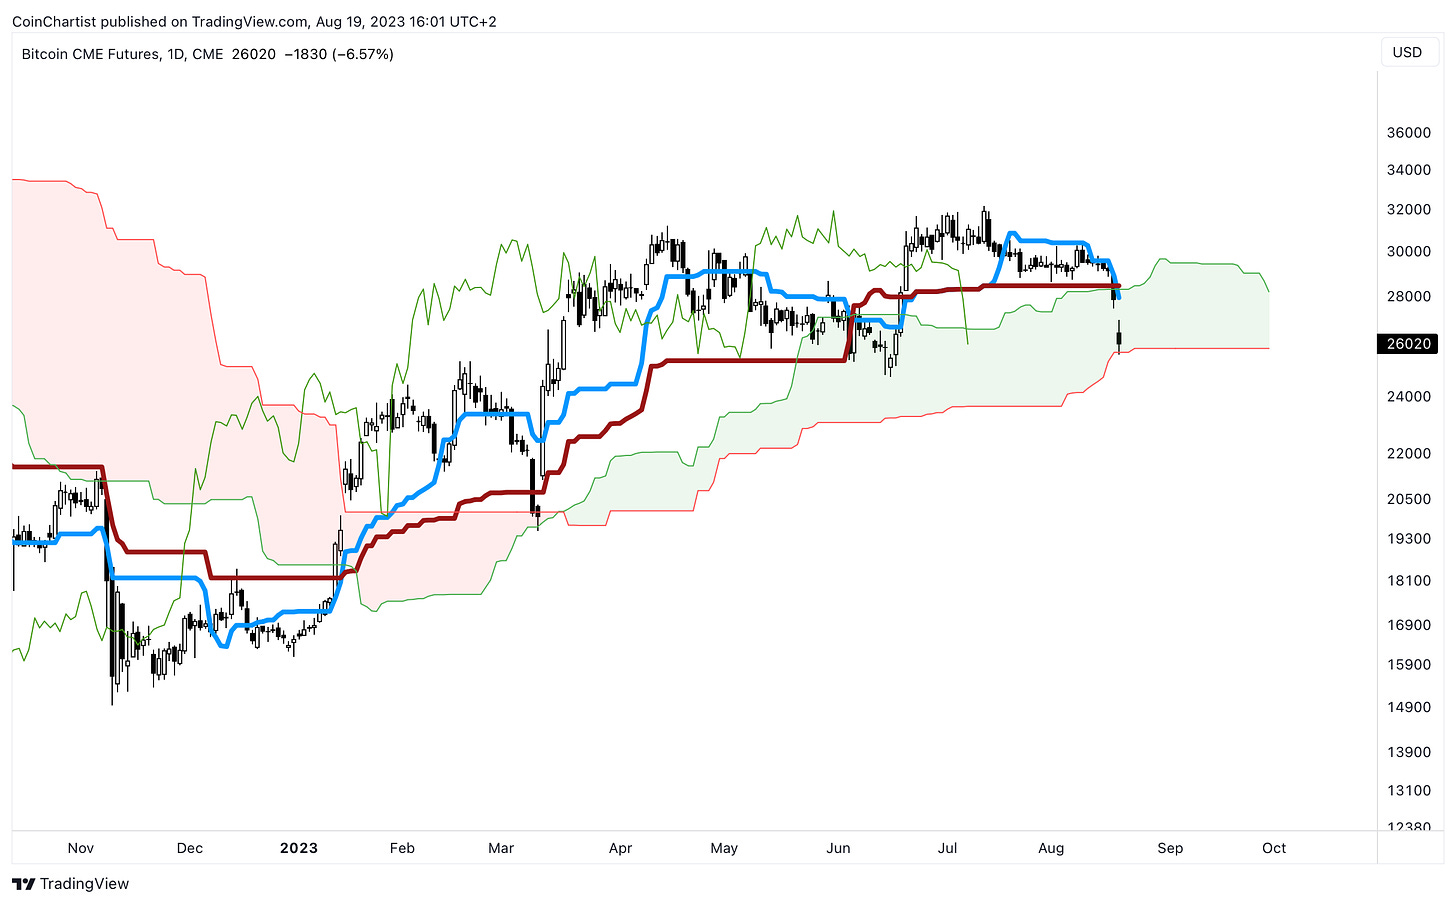
When my analysis gets tested, I turn to technical indicators that take bias out of the situation. Here, we have BTC CME Futures potentially finding support at the bottom of the Ichimoku cloud. Closing below it will be a sign that we’re dealing with a deeper correction from here. Once again, how BTC behaves on Monday will be very telling.
Learn more about the Ichimoku here.
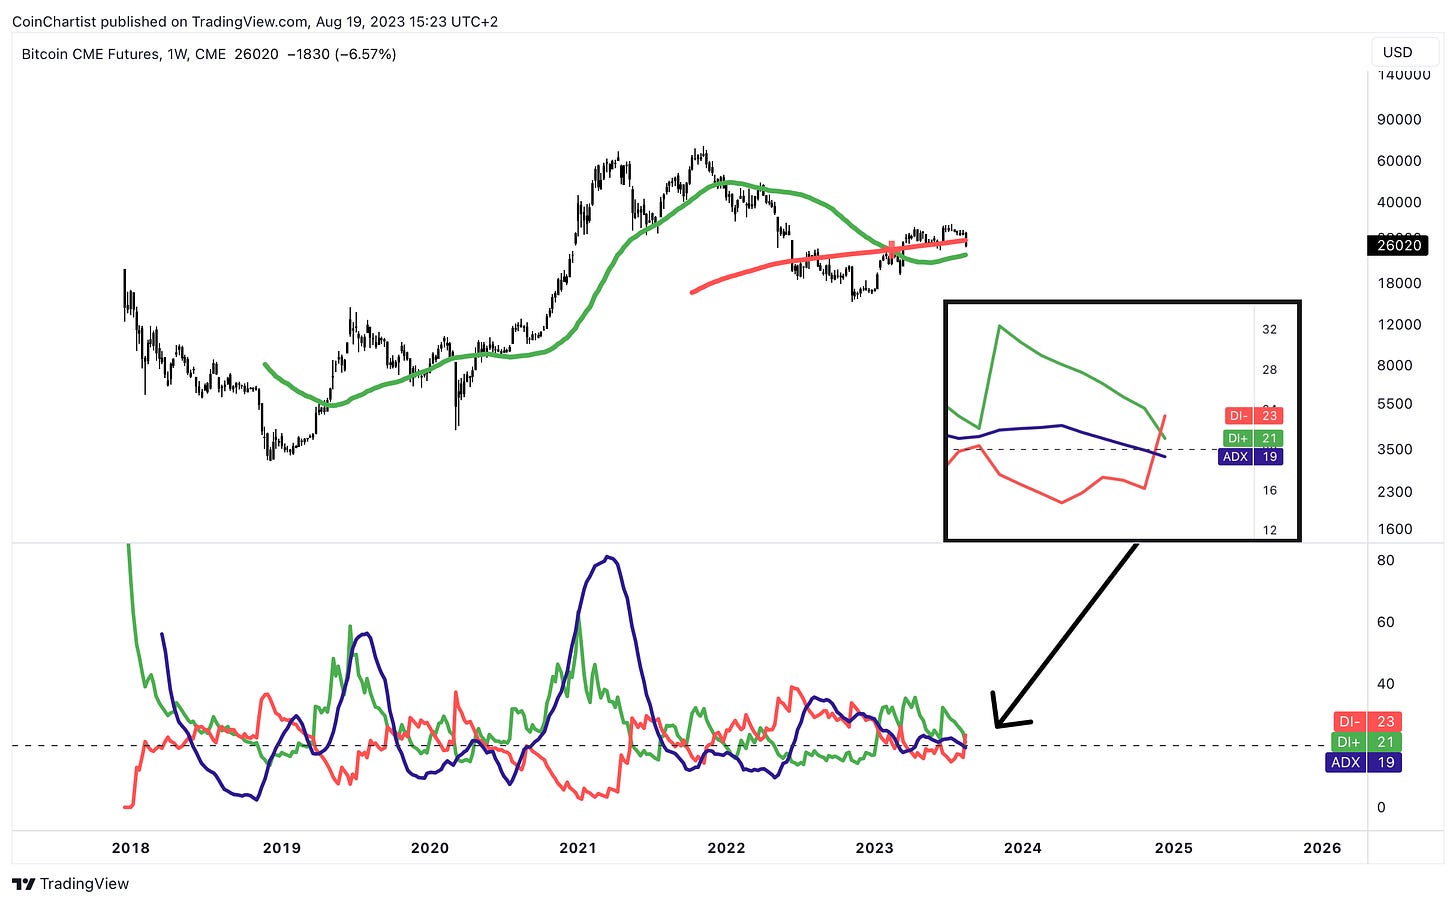
Next, I try to get a feel for trend strength and if bulls or bears are in control over Bitcoin price action. With this latest move, bears have stolen back control over BTC, but looks can be deceiving. The ADX is dropping below 20, suggesting that the trend is now weakening. Without a trend, it isn’t wise to trust trend-following tools such as the death cross currently on the weekly chart. If bears stay in control, the death cross holds, and the ADX gets back above 20, look out below.
Learn more about the Average Directional Index here.
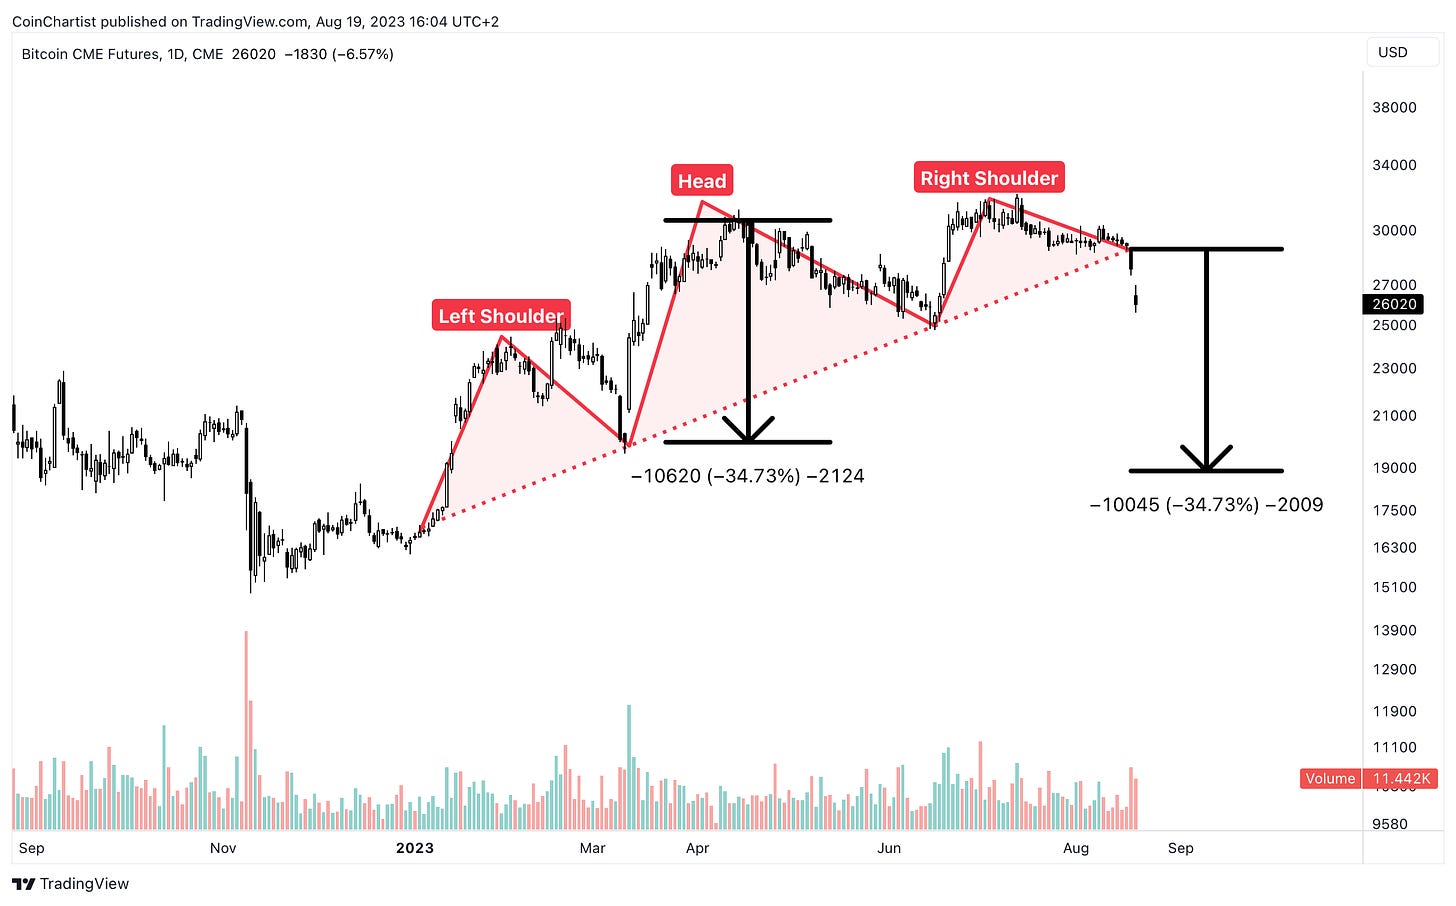
If Bitcoin were to break down further, logical targets based on the measure rule of a Head and Shoulders top project to below $20,000. Later in the Wave Watch section, I provide precise invalidation levels. Below $20,000 wouldn’t be overly concerning. Again the missing volume surge on the breakdown of the right shoulder is either suspect, or its coming next week.
Learn more about the Head and Shoulders here.
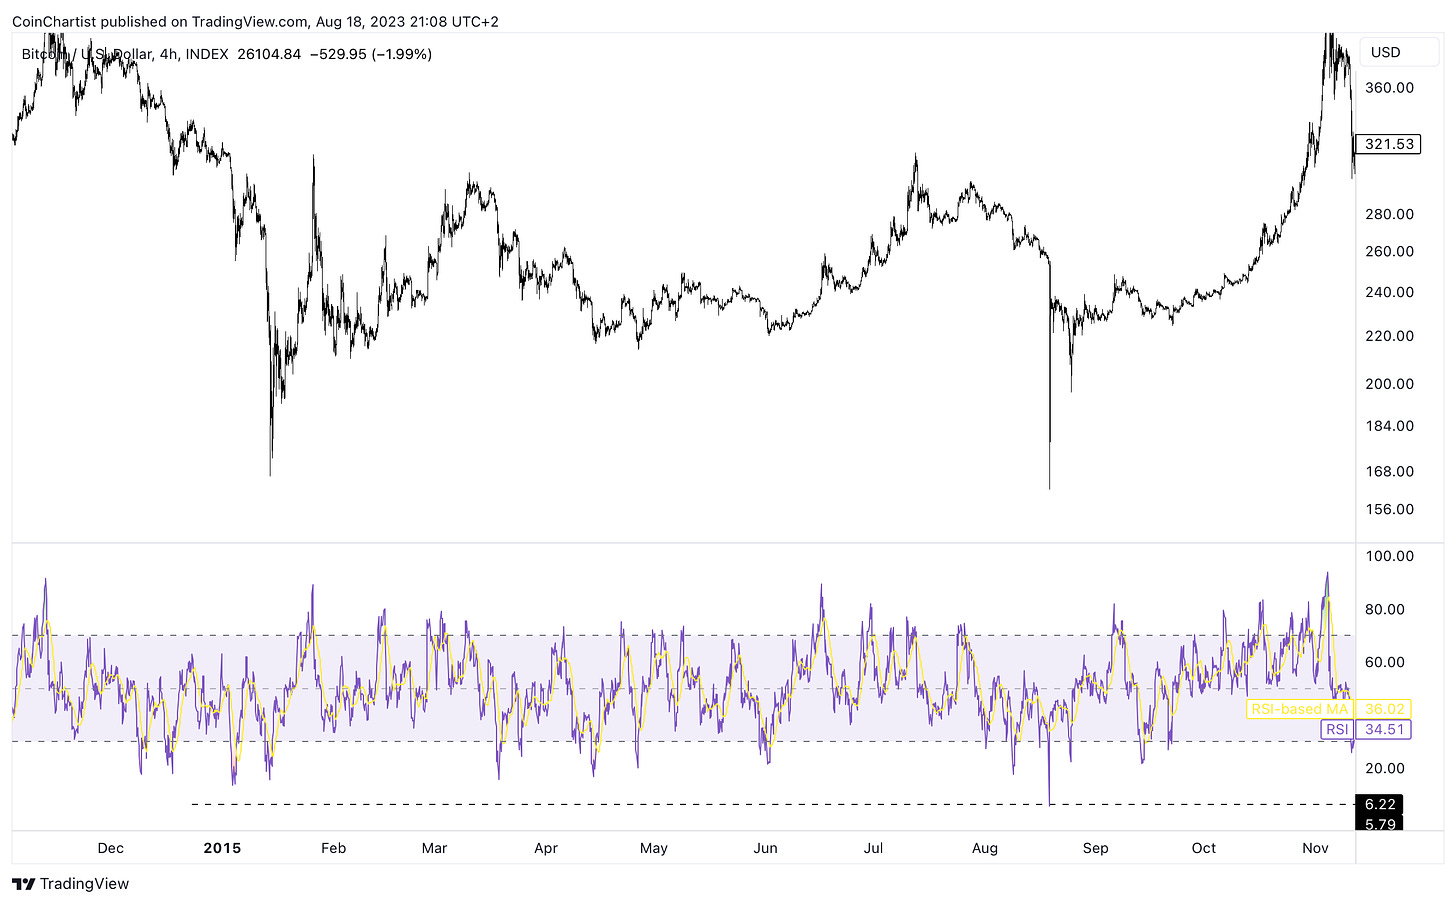
Importantly, BTCUSD is the most oversold its ever been on the 4H timeframe according to the Relative Strength Index (RSI). This includes more oversold than the FTX collapse back in November 2022. This record-breaking plunge could potentially be enough to put in some type of a bottom.
The situation reminds me very closely of the second bottom in 2015. The second test of lows happened in mid-August, around the same time seasonally as we are now. After reaching a lower low on the RSI, the bottom was confirmed and Bitcoin moved up into its strongest bull run ever.
Learn more about the Relative Strength Index here.
Bitcoin had a bloodbath with the more liquidations than during the FTX collapse. However, its chart still looks solid enough with higher highs and lows, especially if we see some reversal to kick off the next week. Altcoins, on the other hand, are looking heavier than they have in a long time. Enough for me to be increasingly concerned.
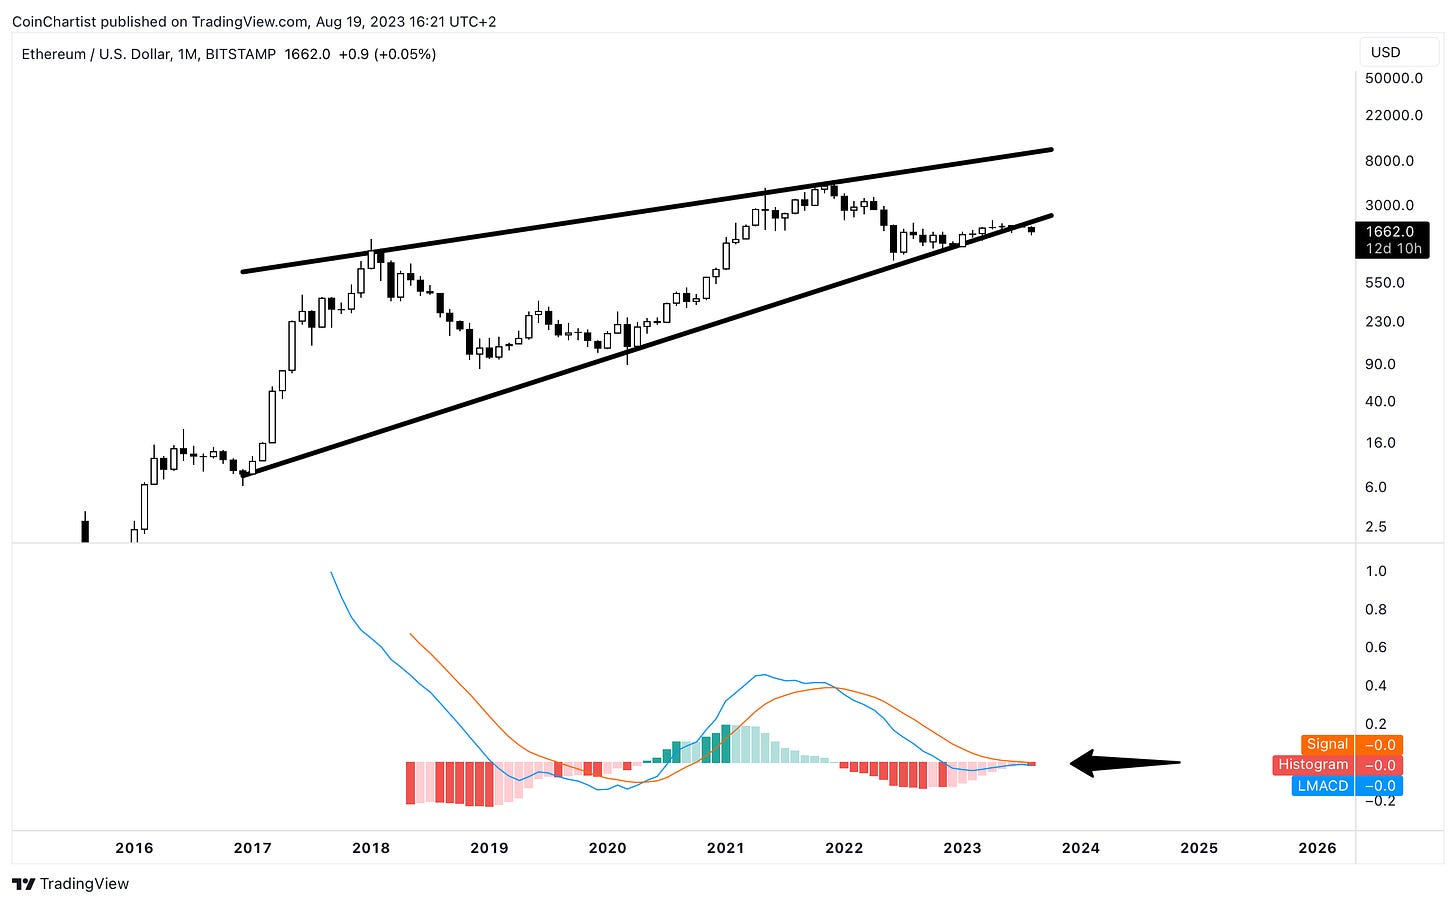
Ethereum is potentially breaking down from a massive high timeframe rising wedge, or ending diagonal pattern. Just as the trend line is failing to hold, the LMACD is turning down while below the zero line. This suggests that momentum could drag Ether much lower, unless once again there is a reversal in crypto over the next week or so.
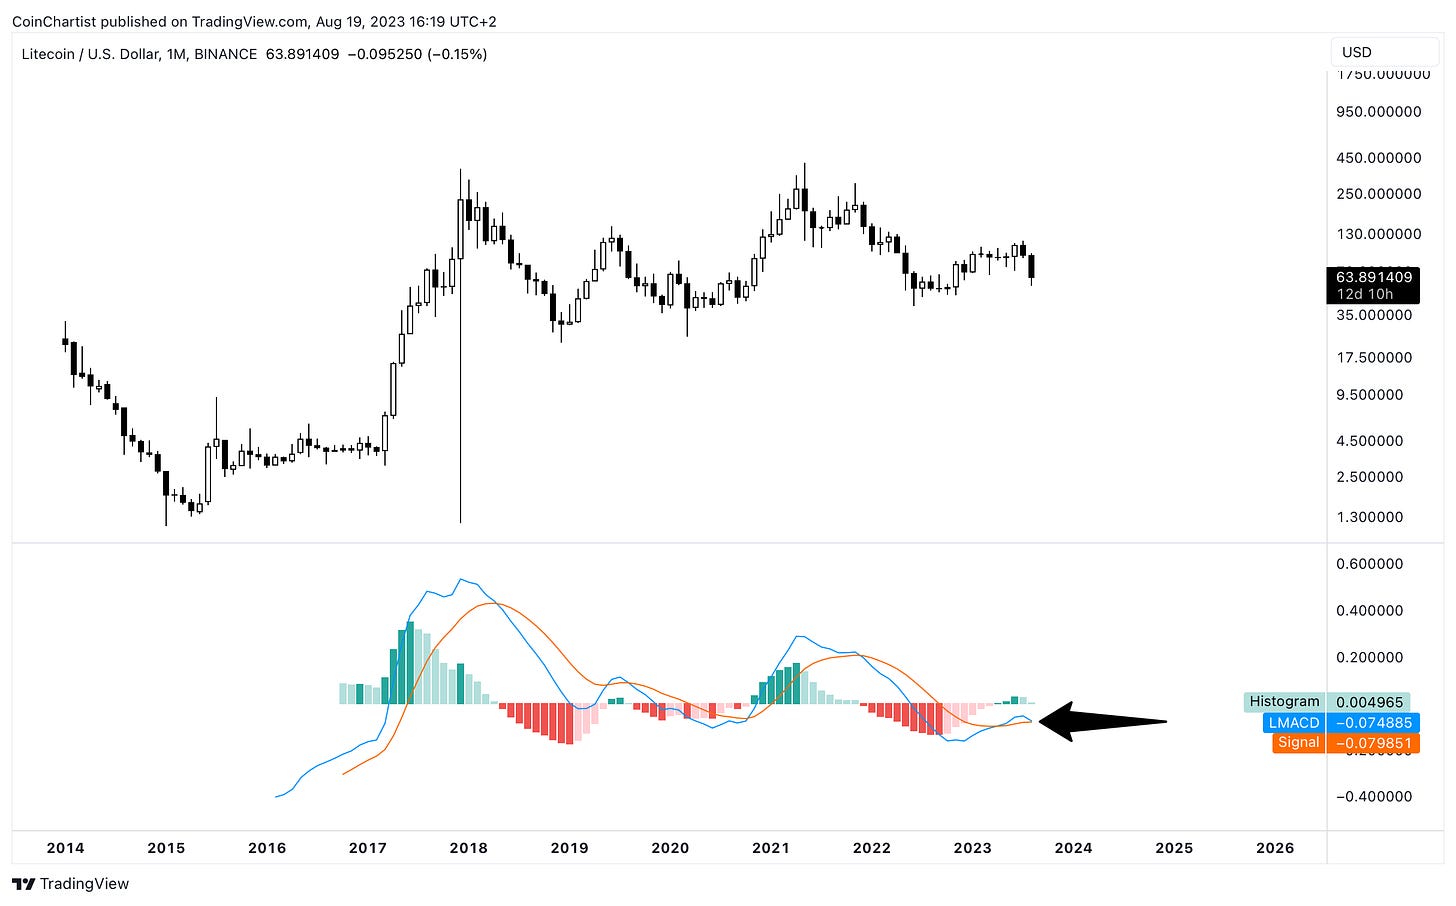
The LMACD on Litecoin is at risk of crossing back downward, while below the zero line. This is potentially worse fate than Ether, because crossing down will generate an even stronger sell signal than if the two spans were above the zero line.
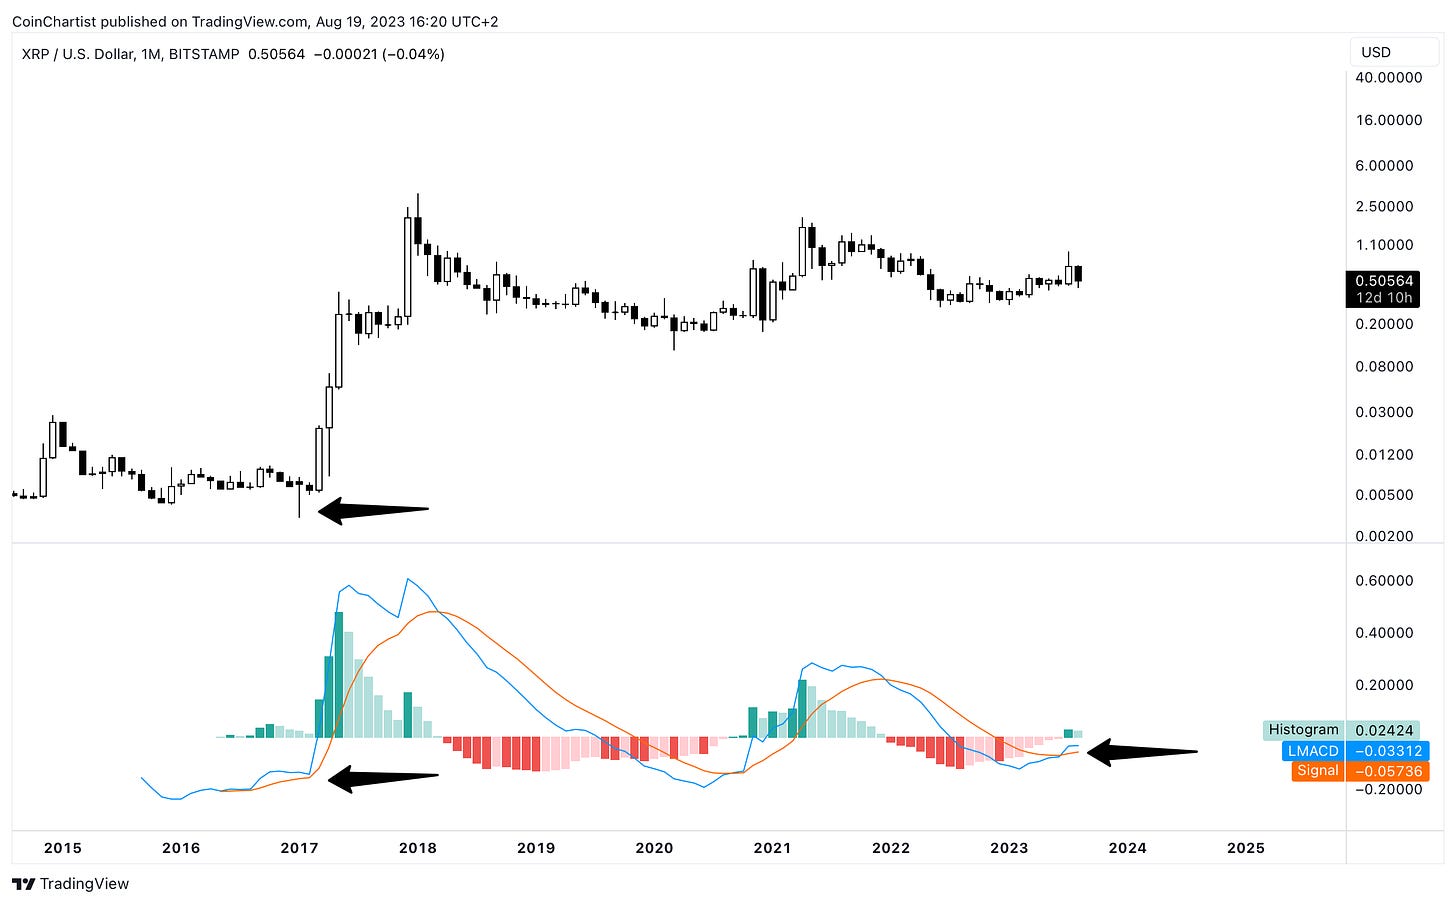
XRP finds itself in a similar situation as LTC, with the LMACD curling downward. This does not have to cross down, but it very well could. I’ve added an arrow at the 2017 breakout to show how the LMACD appeared to be decreasing, only for an upward explosion to happen after a big shakeout.
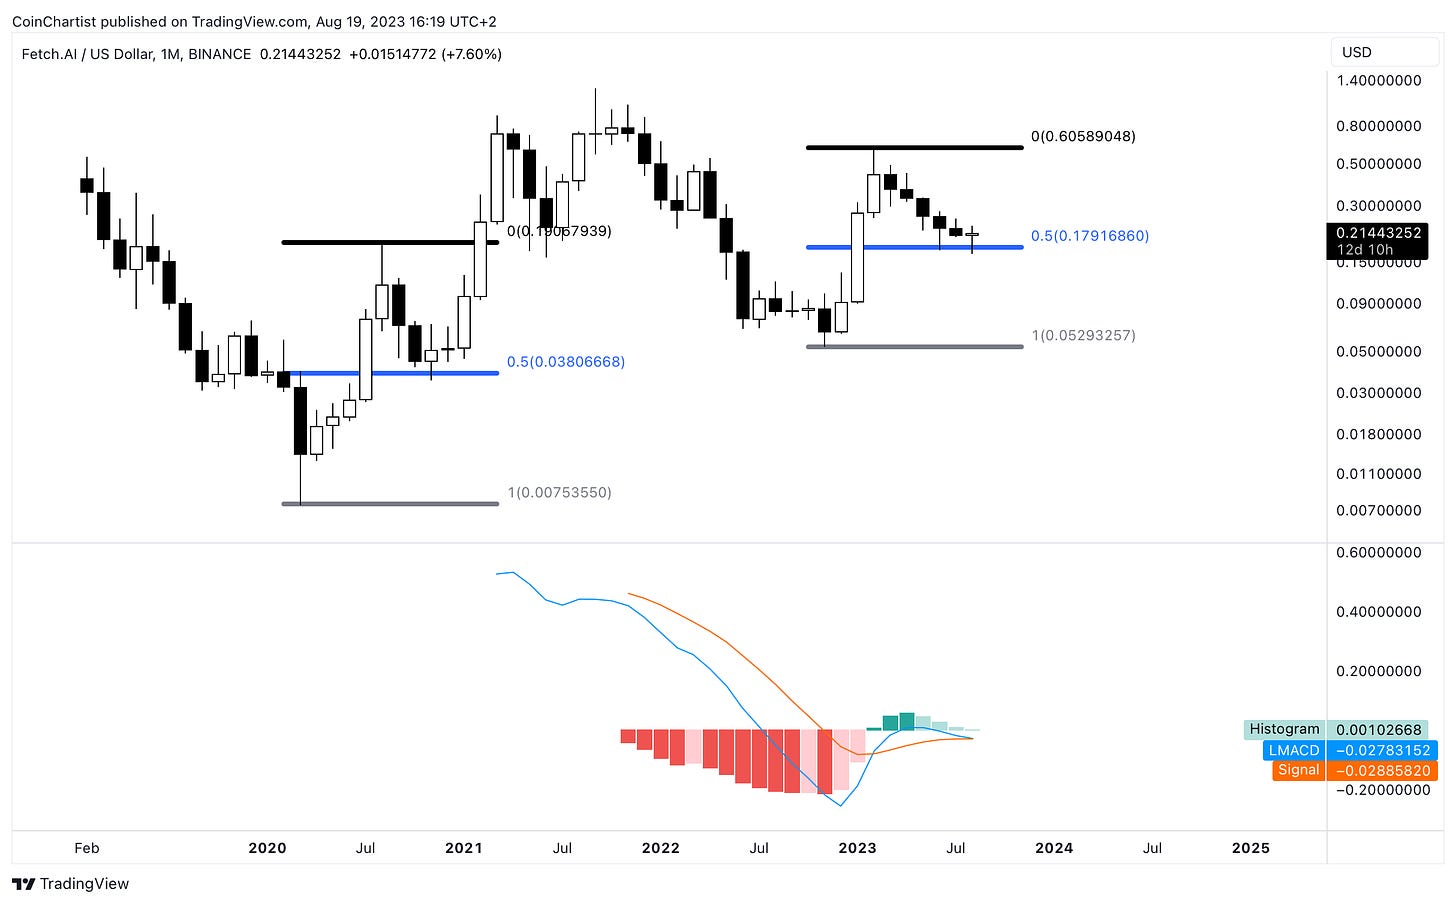
Another chart nearing a bearish crossover on the 1M LMACD is FET. FET is an AI cryptocurrency. If bulls can keep the two spans from crossing bearish, the LMACD can diverge up instead and send price and momentum along with it. My money is currently on it turning up, especially due to where it appears to be holding support — at a key 0.5 Fib level.
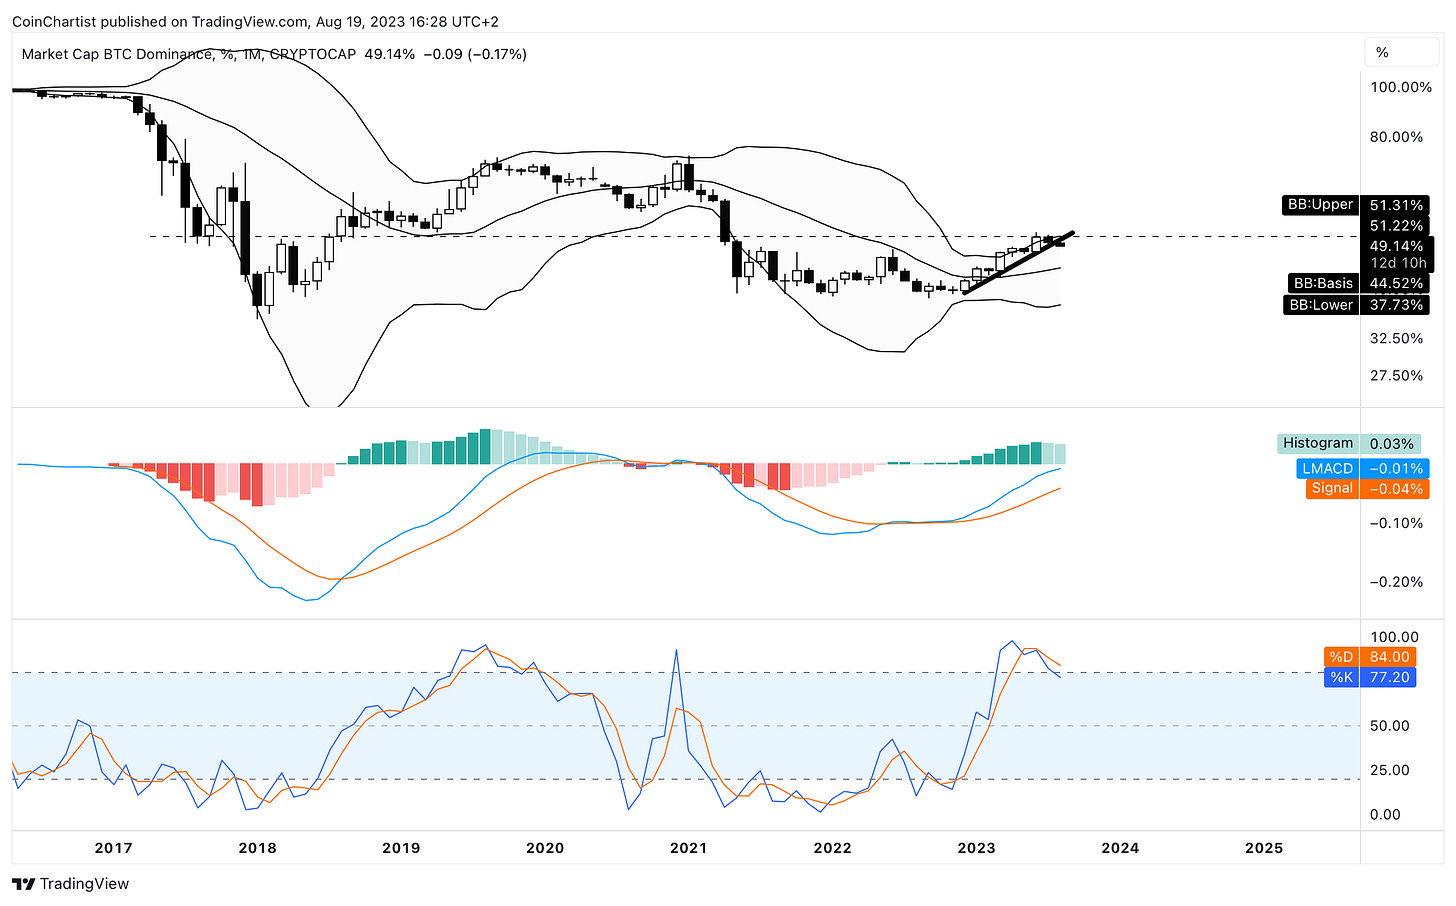
While Bitcoin is dumping, BTC dominance continues to demonstrate topping signals, with the Stochastic starting to leave overbought levels, the LMACD starting to roll over, and price reentering the Bollinger Bands after taking the upper band. These are potentially signs of a trend that’s ending.
Learn more about the Stochastic here.
A bearish Bitcoin and dropping BTC dominance doesn’t make a lot of sense. BTC dominance rises when Bitcoin outperforms alts in a risky environment. It also holds its value better over altcoins when the market is bearish. This again points to a potentially fake news in Bitcoin. But what is macro telling us?
One thing that has made me stand up and pay more attention to what’s going on around me is the fact that this selloff appears as Evergrande filed for bankruptcy. Rumors of such a bankruptcy caused the top back in 2021.
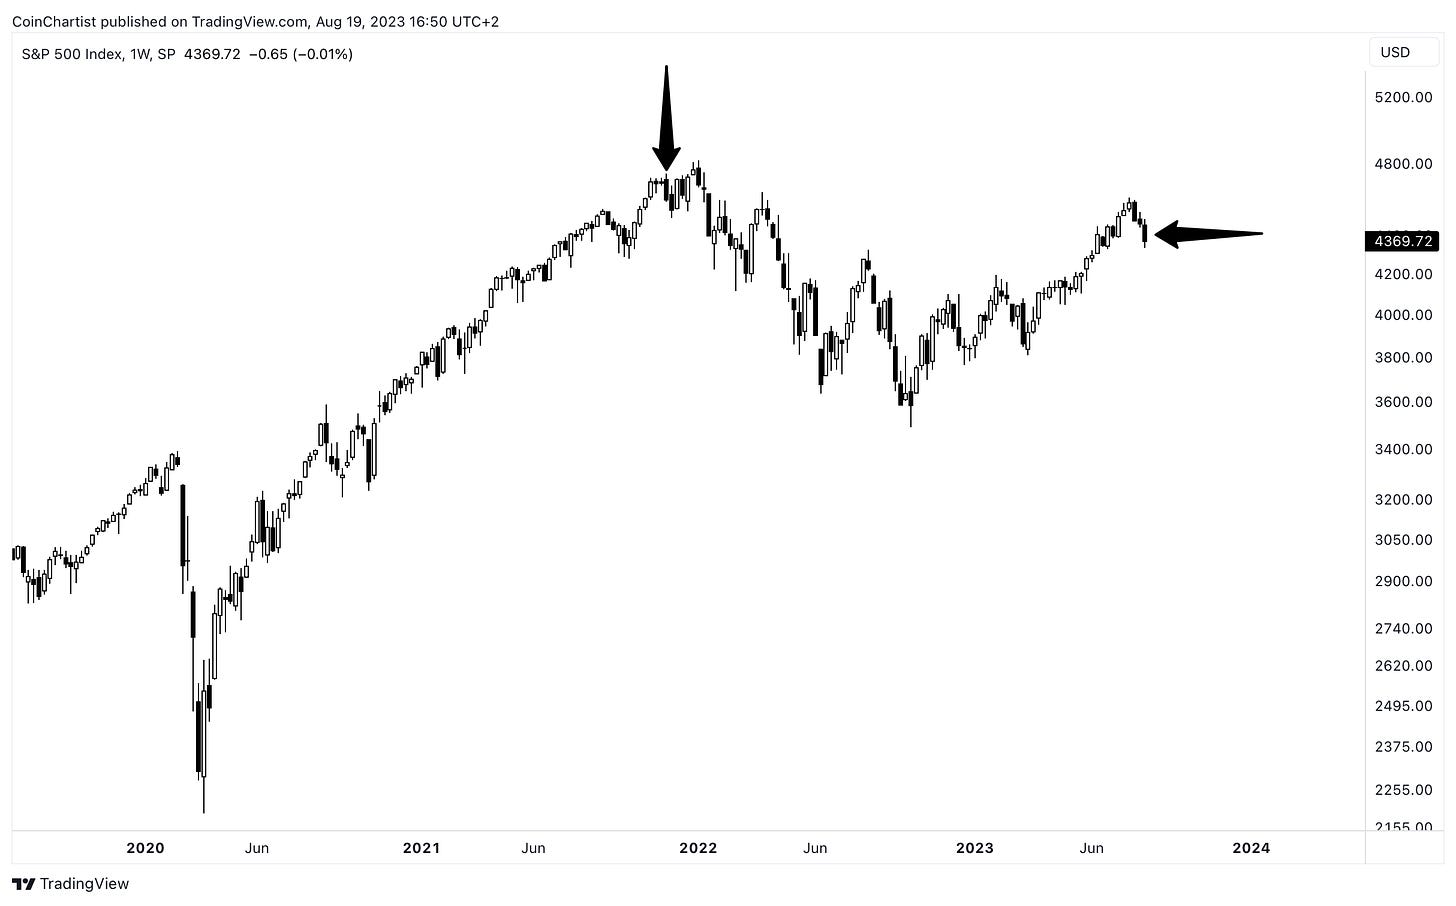
The same is true for the US stock market. If rumors of a bankruptcy led to the downtrend it did, the real thing could be disastrous. But this could also be a case of sell the rumor, buy the news. With a high probability that the market has already priced in the bankruptcy before it even happened, the actual event could cause relief.
Since China appears to be central to the recent changes in market structure, I’ve put the CNYUSD chart up against the BTCUSD chart to look for similarities. CNY outperforms USD when China injects liquidity into its economy. That same liquidity appears to be largely responsible for the biggest bull runs in Bitcoin. If the liquidity and credit cycle in China is about to start expanding to save its real estate market, it could give BTC a huge boost. If the Chinese real estate market falls apart, it could take down the global economy much like the United States’ housing market did in 2008.
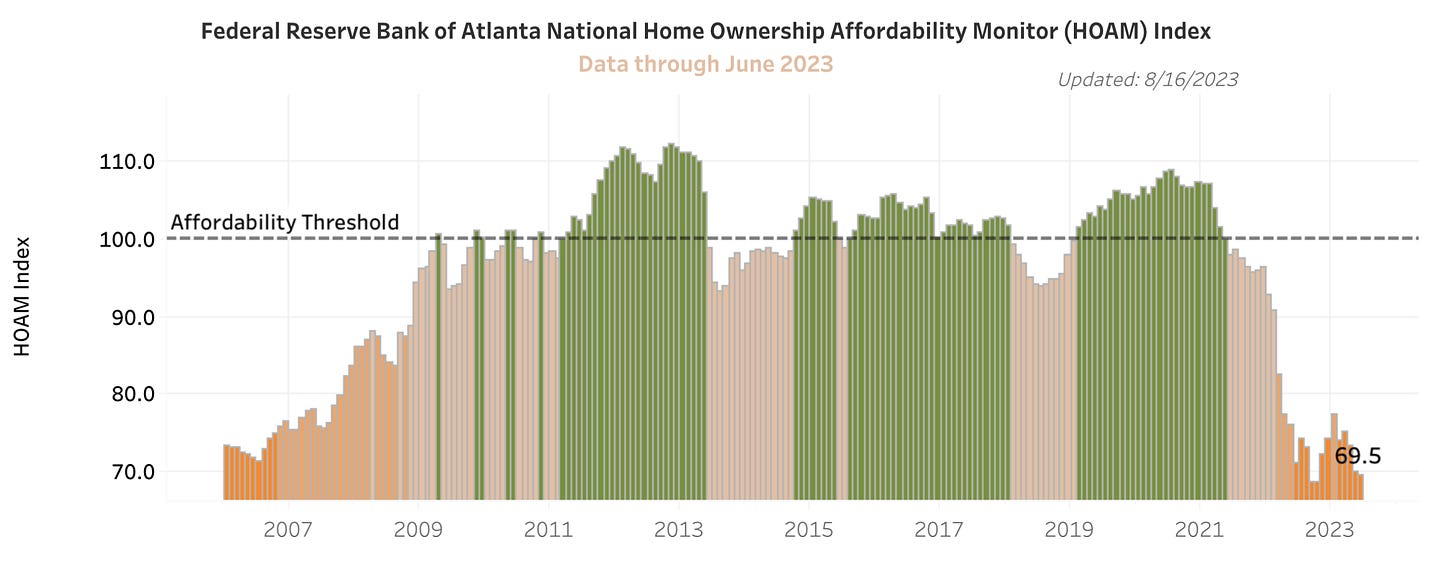
Things aren’t on solid footing in the United States, either. Housing affordability in the US is at the lowest ever thanks to the Fed’s interest rates, inflation, the cost of living, wages, etc. The last time it was at record lows, we got the Great Recession. Things are getting dicier by the day.
Important economic indicators and reports coming this week include the Purchasing Manager’s Index, New and Existing Home Sales, Consumer Sentiment, and a speech from Fed Chair Jerome Powell at Jackson Hole. Housing affordability could cause home sales to decline. A hawkish Powell could deal a death blow to a damaged stock market structure. Yet another week to watch closely.
That’s it for free content. The best content is always reserved for premium members and Founding Member VIPs.
Behind the paywall is an updated look at Bitcoin wave counts, where I provide clear invalidation levels that tell us if Bitcoin is suddenly ultra bearish again. I’ll also provide a link to the official free Elliott Wave Principle e-book for all premium subscribers.
In addition, I teach you how to chart Bitcoin using Point & Figure charts with real-time analysis using the old-school charting style.
Note: CoinChartist (VIP) Founding Member Coin NFTs are available on OpenSea. Buy one there or sign up for the Founding Member subscription through Substack to secure your favorite. Above you’ll find a list of all currently available coins. Founding Member Coins enable access to a VIP Telegram channel, 1-on-1 TA training with Tony, and more.
Keep reading with a 7-day free trial
Subscribe to CoinChartist to keep reading this post and get 7 days of free access to the full post archives.


