Issue #18 | RIP Bitcoin + Stock Market Correlation
Why crypto's correlation with the stock market could be dead, how 1970s inflation Deja Vu might impact Bitcoin, and much more.
Issue #18 of CoinChartist (VIP) overview
Why the Bitcoin uptrend is still intact
Are altcoins finding a bottom? Find out what dominance says
The stock market correlation with crypto is breaking down
1970s inflation Deja Vu and its potential impact on BTC
Wave counts in Bitcoin and a spotlight chart on XRP
An educational lesson on pitfalls of “Theoretical Perfection”
Remember, a premium subscription comes with access to custom technical indicators like the Raging Bull, Trend Wrangler, and more.
Disclaimer: The information provided in this Substack newsletter is for general informational purposes only and should not be considered as financial advice. Investing involves risk, and past performance is not indicative of future results. Please conduct your own research or consult a qualified financial advisor before making any investment decisions. The newsletter disclaims any liability for losses or damages arising from the use of this information.
After last week’s bloodbath and mass liquidations across crypto, this week was mostly calm, even despite major macro events like Powell’s speech at Jackson Hole. Rather than bringing more volatility, the dust appears to be settling and possibly setting up for the “head fake” and bounce we spoke of in last week’s issue.
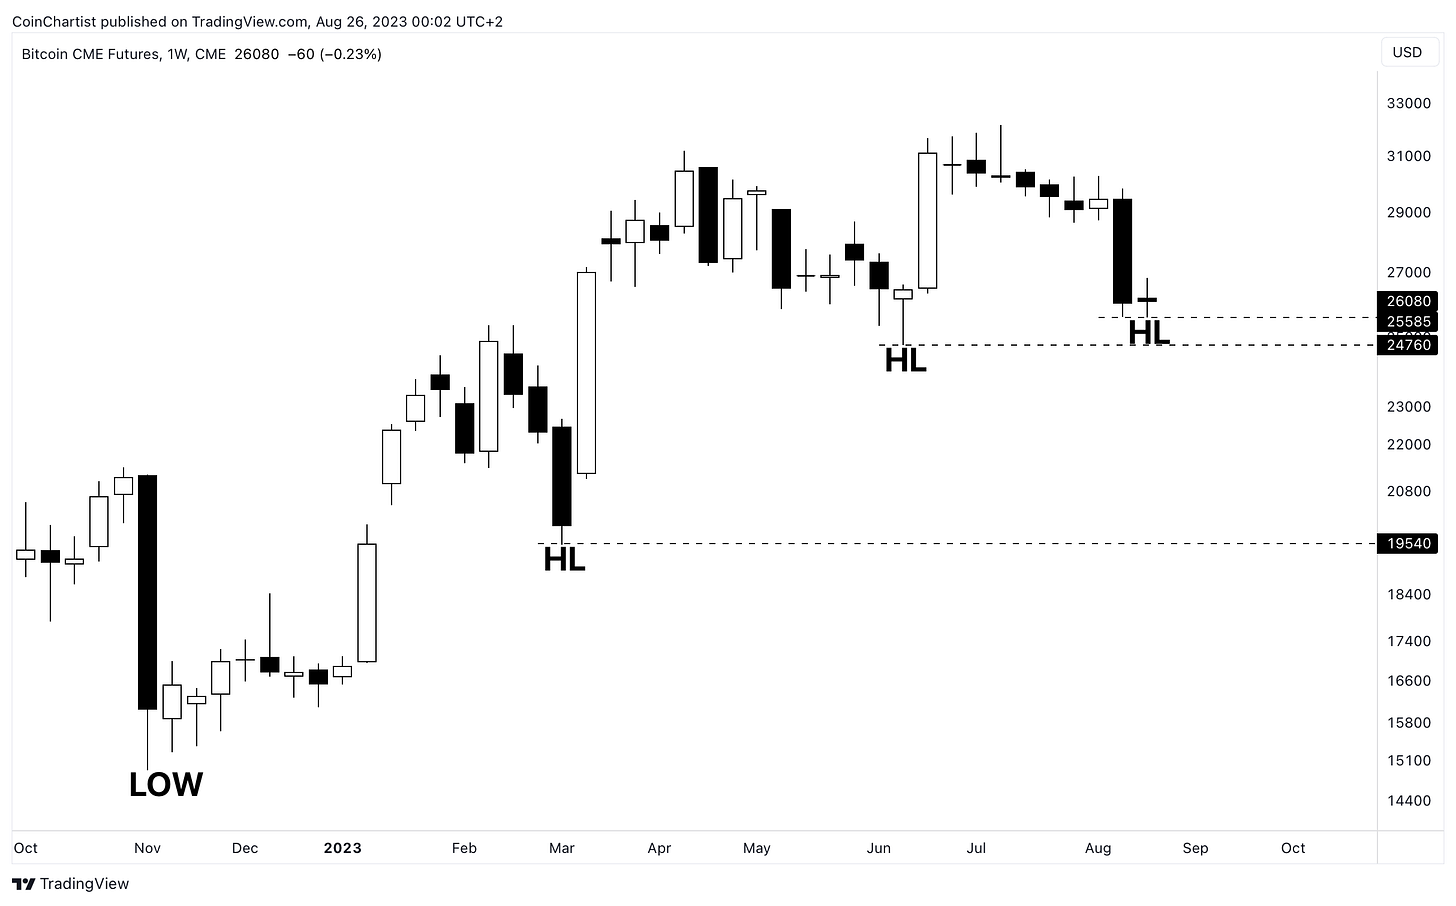
One sign that all is okay for Bitcoin even with a 10% single-day decline last week, is the fact that the structure of higher lows remains intact. A series of increasingly higher highs and higher lows is the pure definition of an uptrend. Whether or not this structure holds remains to be seen. From a psychological standpoint, this level might need to be broken to turn sentiment fully bearish. On the flip side, the uptrend structure holding could give onlookers added confidence in cryptocurrencies.
Learn more about trends in crypto here.
Another possible sign there is a safety net at this level, is the fact that BTC CME Futures held in the Ichimoku cloud on the daily timeframe. It is important to note that my Ichimoku has custom settings for cryptocurrencies due to their 24/7, 365 nature. Default Ichimoku is designed for the stock market, which closes on the weekend. That said, BTC CME closes on the weekend much like traditional markets, which could mean the tool could lose some effectiveness on this particular chart. But the zone holding here is notable nonetheless.
Learn more about the Ichimoku here.
The daily Relative Strength Index (RSI) reached a more oversold level than at any point in the last year, falling even deeper into oversold territory than during the FTX collapse. The indicator is also giving a pronounced bullish divergence between momentum and price. Bull divs this pronounced are prone to failure in my experience, however.
Learn more about the Relative Strength Index (RSI) here.
The weekly Stochastic is attempting to hinge back upward after defending the oversold level. This is a potentially bullish signal that could suggest the uptrend will hold. This weekly candle also closed with a Doji, showing indecision in the market. After a Doji, is is common to get either a reversal, or strong continuation. A reversal will see Stochastic swing back upward to overbought, while continuation down will result in a return to fully oversold readings below 20.
Learn more about the Stochastic here.
On the monthly timeframe, the indicators to keep an eye on are the Bollinger Bands and LMACD. The monthly will close by next week’s issue, meaning we will soon get more clarity if this level will hold or not. The “head fake” discussed in the last issue and the reversal setups listed above need to come to fruition this week and save the monthly, or else BTCUSD will close below the monthly Bollinger Band basis and the 1M LMACD will open red. Monthly momentum has never turned down in below the zero line ever in Bitcoin history, and could lead to a devastating downward move – unless bulls can save the monthly.
Learn more about the Bollinger Bands here.
Altcoins that had appeared to be ready to soar were decimated in last week’s selloff in Bitcoin. While BTC dropped 10%, alts fell between 20 and 40%. In particular, Litecoin lost 40% of its value since local pre-halving highs. But the worst might be behind us, according to Bitcoin dominance.
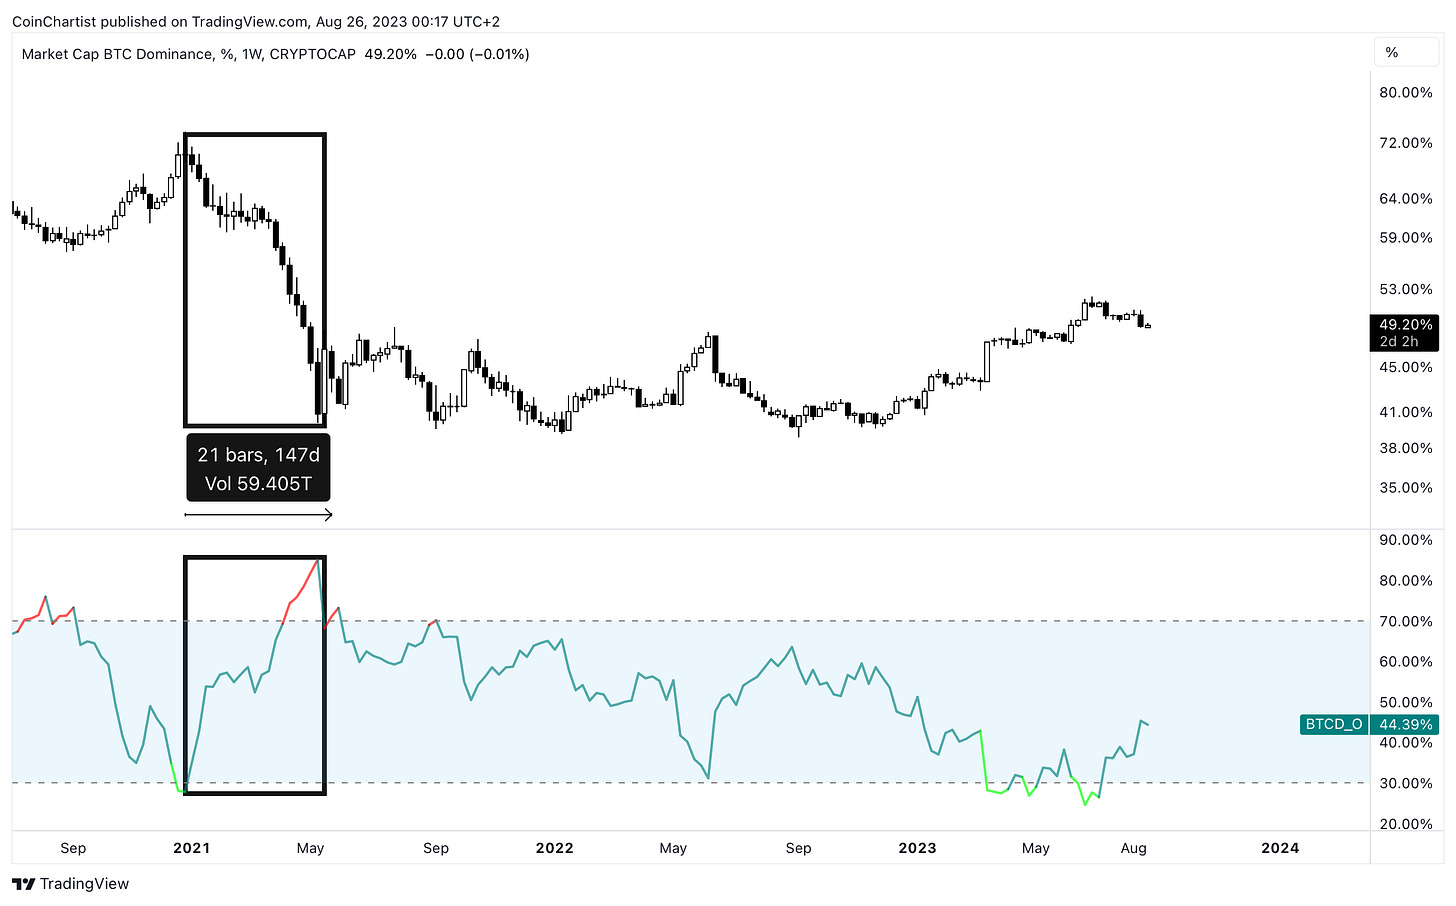
The Bitcoin Dominance Oscillator, which measures the relationship between Bitcoin and altcoins, has reached a level that the last time prompted a sharp and sudden altcoin season. When measured, this altcoin season lasted only 150 days, or just around 5 months of meme coin mania. Will we see something similar again?
It’s possible, but it might not happen just yet. The Bitcoin Dominance Oscillator of the 1W BTC.D chart still has downtrend resistance to deal with. A breakout could lead to a more substantial move in altcoins against Bitcoin.
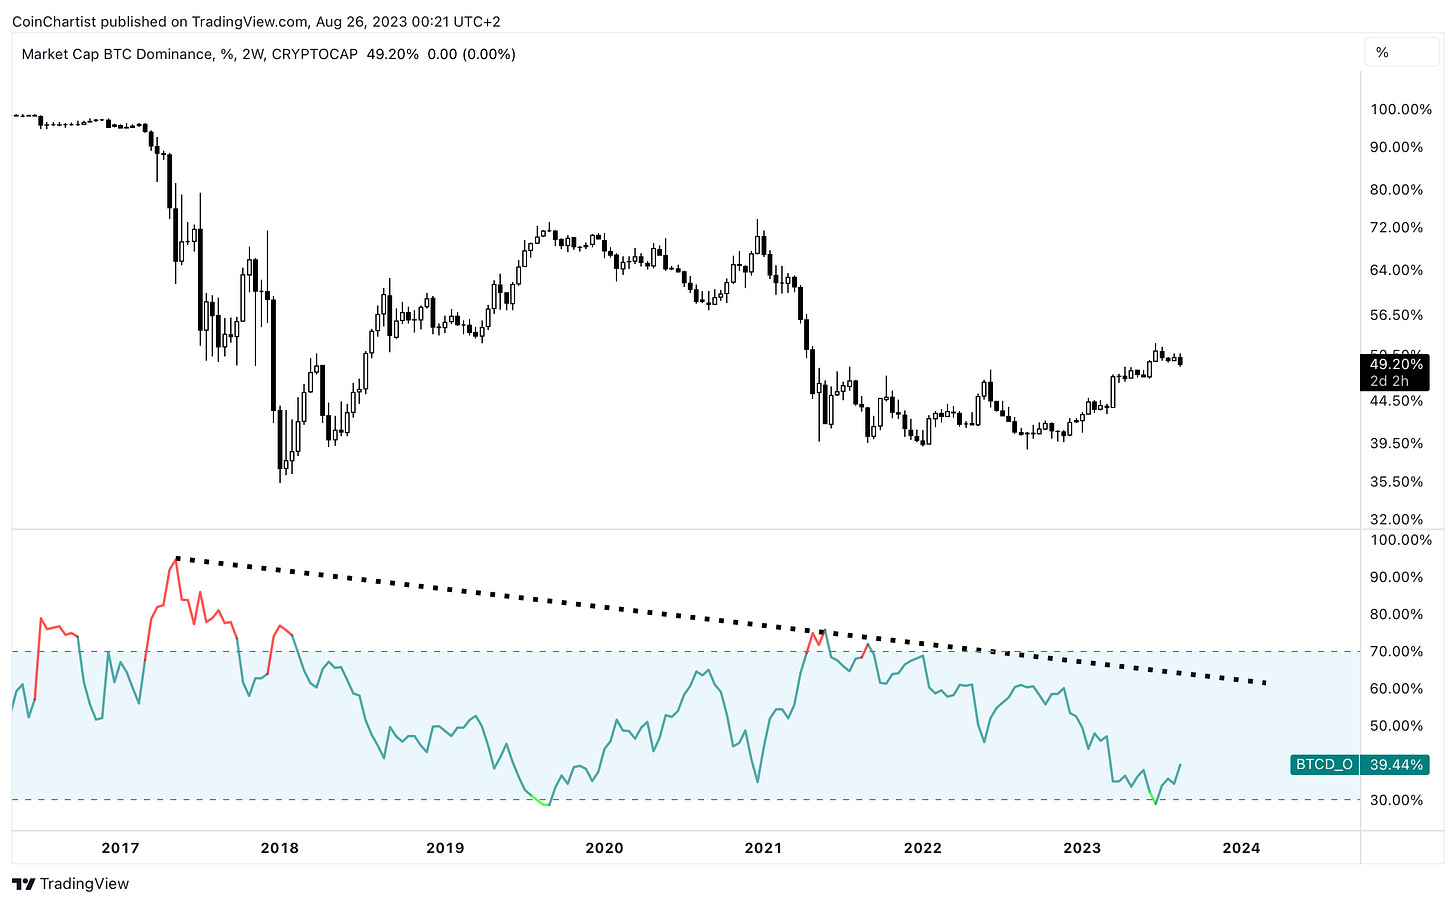
On slightly higher timeframes, like the 2W pictured here, the Bitcoin Dominance Oscillator has once again bottomed out, but instead of matching the recent altcoin season, it instead matches the prior bottom in late 2019. When Bitcoin finished its rally back then, funds started to flow into altcoins. This situation suggests that there could be more time to wait for an altcoin season, despite the above signals.
The ETHBTC chart has been notably bearish for months, but ETH Dominance (ETH.D) doesn’t look quite as bad. In fact, it could be in the midst of putting in a right shoulder and any attempts to move beyond the neckline of this several year Inverse Head and Shoulders pattern should be given extra attention.
As mentioned, Litecoin took a serious beating post-halving. This was not what I expected, and it was enough to send LTC Dominance (LTC.D) tumbling back down to retest a downtrend resistance line. If this retest holds, and LTC.D moves back up, it’s possible it completes an Inverse Head and Shoulders pattern much like Ether above. Several top altcoins moving to new highs in dominance supports Bitcoin Dominance sharply dropping.
Learn more about the Inverse Head and Shoulders pattern here.
For months now, we’ve been patiently waiting for Bitcoin and crypto to follow the stock market which has been soaring to new highs in the tech sector. The belief this would happen was based on a strong correlation with Nvidia, the Nasdaq, and even the S&P 500. The lack of crypto following traditional markets may have broken the growing correlation between stocks and digital currencies for the near term.
The star of markets last week was Nvidia, smashing earnings expectations and making another new all-time high. Sellers immediately stepped in and wiped out the daily candle after the earnings report caused euphoria in investors. With NVDA doing so well, and Bitcoin crashing, I brought up the Correlation Coefficient chart between it and BTCUSD. Much like the uptrend in price explained earlier, the uptrend of higher lows on the Correlation Coefficient has been broken, and the first lower low is being put in. The relationship could reverse back to highs, but the breakdown is this long-standing correlation could be notable.
The same sort of strengthening correlation is also at risk of breaking down between Bitcoin and the S&P 500. The SPX chart above doesn’t yet have a lower low in the Correlation Coefficient like Nvidia, but it could be coming in the future. For this to happen, prices need to diverge further. If the stock market corrects, and crypto pumps, this is one scenario where this happens. Otherwise, the stock market would continue up, and Bitcoin move back down. Once again, it is a situation to keep an eye on that deviates from the normal expectations on how these loosely related markets behave.
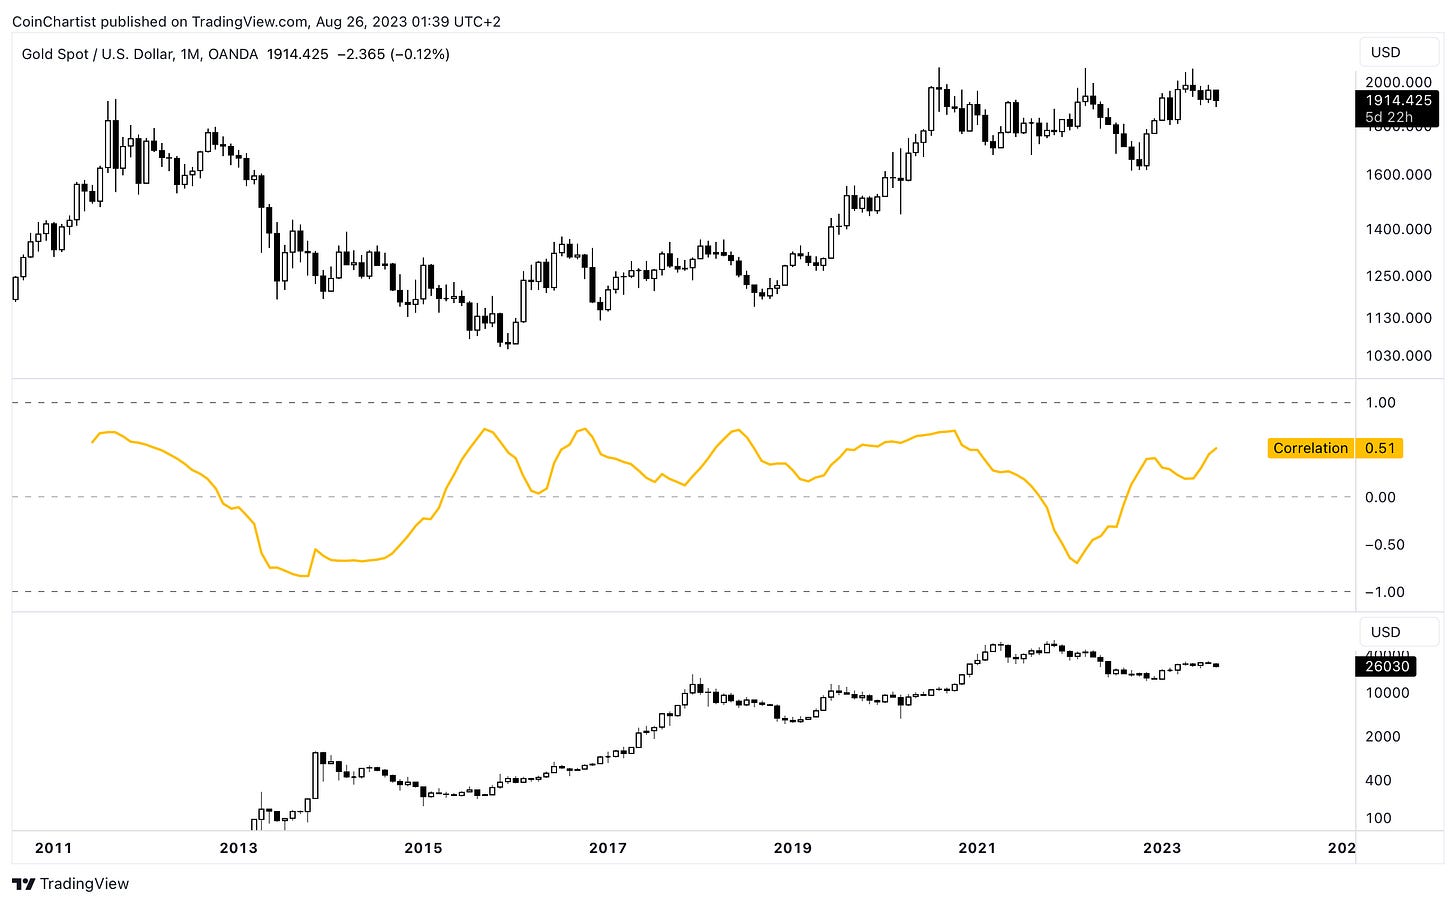
While the correlation between BTCUSD and stocks is fading, the Correlation Coefficient shows that the correlation with Gold is strengthening instead. This correlation was the strongest all throughout 2015 and only began to disappear in 2020. The fact it is returning could ultimately bode well for Bitcoin in the longer term, especially if the stock market is running out of steam, and there is a rotation from soft to hard assets.
Putting Bitcoin up against Gold directly on the XAUBTC chart shows a clear defense of the 1M Bollinger Band Basis. If this holds, Bitcoin will outperform Gold in the near to medium-term. If it is lost, Gold will beat BTC for the next several weeks to months.
The point of the XAUBTC chart was less to discuss the trading pair between Bitcoin and Gold, but instead to demonstrate the strange similarity between this DXY/BTCUSD chart. Unlike the normal BTCUSD monthly chart, which has already lost the 1M Bollinger Band basis, the DXY/BTCUSD chart is still defending it. Importantly, Bitcoin made it beyond the basis on this chart before it did the traditional BTCUSD 1M chart.
The chart that made rounds the most this week in my world was the Consumer Price Index year-over-year percent change chart and how it “mirrors” the 1970s inflationary era.
In the early 1970s, inflation reached over 10% causing abnormal price increases. The metric eventually cooled off, much like it is right now. After a cooling phase, however, inflation made yet another high, rising beyond 14% year-over-year. With the 1970s superimposed behind present CPI figures, it is easy to see why the chart is so eye-opening. If this is the case, consumers haven’t seen anything yet for peak prices.
This is something that my Telegram users were made aware of as early as October 2022, when inflation began to cool off. Inflation is driven by one of two things: high demand, or low supply. Consumer demand can create what’s called a “bullwhip effect” where demand rises and falls in a widening pattern. This occurs because the first waves of increasing inflation are met with the acceptance of higher prices, and wages are increased to match the environment. When inflation comes down, higher wages and spending remains, causing yet another surge of demand. It is during this extreme demand phase where employers are no longer willing to pay higher wages, employees are no longer willing to pay higher prices, and a recession could arrive.
But how could this impact Bitcoin? The answer is for premium subscribers.
That’s it for free content. The best content is always reserved for premium members and Founding Member VIPs.
Behind the paywall is an updated look at Bitcoin wave counts, a possible XRP wave count, and an educational lesson looking at a common mistake investors and traders make.
Also, don’t miss the conclusion to the Special Spotlight section on inflation Deja Vu and its impact on Bitcoin.
Note: CoinChartist (VIP) Founding Member Coin NFTs are available on OpenSea. Buy one there or sign up for the Founding Member subscription through Substack to secure your favorite. Above you’ll find a list of all currently available coins. Founding Member Coins enable access to a VIP Telegram channel, 1-on-1 TA training with Tony, and more.
Keep reading with a 7-day free trial
Subscribe to CoinChartist to keep reading this post and get 7 days of free access to the full post archives.


