


Issue #19 | Mixed Signals
Issue #19 | Mixed Signals
Why Bitcoin hasn't turned bearish (yet), how altcoins can avoid doom, stock market all-time highs, and much more.
Issue #19 of CoinChartist (VIP) overview
Comparing Bitcoin now to COVID-free BTC in 2020
Altcoins giving mixed signals: A closer look at Ethereum, XRP, & Litecoin
The end of the stock market rally, or new all-time highs?
New section! BTC Miners outperform crypto, but why?
A new wave count pointing to the “end” of the Bitcoin bull market
An extremely important Chart Class lesson on the BTCUSD Evening Star that formed in August
Remember, a premium subscription comes with access to custom technical indicators like the Raging Bull, Trend Wrangler, and more.

Disclaimer: The information provided in this Substack newsletter is for general informational purposes only and should not be considered as financial advice. Investing involves risk, and past performance is not indicative of future results. Please conduct your own research or consult a qualified financial advisor before making any investment decisions. The newsletter disclaims any liability for losses or damages arising from the use of this information.

This week was yet another painful week in Bitcoin, driven first by a euphoric recovery surrounding a positive ruling in the Grayscale case against the SEC. The euphoria was short-lived, as price was rejected and the entire rally retraced. Worse-yet, the failure to follow through left BTCUSD with an ugly monthly close. Despite the downside, an important indicator suggests bulls have the upper hand still, for now.
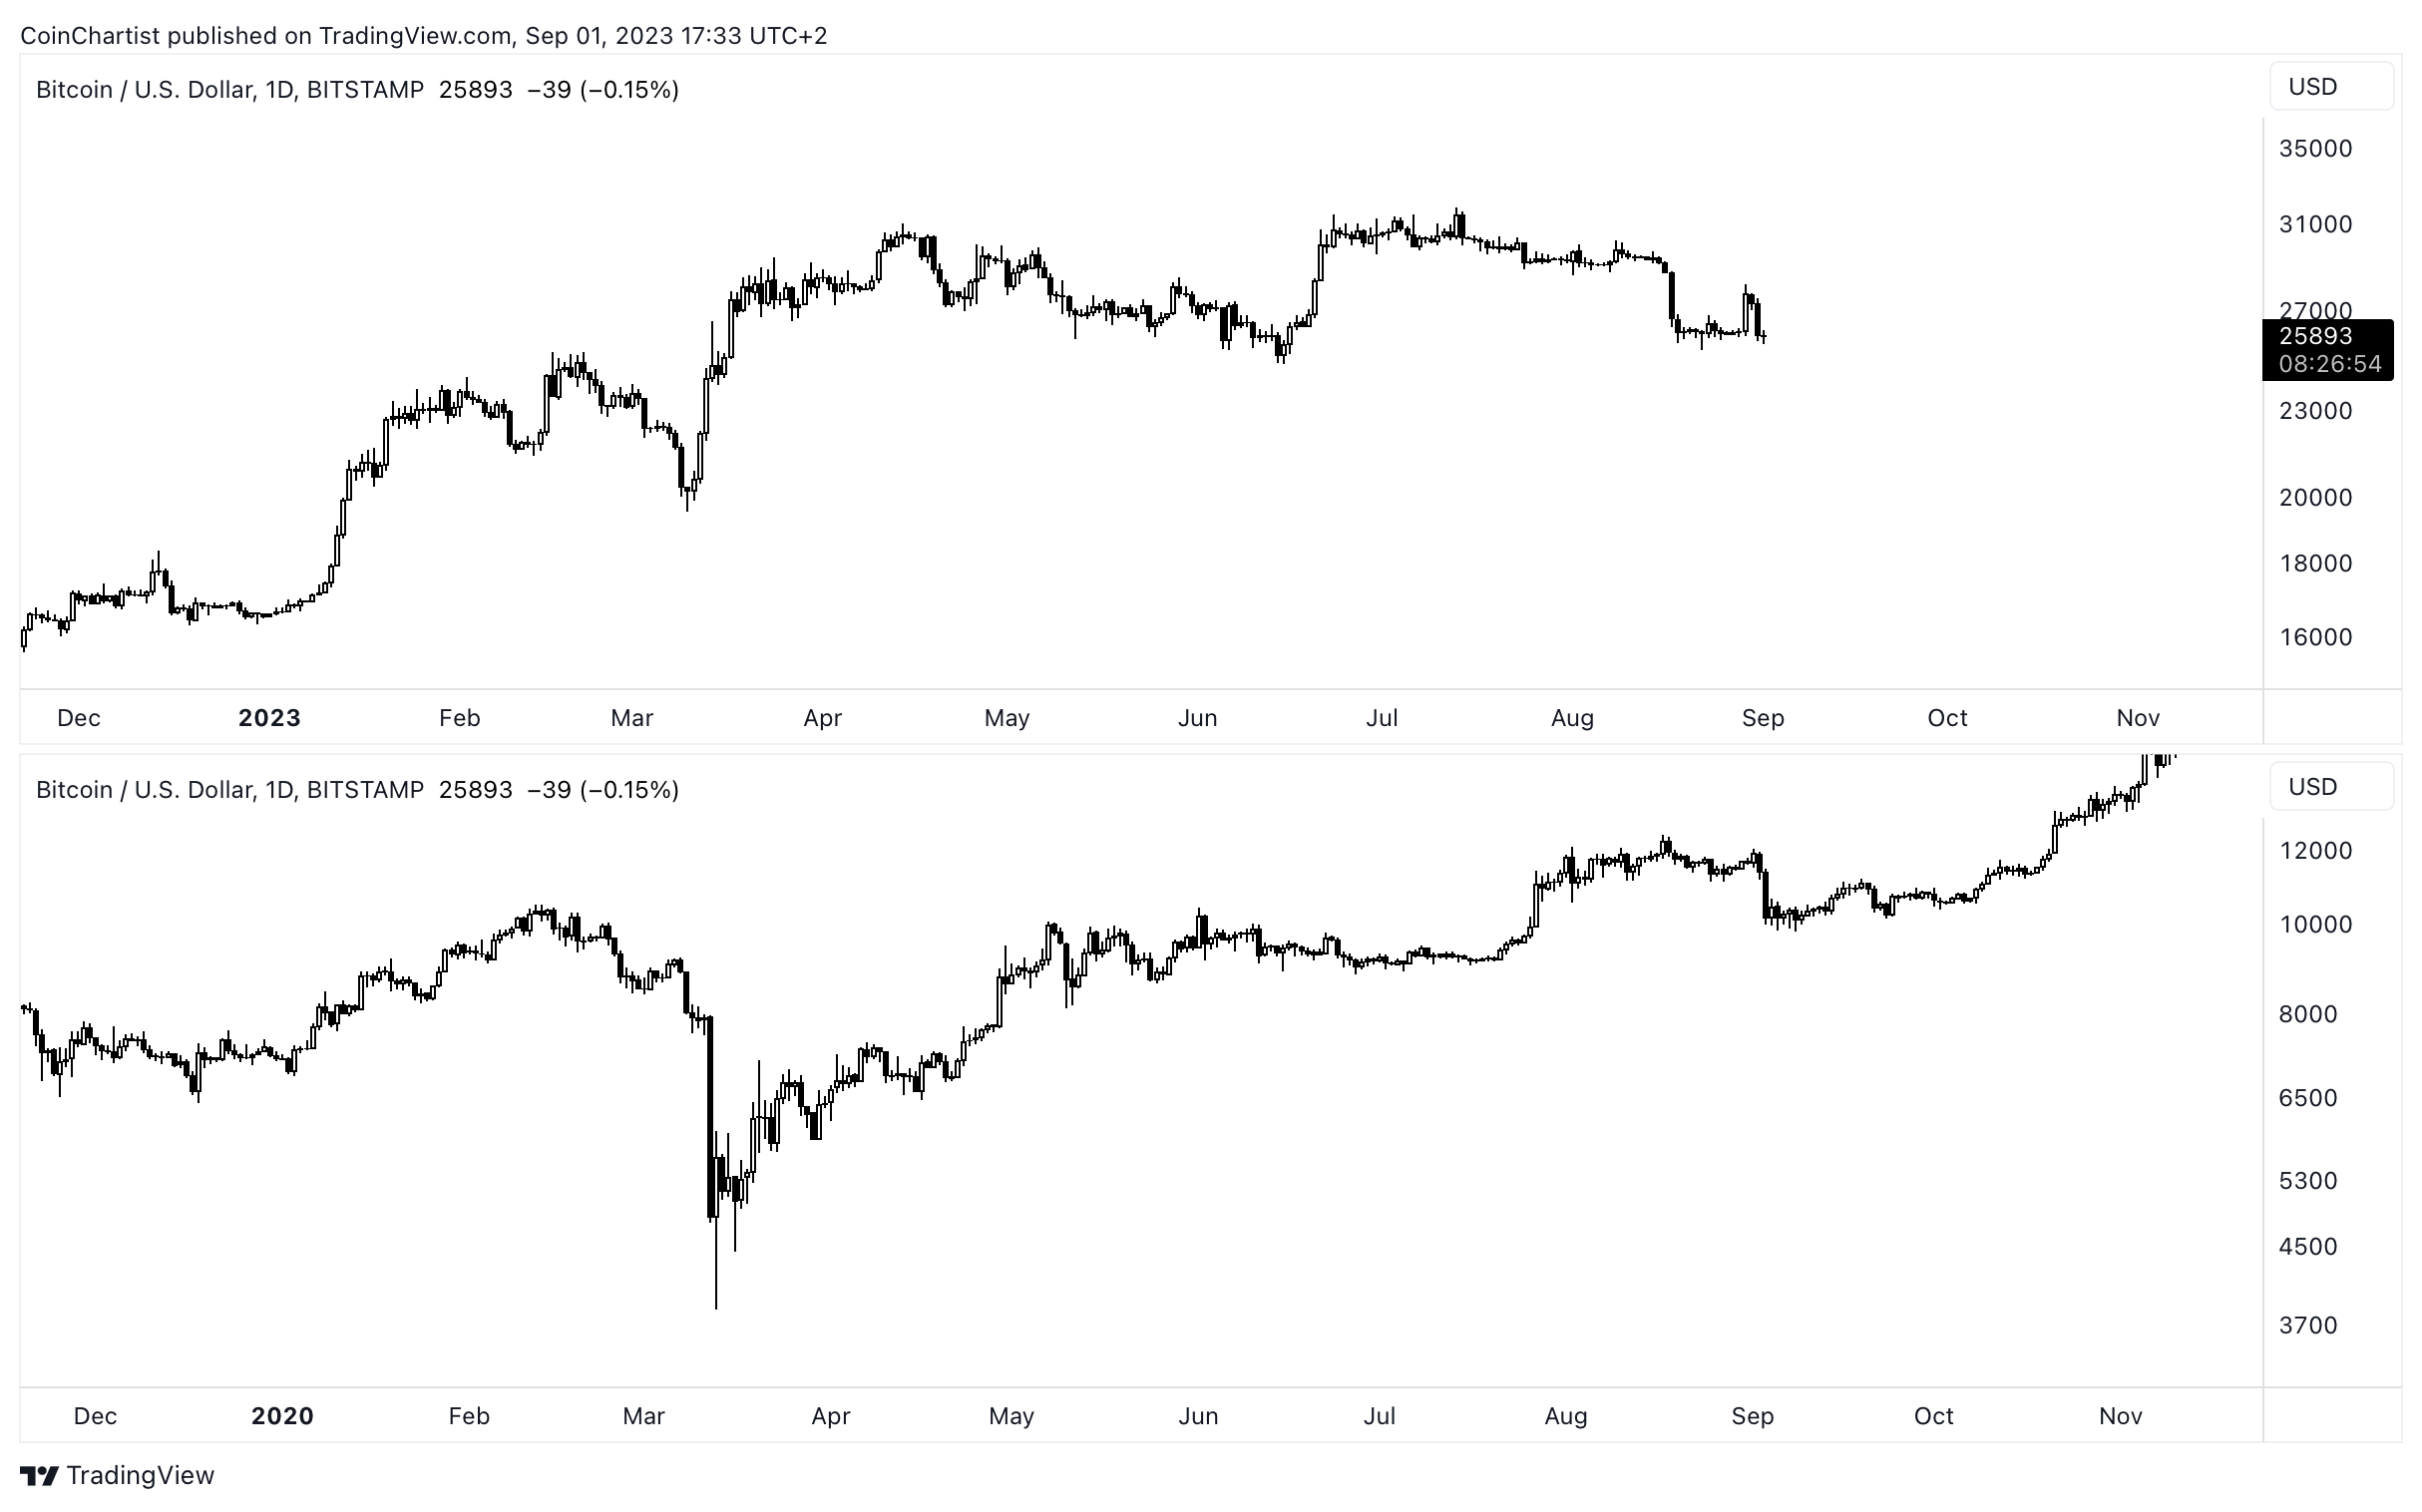
What if the COVID pandemic had never happened in 2020? Bitcoin might have formed a bottom at $6,000 in late 2019, then spent the first nine months of 2020 consolidating. If we were to remove the COVID crash outlier, price action would closely resemble what we are experiencing right now. On a time scale basis, we could be ready for some more action soon enough.
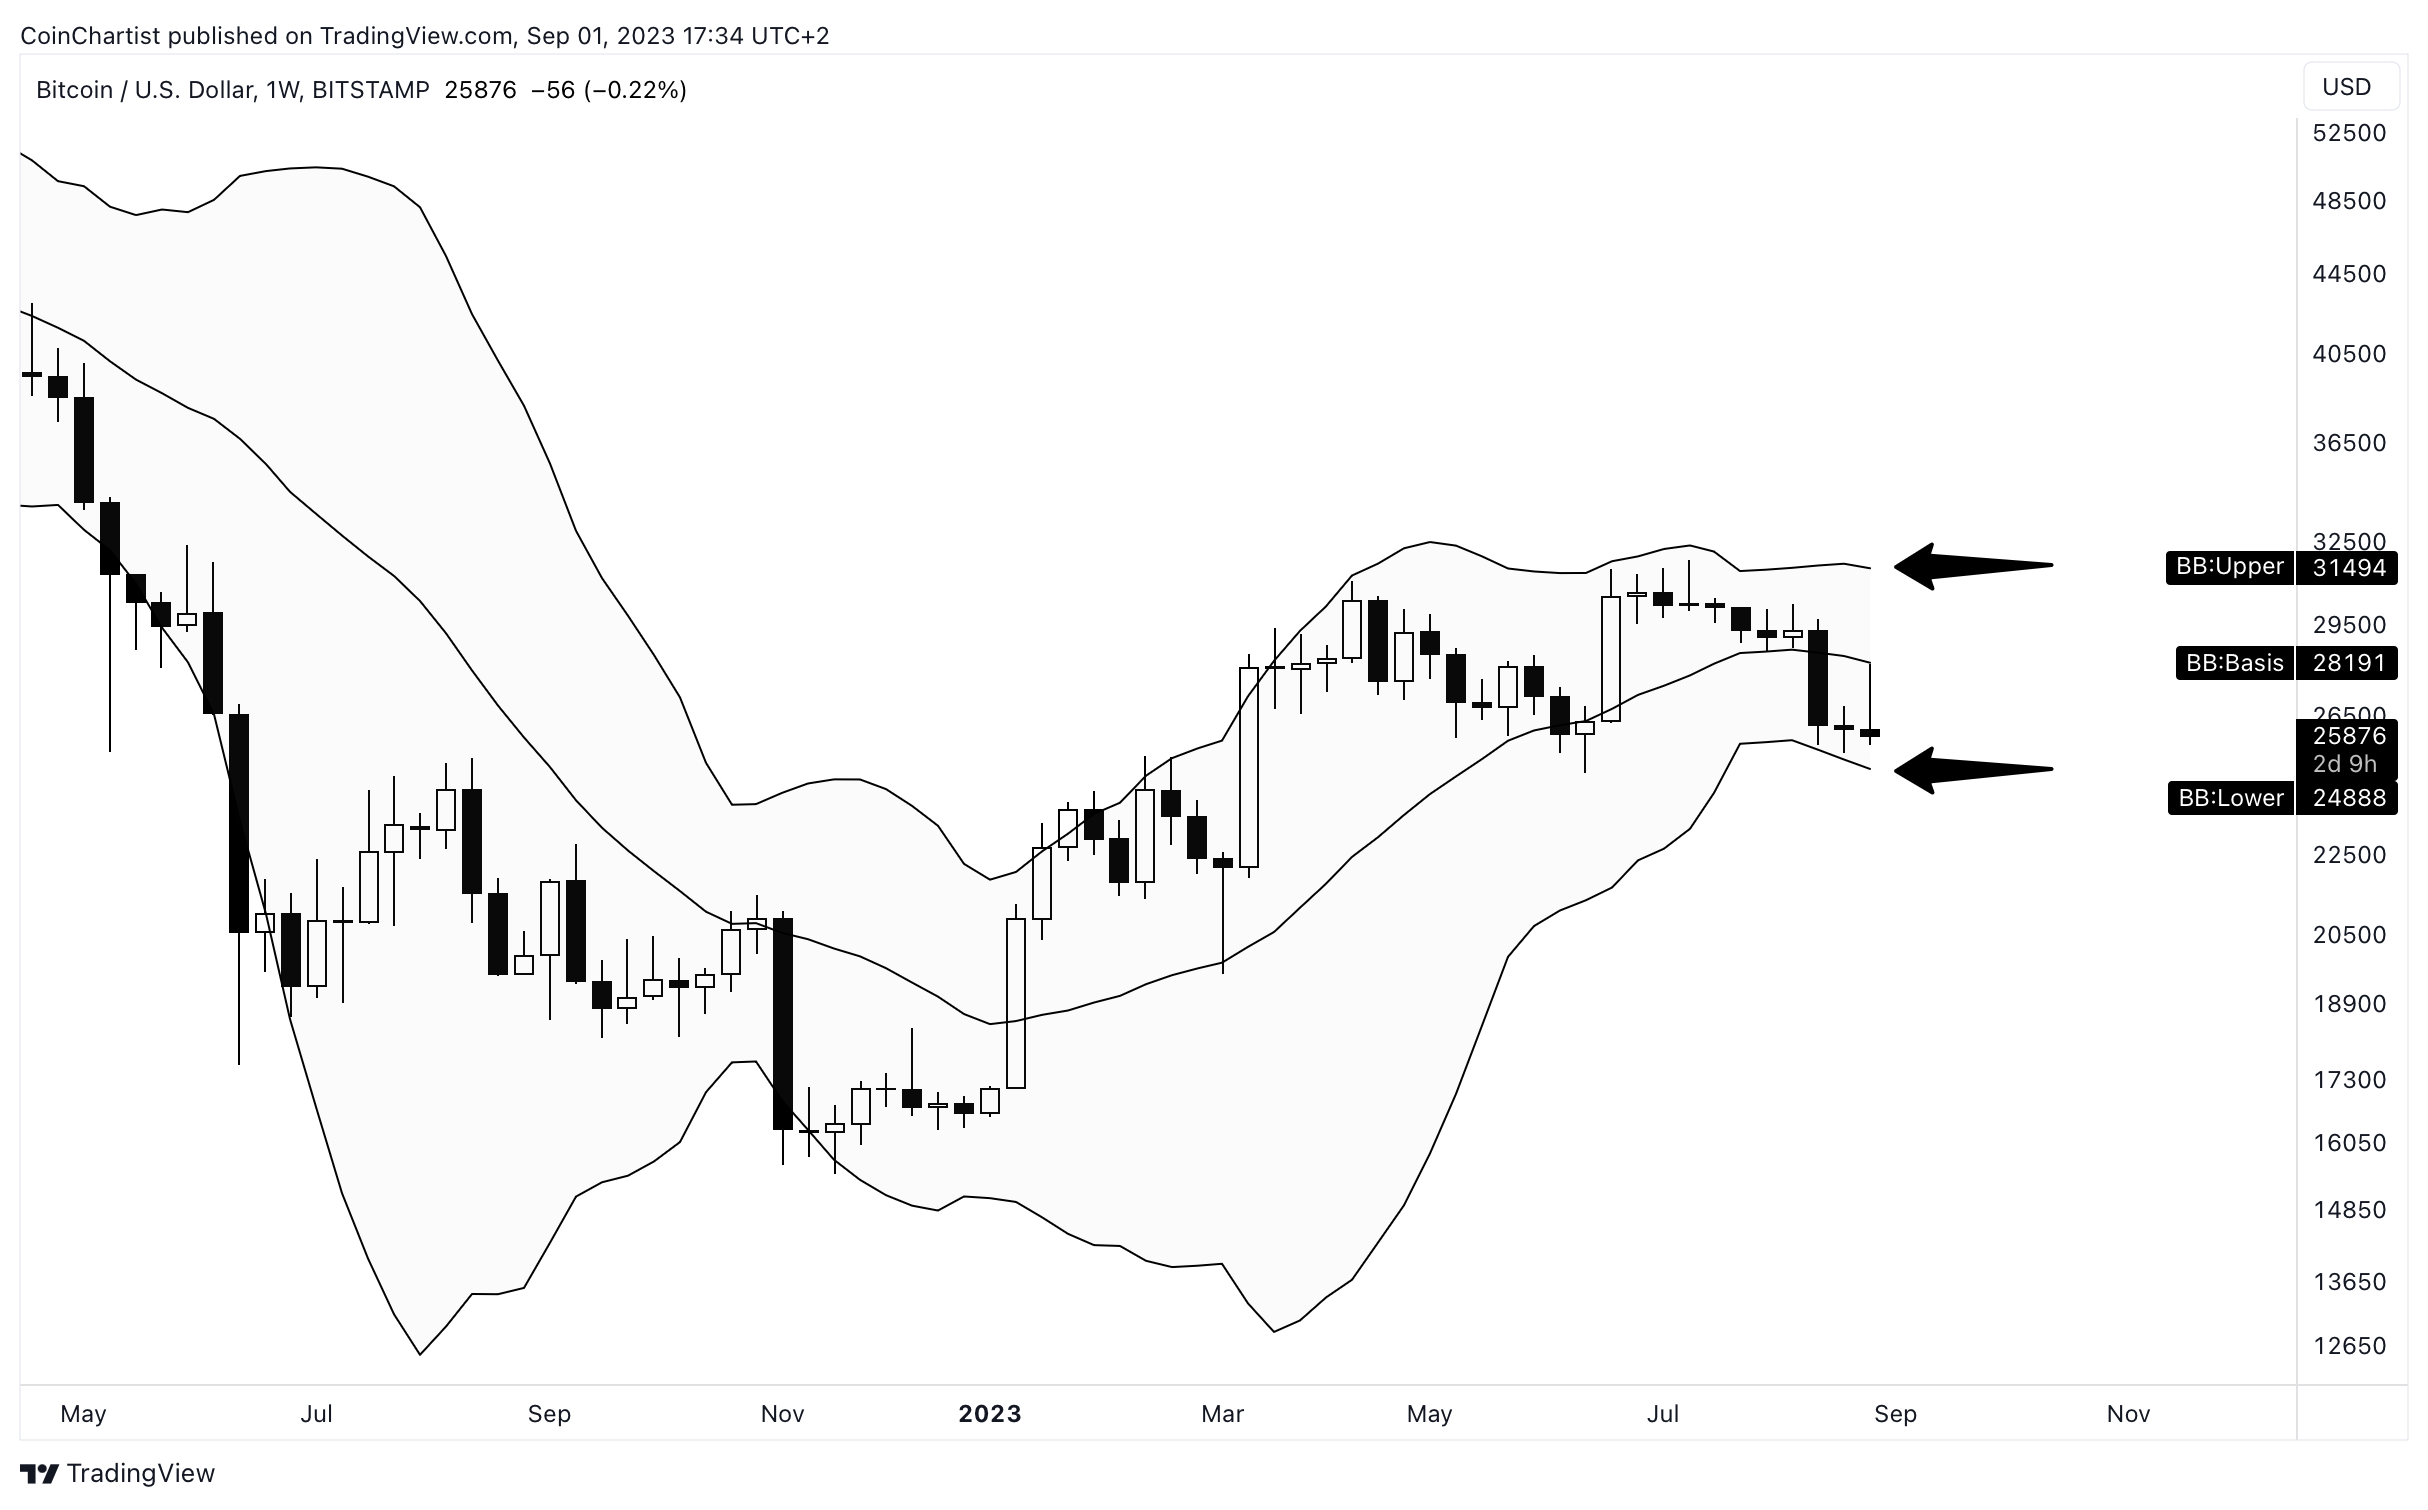
Hopes for a “head fake” on weekly BTCUSD charts using the Bollinger Bands are fading, but not totally lost. Be careful to trust any price action that doesn’t involve a push outside of the upper or lower Bollinger Bands. When this occurs, we will know the true direction of the next trend: up or down.
Learn more about the Bollinger Bands here.

Two weeks ago, Bitcoin falling from its prolonged consolidation put bears back in the driver’s seat temporarily, according to the weekly Average Directional Index. Even with the Grayscale pump completely erased, bulls managed to reclaim dominance over the direction of price action. The ADX itself is falling below 20, suggesting that the trend it currently weak. When the ADX pushes back above 20, it will be another signal that the true trend is developing.
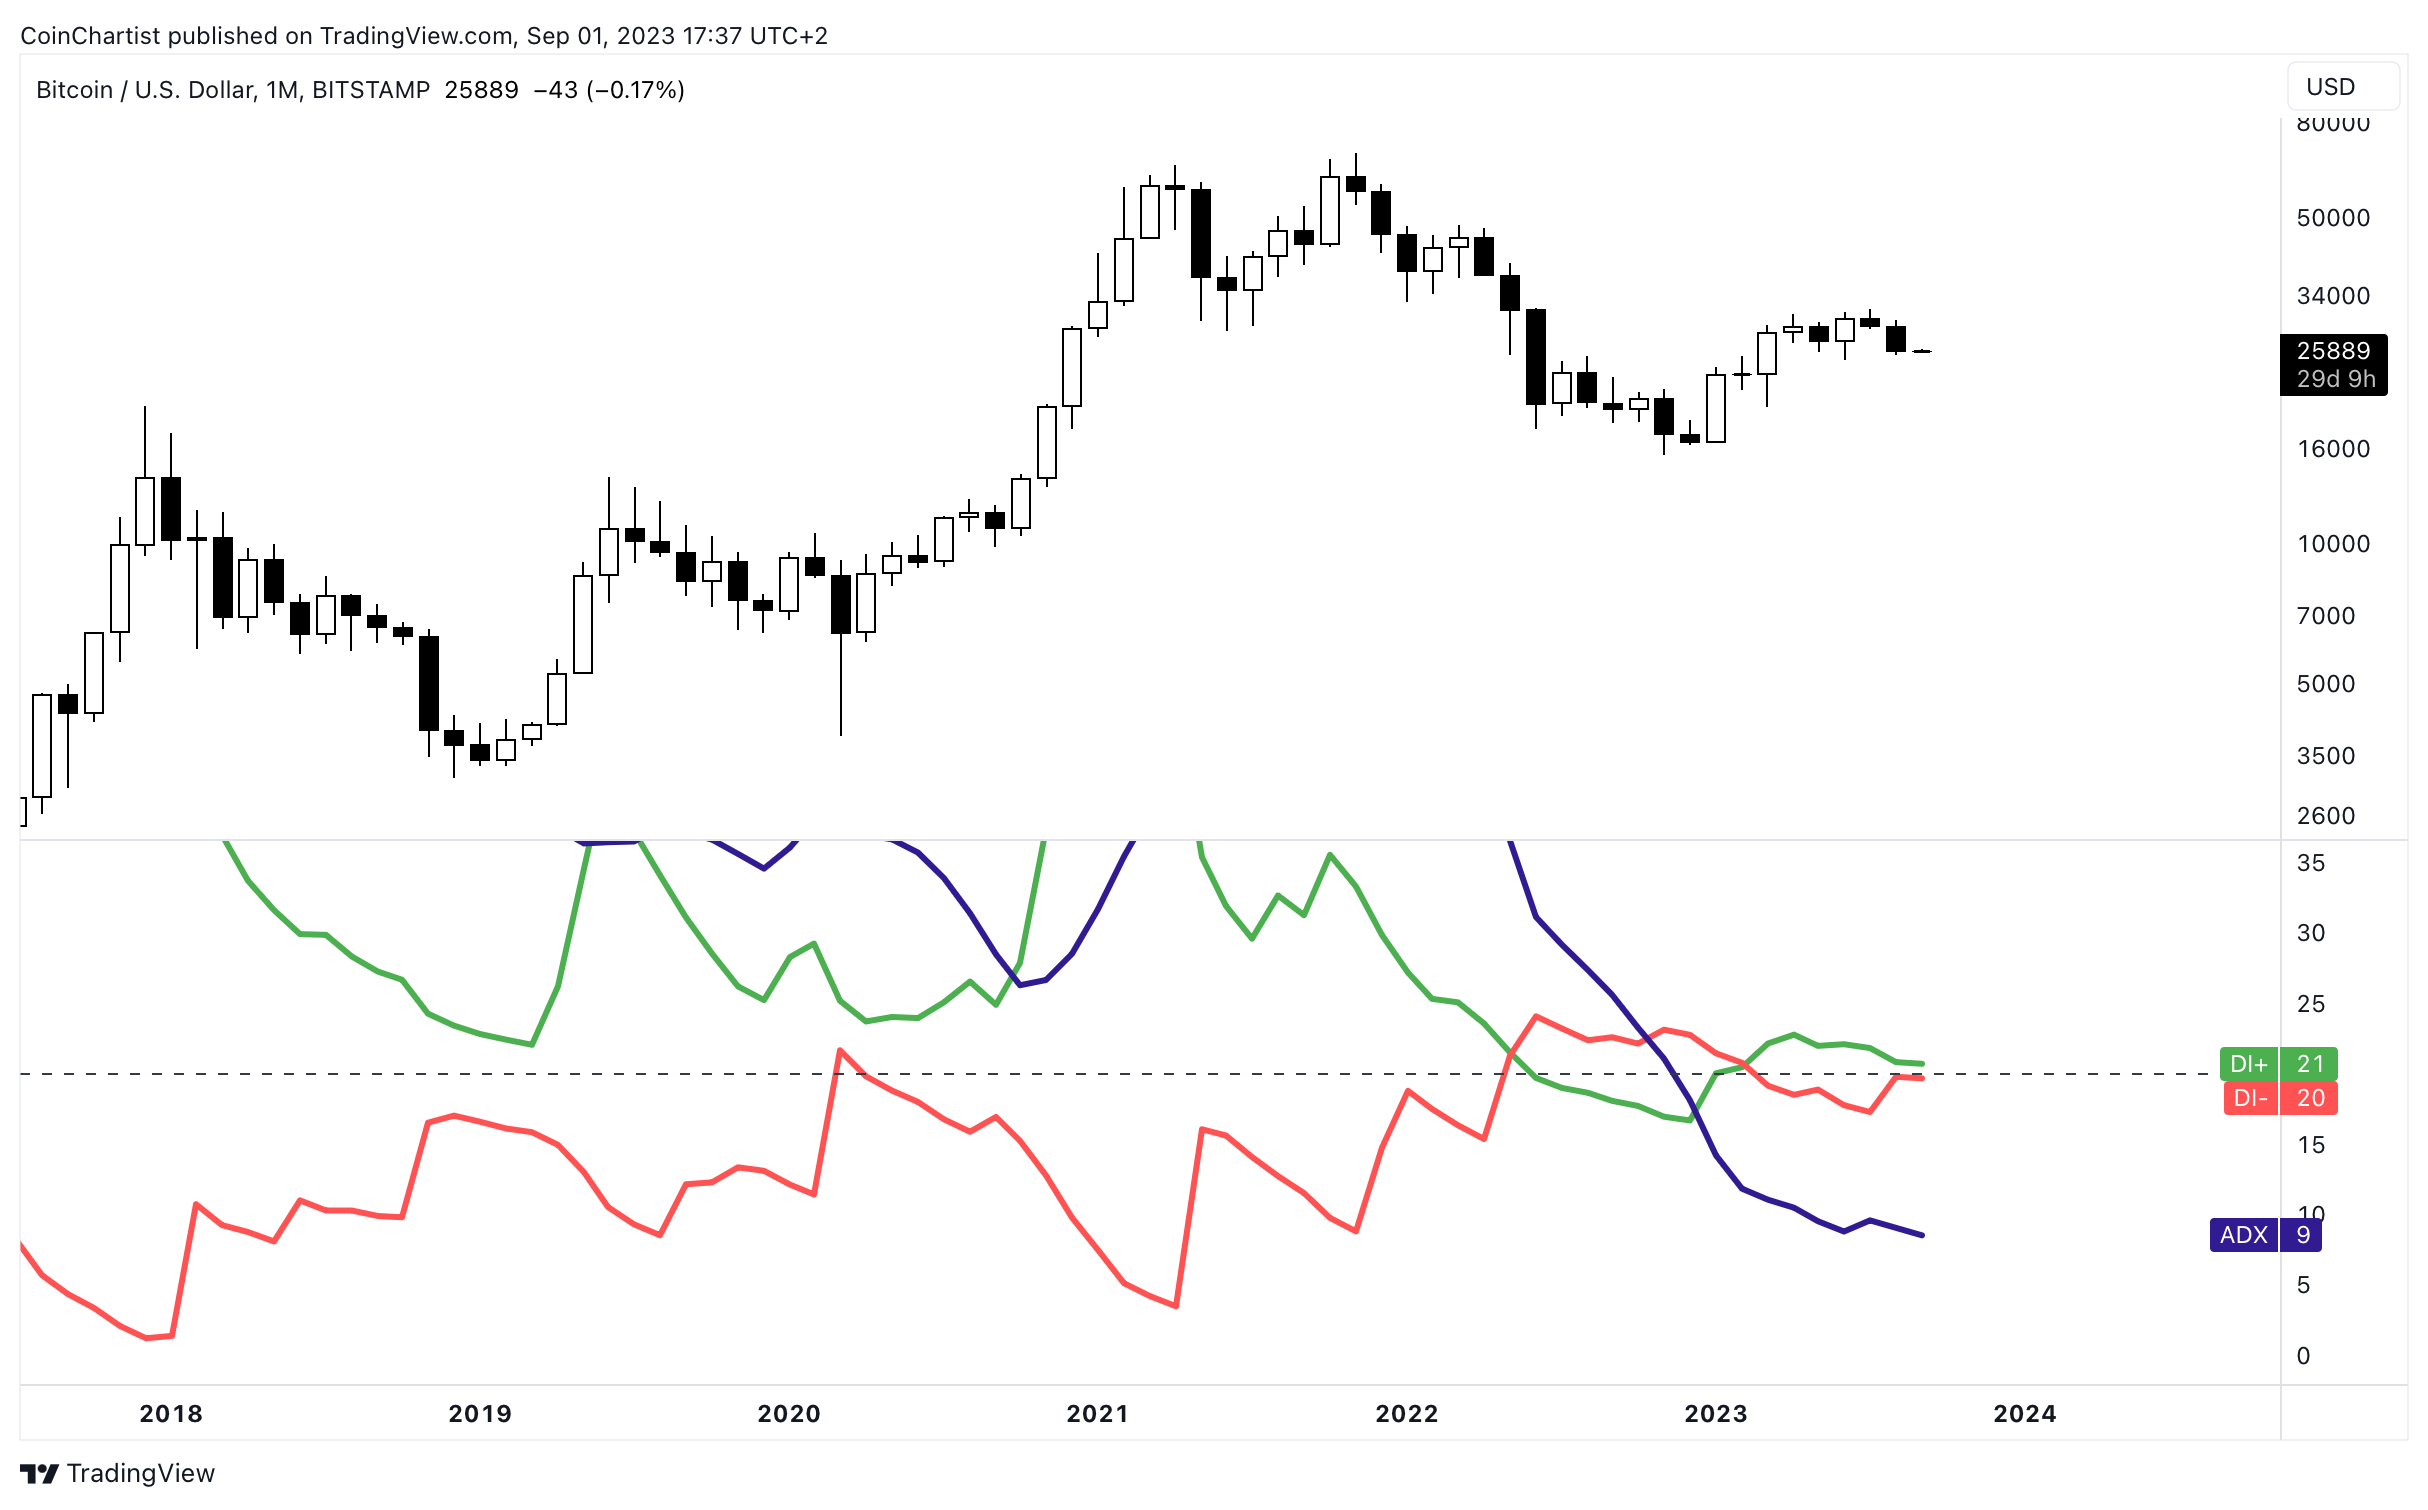
The worst fear for bulls was to lose control over the monthly chart. But DI- (red) failed to cross above the DI+ (green) and missed pushing above the 20 line. The ADX continues to fall, suggesting the the trend is the weakest in years. But bulls are indeed safe for the time being.
Learn more about the Average Directional Index here.
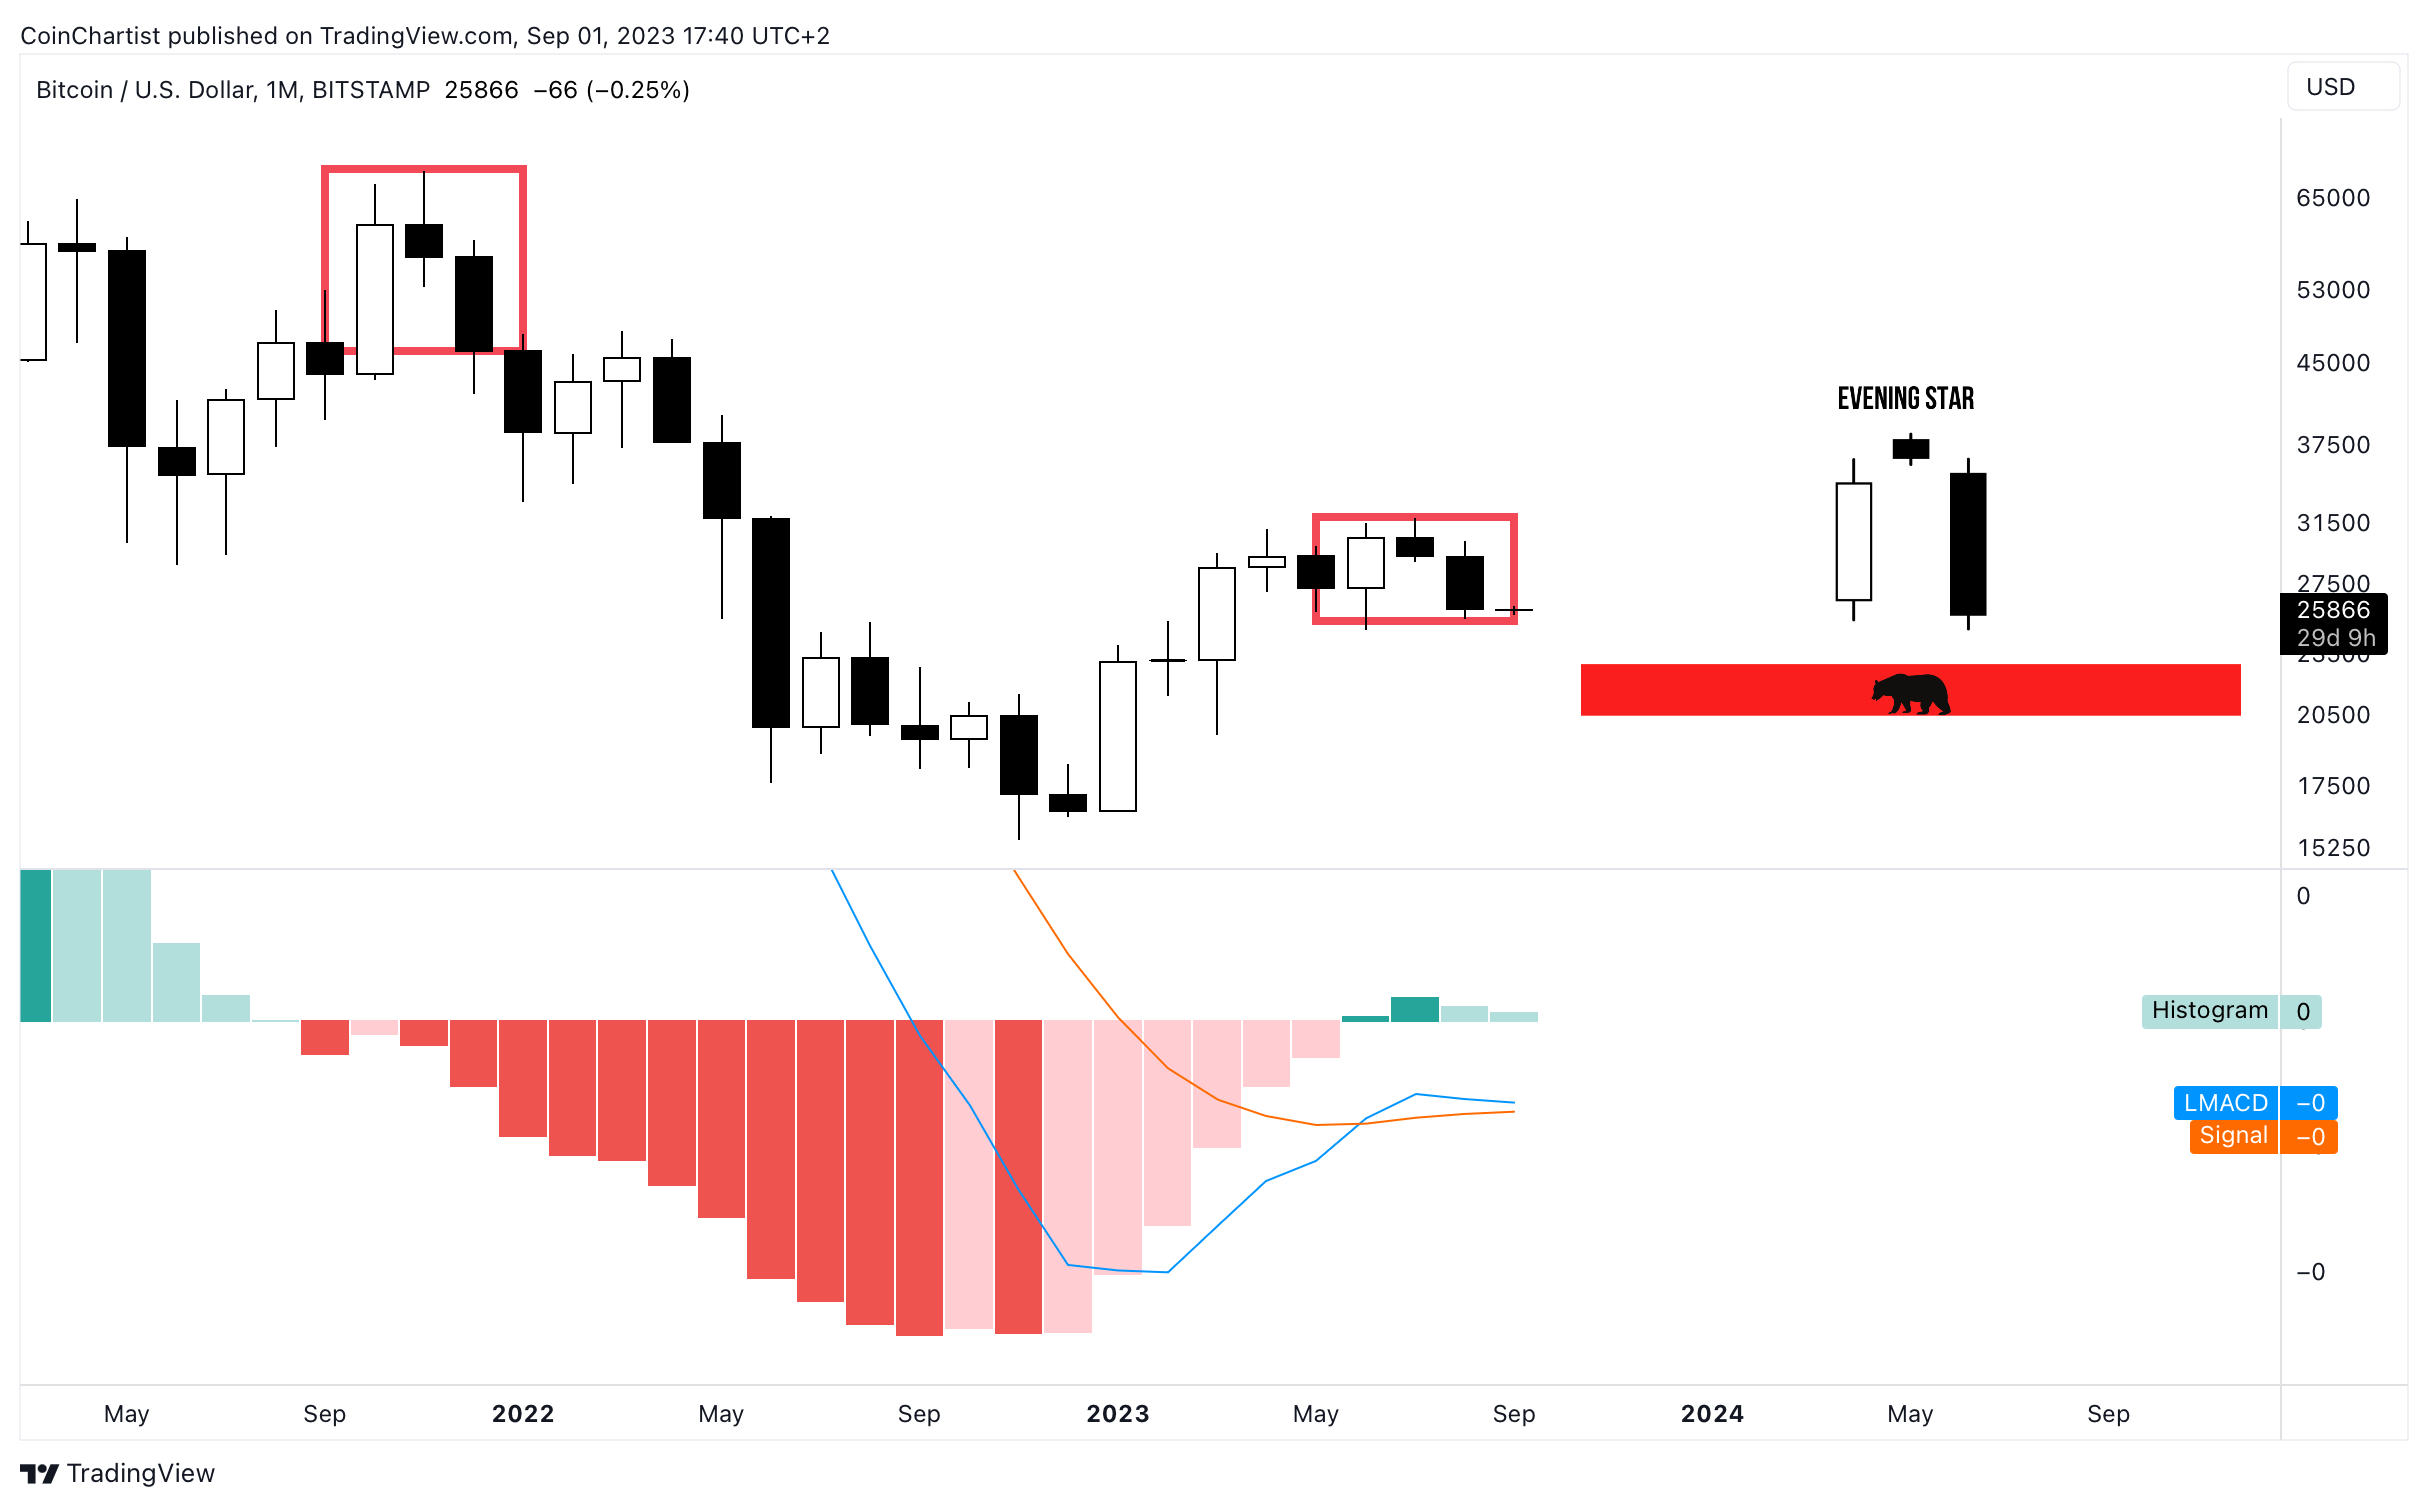
The most alarming signal in BTCUSD after the August monthly close, is the Evening Star pattern. In this week’s Chart Class, I’ll review this bearish Japanese candlestick reversal pattern and weigh in on what it could mean for Bitcoin. It is worth noting, the last time this pattern appeared, crypto had its worst bear market ever.


While Bitcoin narrowly escaped falling into the clutches of bears, altcoins, and Litecoin in particular, look especially heavy and at risk of a serious selloff. At the same time, avoiding downside will trigger bullish signals across the board. Let’s take a closer look at Litecoin, XRP, and Ethereum against USD and BTC.
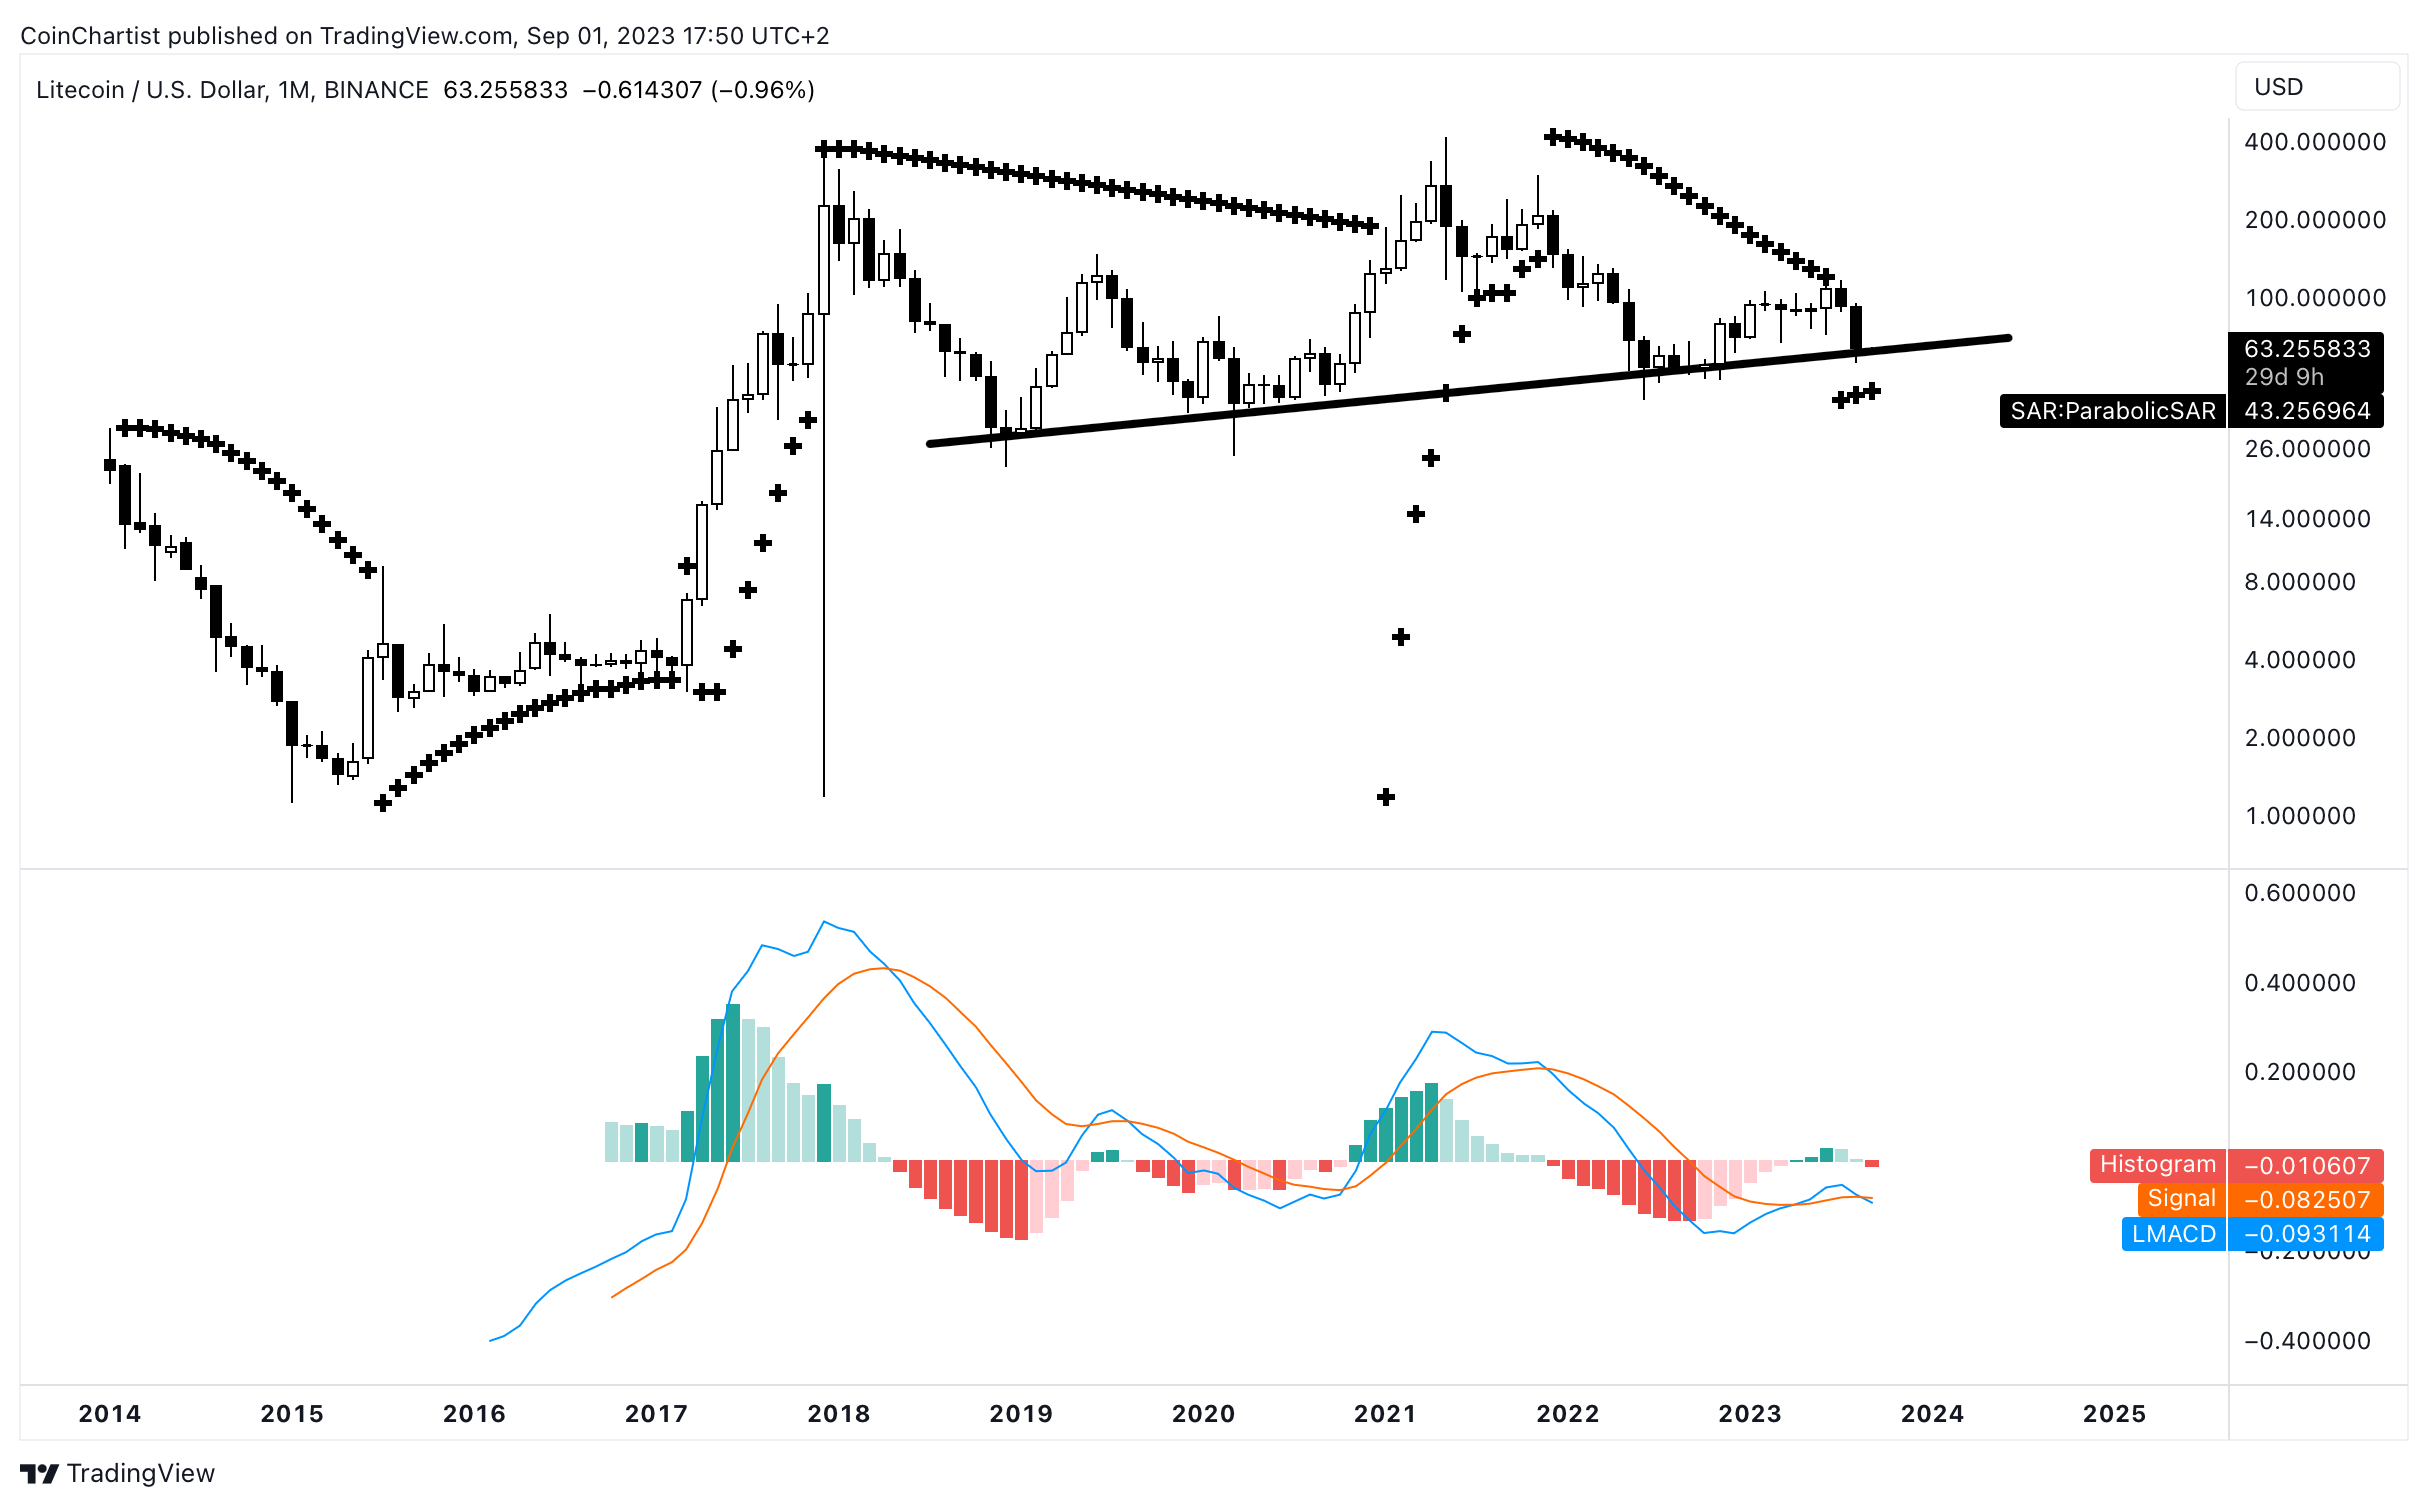
Litecoin has a good, bad, and ugly situation going on. The good is that the 1M Parabolic SAR was tagged and is below price, suggesting an uptrend is in progress. The bad, however, is that the LMACD is crossing bearish at this very moment. Uncrossing before the end of September feels necessary to fending off the ugly: an extreme crash. The reason being is that bearish momentum is crossing down while below the zero line on the LMACD for the first time ever. This could indicate that momentum to the downside is about to strengthen. Since September only opened with this signal, uncrossing it before it confirms at the end of the month is imperative.
Learn more about the LMACD here.
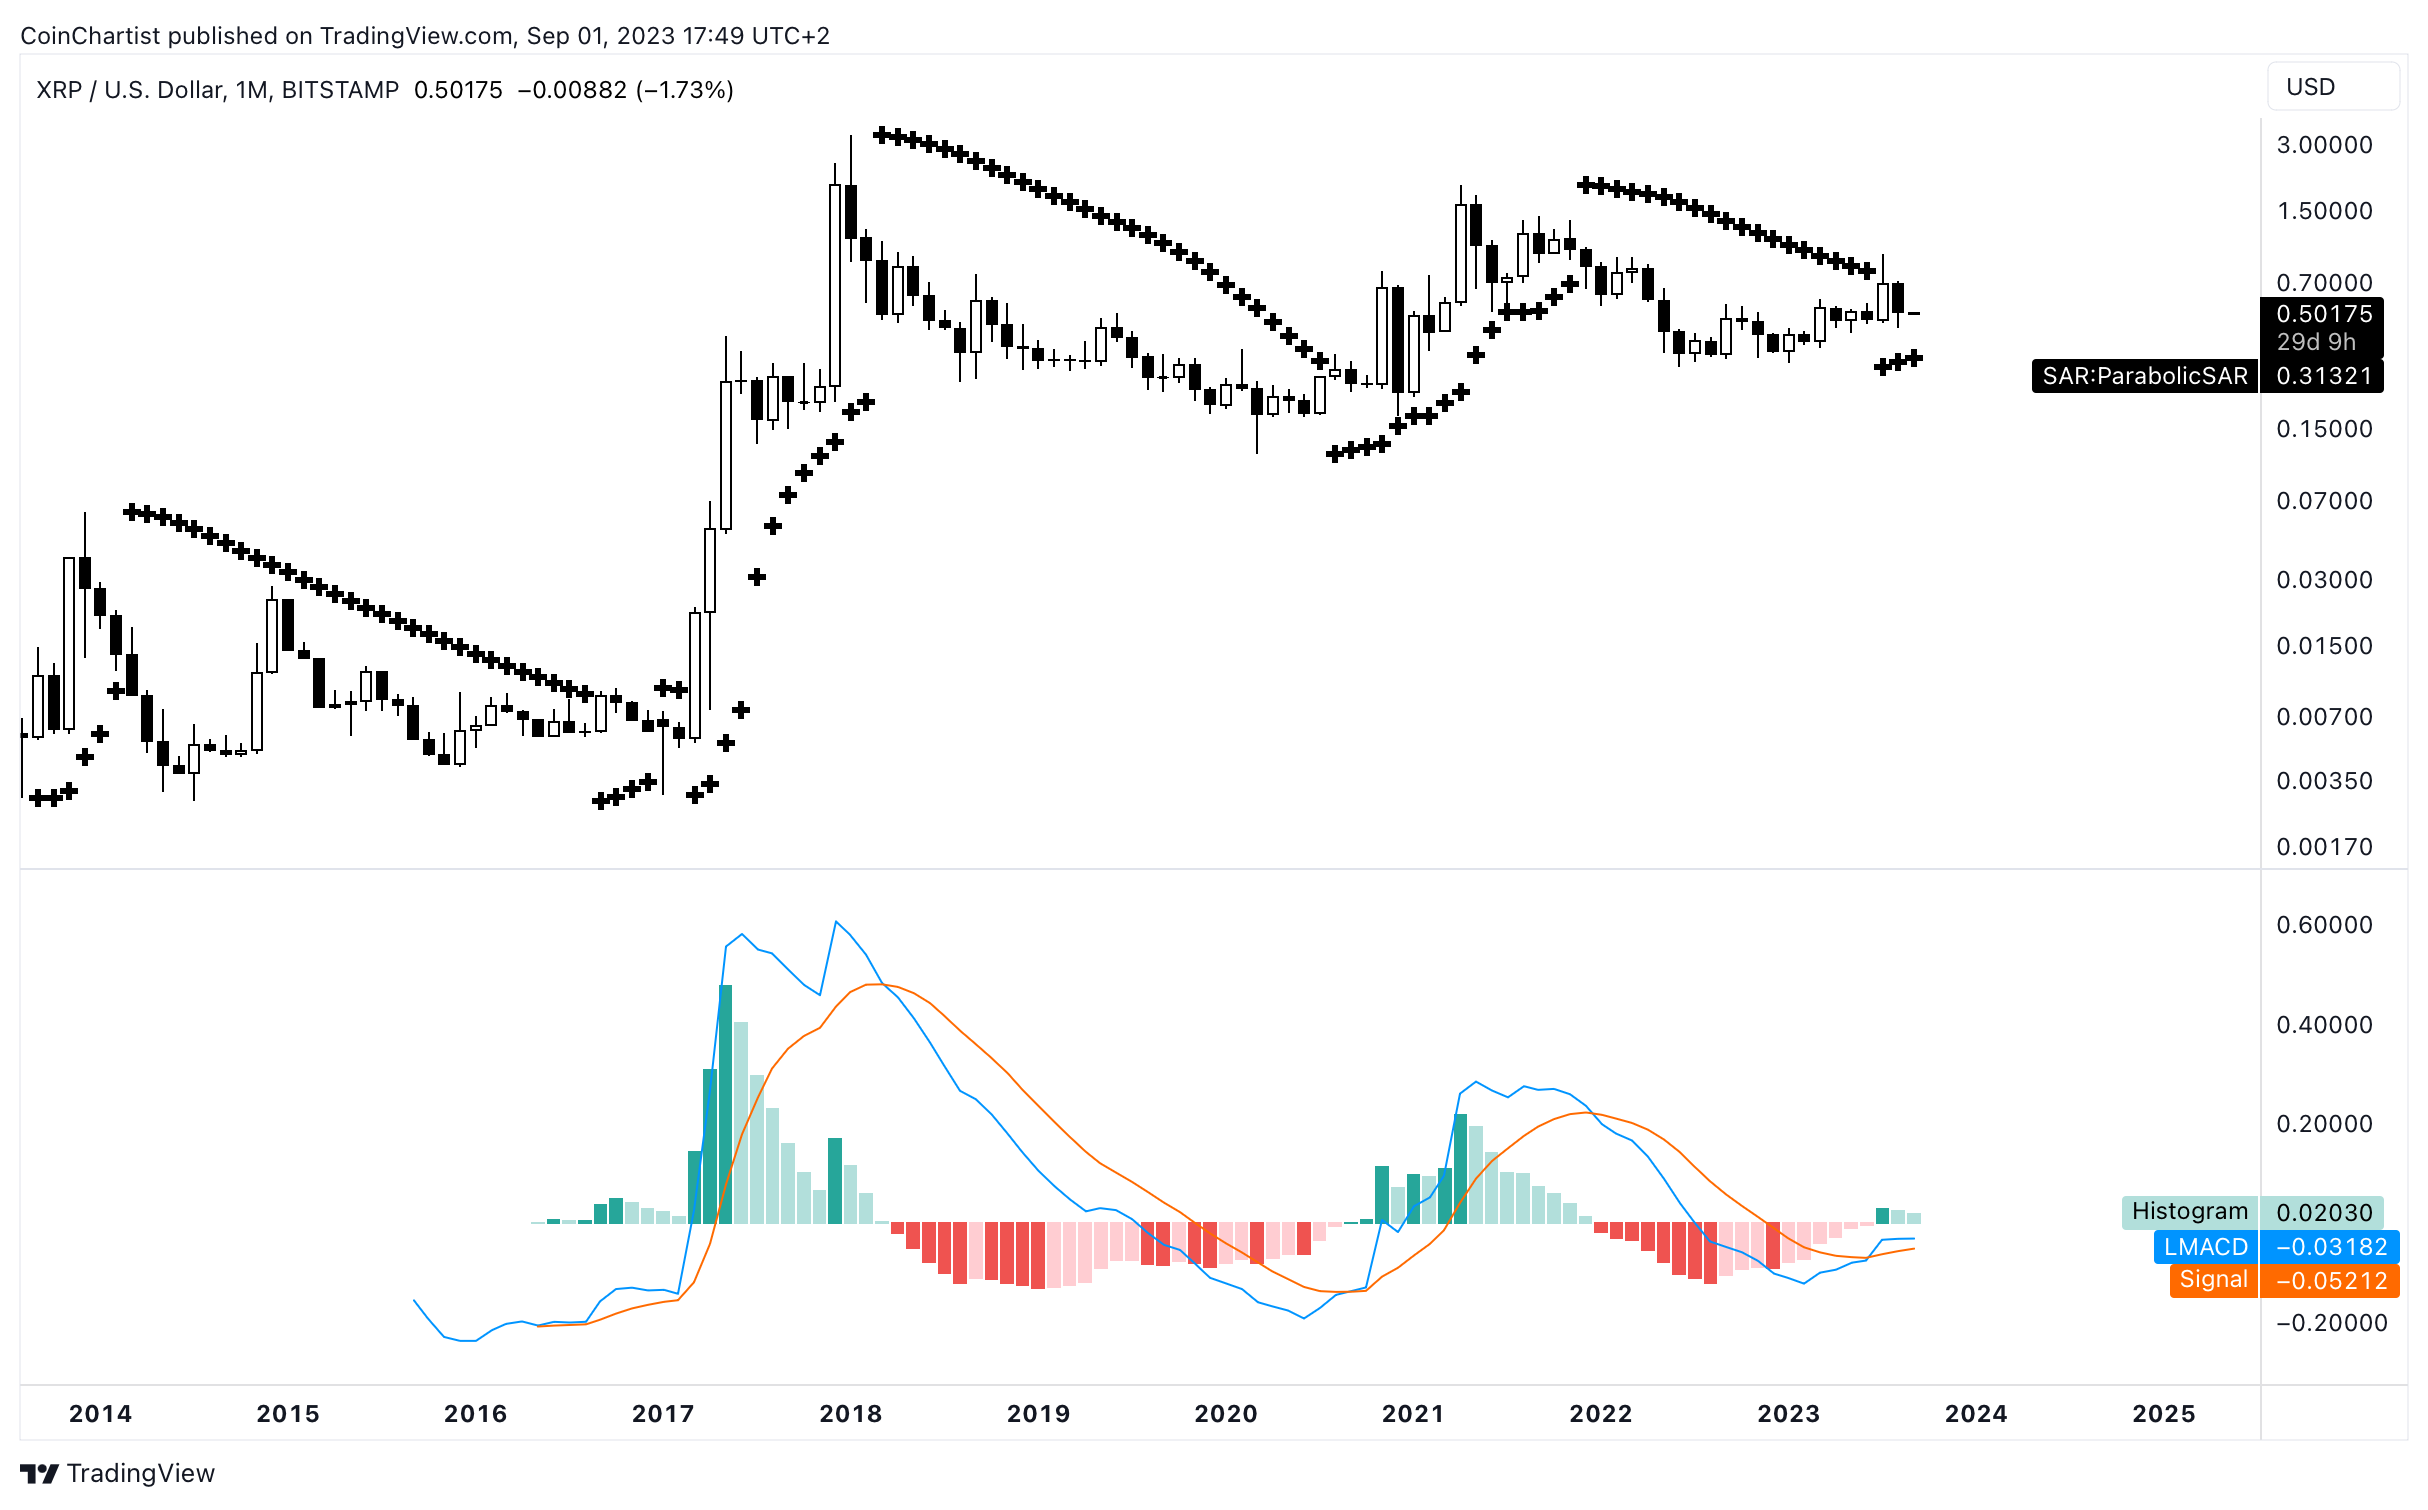
XRP and Litecoin show very similar price behavior and momentum. XRP, however, hasn’t crossed bearish. If the LMACD can diverge upward from here, with the Parabolic SAR at its back, XRP could see another explosive upward move. Once again, September feels critical for bulls to stage a defense after the SEC case ruling rally was fully retraced. Bears made their stand, now its time for bulls to do the same.
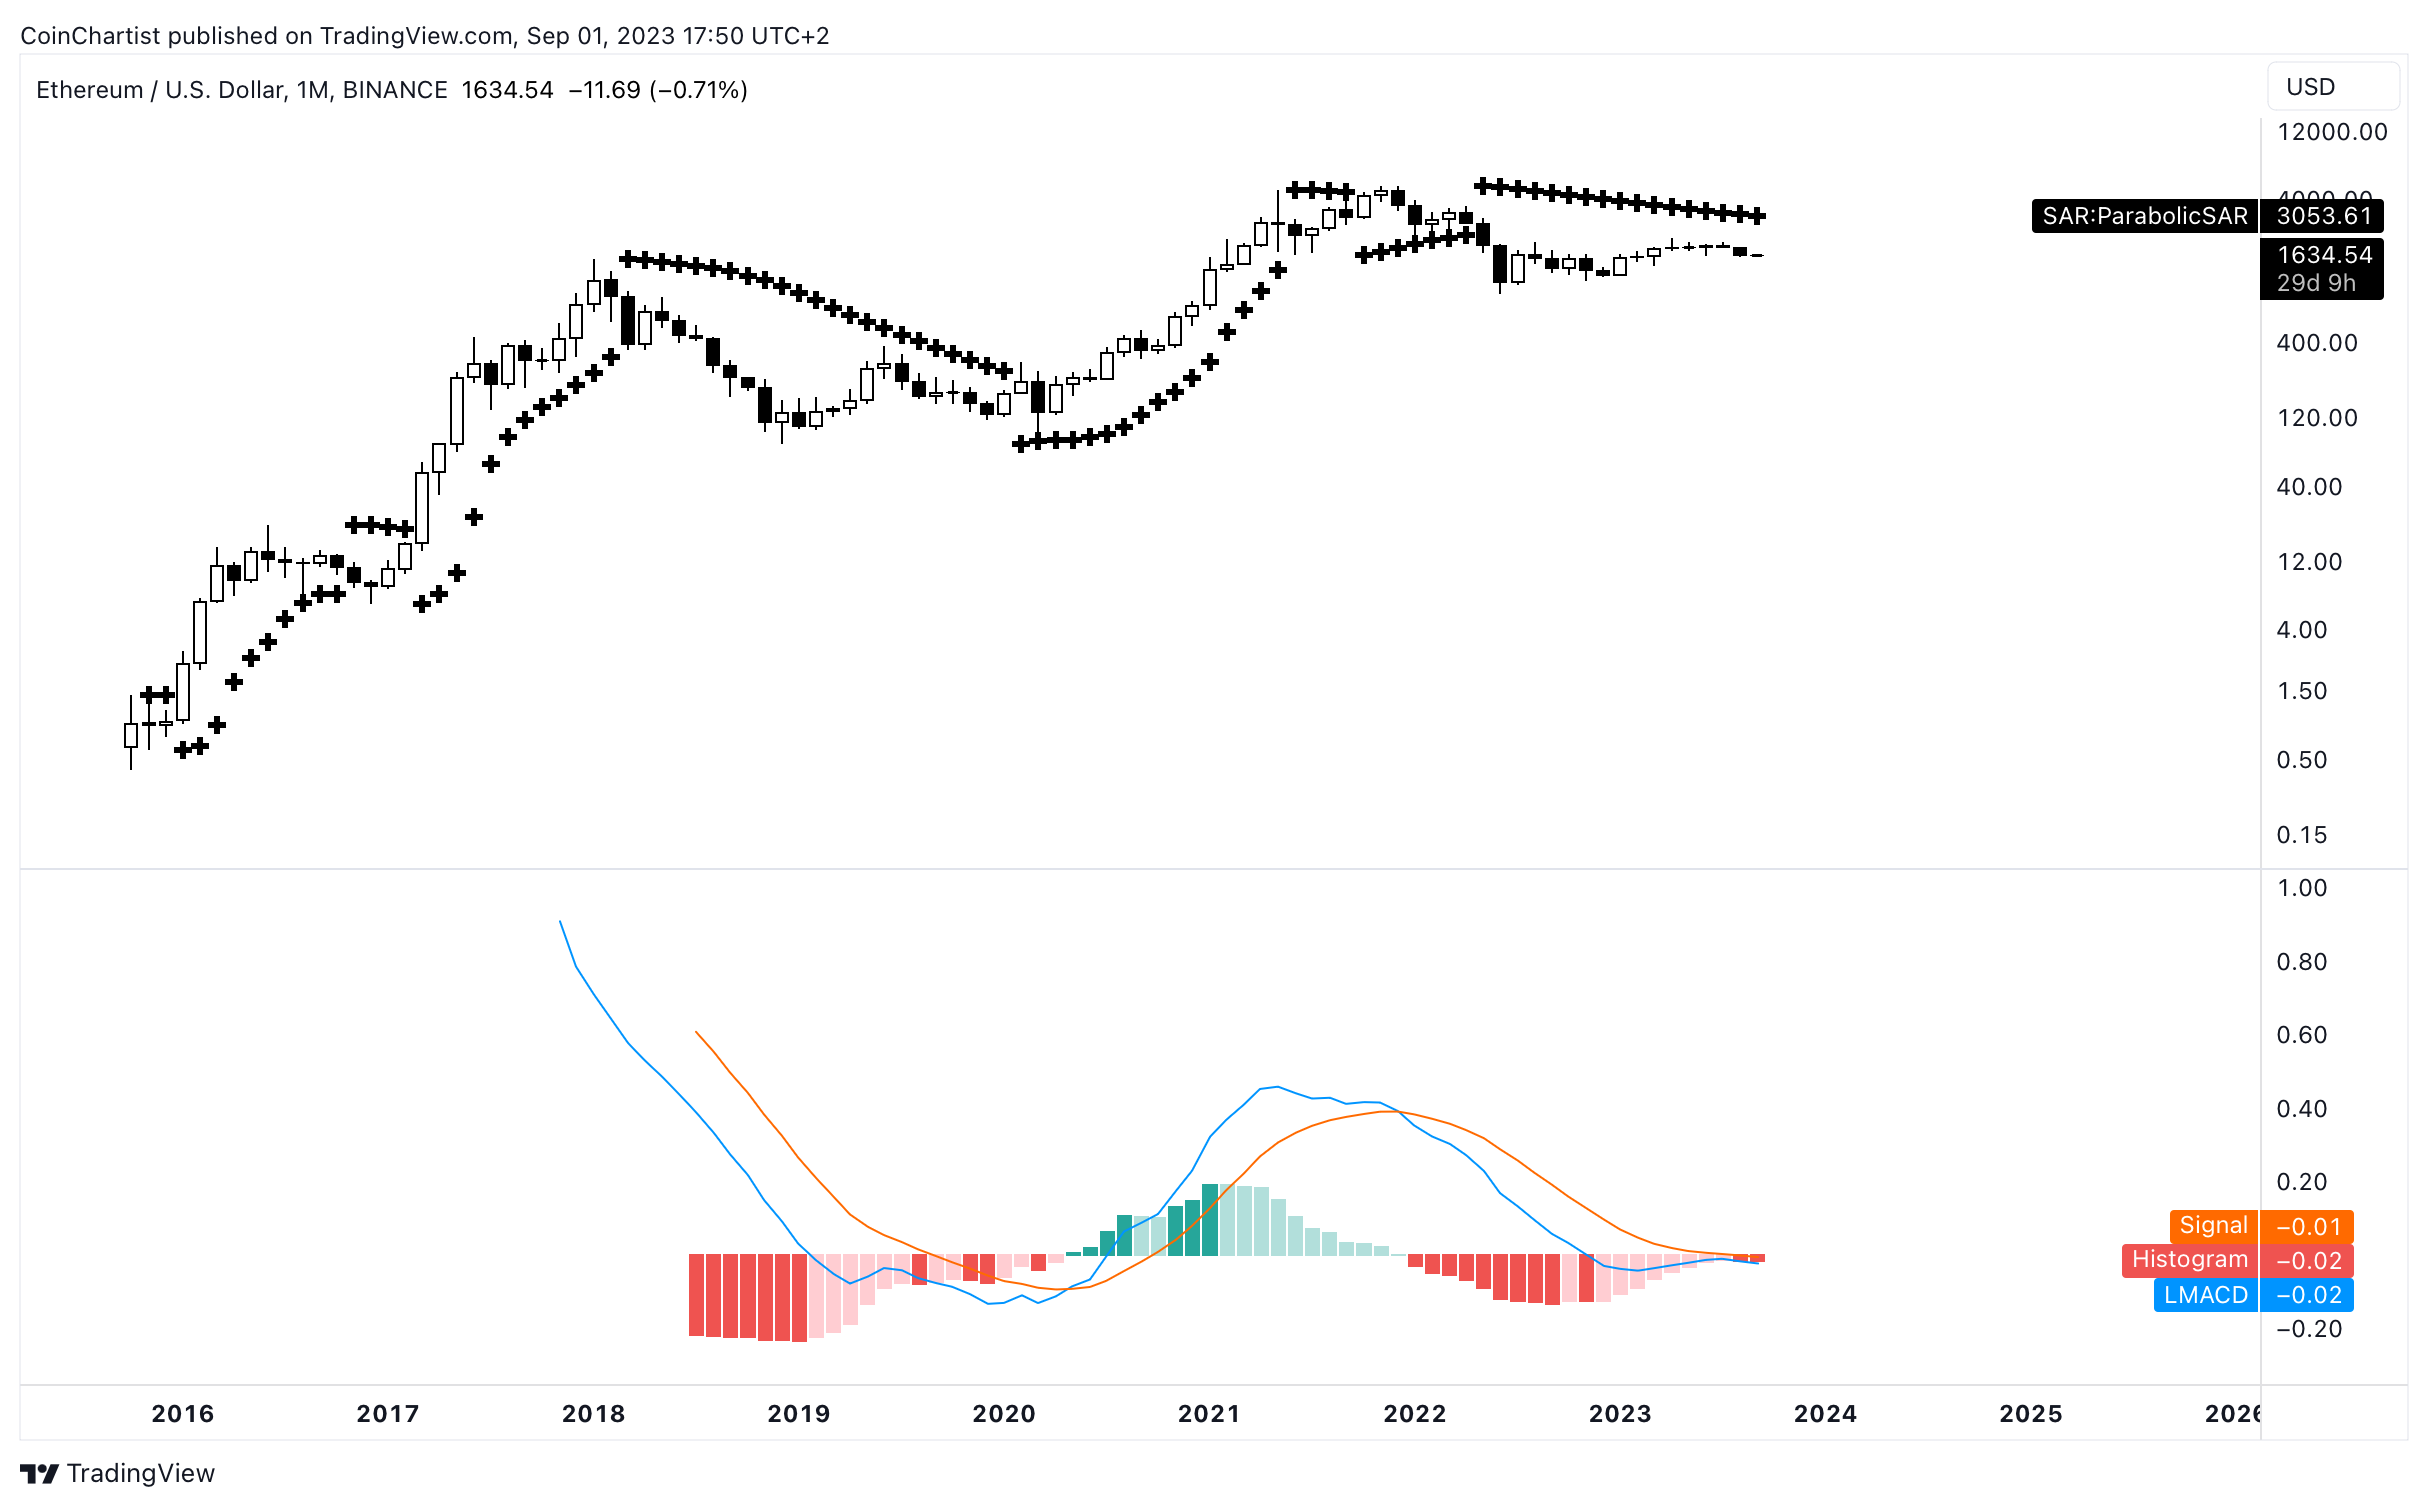
Last, and perhaps the worst is Ethereum. Unlike Litecoin, XRP, or even Bitcoin, this ETH has yet to cross bullish at all on the monthly LMACD. This also occurred in 2019 and Ether had a strong bounce before the 2020 COVID crash reset the entire thing. ETHUSD eventually crossed bullish and had a substantial bull run.
Learn more about the Parabolic SAR here.
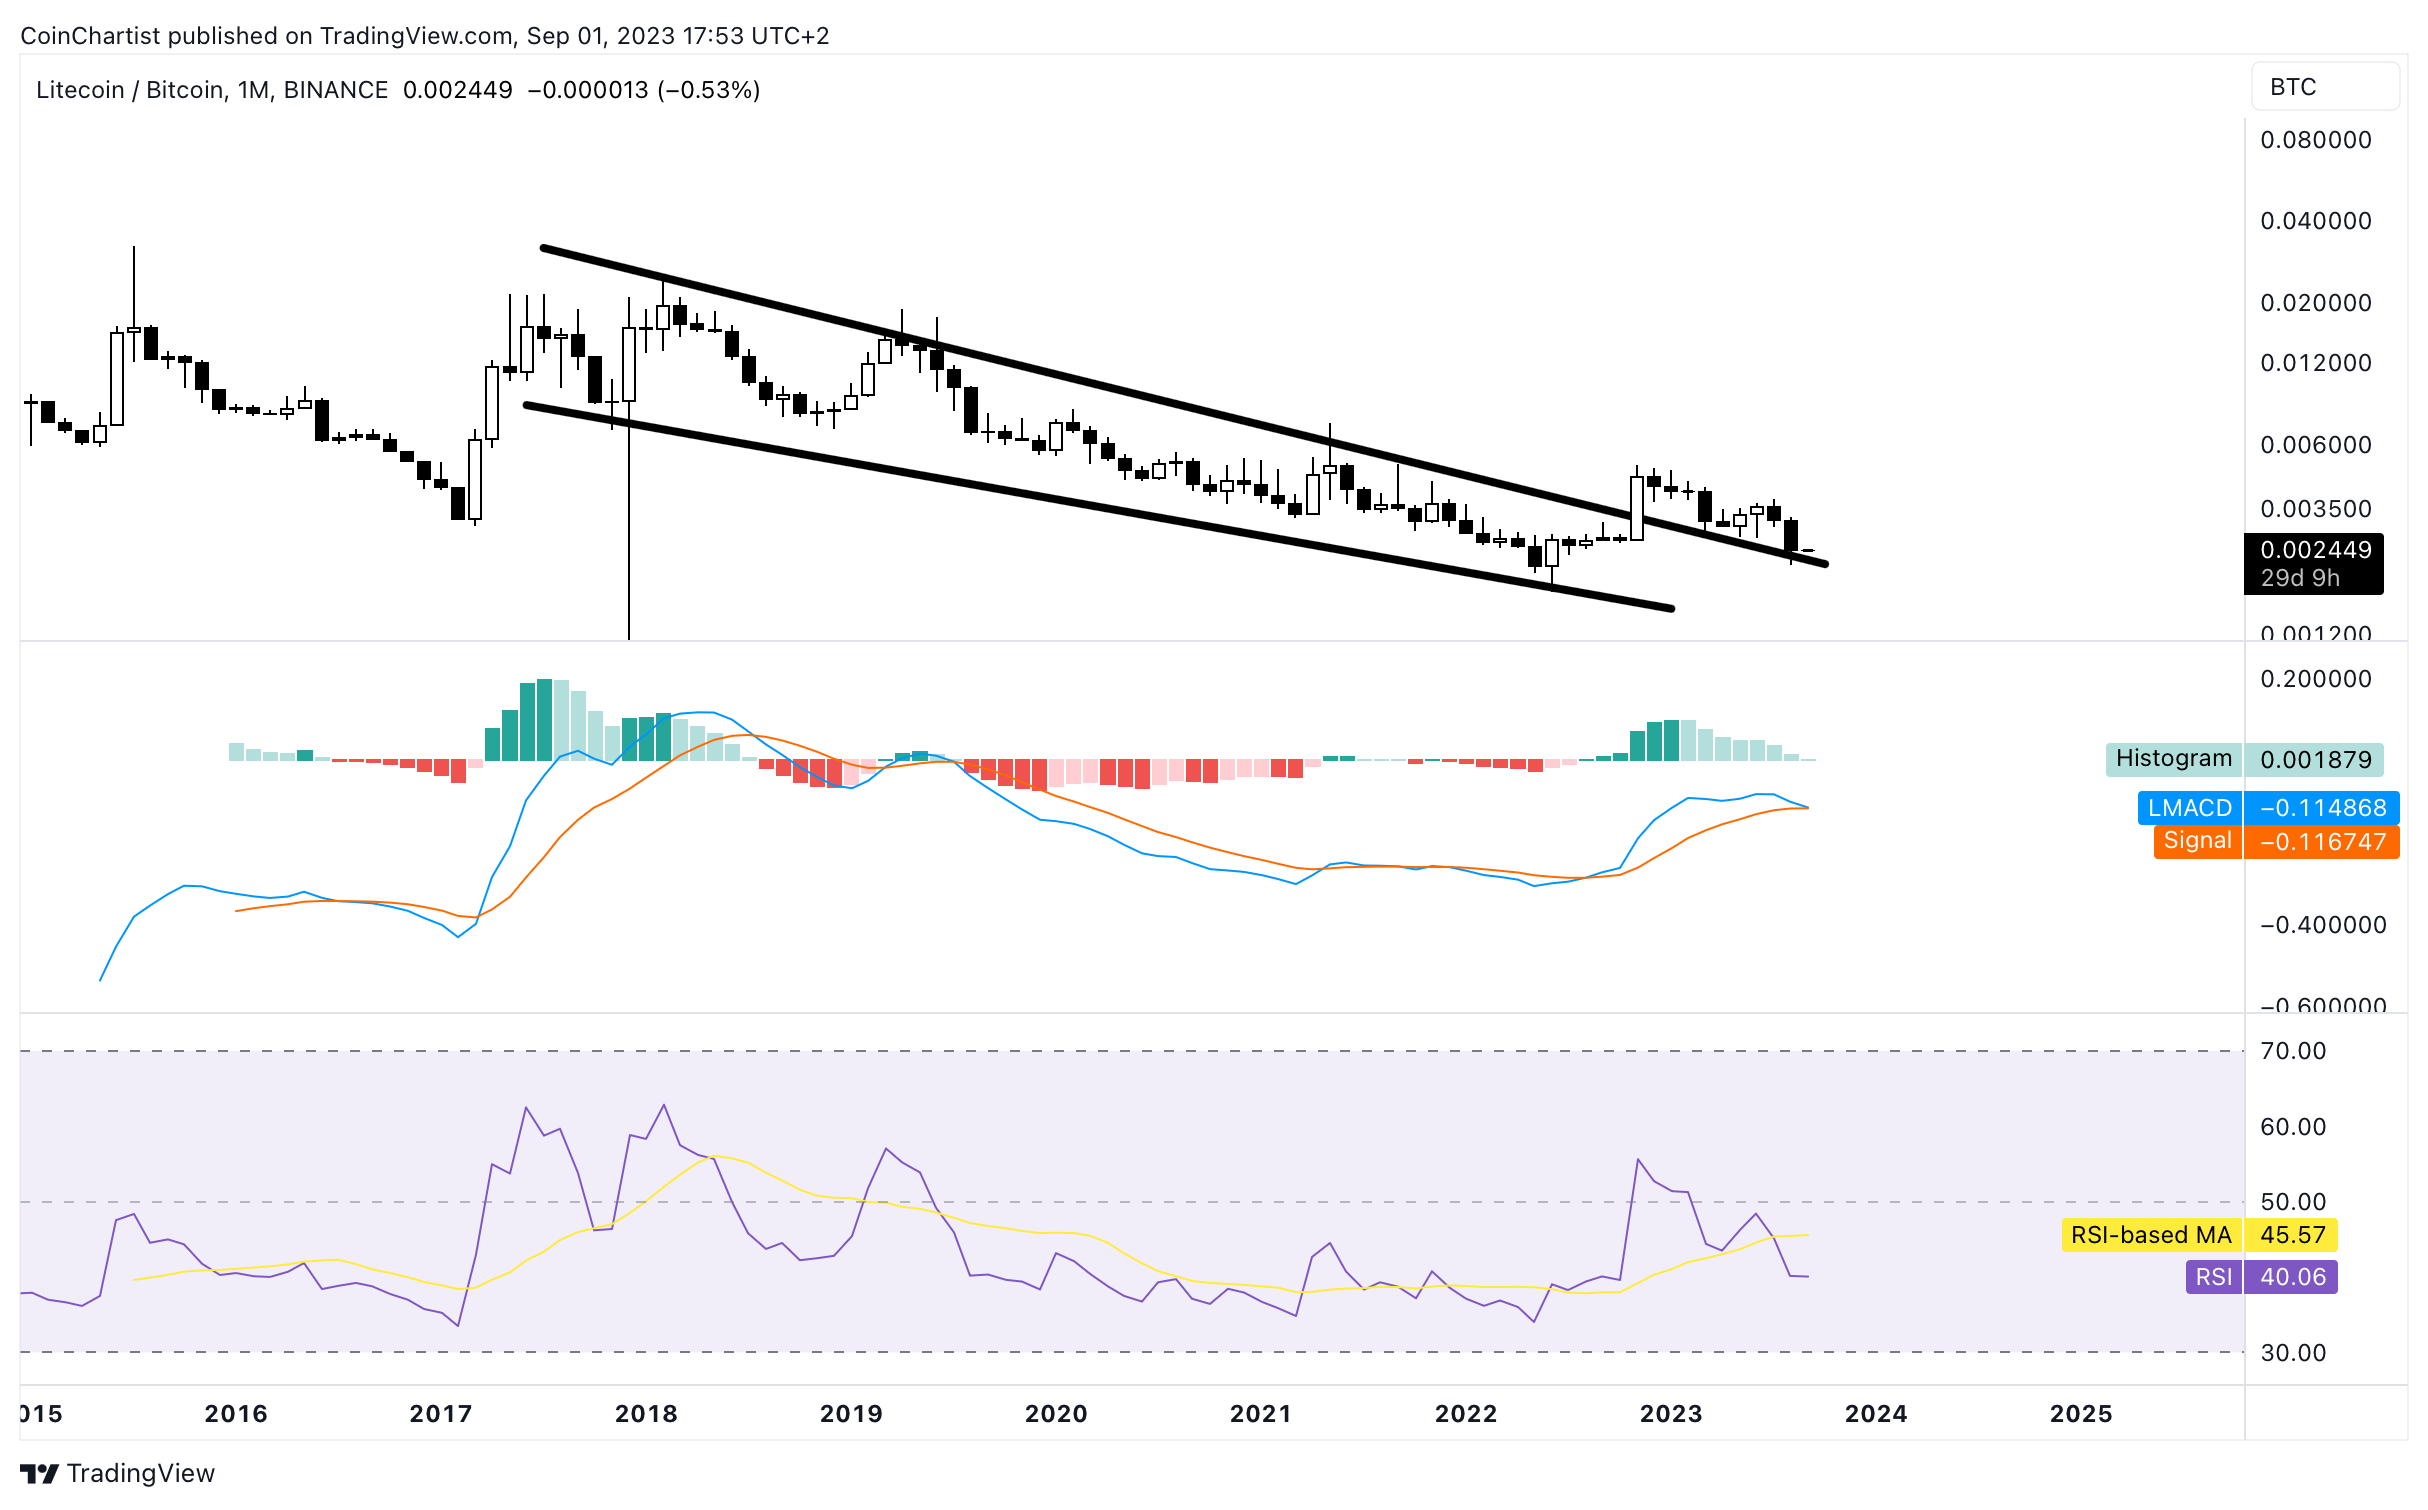
Moving away from USD pairs and instead putting alts up against BTC, we have the LTCBTC trading pair retesting a long-term downtrend line. Again, the monthly LMACD is at an important inflection point, ready to cross bearish and see Litecoin crushed against Bitcoin, or diverge upwards and save Litecoin from further collapse on the USD pair. Only time will tell, but where price chose to stop appears noteworthy.
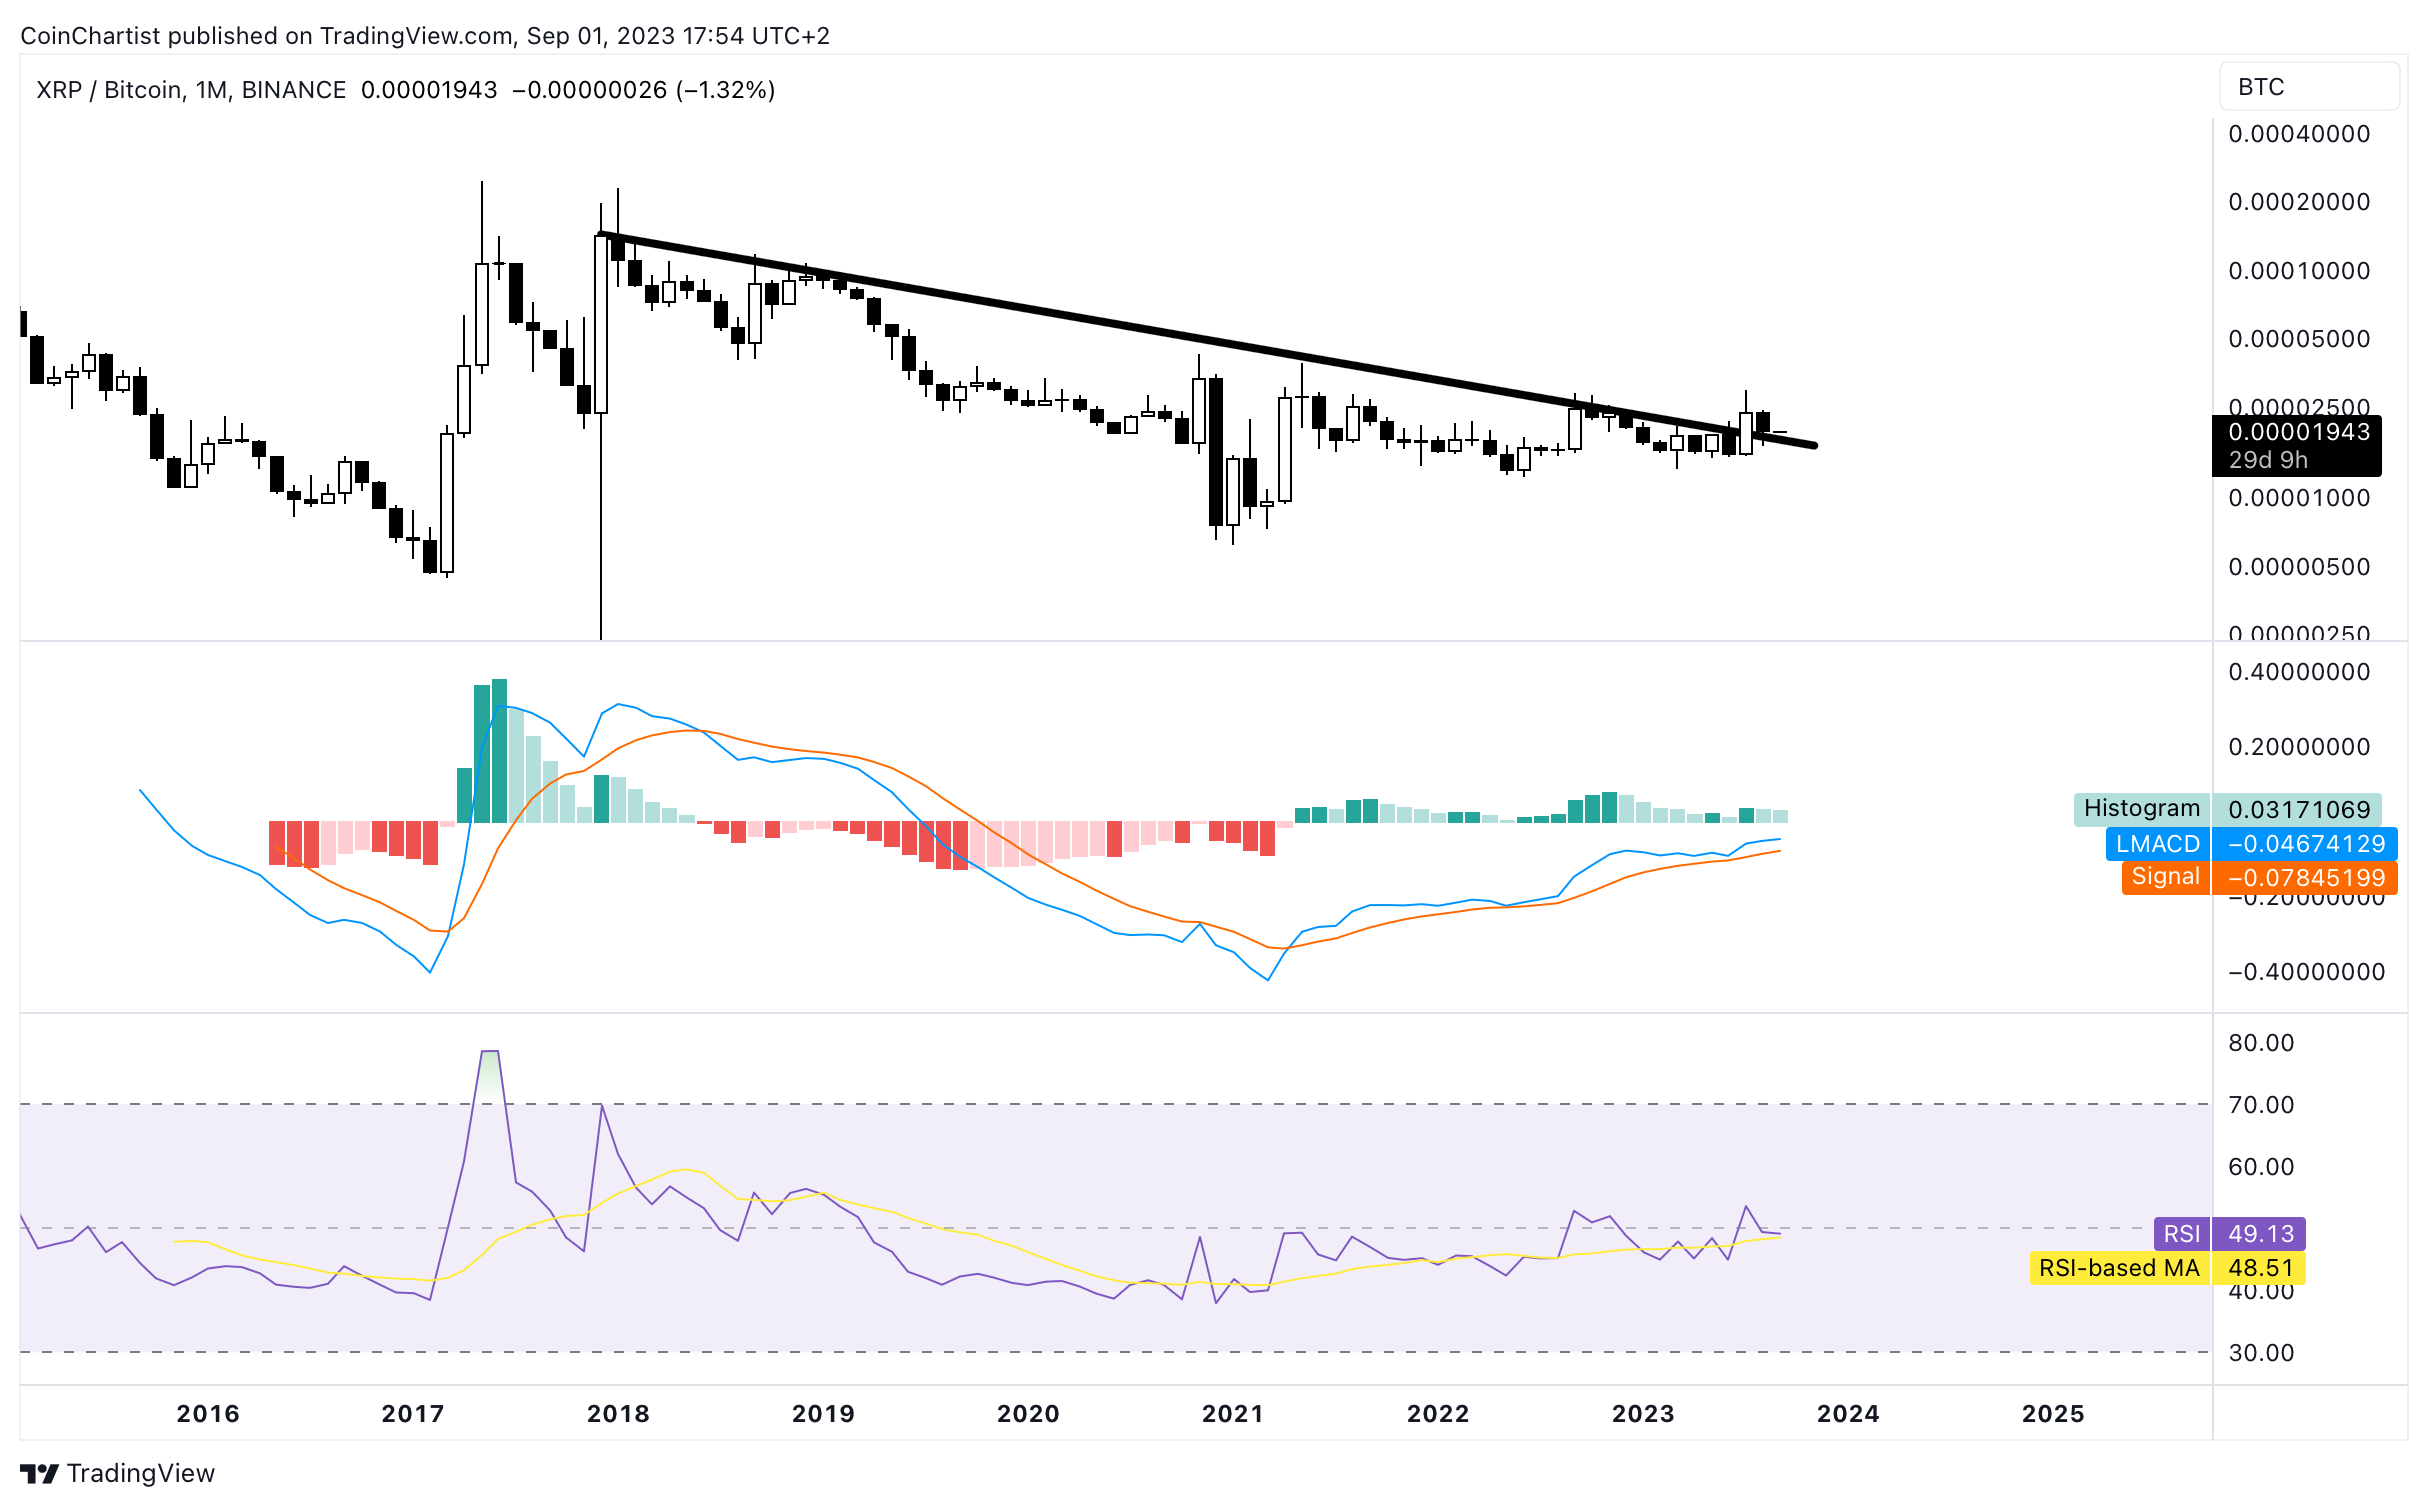
Once again, Litecoin and XRP exhibit similar behaviors, even in their BTC trading pairs. XRPBTC is retesting a downtrend line breakout, much like LTCBTC. If the LMACD can move above the zero line, and the RSI push above 50, a rally could materialize. Also of note, XRPBTC fended off a Bearish Engulfing pattern. Failed bearish patterns are in essence bullish patterns themselves.
Learn more about the Relative Strength Index here.
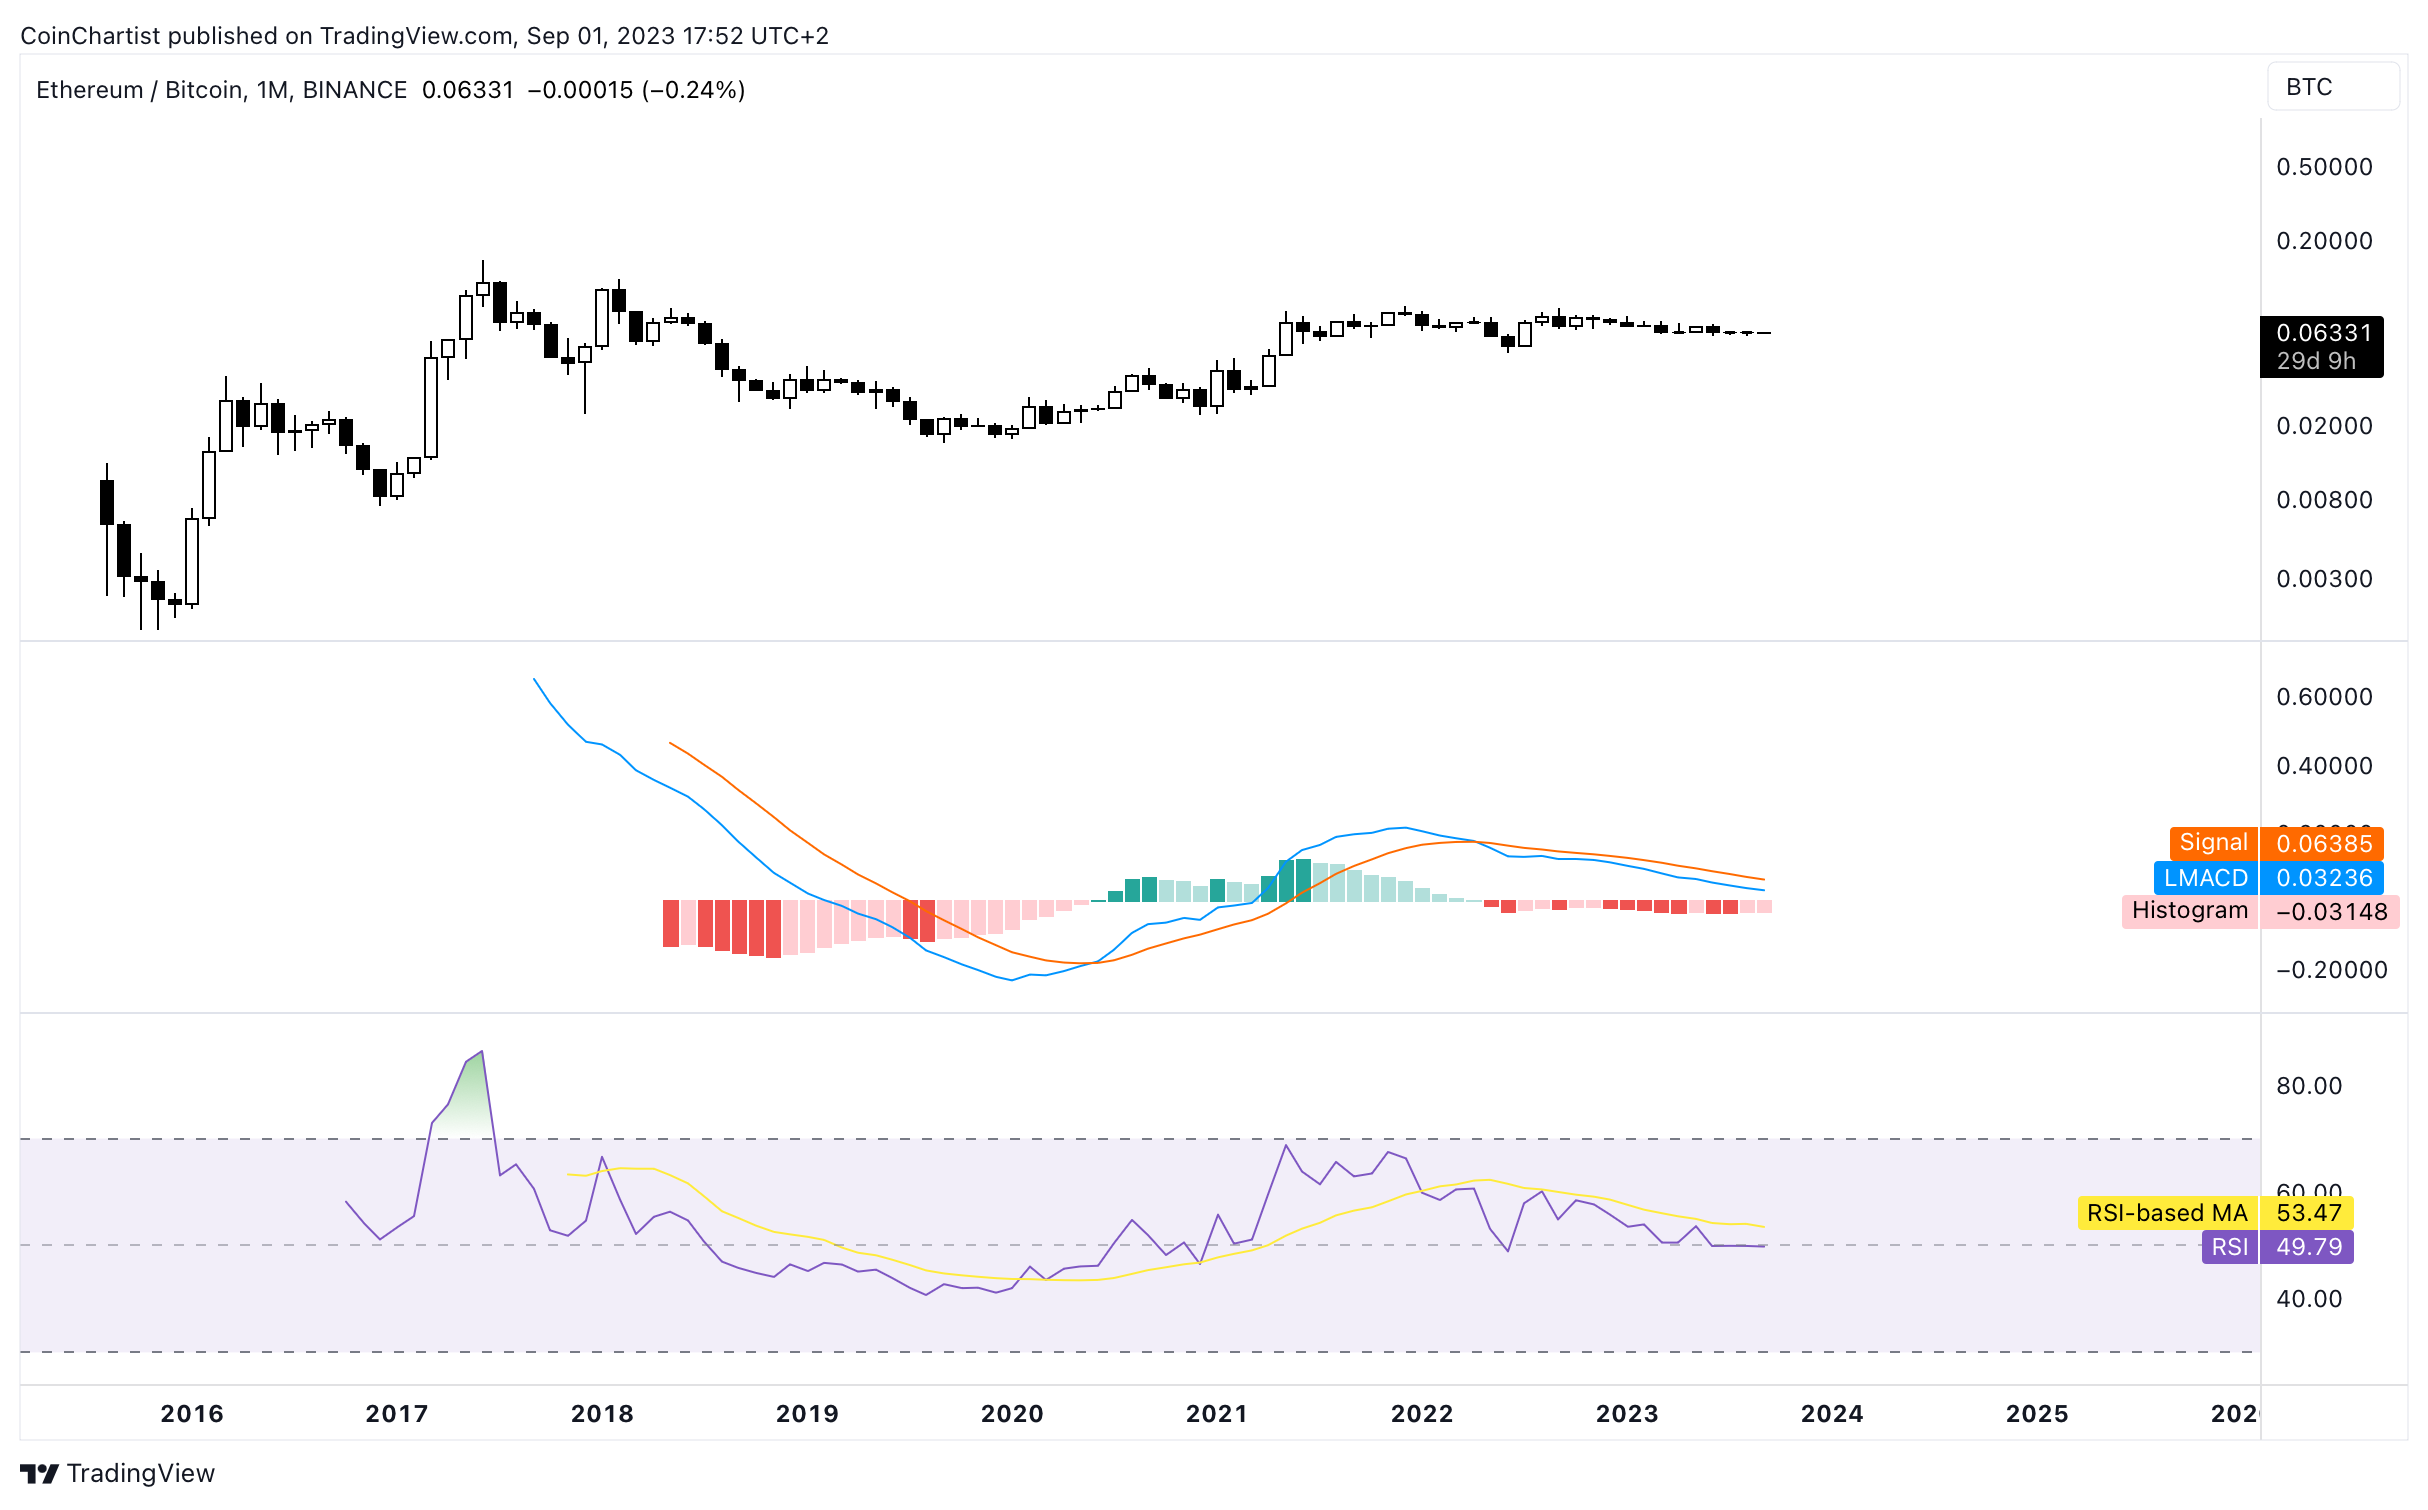
While the ETHUSD trading pair had the worst technicals of the monthly charts against USD, against BTC, the pair could be in the process of bottoming out. Bitcoin has dominated the market for most all of 2023, but at no point during this process did ETHBTC lose the 50 mark on the monthly RSI. LMACD momentum is weakening, and with ETHUSD trailing so far behind BTCUSD, we could see Ethereum place catch up via the ETHBTC pair soon enough.
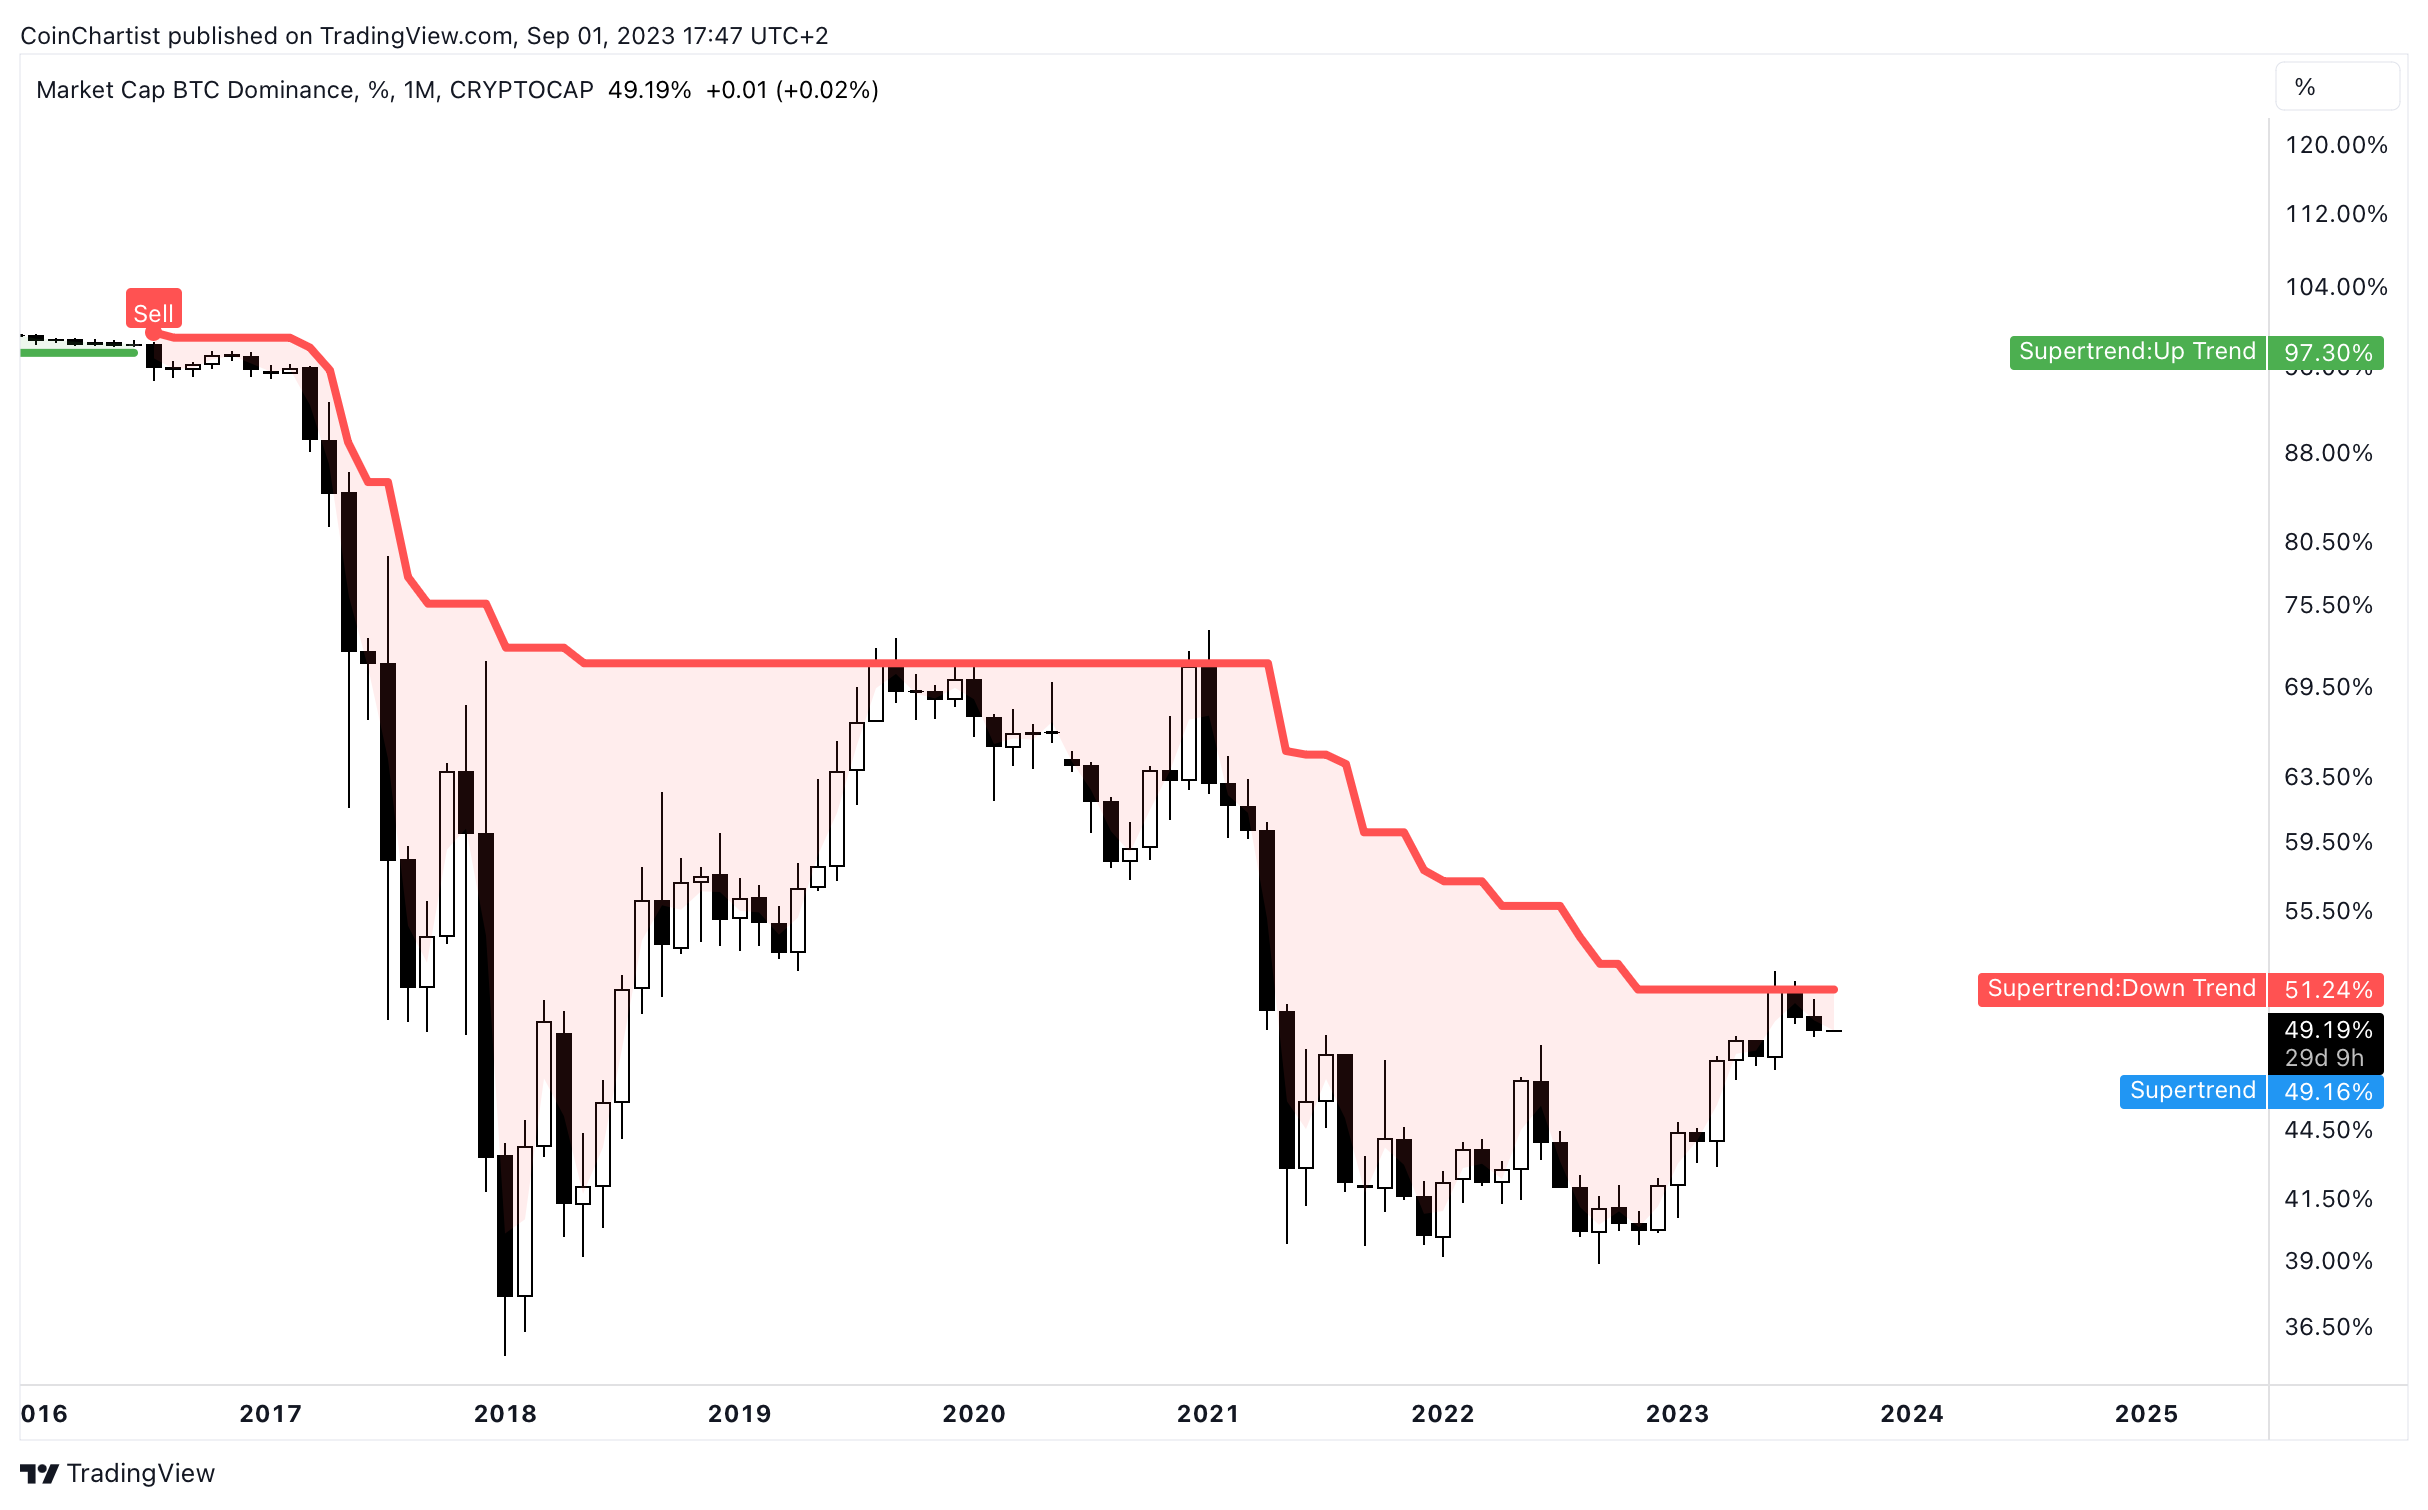
For these altcoins to suddenly outperform Bitcoin, a reversal is necessary in Bitcoin dominance. That might be exactly what we are getting. BTC.D continues to be rejected from the SuperTrend dynamic resistance line. Major rejections from the SuperTrend have created altcoin seasons in the past. To reiterate my stance, I am not saying that’s what is coming, but if one suddenly appears, don’t be surprised. The alternative is an altcoin apocalypse, so this signal in dominance is a positive development.
Learn more about the SuperTrend here.

Even the stock market is showing that things are at an inflection point. Last week’s issue discussed the dying correlation between the S&P 500 and Bitcoin, which as of the August close has officially broken down. August was a crucial month, but September is shaping up to be even more important for traditional assets, and possibly the global financial market as a whole.
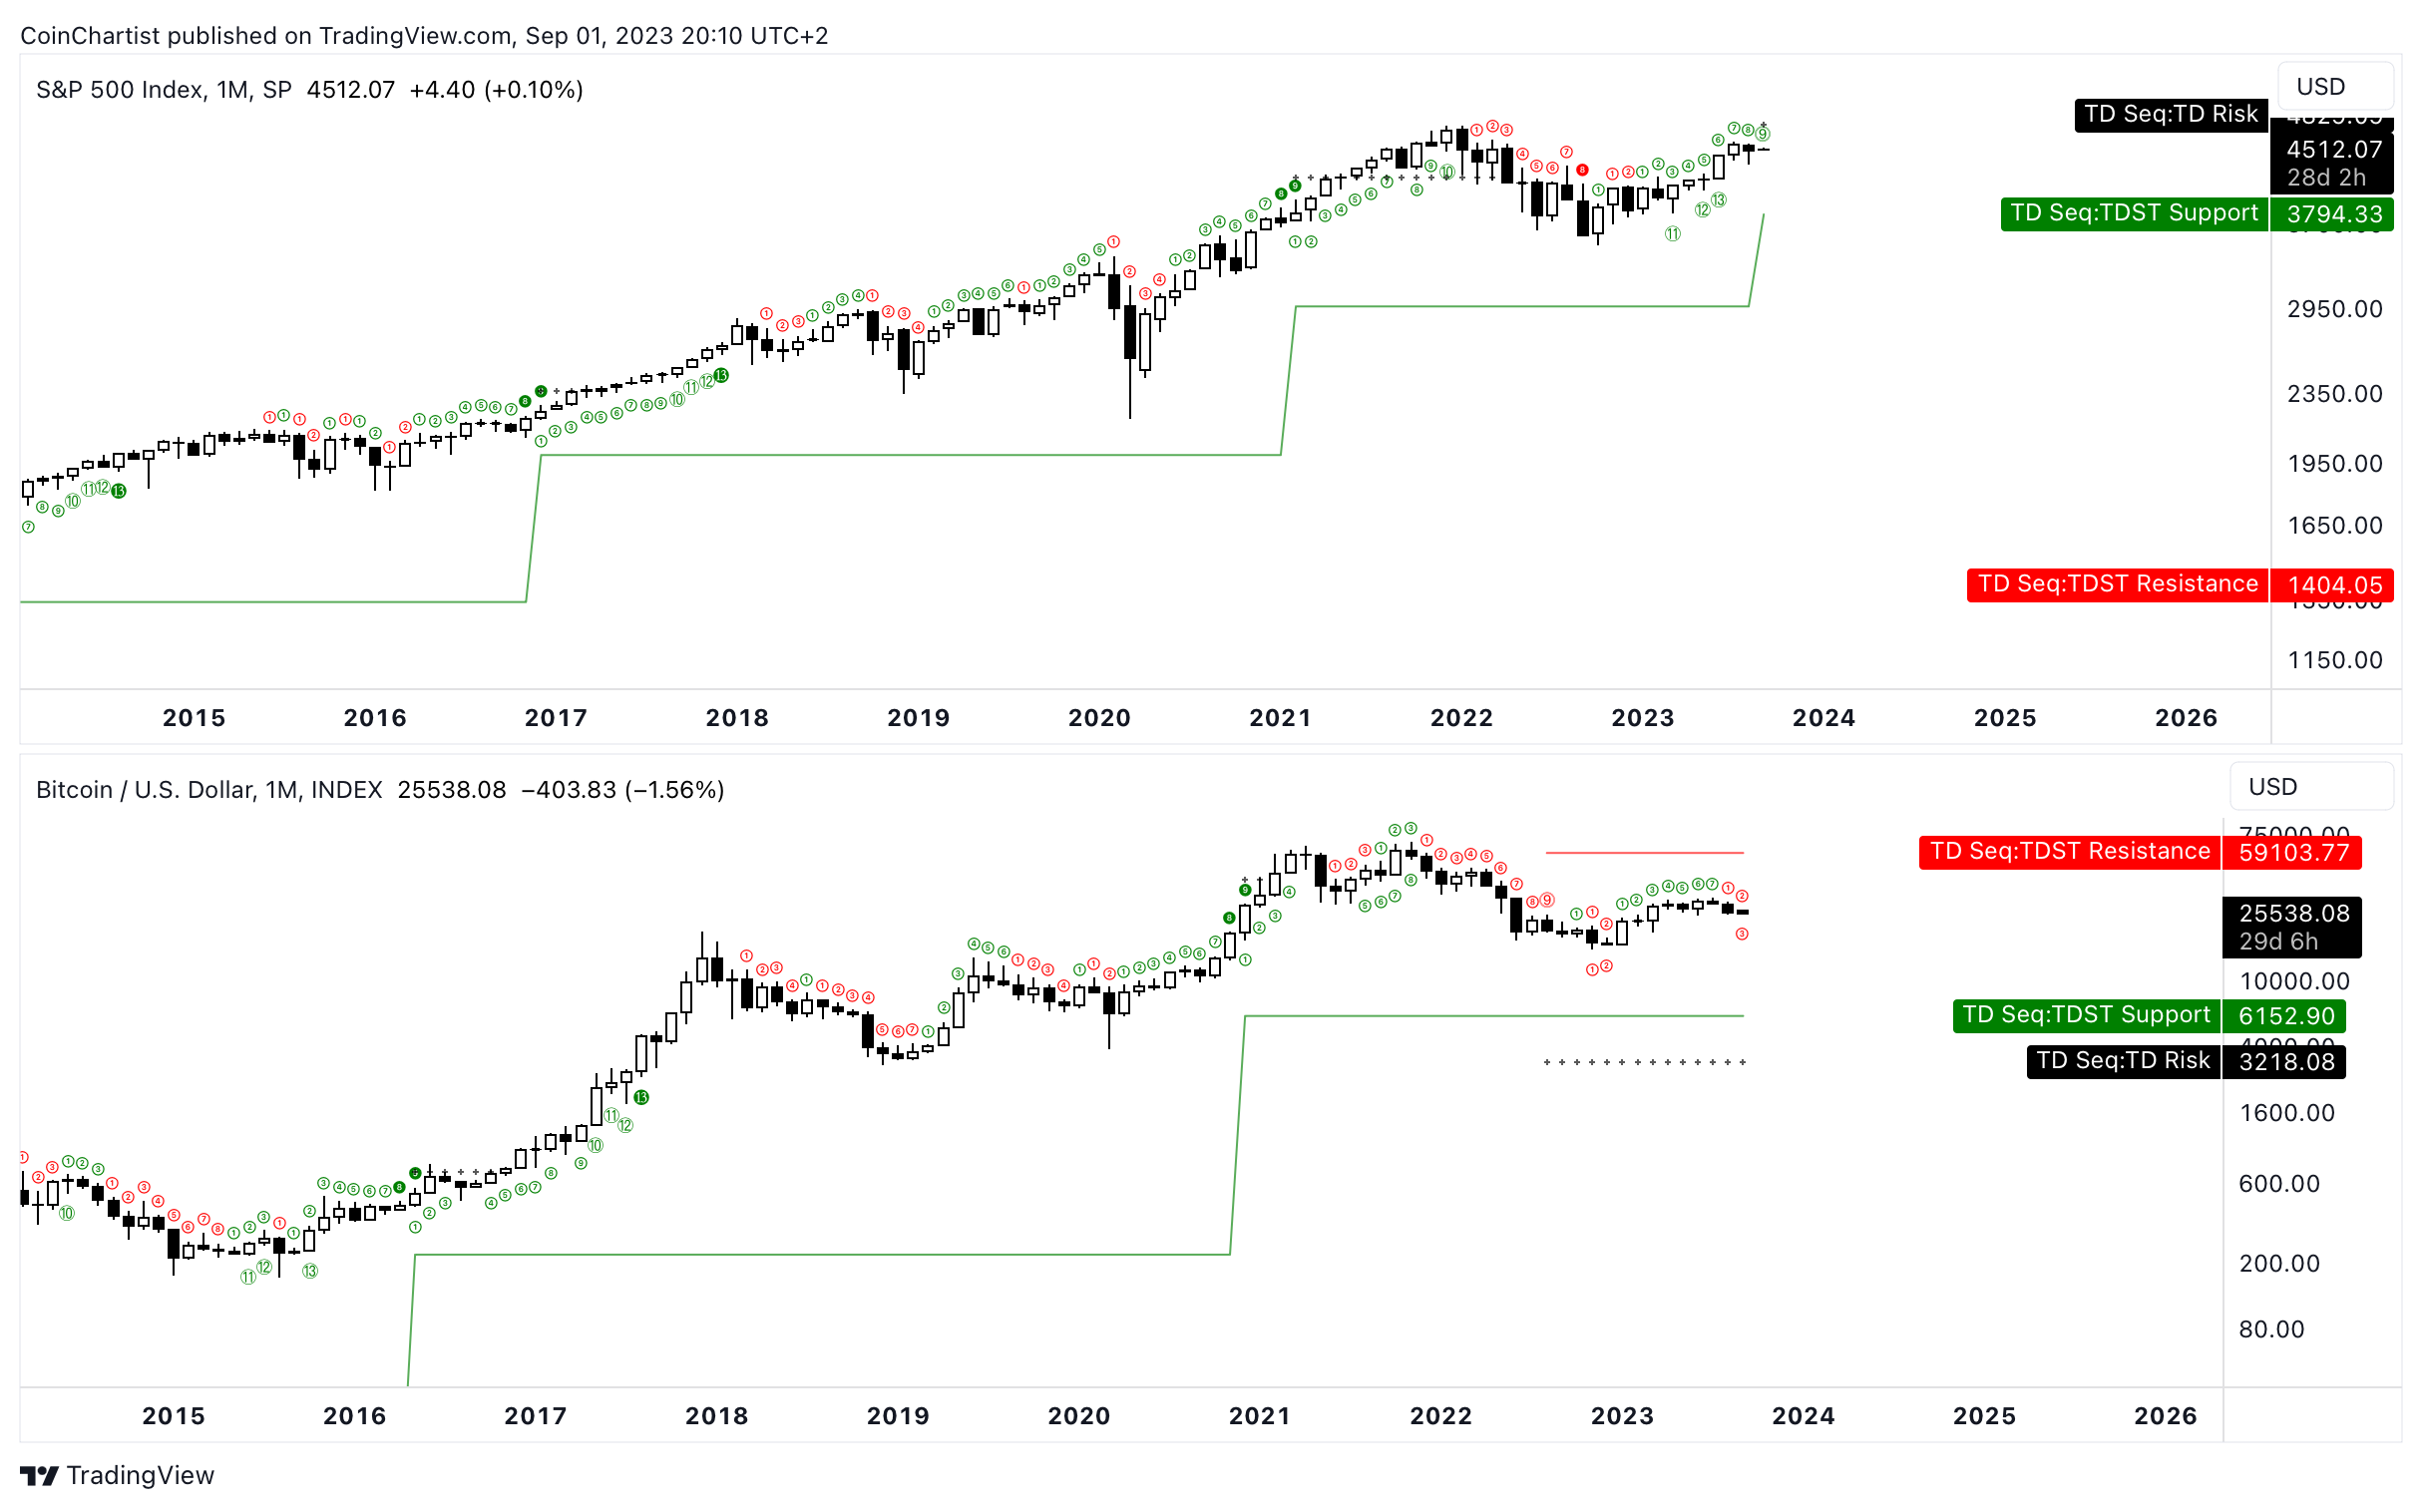
The chart above shows the S&P 500 at a TD Sequential TD9 sell setup. The signal has yet to “perfect” which occurs when price makes a higher high during the sequence. Pay close attention to how the stair-stepping action of TDST support rises when the TD count reaches an 8 and 9. Also, notice how Bitcoin has failed for the first time in its history to follow the same positive sequence as the stock market. The chart also shows TDST resistance in BTCUSD, but not on the SPX. What happens in the S&P 500 this month will shape what happens in crypto and Bitcoin. If the stock market fails to set a new all-time high, serious new lows could be ahead as the market at large loses confidence in a recovery. Bitcoin could be telling this story early. If stocks set a new all-time high, historically, so will Bitcoin in the coming months.
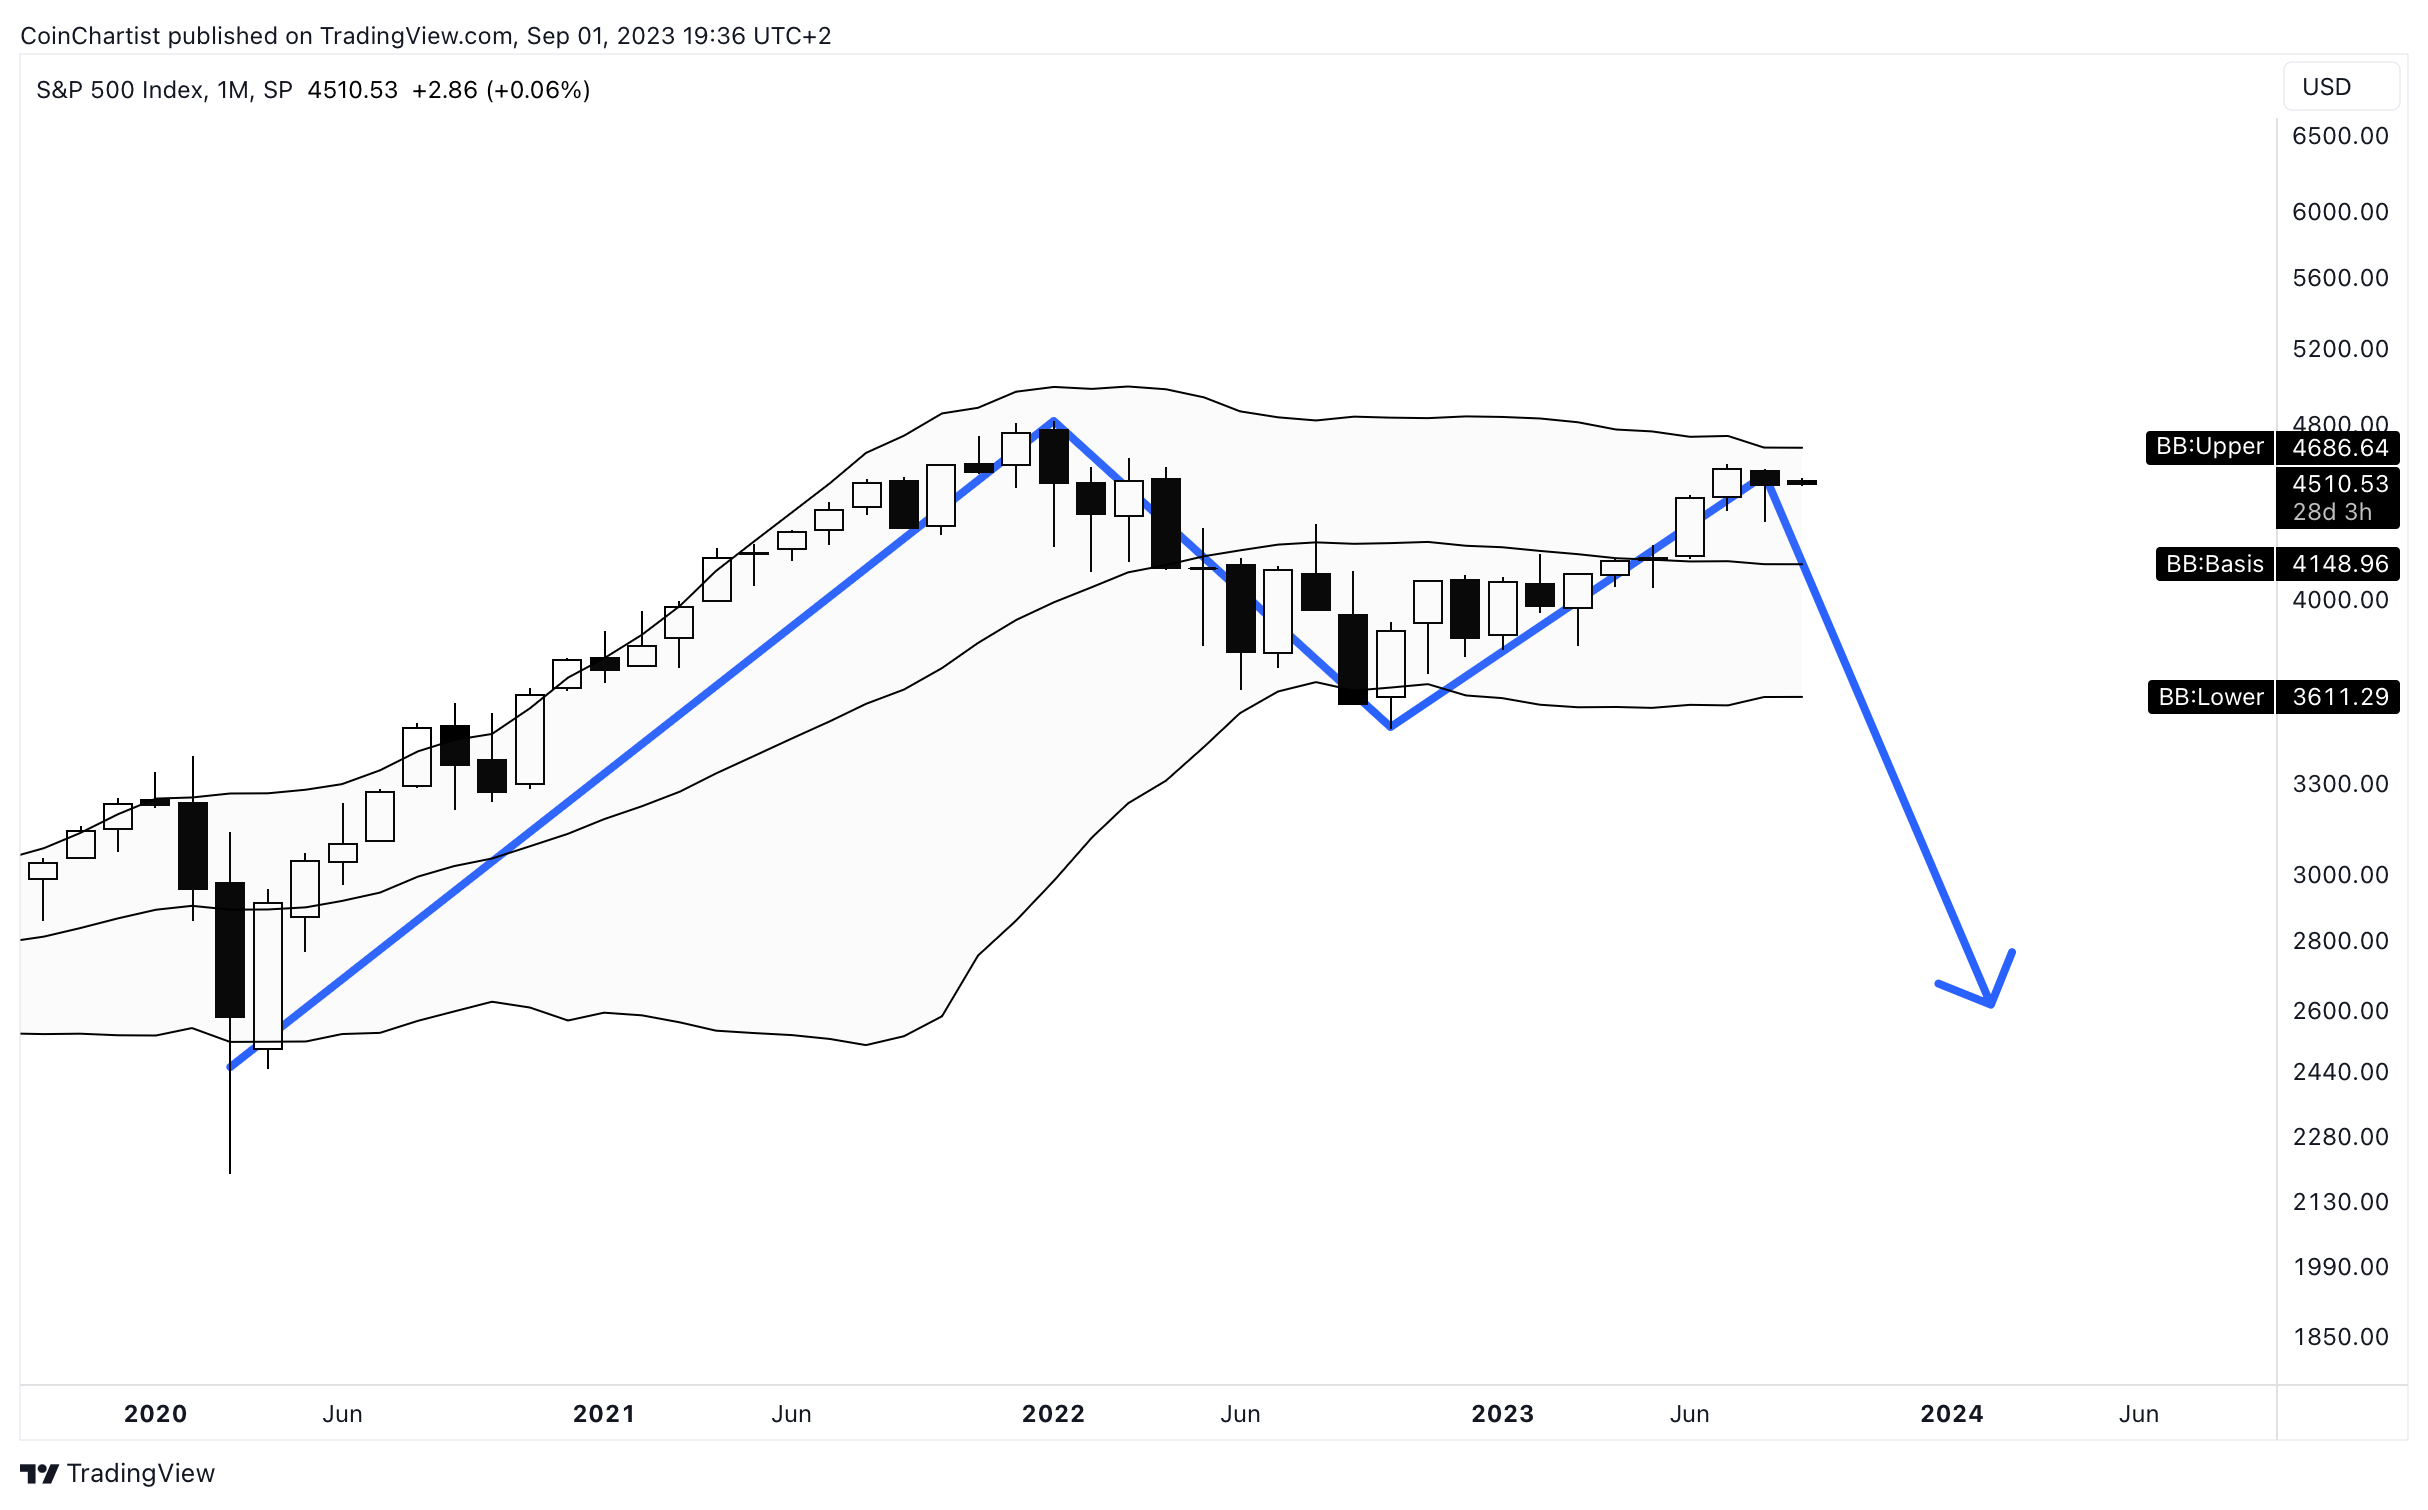
Failure to set a new all-time high in the S&P 500 will also be a failure to tag the upper Bollinger Band. This is an important factor in identifying Merrill’s M-type top patterns, which could suggest a long-term reversal in the stock market. How this impacts crypto is anyone’s guess. Correlation breaking down in this case could perhaps be positive for crypto, as stock market money seeks potential alpha wherever they can find it. But that’s wishful thinking in a horrible scenario.
Learn more about the Bollinger Bands here.

More mixed signals come when comparing the DXY versus Bitcoin. The DXY failed to close above its monthly Bollinger Band basis, but is now making another attempt to get above it. Bitcoin’s “Index” on TradingView shows an anomaly in the open of September in BTCUSD where the open is mid-way into the previous candle. Oddly enough, the open is above the Bollinger Band basis on this chart, but not others. I don’t have any data to back this up, but other instances I have spotted Japanese candlestick anomalies have lead to reversals.
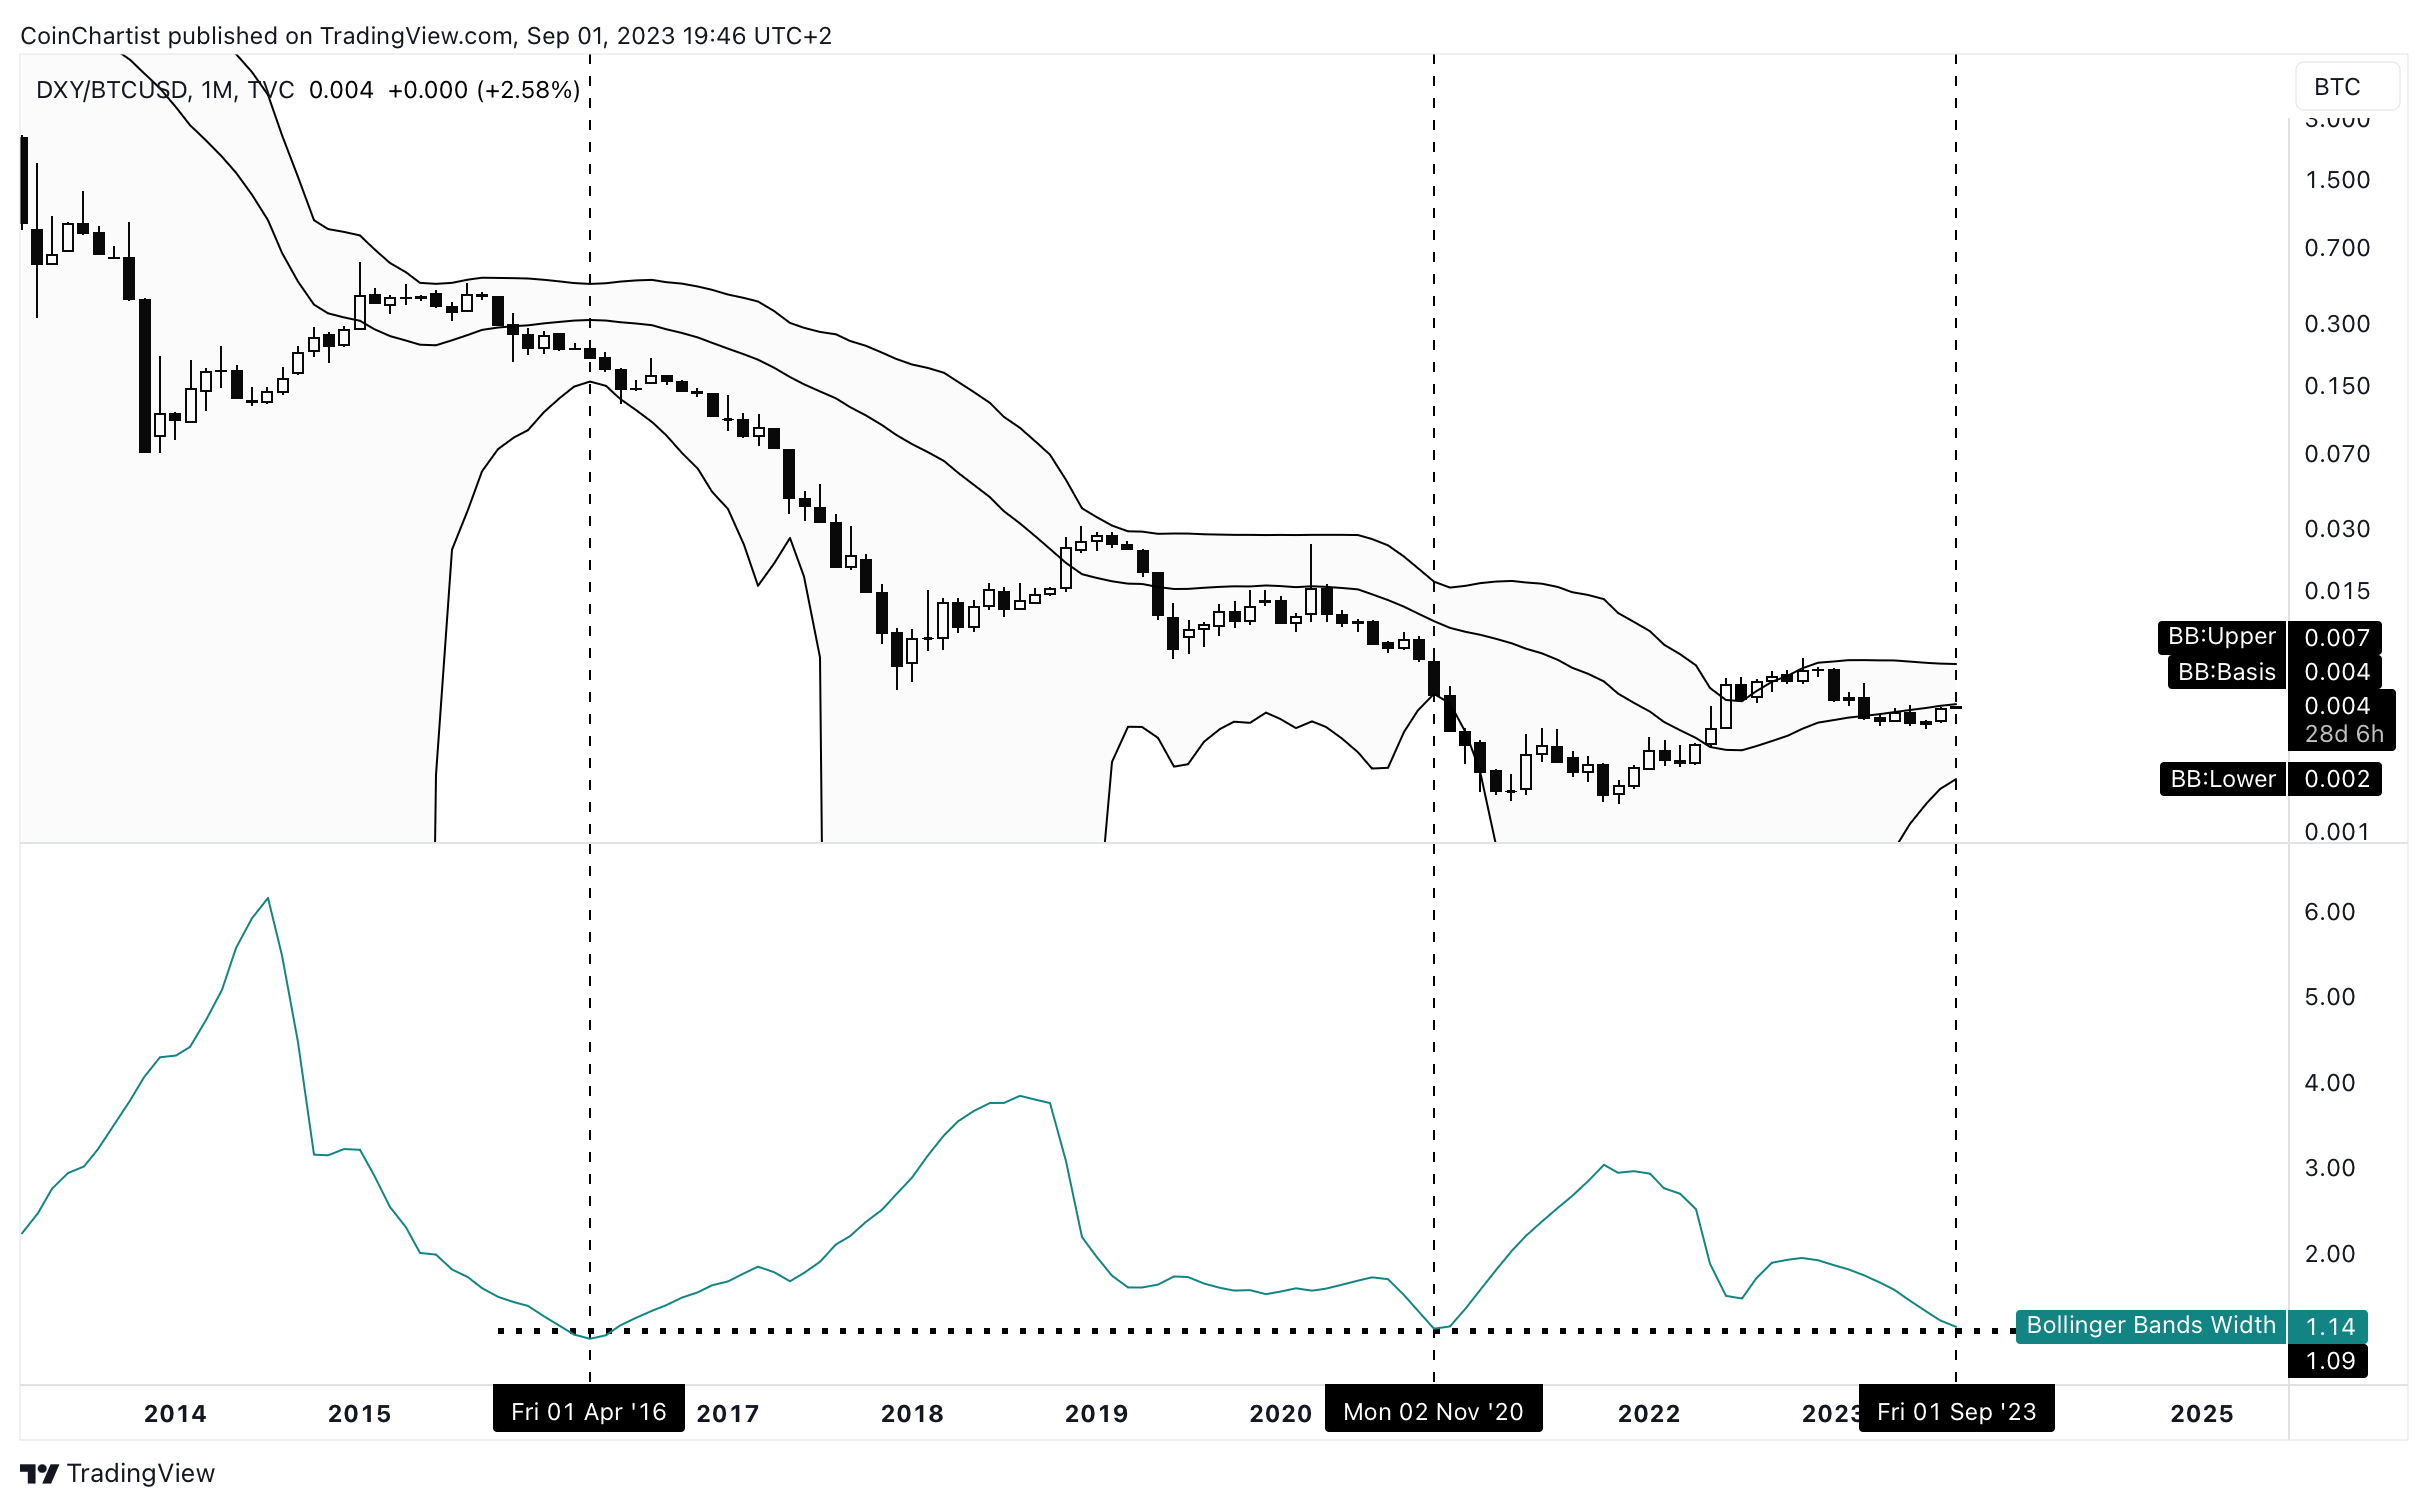
An unusual chart I watch is the DXY/BTCUSD trading pair, which puts the weighed index of currencies trading against the dollar against BTCUSD. The result is a slightly different, inverse Bitcoin chart. In this unorthodox chart, Bitcoin is above the Bollinger Band basis and held a retest. Bollinger Band Width is at historic lows that each time has resulted in a major bull run. Could this be an early indication of what might happen on the standard BTCUSD trading pair? It is worth watching and will be featured in future issues.

Another hopeful chart for crypto comes from Coinbase Global (COIN). COIN also fended off a Bearish Engulfing pattern, which held above resistance turned support and is a neckline of an Inverse Head and Shoulders pattern. The target of the pattern is a 140% move, which if reached, I would imagine helps pull the crypto market higher as well.
Learn more about the Inverse Head and Shoulders here.
That’s it for free content. The best content is always reserved for premium members and Founding Member VIPs.
Behind the paywall is an all-new section on BTC miners like MARA, RIOT, and more. There is also a brand new alternative wave count putting Bitcoin in an “ending diagonal.”
Finally, this is our most comprehensive Chart Class yet on the Evening Star pattern that formed in BTC last month. Is this light’s out for the bull run? Find out what the statistics tell us.
Note: CoinChartist (VIP) Founding Member Coin NFTs are available on OpenSea. Buy one there or sign up for the Founding Member subscription through Substack to secure your favorite. Above you’ll find a list of all currently available coins. Founding Member Coins enable access to a VIP Telegram channel, 1-on-1 TA training with Tony, and more.
Keep reading with a 7-day free trial
Subscribe to CoinChartist (VIP) to keep reading this post and get 7 days of free access to the full post archives.