Issue #21 | Holding The Line
Bitcoin remains above key invalidation levels, altcoins are hanging on by a thread, and inflation is ready to rise.
Issue #21 of CoinChartist (VIP) overview
Bitcoin holds several key levels and possibly targets confluence at $42,000
Altcoins attempt recovery at critical trend lines
Is the impulse here in Bitcoin? Find out in Wave Watch, plus a cyclical look at Ethereum and Litecoin
Inflation is ticking upward and interest rates keep climbing. How does this impact crypto and the stock market?
Bitcoin sets a new all-time high against… Don’t miss this chart.
Chart class shows you how to create custom charts and indexes.
Remember, a premium subscription comes with access to custom technical indicators like the Raging Bull, Trend Wrangler, and more.
Disclaimer: The information provided in this Substack newsletter is for general informational purposes only and should not be considered as financial advice. Investing involves risk, and past performance is not indicative of future results. Please conduct your own research or consult a qualified financial advisor before making any investment decisions. The newsletter disclaims any liability for losses or damages arising from the use of this information.
Last month’s breakdown in Bitcoin after months of sideways consolidation put the leading cryptocurrency by market cap in a dangerous position, making a defense by bulls on lower timeframes critical to recapturing the trend. BTC has since held several key levels as we’ll outline below. As long as price action doesn’t carry to a new low, the situation is going to change rapidly in Bitcoin with a target of $42,000.
Using classical charting methods, Bitcoin price has now twice retested the neckline of an Inverse Head and Shoulders bottom. The resistance to support flip happens to be taking place at a Rising Window from 2020. In Japanese candlesticks, gaps are called “windows” which are left open or closed. At the same time, BTC is also retesting downtrend resistance. Taking a measurement from the neckline to the head of the bullish reversal pattern projects another rise of roughly 67%, which corresponds with $42,500.
Learn more about the Inverse Head and Shoulders here.
Bitcoin weekly price action has closed and opened back inside the Ichimoku Cloud. The Tenkan-sen (blue) is crossed bullish above the Kijun-sen (maroon). While BTC still has to contend with resistance at the Tenkan-sen, surpassing it makes the top of the cloud the next logical target. This is where we can see confluence with the measure rule target from the Inverse Head and Shoulders pattern.
Learn more about the Ichimoku here.
In addition to the horizontal support zone holding and bears failing to produce a lower low, BTC has still yet to close outside the lower Bollinger Band signaling a breakdown. This has been discussed for going on the sixth week in a row, but a “Head Fake” has yet to be invalided. A push to the upper Bollinger Band and close above it would signal a valid breakout and confirm the post-Squeeze “Head Fake.”
Learn more about the Bollinger Bands here.
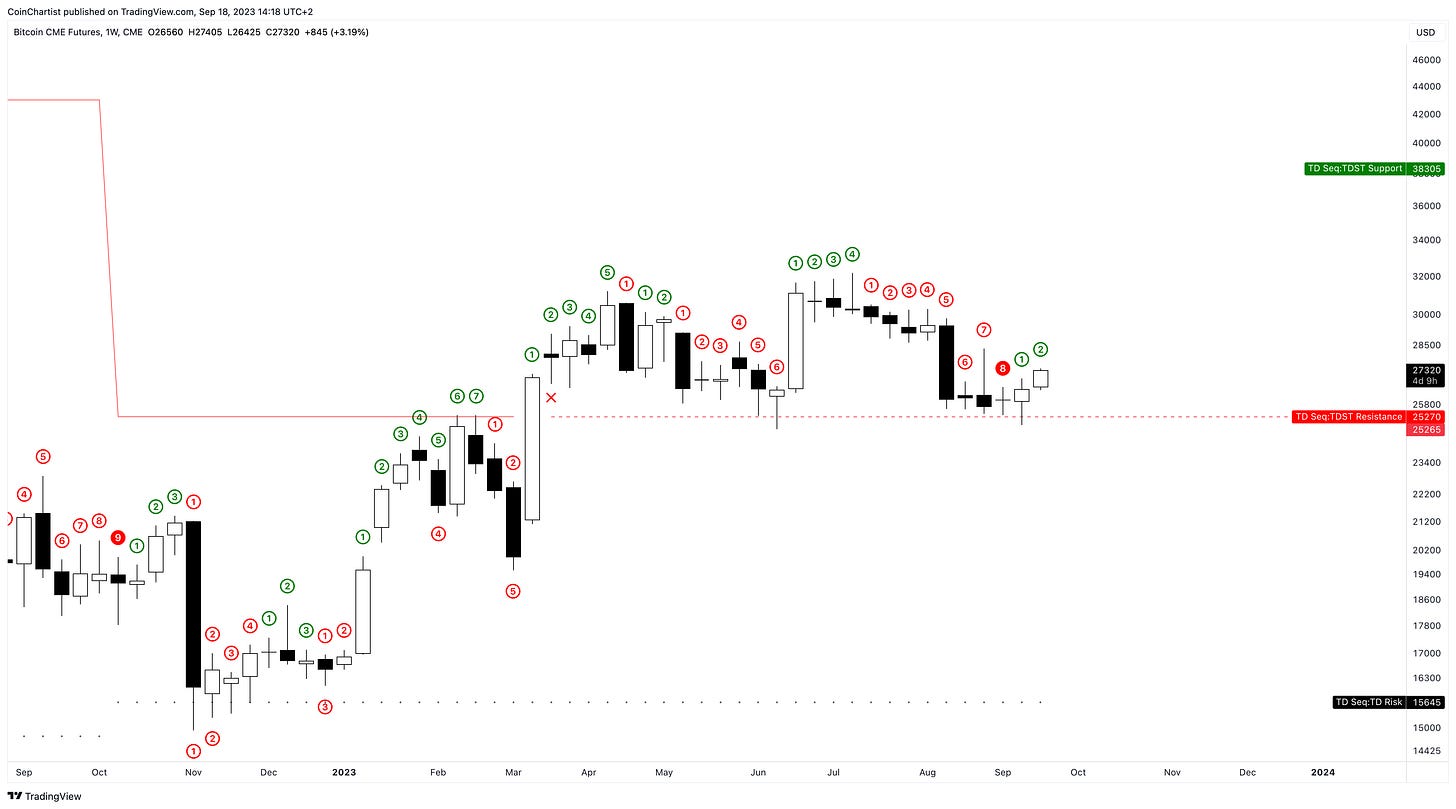
Bitcoin reached a “perfected” TD9 buy setup the moment it poked below the red dashed line representing former TDST resistance potentially turned support. The 9 is no longer left on the chart, instead turning into a 1 signaling a potential new uptrend. The second candle opening as a 2 could further cement the beginning of a new trend upward.
BTC CME Futures perfectly retested my custom Trend Wrangler indicator for the second time in 2023. Both times now have ultimately held. The tool was designed to suggest an asset is bullish above the span, bearish below it. Remaining above it is critical to continuation to the upside.
Learn more about the Trend Wrangler here.
Support is potentially being established according to the last several images, and in this chart, we can see that momentum is potentially weakening to the downside and could turn upward. The LMACD is above the zero line, which would make a bullish crossover even more significant.
Learn more about the MACD here.
All the above charts have been on weekly timeframes, but even the monthly is potentially forecasting a move to $42,000 per coin. This just so happens to be exactly where the upper Bollinger Bands are located. Making it to this level might only be the first stop in higher prices, however.
Learn more about the Bollinger Bands here.
The term “markets are fractal” means several things. One way this materializes in price action is by several of the same bottoming or topping patterns in succession on different timeframes. At the start of the series of charts, the measure role was used to project the target of a smaller, completed Inverse Head and Shoulders pattern. But the it might simply be a small portion of an even larger Inverse Head and Shoulders pattern, with a target of new all-time highs.
Learn more about the Inverse Head and Shoulders here.
Altcoins across the board have not performed as well as Bitcoin this year. They lack the same institution-driven narrative, have less demand for the ETF wrapper (outside of Ethereum), and suffer the most from the SEC’s heavy-handed regulatory pressure. However, even alts are finally showing some signs of recovery.
To begin, the Total Crypto Market cap chart has much like Bitcoin, perfected a TD9 buy setup, and it happened just as price retested a downtrend resistance line that was broken back in June. Total didn’t set a lower low beyond the June 2023, either. The lack of carrying to a new low here, like Bitcoin, will be significant to traders and investors who have been sidelined up until now. This is precisely why a Wave 3 in Elliott Wave Principle occurs, which we’ll dig into in our Wave Watch section later this issue.
As I’ve said in previous issues, we cannot yet expect an altcoin season, but the upside in Bitcoin Dominance appears to be capped. BTC.D is, however, turning back up while Stochastic is overbought. This can lead to a continued rally in Bitcoin Dominance, but if price fails to breach SuperTrend resistance, 1M Stoch should turn back down and continue the reversal as we saw in 2020.
BTC.D is current being supported by the 1M Moving Average Band. Once again, this setup mimics the late 2019 top that caused price to fall below the Band and cause it to turn bearish. If the Moving Average Band turns red, then we can consider talking about an impending altcoin season. But not yet. For now, focus on Bitcoin.
Ethereum has begun its bounce at a trend line that in the past led to some of the sharpest rallies and most significant gains in the altcoin’s history. The first rally added 25,000% to the price per ETH before stopping. The last time it was 5,000%. A mere 570% takes Ethereum to $10,000 per token and fills out the top portion of the Ending Diagonal.
XRP remains in a Triangle, which according to Elliott Wave Principle only appears before the final move in a sequence. The target of the move out of the Triangle should be equal to the widest point of the pattern. When this happens, XRP is going to soar, but because of this pointing to the “end” much like Ethereum’s Ending Diagonal, you definitely don’t want to be caught holding the bag when it is over.
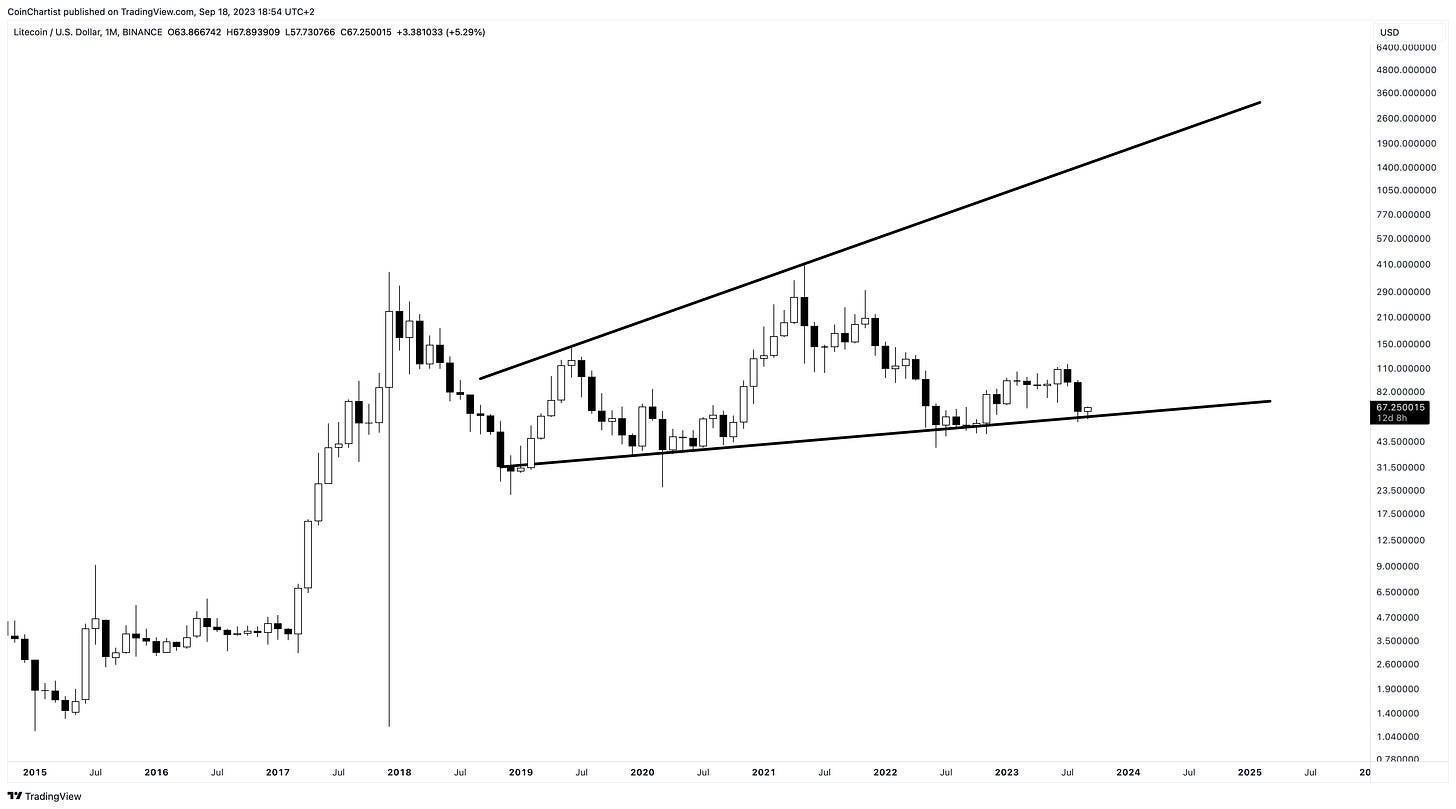
Litecoin is also potentially forming an Ending Diagonal. Ethereum’s pattern is a Contracting Diagonal, while Litecoin is an Expanding Ending Diagonal. Either way, these patterns point to the end of the crypto bull run, but not before one more move to upper trend lines occurs. While the likes of Ethereum only requires a 570% move to do so, Litecoin has enormous ground to cover, as does XRP. But because these assets didn’t participate in the last major bull run and make a new major high, they could produce a lot more upside in the next bullish impulse.
That’s it for free content. The best content is always reserved for premium members and Founding Member VIPs.
Behind the paywall is cyclical look at altcoins like Ethereum and Litecoin, plus the latest wave counts Bitcoin.
There is also several updates on inflation, which is starting to turn upward again. We discuss the impact this could have on the stock market and Bitcoin.
Finally, there is a Special Spotlight on a Bitcoin chart that is at new all-time highs, plus an educational Chart Class on how to recreate custom charts yourself.
Please consider upgrading to CoinChartist (VIP) premium to get the best content and support the CoinChartist community. Founding Members get 1-on-1 mentorship from Tony and an exclusive NFT.
Keep reading with a 7-day free trial
Subscribe to CoinChartist to keep reading this post and get 7 days of free access to the full post archives.


