Issue #22 | The Hunt for Green October
Bitcoin monthly technicals take a turn for the bullish, but the stock market looks deadly and altcoins aren't yet ready a recovery.
Issue #22 of CoinChartist (VIP) overview
Bitcoin makes a move to start October and Q4, but is rejected. What’s next?
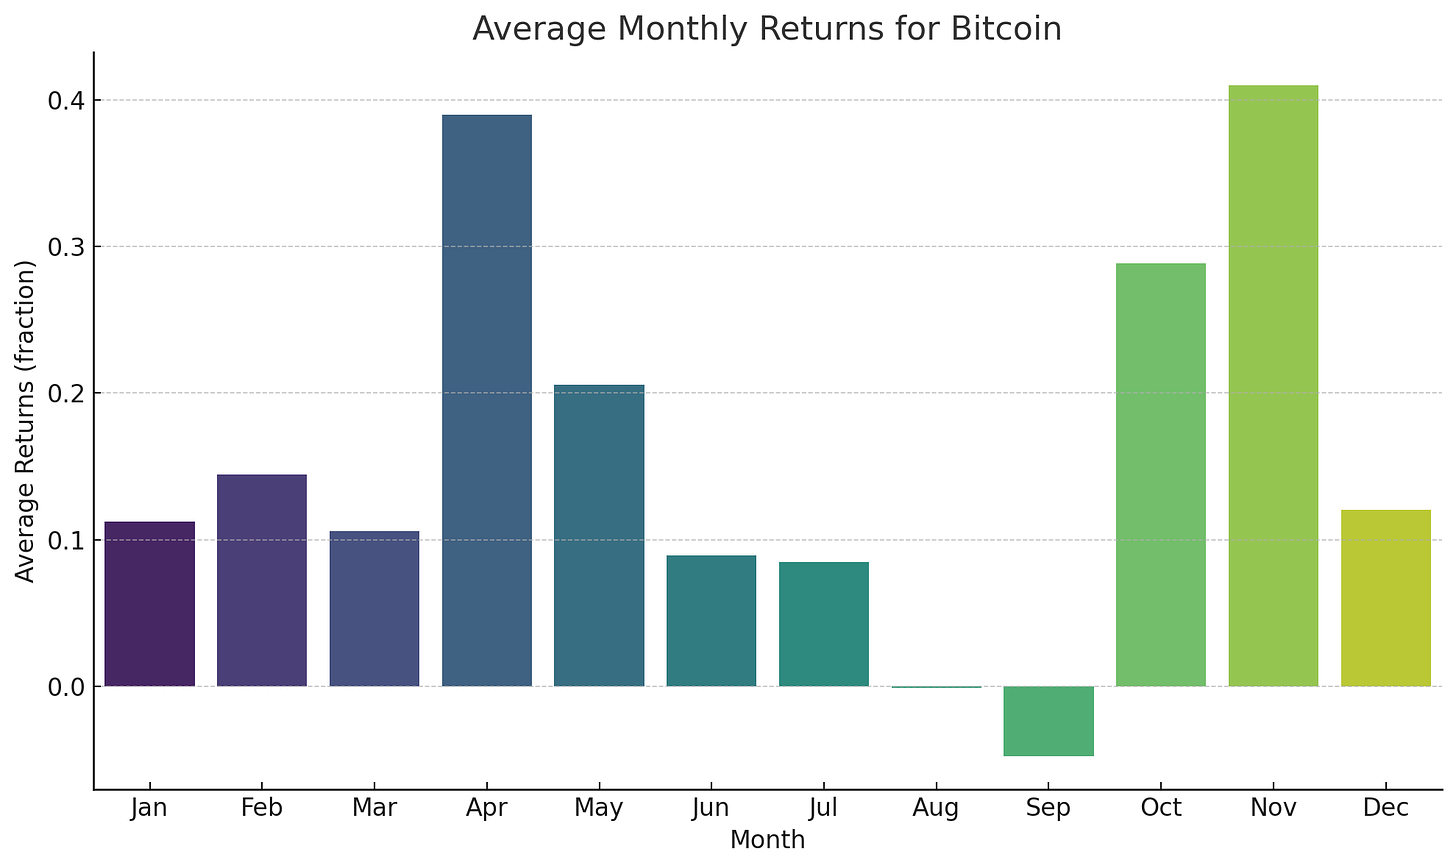
Data: October is the third most bullish month in BTCUSD historically
Ethereum Futures ETF revives altcoin market
Why one blue chip altcoin appears ready to pop
Bitcoin is poised to outperform the S&P 500 as growing correlation ceases
Possible wave counts suggesting Bitcoin could finally be ready for an impulse
An educational segment on why alternate wave counts are necessary
A special spotlight on the topic: “How high (and low) can Bitcoin realistically go?”
Remember, a premium subscription comes with access to custom technical indicators like the Raging Bull, Trend Wrangler, and more.
Disclaimer: The information provided in this Substack newsletter is for general informational purposes only and should not be considered as financial advice. Investing involves risk, and past performance is not indicative of future results. Please conduct your own research or consult a financial advisor before making any investment decisions. The newsletter disclaims any liability for losses or damages arising from the use of this information.
October began with a bang, causing Bitcoin to rally on Sunday from $27,000 to around $28,600. The top cryptocurrency by market cap is now back around $27,350. And with bulls demoralized that the rally didn’t turn into something sustainable, the impulsive price action I cover in this issue could be put on hold a bit longer. But the rejection could also be feigning weakness before the real move. Let’s dig in.
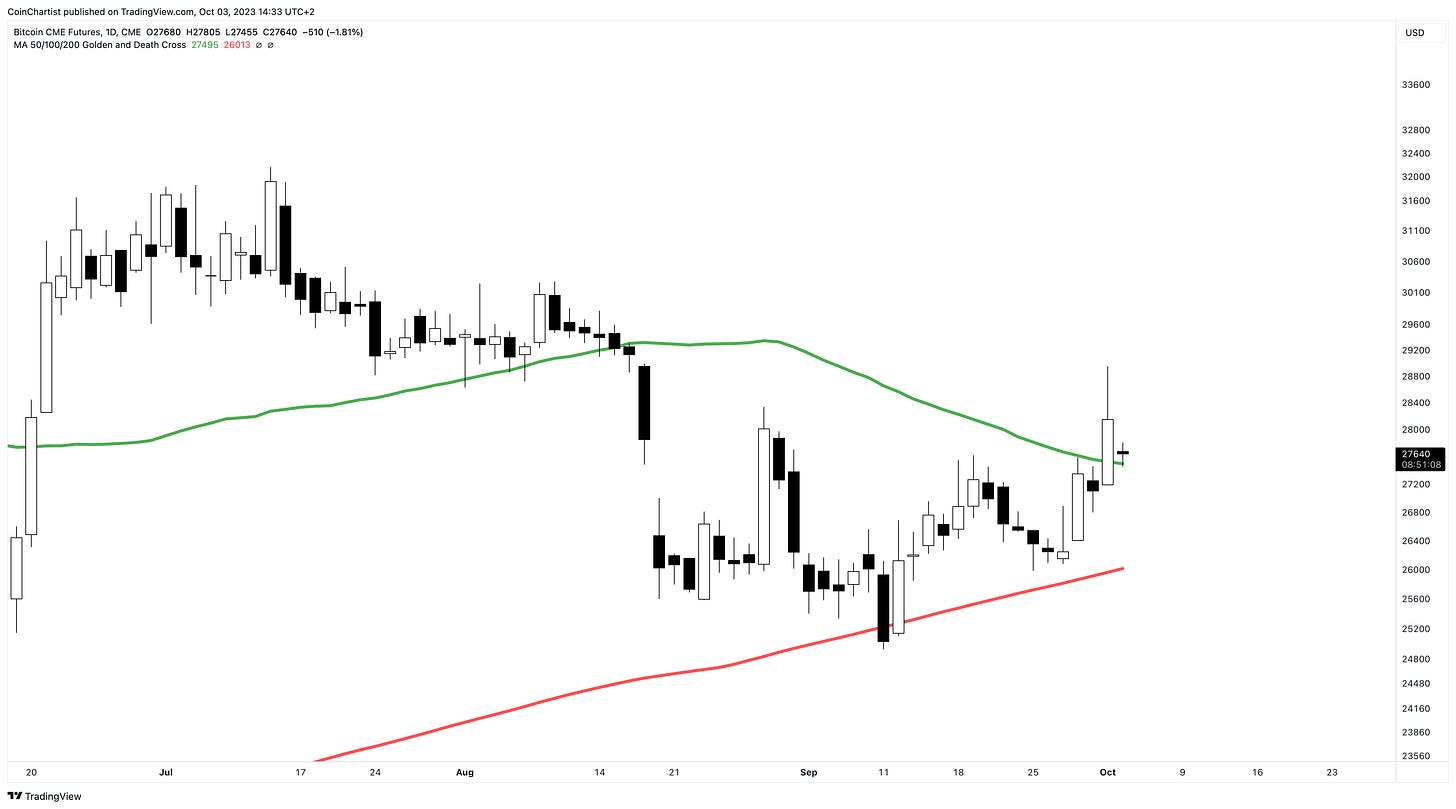
Bitcoin BTC CME has formed a Bearish Harami pattern after a failed breakout outside of the upper Bollinger Band. A close above the upper Bollinger Band is a buy signal, but price should open outside of it as well. Instead, price closed back inside the large white candle, forming the Harami. Harami means pregnant in Japanese, as the white candle appears to look as if its pregnant with the doji candle.
Learn more about the Bearish Harami here.
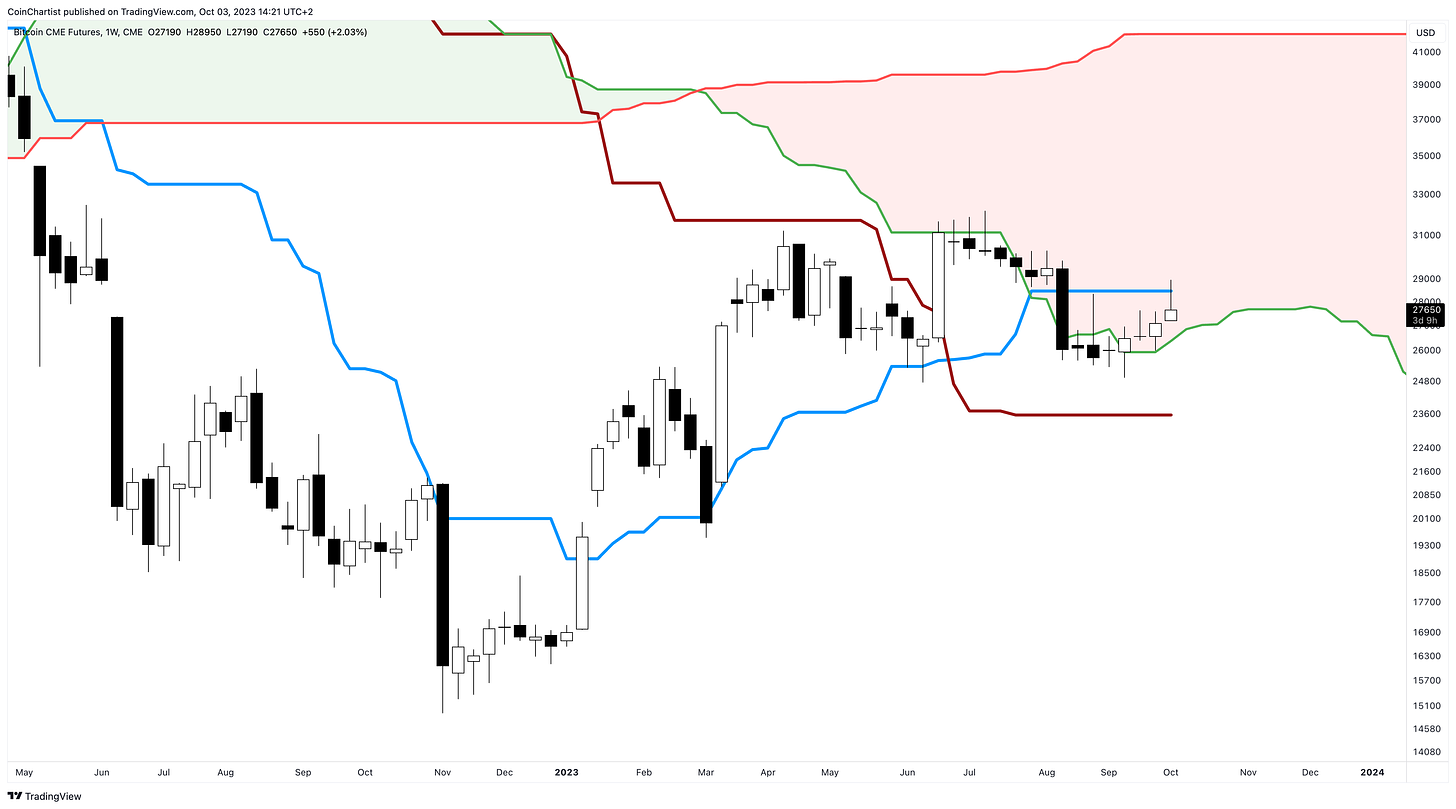
Although price temporarily made it above the Ichimoku cloud, the Kijun-sen posed as resistance and caused a close back into the cloud. Currently, the Kijun-sen and Tenkan-sen (blue) are crossed bearish, but with the Tenkan-sen rising and the Kijun-sen ranging, we could see a bull cross soon and Bitcoin leaving the cloud behind.
Learn more about the Ichimoku here.
Another not-so-great sign is the fact that the SuperTrend downtrend resistance stopped the bullish advance in its tracks. Overcoming this level will be an important step in moving higher.
Learn more about the SuperTrend here.
Most of the above is more on the bearish side, but there are two sides to every coin, and Bitcoin’s Bearish Harami is potentially holding above the 50-day Moving Average. Deceivingly, the BTCUSD spot chart features a death cross, but the BTC CME chart remains golden crossed.
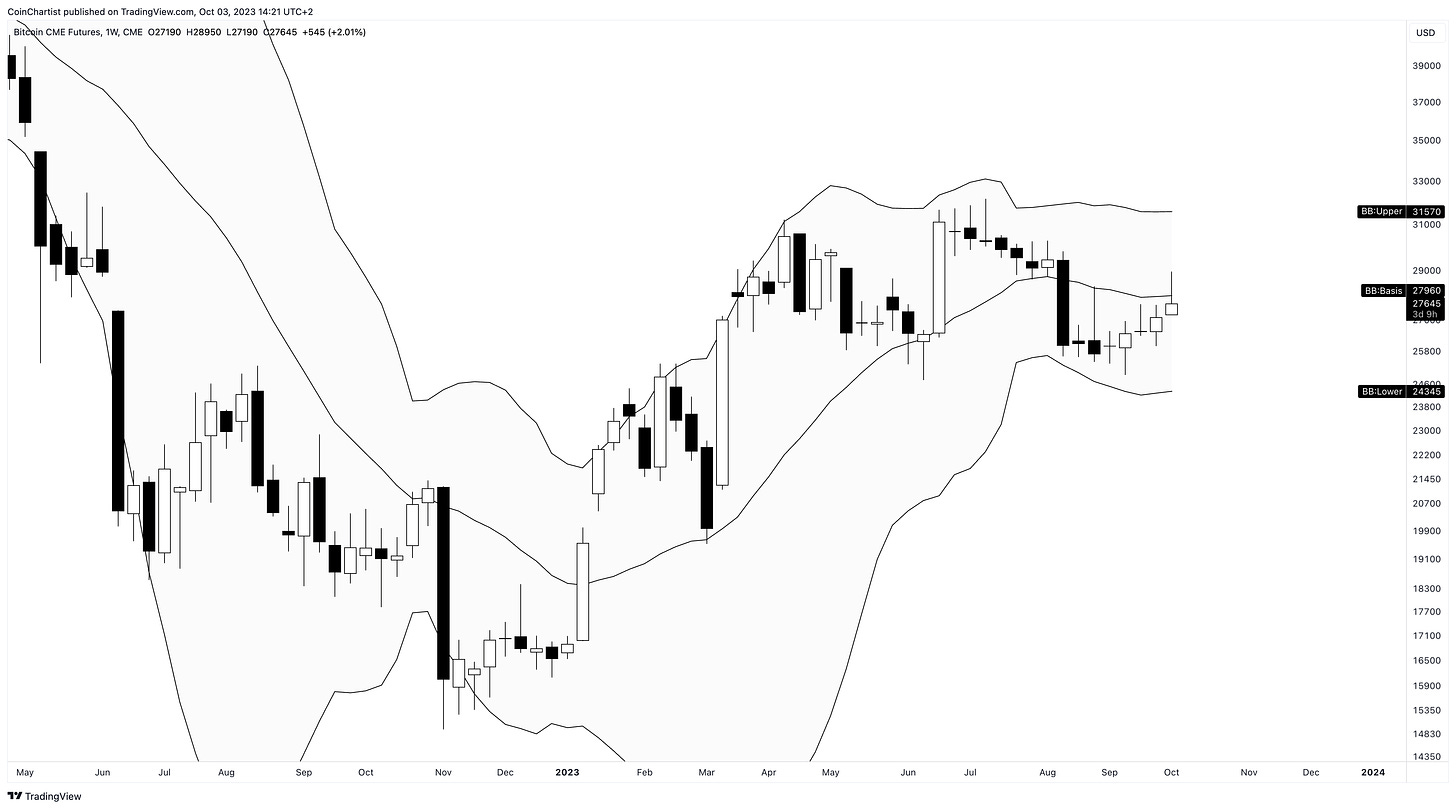
Prior to the rejection, Bitcoin was making an attempt to see through the “Head Fake” setup in the weekly Bollinger Bands which has yet to be invalidated. Making it above the Bollinger Bands basis line would be a strong sign that the Head Fake could become a reality.
Learn more about the Bollinger Bands here.
If Bitcoin does get the Head Fake, it won’t stop at the upper Bollinger Bands. Instead, it will make a run for the top of the weekly Ichimoku cloud. But first BTC must get above the Tenkan-sen resistance. In this chart, the Tenkan-sen and Kijun-sen are crossed bullish. BTC will move higher when the Kijun-sen begins rising showing the end of a ranging market.
Learn more about the Ichimoku here.
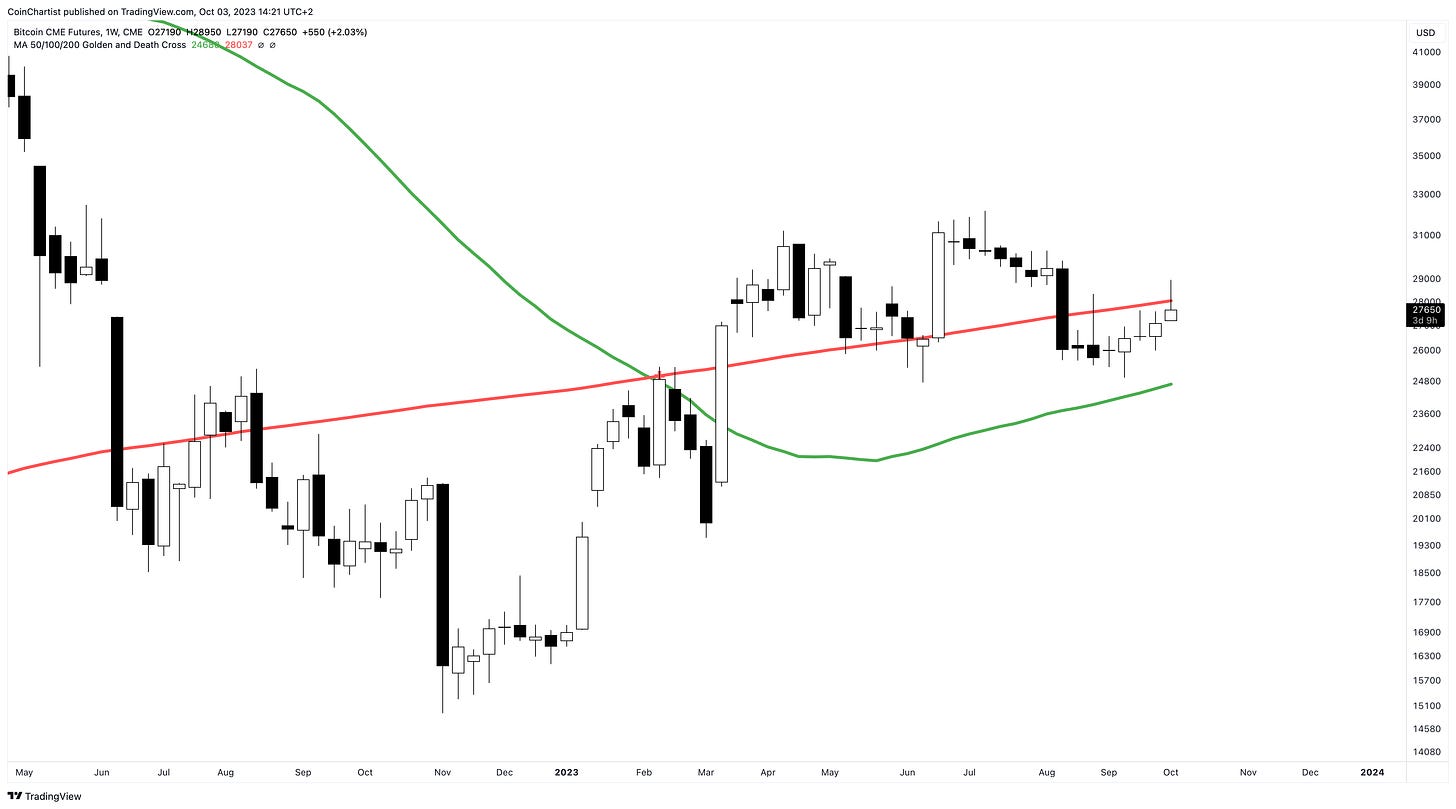
Bitcoin is also finding resistance at the 200-week Moving Average. Above this level, it is difficult to imagine BTC back below it before it makes another all-time high. Prior to this instance, Bitcoin was never below this Moving Average. Currently the 50-week and 200-week Moving Averages are death crossed, but turning upward further would cause a golden cross eventually.
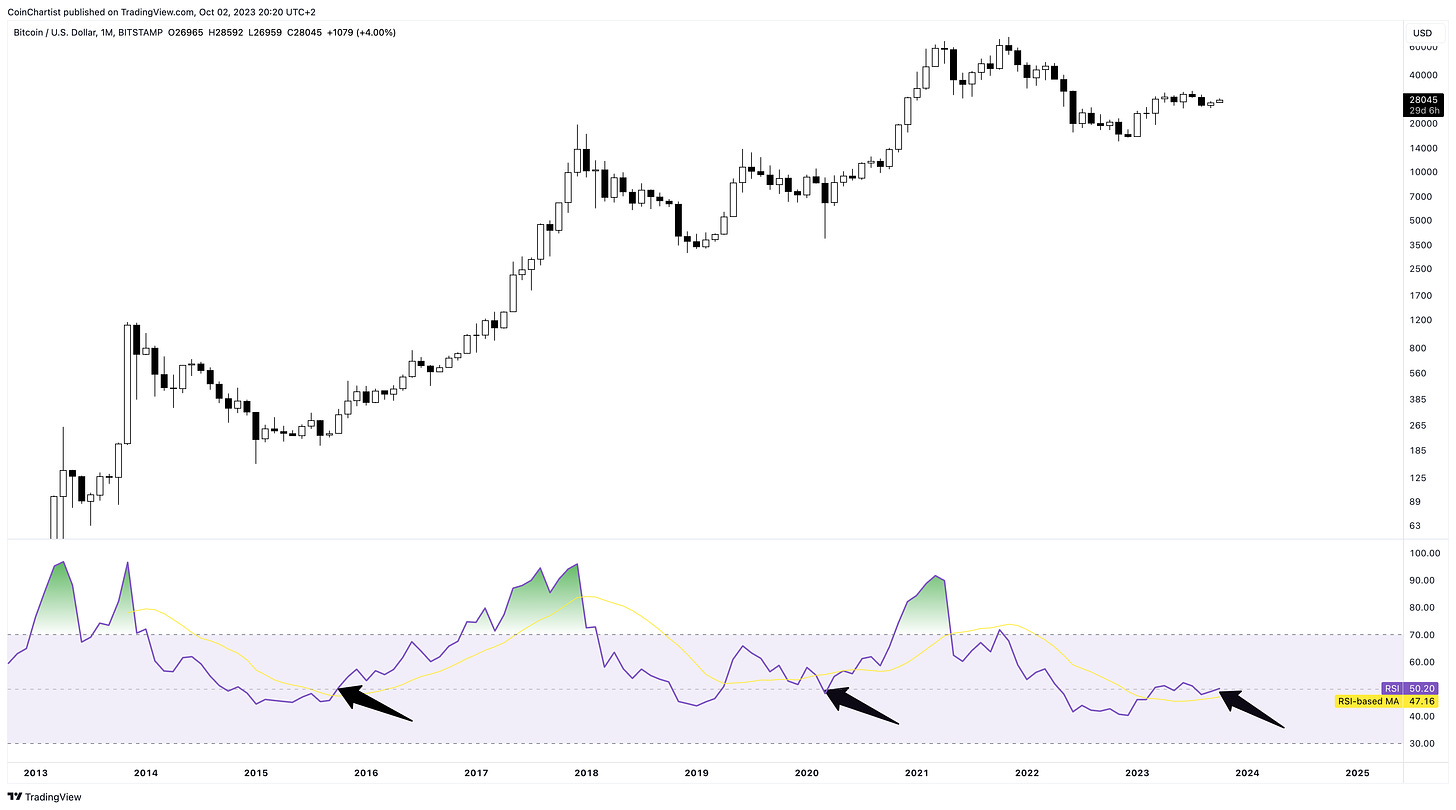
While daily timeframes are concerning at the moment, and the weekly less so, the monthly is actually starting to look good in Bitcoin and could make all the difference soon enough. For example, the RSI is once again attempting to make it through the 50 mark. Getting through it and/or holding it after a retest a’ la Black Thursday during COVID both led to strong bull markets. A higher high on the RSI and on price would be. buy signal according to the tool’s creator.
Learn more about the Relative Strength Index here.
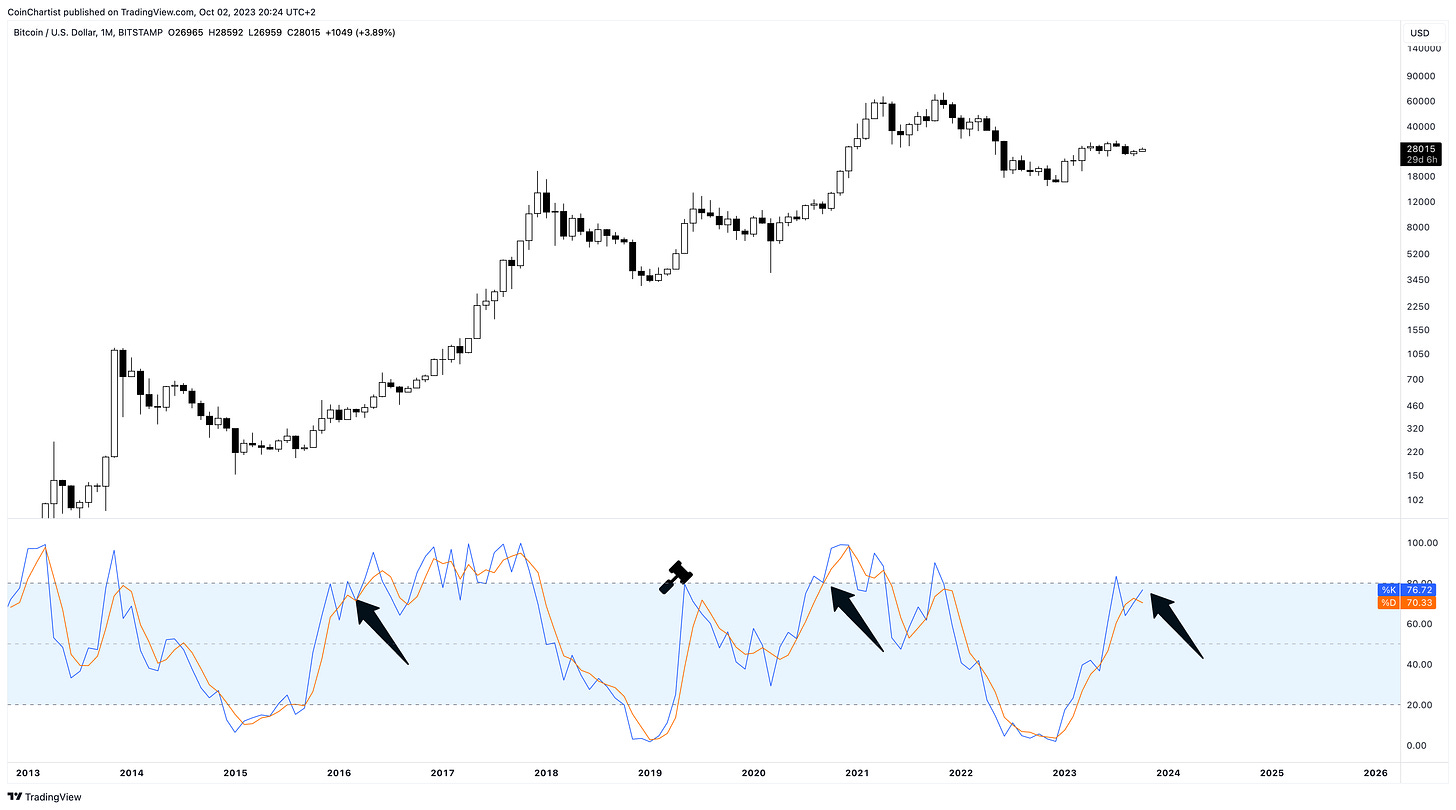
One of my favorite charts this week shows why the possibility of continuation higher is strong compared to the 2019 pre-bull market peak. The monthly Stochastic is behaving more similarly to 2016 or late 2020 versus 2019. If Stoch can get back above a reading of 80 it should produce a powerful bull run.
Learn more about the Stochastic here.
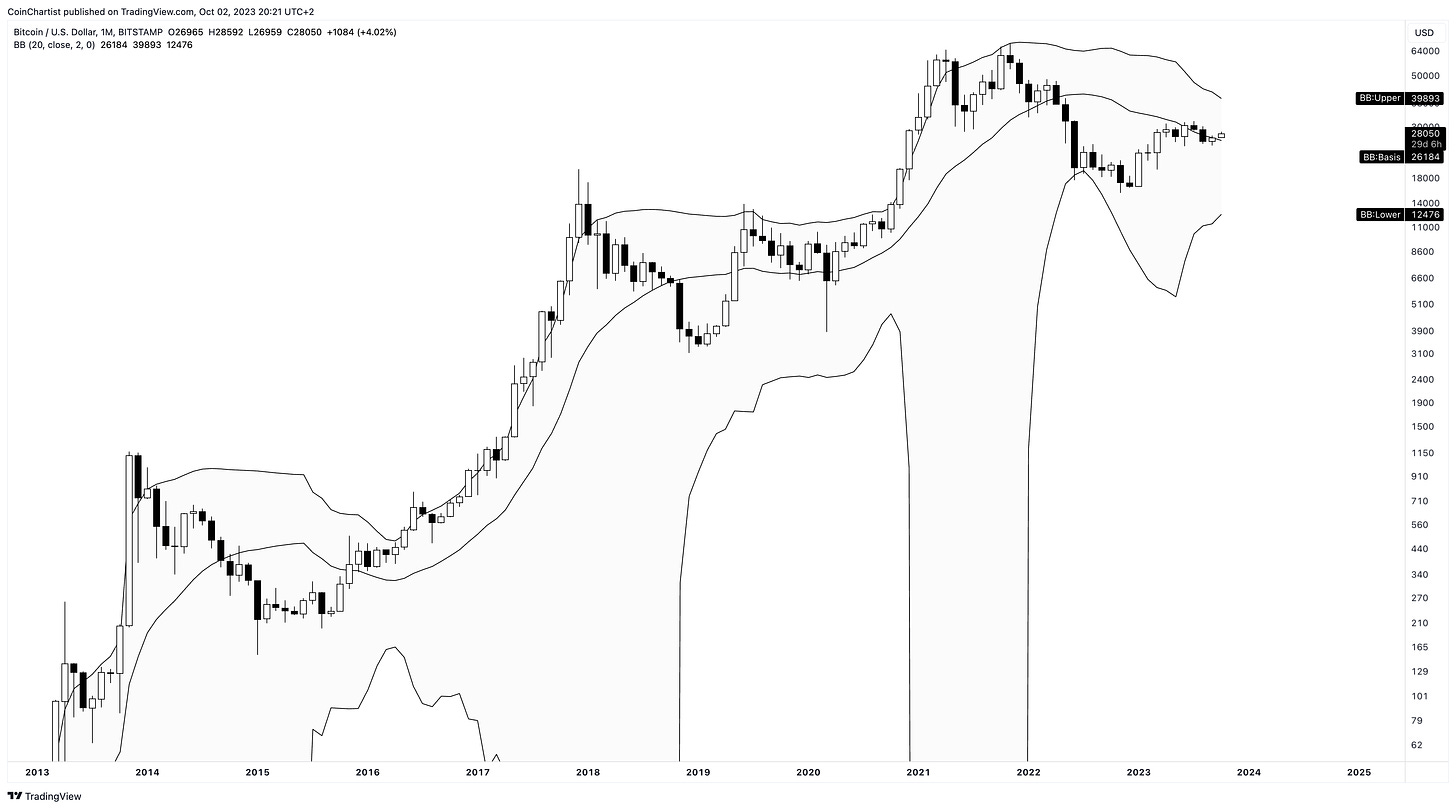
The October monthly candle opened above the monthly Bollinger Band basis. Bitcoin price has been consolidating around the basis for several months, but making it back above the level on a closing basis could put the upper Bollinger Band in play at around $40,000. A close above the upper Bollinger Band will also produce a buy signal and keep the train moving higher.
Learn more about the Bollinger Bands here.
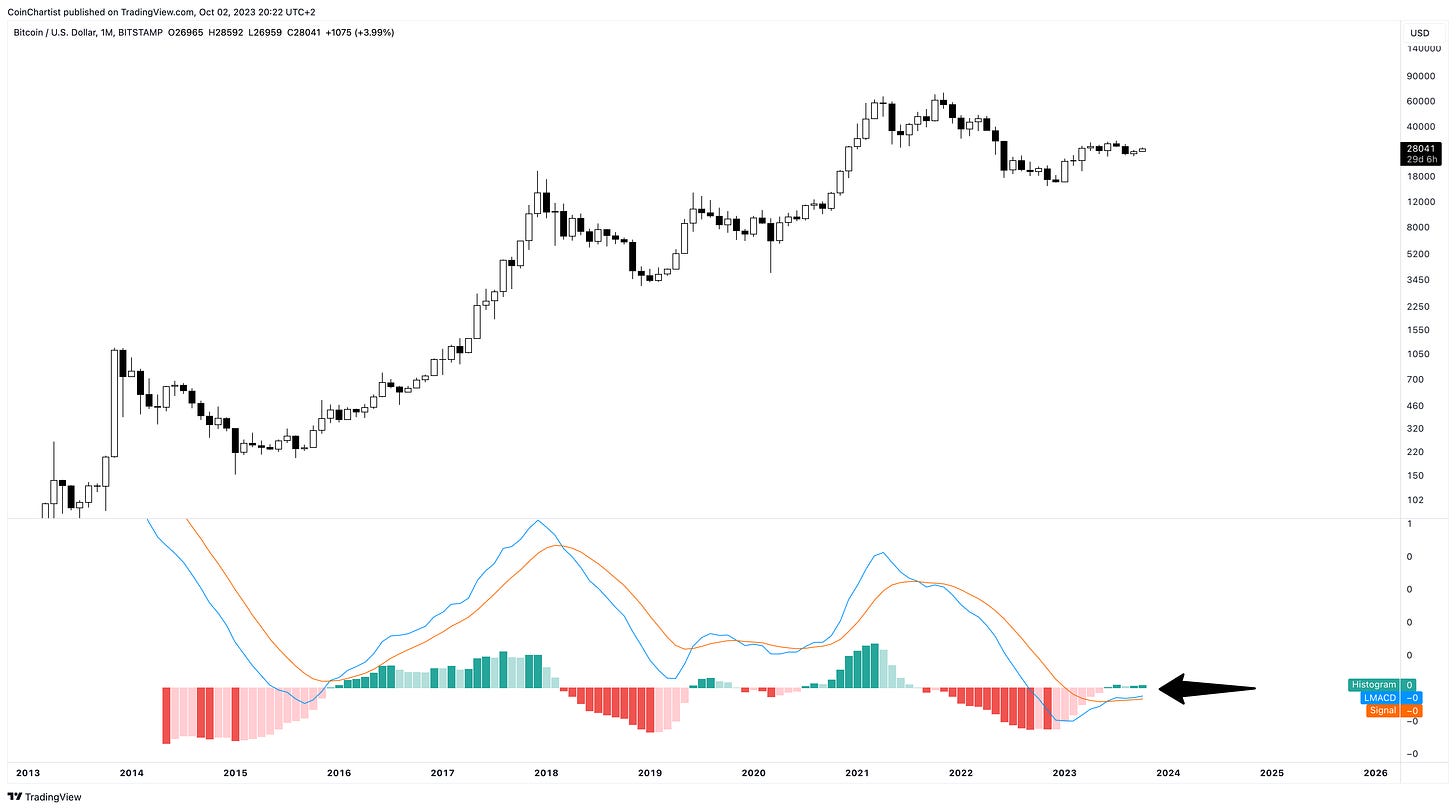
More signs that BTC could be strengthening can be found in the LMACD. The momentum measuring tool has added another dark green tick to the histogram. This shows that momentum is growing. The LMACD and signal line are crossed bullish, but need to move above zero before the bull run truly appears.
Learn more about the MACD here.
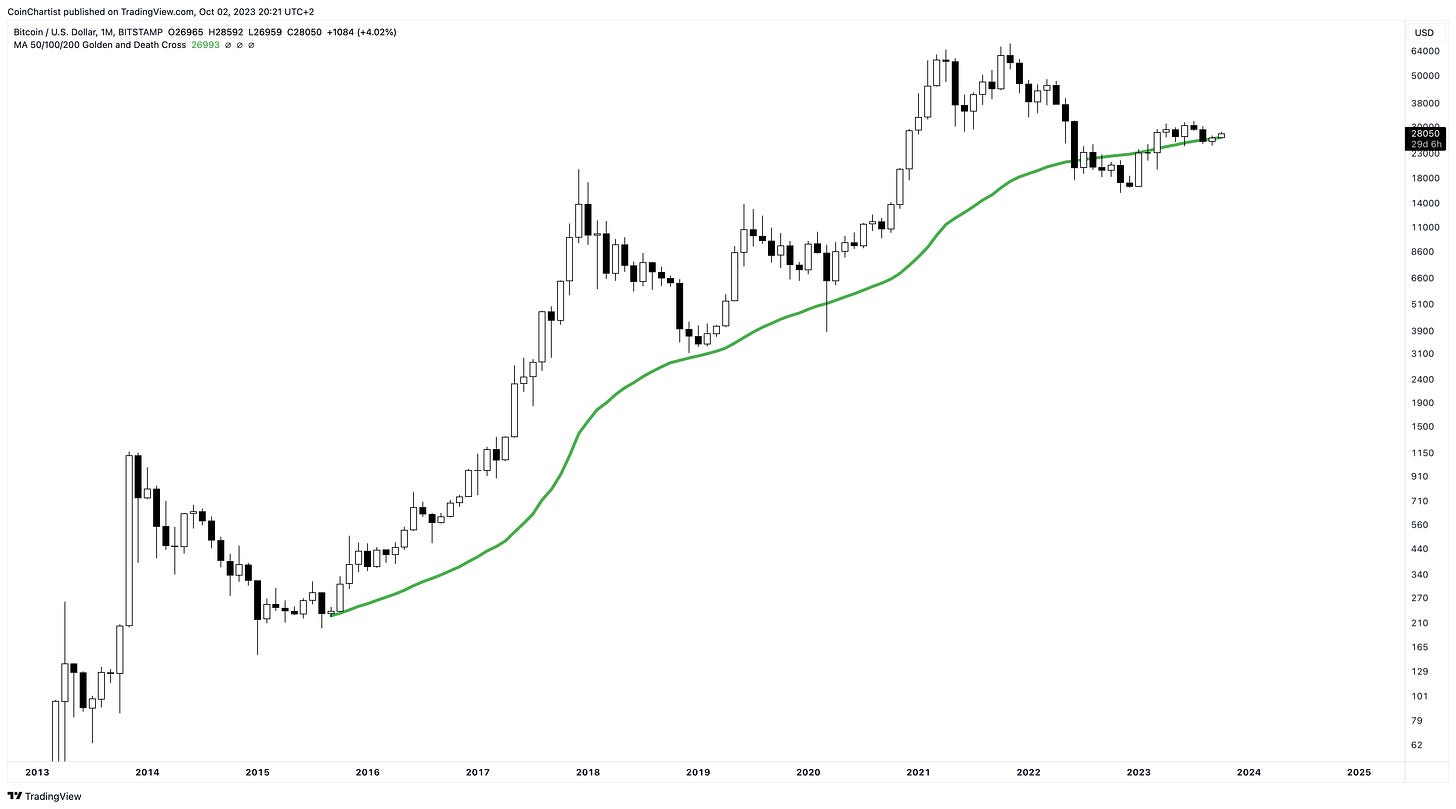
BTCUSD also opened above the 50-week Moving Average. With a visual inspection alone, we can see that almost all significant bullish impulses happened after leaving this Moving Average behind.
Finally, we are looking at October being the third-most bullish month in Bitcoin historically, followed by November as the number one best performing month. Will Bitcoin eventually close October in the green?
Altcoins aren’t faring much better than Bitcoin, but over the weekend and late last week saw some activity. News that Ethereum Futures ETFs were approved by the SEC caused Ethereum to hold an important line and put an Ascending Triangle in play. Other altcoins are struggling, but there is one coin that looks better than the rest.
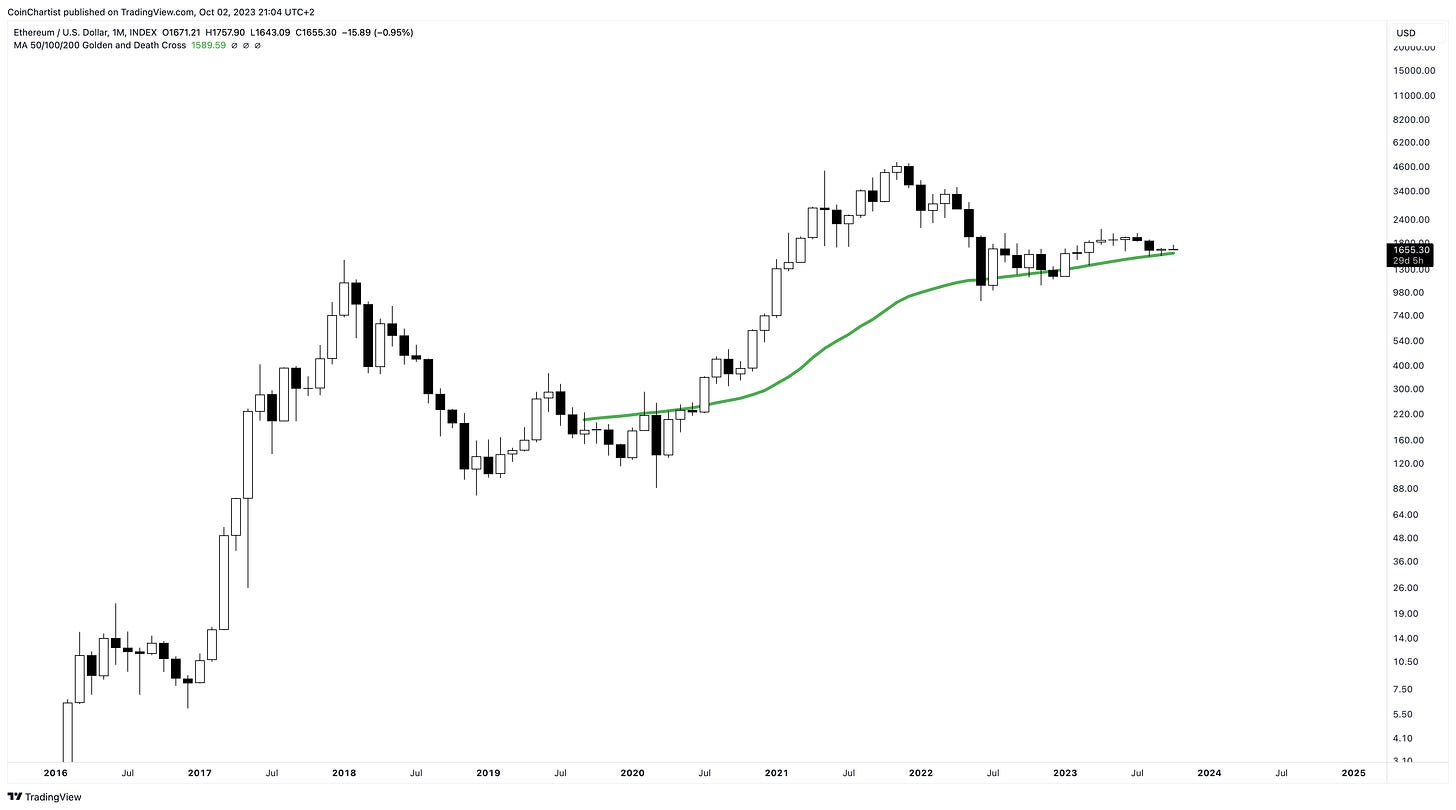
Rolling into the 50-month Moving Average we left off on from the last Bitcoin chart, we can see that Ethereum remains above the indicator and has been for most of 2023. If it continues to act as support, eventually ETHUSD will have to shoot for resistance higher instead.
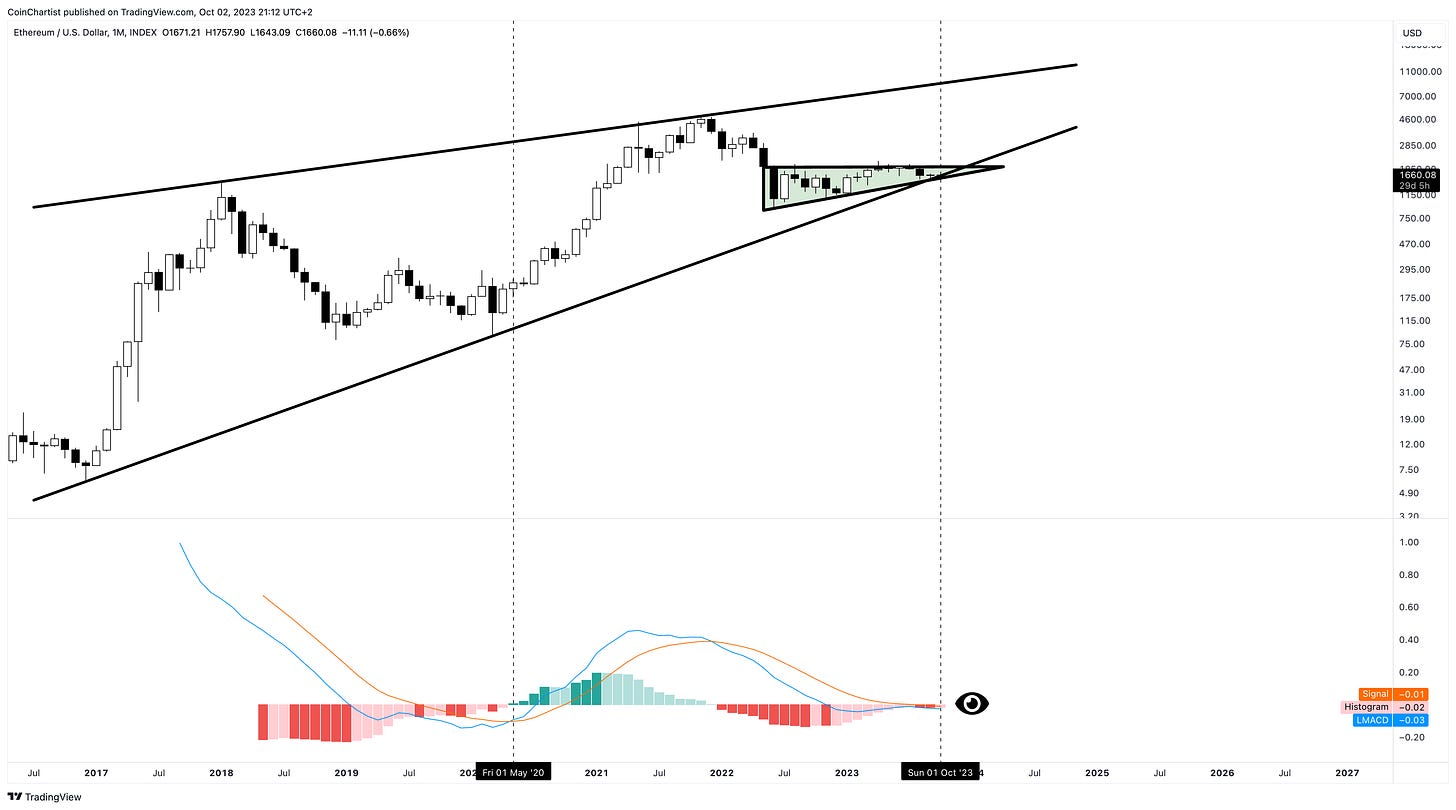
Bitcoin’s LMACD has a bullish crossover, but Ethereum has yet to give the same signal on the monthly timeframe. It could arrive this month, however, just as ETHUSD potentially forms an Ascending Triangle pattern at the very bottom of a long-term trendline. Bounces from this trend line saw rallies of 25,000 and 5,000% respectively.
Note: This Ascending Triangle pattern is featured in the Chart Class section, explaining why it could also be a bearish pattern, despite being categorized as a bullish chart pattern.
Learn more about the MACD here.
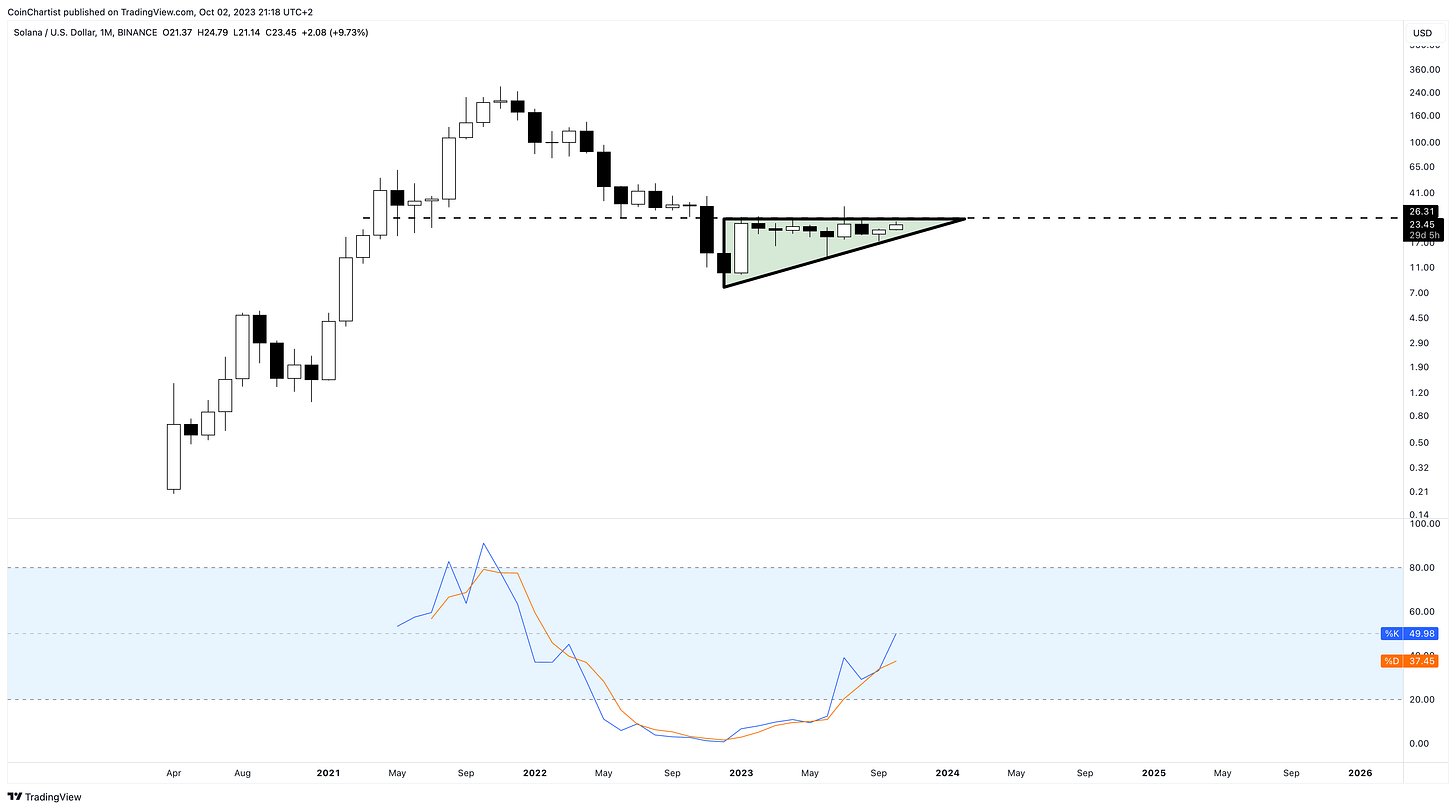
If this looks like Ethereum, it’s only because of the Ascending Triangle pattern. What you are looking at is Solana, which appears to be following a similar path as ETHUSD. Stochastic is on the cusp of pushing above a reading of 50. The bear market started the moment SOL fell below the 50 line, so moving back above it could resume the bull run.
Learn more about the Stochastic here.
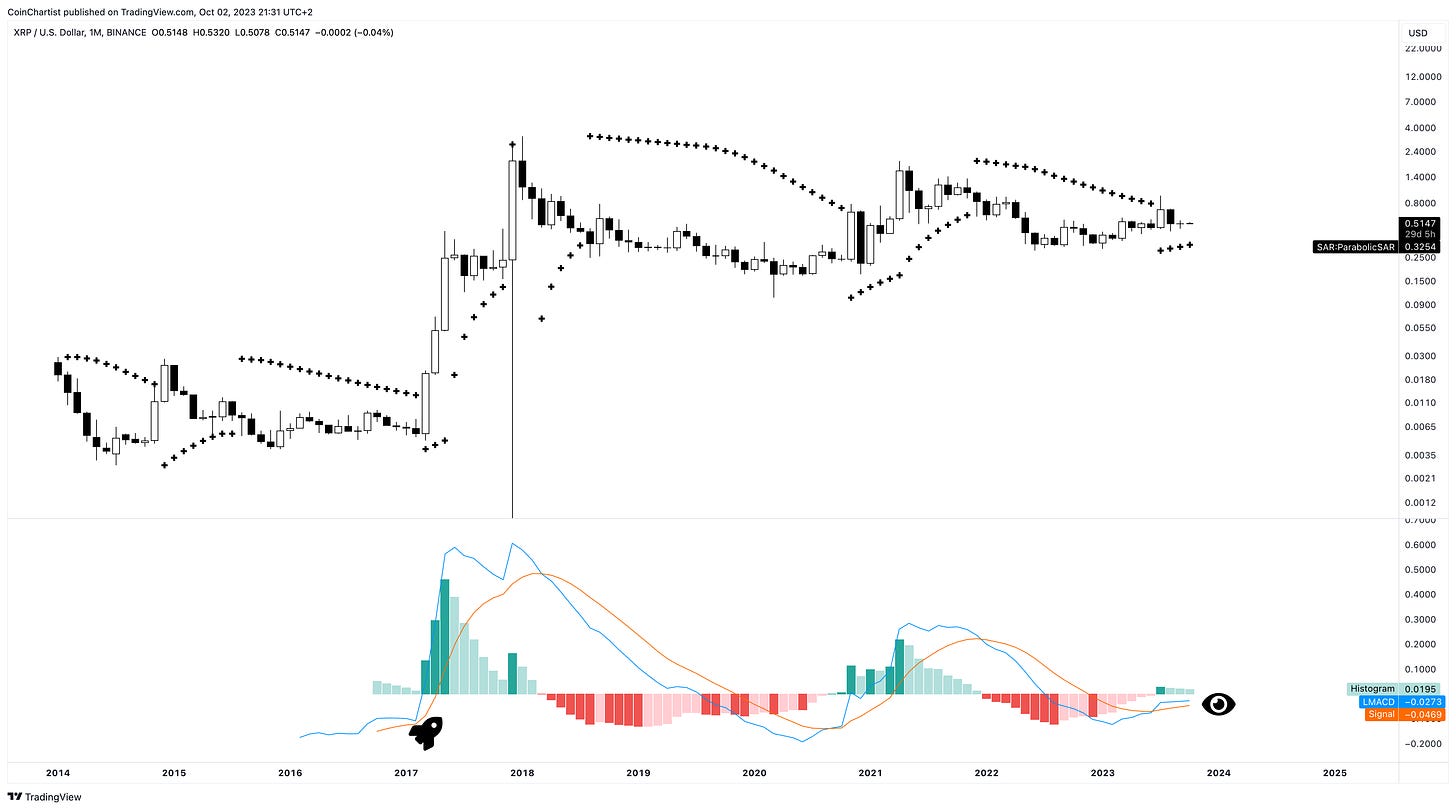
XRP retraced the entirety of its legal win breakout, which was enough to tag the Parabolic SAR and flip the monthly LMACD bullish. Momentum isn’t strengthening as much as Bitcoin is, but holding the histogram in the green is significant nonetheless. Moving above the zero line could send Ripple ripping higher.
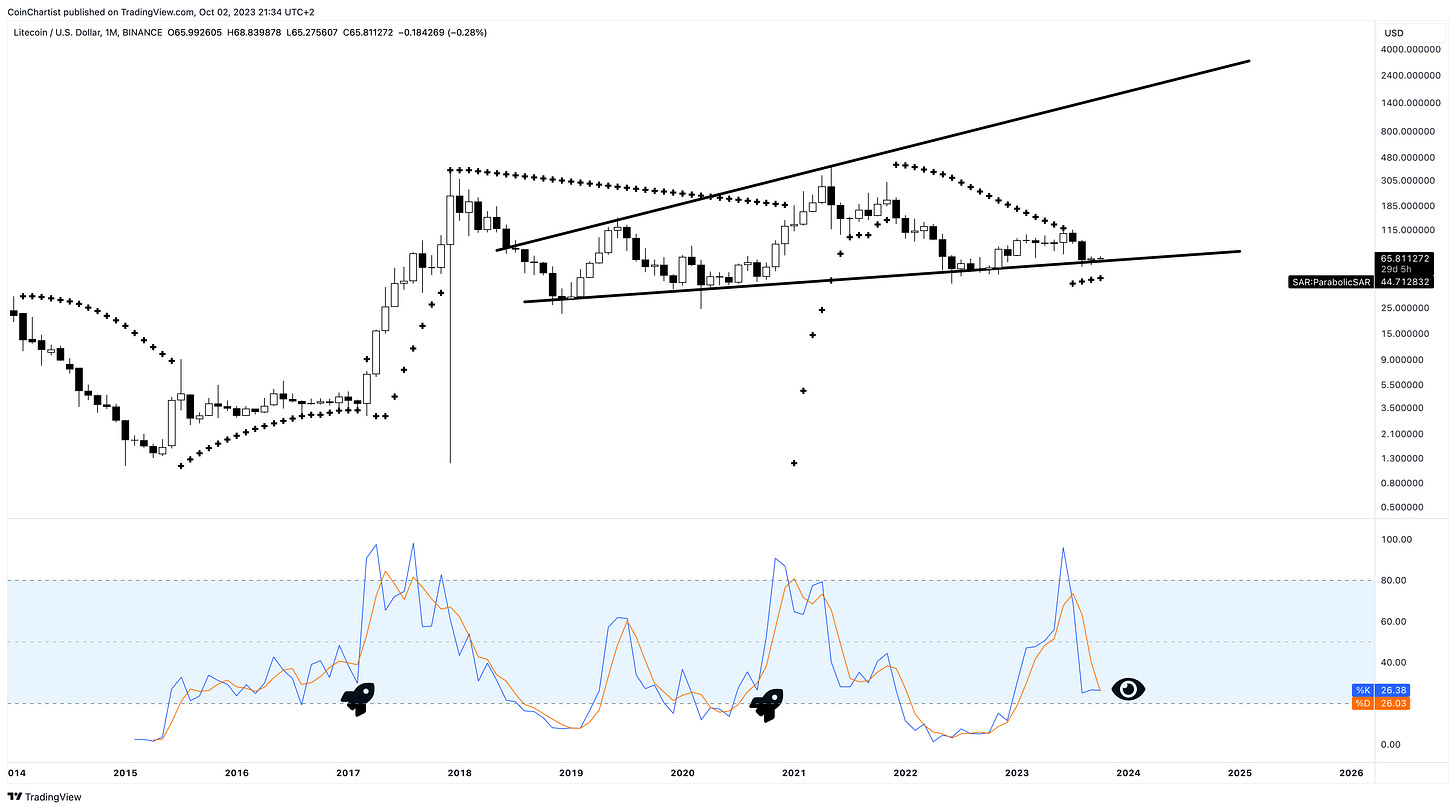
One coin that continues to deceive me despite seemingly bullish technicals, is Litecoin. I just can’t win with this coin. However, if monthly Stochastic completes the hinge and crosses bullish before the indicator falls into oversold, it could suggest continuation and a retest, not a reversal to new lows.
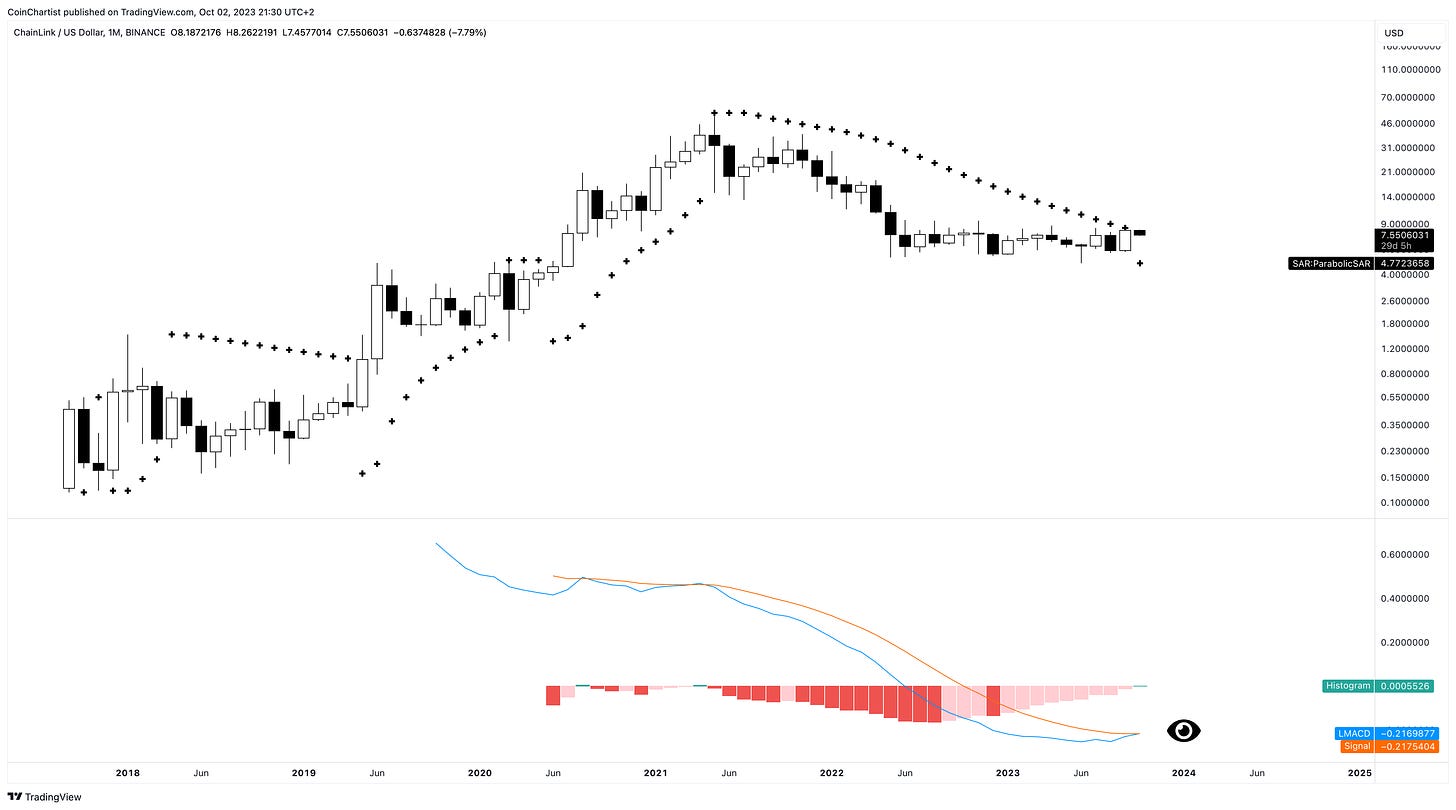
The altcoin I am most interested in at the moment is Chainlink. LINKUSD just tagged the monthly Parabolic SAR, is crossing bullish on the LMACD, and closed above the monthly Bollinger Band basis (not pictured). Several bullish technicals firing at once is a positive sign. Chainlink also has some of the best fundamentals in crypto.
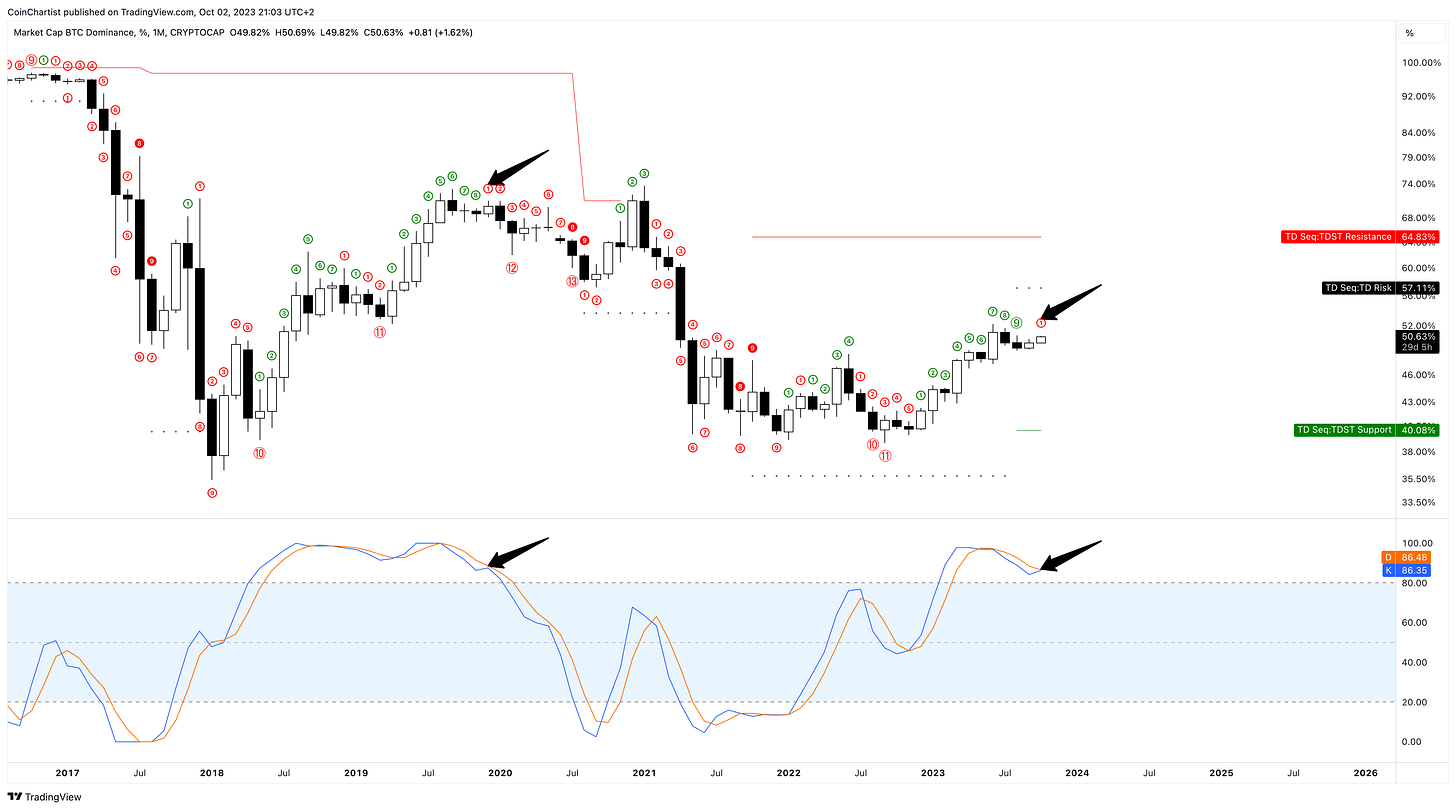
Bitcoin Dominance opened October with a red “1” count on the TD Sequential. This could easily turn into a green “1” instead, but if the count continues red it could be the start of a new downtrend in dominance, which means it could be time to start moving money into altcoins. If the Stochastic turns down and fails to cross bullish in the overbought zone, it will begin to trend downward and pull price with it.
That’s it for free content. The best content is always reserved for premium members and Founding Member VIPs.
Behind the paywall is a concerning look at the S&P 500, but analysis could suggest that this could give Bitcoin a boost.
New wave counts look closely at what happens if we move into an impulsive phase or if crypto turns further corrective. Both should result in more upside first, so don’t miss this section.
Finally, there is a Special Spotlight on the maximum and minimum possible Bitcoin price and a Chart Class explaining why alternate counts are crucial to proper Elliott Wave analysis.
Keep reading with a 7-day free trial
Subscribe to CoinChartist (VIP) to keep reading this post and get 7 days of free access to the full post archives.


