ISSUE #3: Decision Time Is Due For Bitcoin
Get the latest on Bitcoin, altcoins, Pepe the Frog, the dollar, and check out some of our most interesting charts yet.
Welcome to the public beta release of CoinChartist (VIP), a premium newsletter collaboration between Tony "The Bull" and CoinChartist.io that's set to revolutionize the way you navigate the ever-evolving cryptocurrency market.
During this next phase of the beta, CoinChartist (VIP) will begin to switch to paid-only memberships, starting with a paywall to the content’s conclusion and special features.
Premium (VIP) subscribers will receive full access to weekly newsletters delivered to their inbox, get exclusive access to Tony’s custom technical indicators, and much more.
Free subscribers will still get a look into Bitcoin and altcoins, but must upgrade for the full picture, technical analysis education, and special features like interviews.
Bitcoin price remains stagnant around just below the $30,000 level. The lack of upward momentum isn’t a positive sign, but consolidation below resistance isn’t negative either. Instead, what the market is saying is that the next move could be defining.
When intraday movements seem confusing, the best approach is to zoom out and get a feel for what the overall trend is telling us. And that trend is slowly, but surely, changing for the better.
Bottom fishing BTC with the Fisher Transform
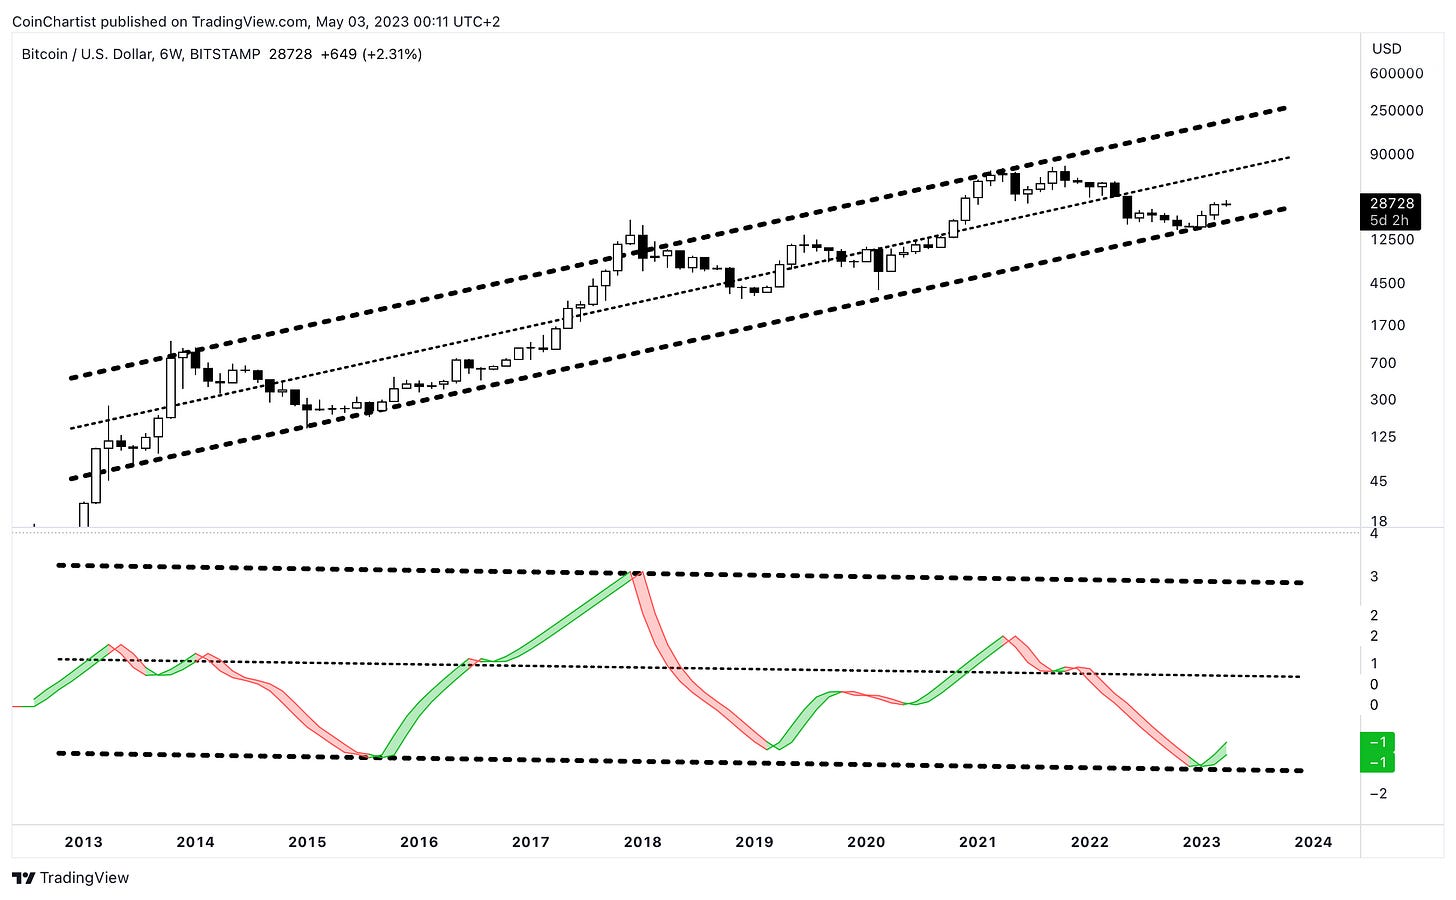
The Fisher Transform takes the price data and turns it into a statistical visual oscillator that is used to determine extreme turning points in markets.
Across the highest timeframes, from the monthly, the 6-week (pictured above) and the 2M are all turning positive after the most extreme negative reading in the top cryptocurrency’s entire history.
In the chart, BTCUSD overthrows the top and bottom of the channel at the extreme deviations. Even the Fisher Transform is range-bound in a channel, that has just touched down at the bottom.
Note: The version of the Fisher Transform I am using in this example is the iFish Smooth by Moe_Mentum. You can find Moe on TradingView if you want access.
BTCUSD vs the Dollar creates unique perspective for crypto
In an upcoming issue, we will feature renowned crypto analyst TechDev to discuss and important chart. The discussion with TechDev got me to think a little outside of the box with combining chart symbols to unlock secret cheat codes, and I stumbled upon something that could be incredibly bullish for Bitcoin.
The chart above shows the DXY against BTCUSD. In my Telegram channel this week, I shared a monthly BTCUSD chart with Bitcoin failing to make it above the mid-Bollinger Band. However, in the chart above, Bitcoin has clearly made it through the middle-SMA (simple moving average).
Each time the DXY/BTCUSD chart passed the middle-SMA, a major bull trend followed, and another monthly close doesn’t occur until the cycle has ended.
There are many more wild macro charts and comparisons using Bitcoin further below, including a bizarre Bitcoin versus Apple chart. But in the next chart, we are back to just Bitcoin.
600,000% ROI uptrend signal is back, with clarity coming any day
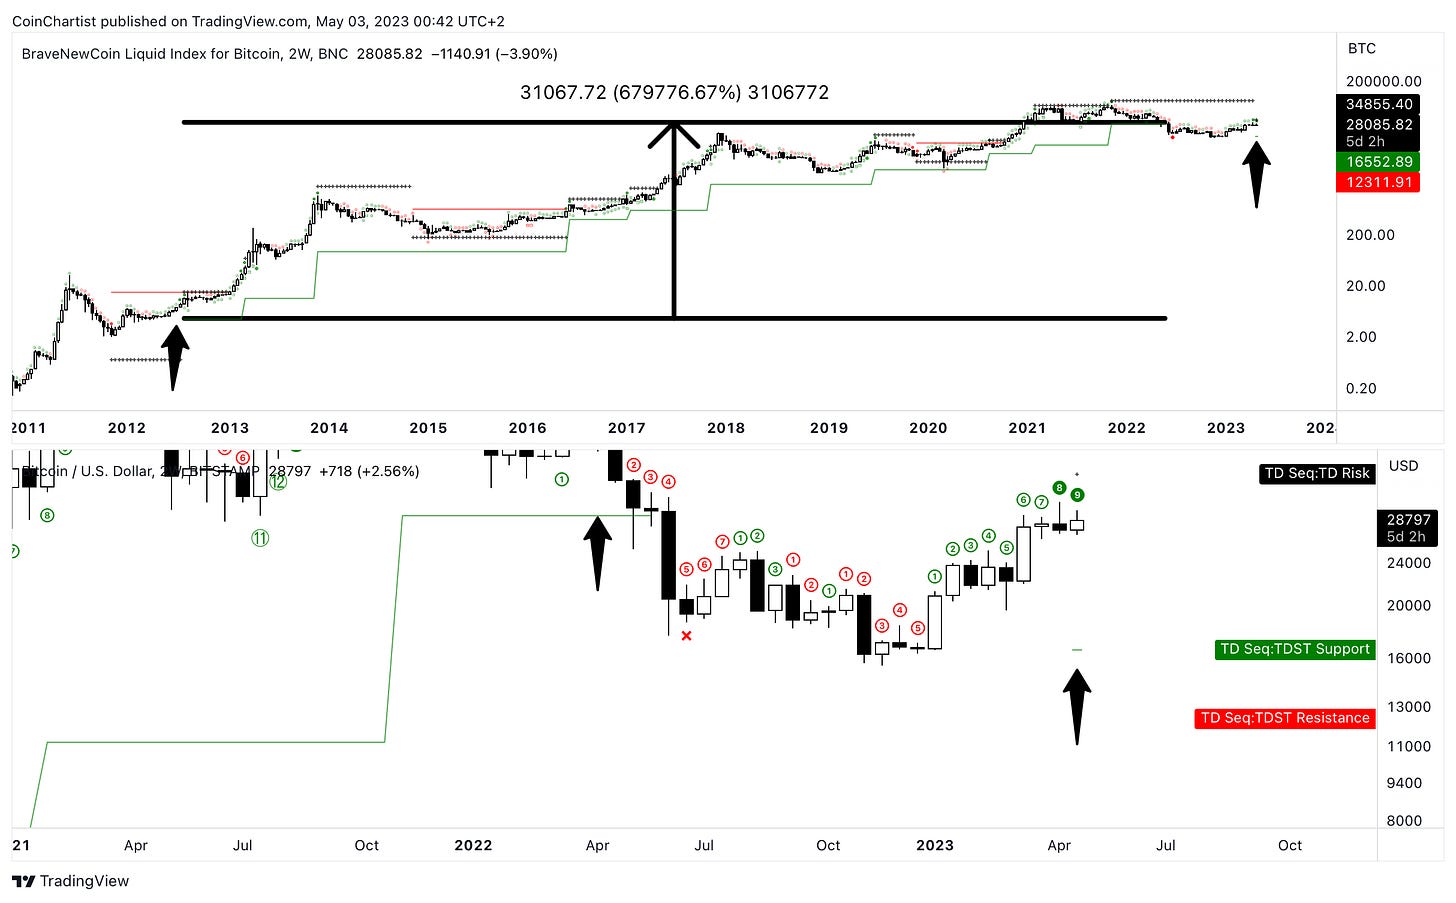
This is the chart I teased on Twitter, and is something that is more for entertainment purposes, but is a shocking data point nonetheless. The above features the 2-week TD Sequential on BTCUSD.
The TD Sequential is a market timing indicator, that typically signals trend exhaustion or picks out points where trends are about to increase in strength. More than anything, it highlights especially critical price levels after a sequence of highs or lows.
A perfected TD9 setup has appeared just as BTCUSD is at broken former TDST Support. However, new TDST Support has formed below Bitcoin at $16,552 per coin. The last time TDST Support appeared on the 2-week timeframe, Bitcoin was at $4.41 per coin and rallied more than 669,000% before the support level was broken last year.
It is doubtful this type of upside happens again, but it could be a sign of a new bull trend blossoming, and is something to watch close. The most important point of this chart: the candlestick closes this weekend. This means we could get more clarity about the direction of crypto any day now.
The entire crypto market has been on pause, waiting to see what Bitcoin is going to do.
A rising tide lifts all boats, so if Bitcoin breaks out higher, altcoins will get pulled up in USD value, but likely suffer in BTC value. This will be deceiving, but BTC is poised to outperform. If the tide begins to ebb back into a bear market, altcoins will also be the fastest down the drain.
Ethereum: the king of altcoins must first fall
Longer term charts suggest that Ethereum will continue to turn down against BTC. This further lends credence to the idea that Bitcoin will be the frontrunner for some time.
ETHBTC is breaking down after retesting a long term uptrend line it lost. It is below the Trend Wrangler tool, and rounding resistance could take Ether down to a higher long term low against Bitcoin.
A lack of a lower low against BTC would ultimately be bullish for Ether and tell the market its time for ETH to outperform.
BTC dominance to make measured move higher
BTC.D is leaving a range it spent two years trading in. This is definitely not a good sign for altcoin holders who don’t also hold BTC. A portfolio weighted in BTC is the smarter decision right now.
There is confluence in the signals. There is a breakout and a confirmed candle holding above the range. The Trend Wrangler is turned up, and the Raging Bull indicator says that BTC.D is in a raging bull market.
This is never positive for altcoins. Visually take note of the yellow candles above. Notice that alt season never arrives when candles are yellow. Much like the color yellow is in nature, consider this a warning for altcoins.
Meet the new frog prince of meme coins
By now you’ve likely heard of Pepe, a popular new meme coin based on Pepe the Frog, created by Matt Furie. The coin simply won’t stop rising, despite a dozen or so sell signals I’ve seen generated.
Even with continuous profit-taking, I’ve mostly been left feeling regret I didn’t just leave it all in. I’d have tripled my capital beyond what I’ve already done, which was an easy 8x or so thus far. In fact, Pepe did a 23x from the time I first shared in my Telegram that I bought some until the time of this writing. At least some of my capital has done a 23x. Crazy. This left me wondering, how far does something like this go?
In the past, I’ve stayed far away from meme coins, and other altcoins I perceived as a shitcoin. But this has resulted in me missing out on Dogecoin, DeFi, and other massive money-making rallies. I chose to roll the dice with Pepe, and after living this sort of thing, I can understand better why this all happens.
With new coins that have sufficient hype, the influx of liquidity causes astronomical early returns. Unlike older coins that have up to a half a decade or more of bagholders built up, there is no real resistance to speak of, leading to incredible price discovery.
The chart above uses Ethereum as an example. Could this be what we see in Pepe ultimately? Beware, however, it could go to zero. There is no affiliate with the meme’s creator, and he’s sued others for profiting off his artwork before.
At the time of this writing, US stock indices are climbing, but are still down for the week. With very little movement elsewhere across the macro space outside of precious metals, we are once again getting creative with Bitcoin when comparing it to important macro assets.
In fact, the below are some of my most interesting, creative, and unique charts you’ve seen in CoinChartist (VIP) so far. It’s time for you to become a (VIP) and never miss the most important charts and updates from Tony.
Tip from Tony: Gold and silver make a great choice for cryptocurrency enthusiasts looking to diversify into other hard money options while offsetting crypto-related risk.
Keep reading with a 7-day free trial
Subscribe to CoinChartist to keep reading this post and get 7 days of free access to the full post archives.


