Issue #8 | BTC 2023 = 2020 > 2019
While the market expects a long accumulation phase, an impulse could be around the corner.
Welcome to issue #8 of CoinChartist (VIP) and our largest issue yet. This week’s drop includes:
Bitcoin deja vu. 2023 more resembles 2020, not 2019
Wave counts and Fibonacci levels for BTC
A preview of CoinChartist (VIP) technical indicators and how I’m using them
Macro charts on British pound, Chinese yuan, the DXY, and Nasdaq
A closer look at altcoins LINK, FET, and MATIC
A lesson on why inverse head and shoulders form via waves
Please subscribe for premium and support CoinChartist.io, or share CoinChartist (VIP) with friends and family. You can also follow CoinChartist on YouTube and Twitter. Don’t forget to also like and comment to let us know how we’re doing.
For weeks I’ve had Bitcoin in a bullish wave count that puts the top crypto asset closer to 2020 than 2019. Let’s take a look at the latest building technical similarities.
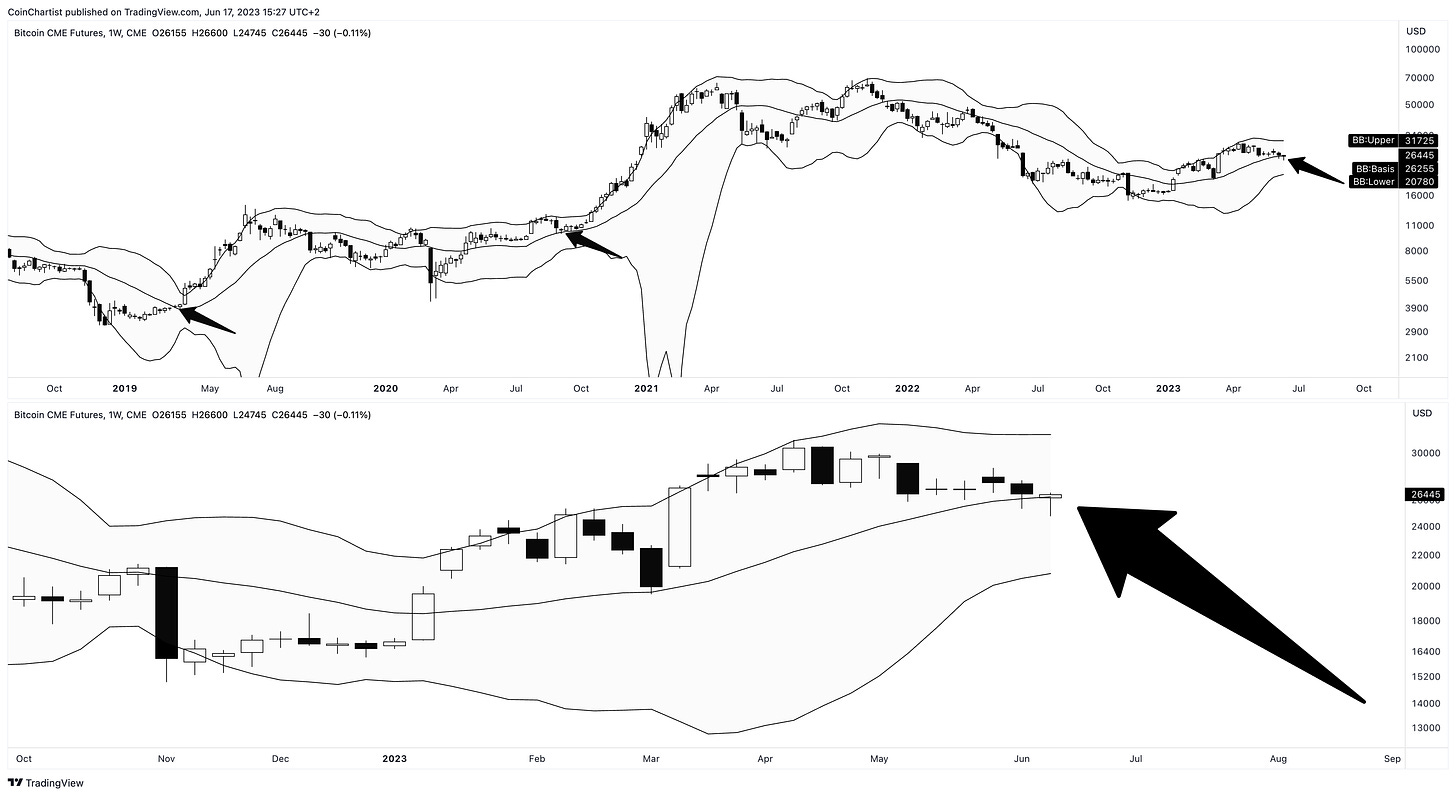
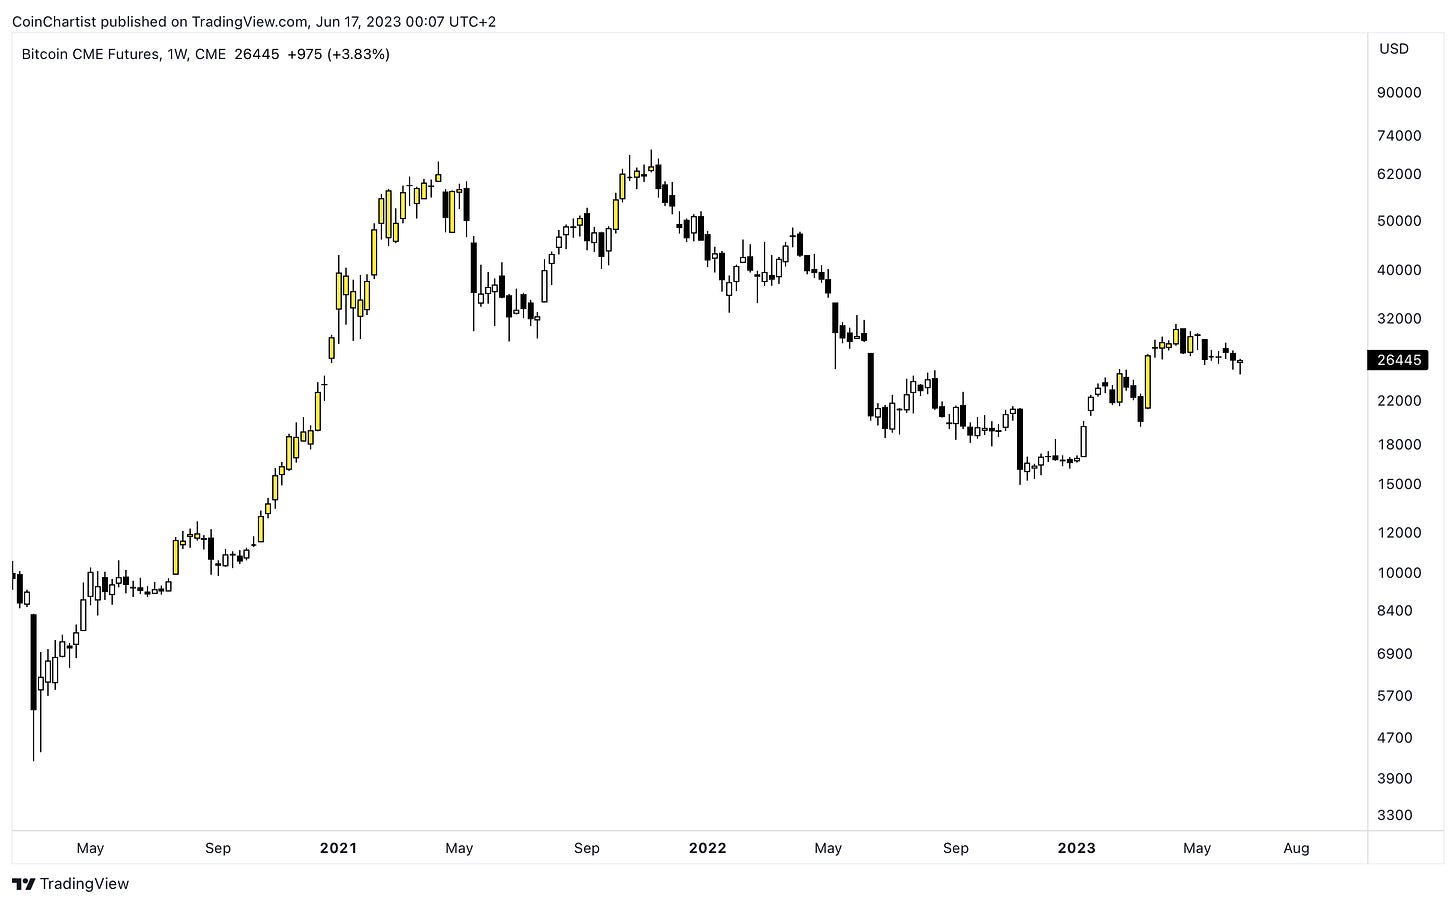
The most important chart in Bitcoin today, is the BTC!1 CME Futures weekly chart, which closed just after 5PM ET on Friday. The close was so crucial due to Bitcoin making it back above the mid-Bollinger Band. The same happened ahead of past impulses, notably in 2020.
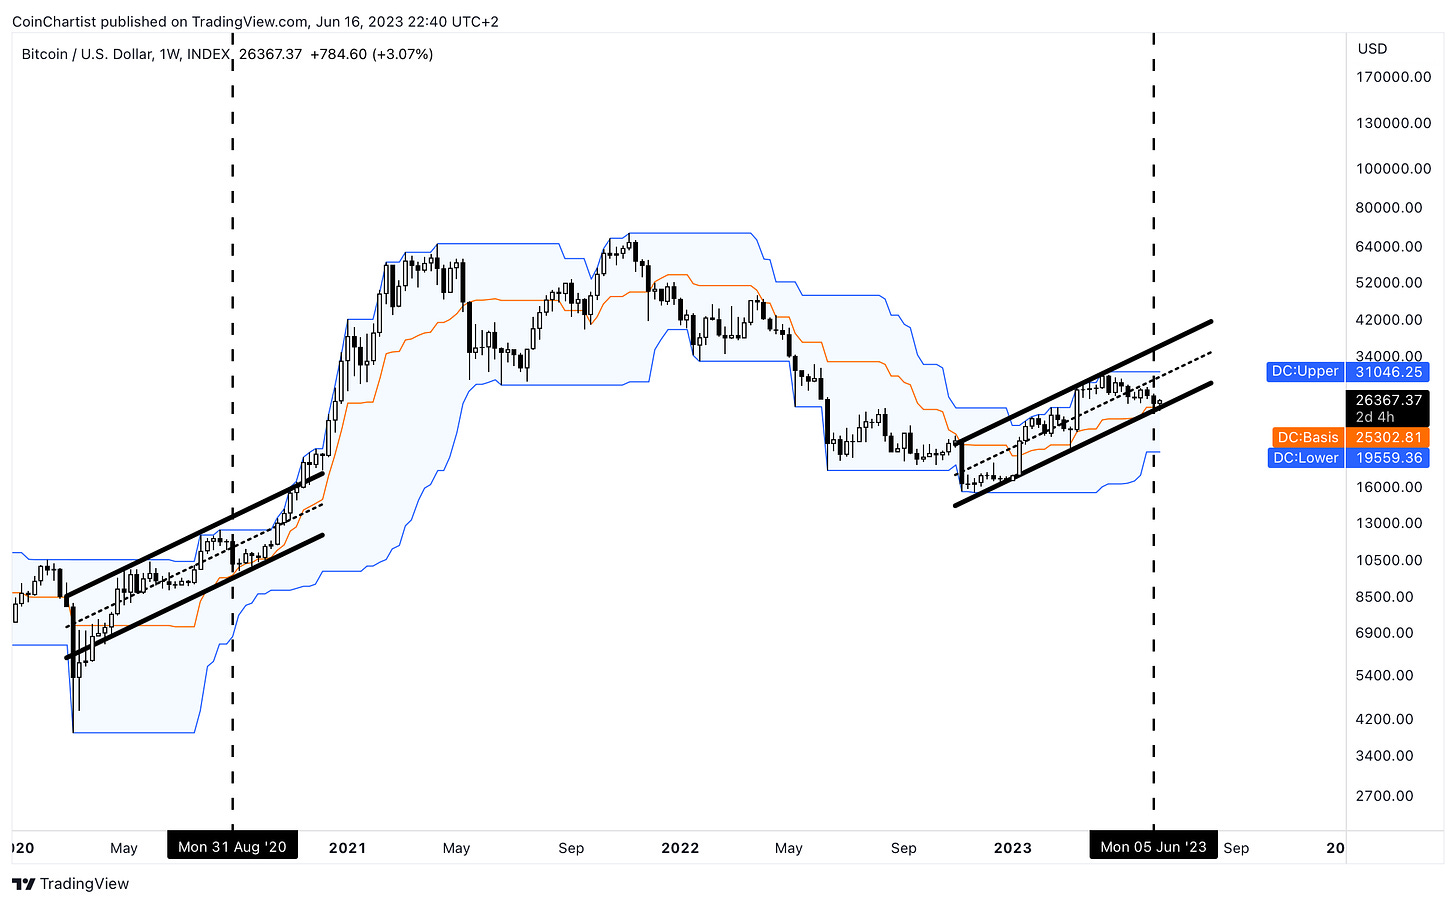
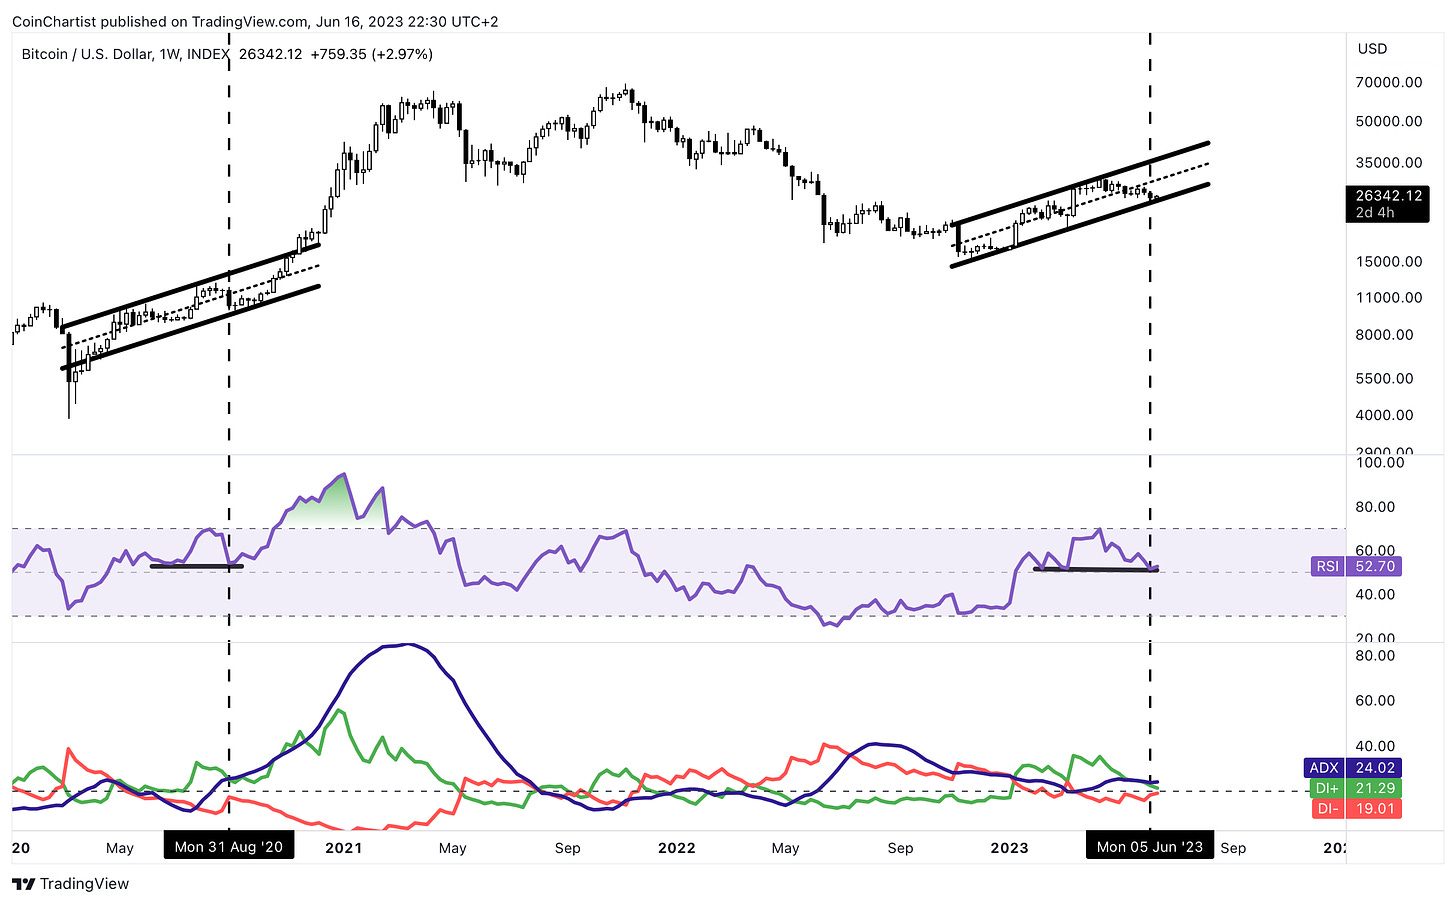
Much like 2020, BTC finds itself in a rising channel, holding above the Tenkan-sen on the weekly Ichimoku.
Bitcoin is also holding above the weekly basis on the Donchian Channel.
Learn more about the Donchian Channel here.
Finally, there is a bullish divergence on the weekly Relative Strength Index and the Average Directional Index is turning back upward, suggesting the trend is strengthening.
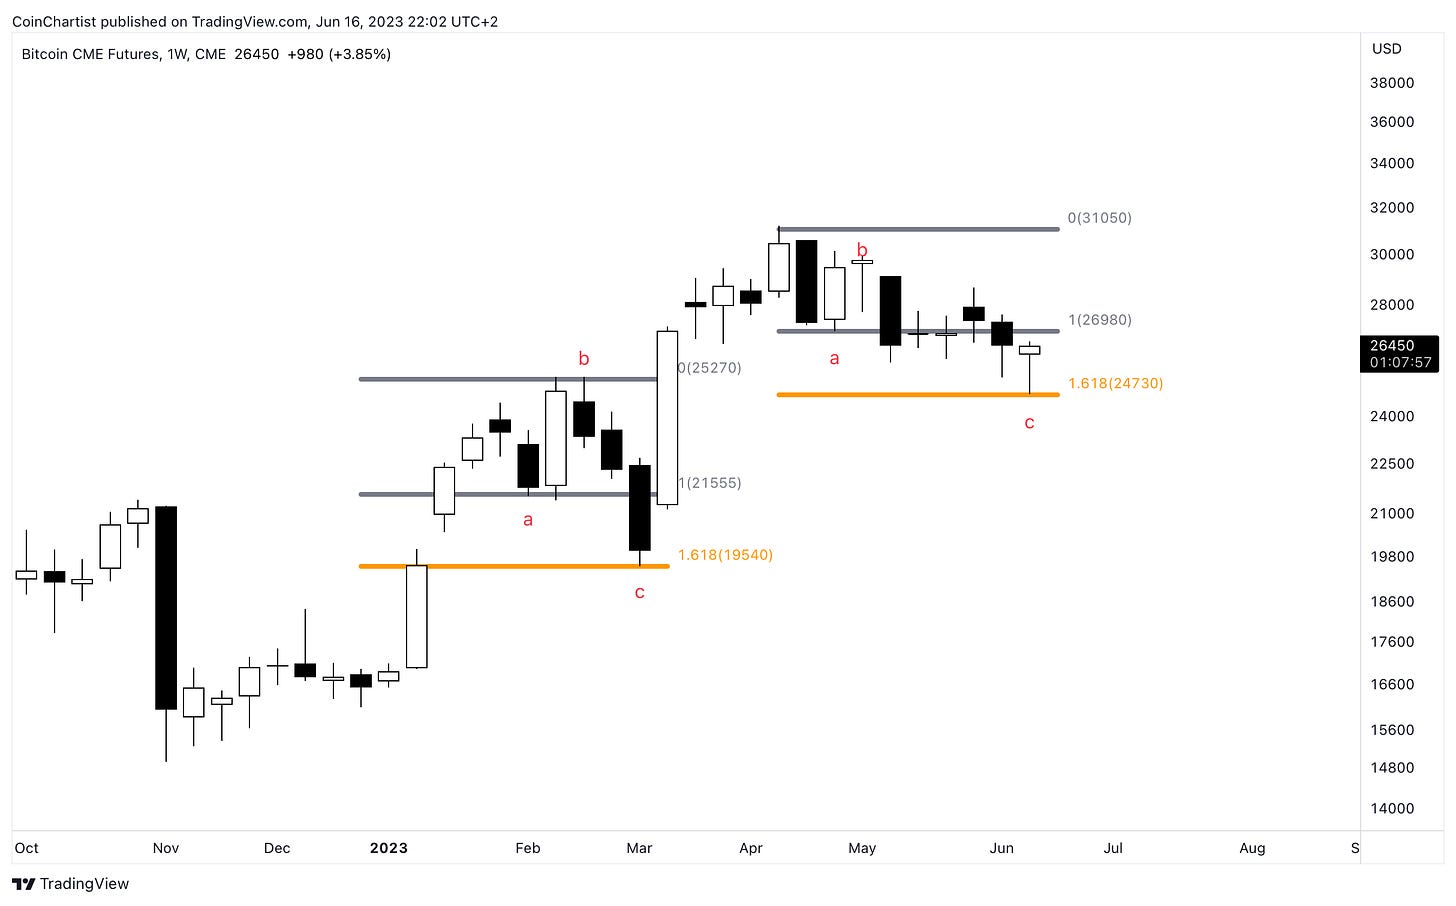
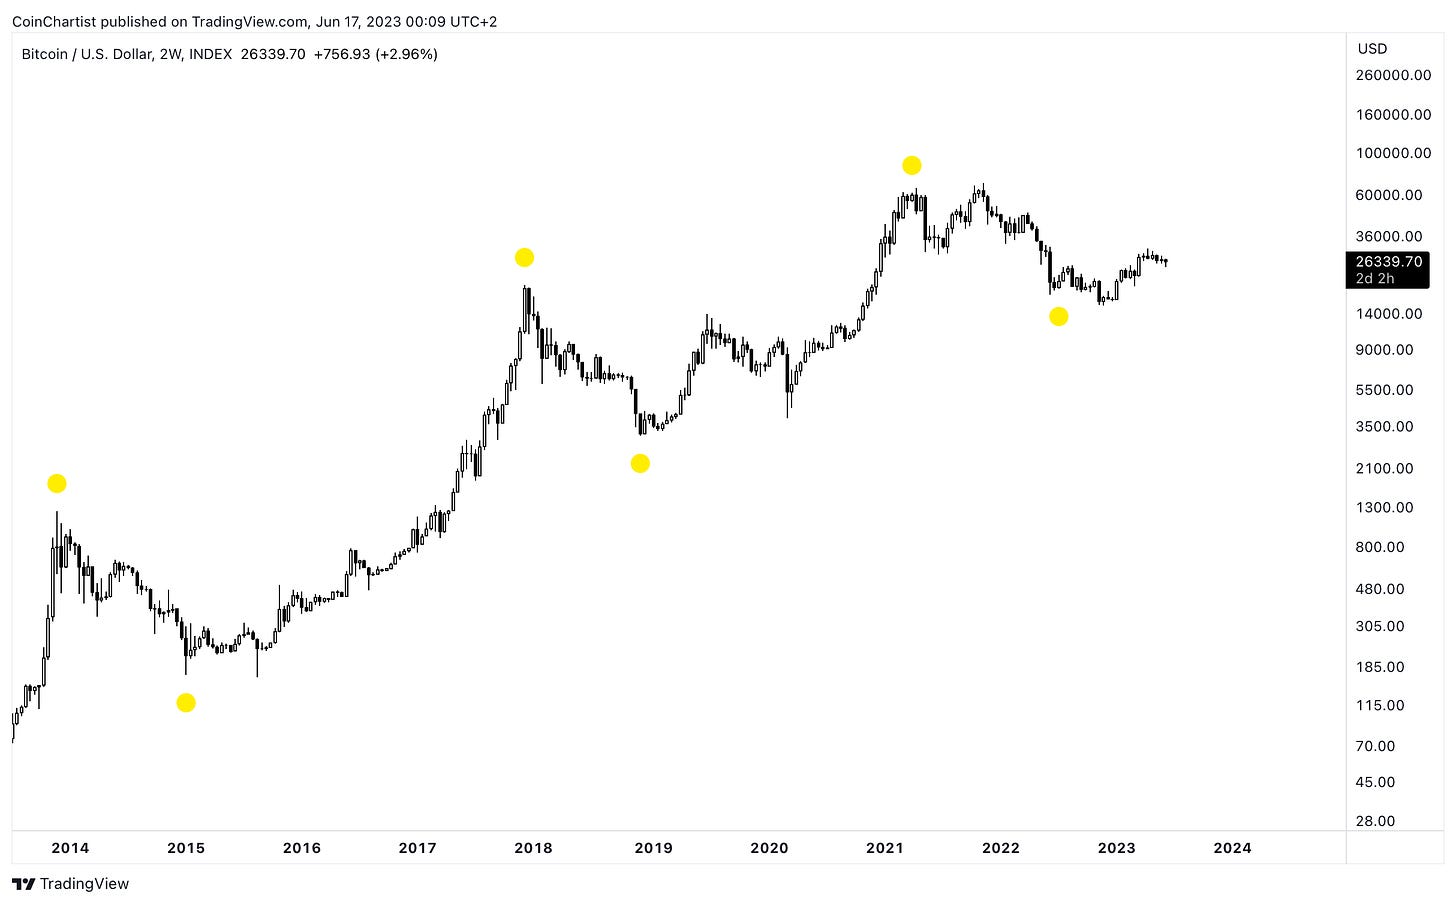
Recent price action has created more clarity around Bitcoin’s corrective wave count.
Following five waves up, BTCUSD has started to form a potential wave count, putting it in a double zig-zag with an ending diagonal in wave y.
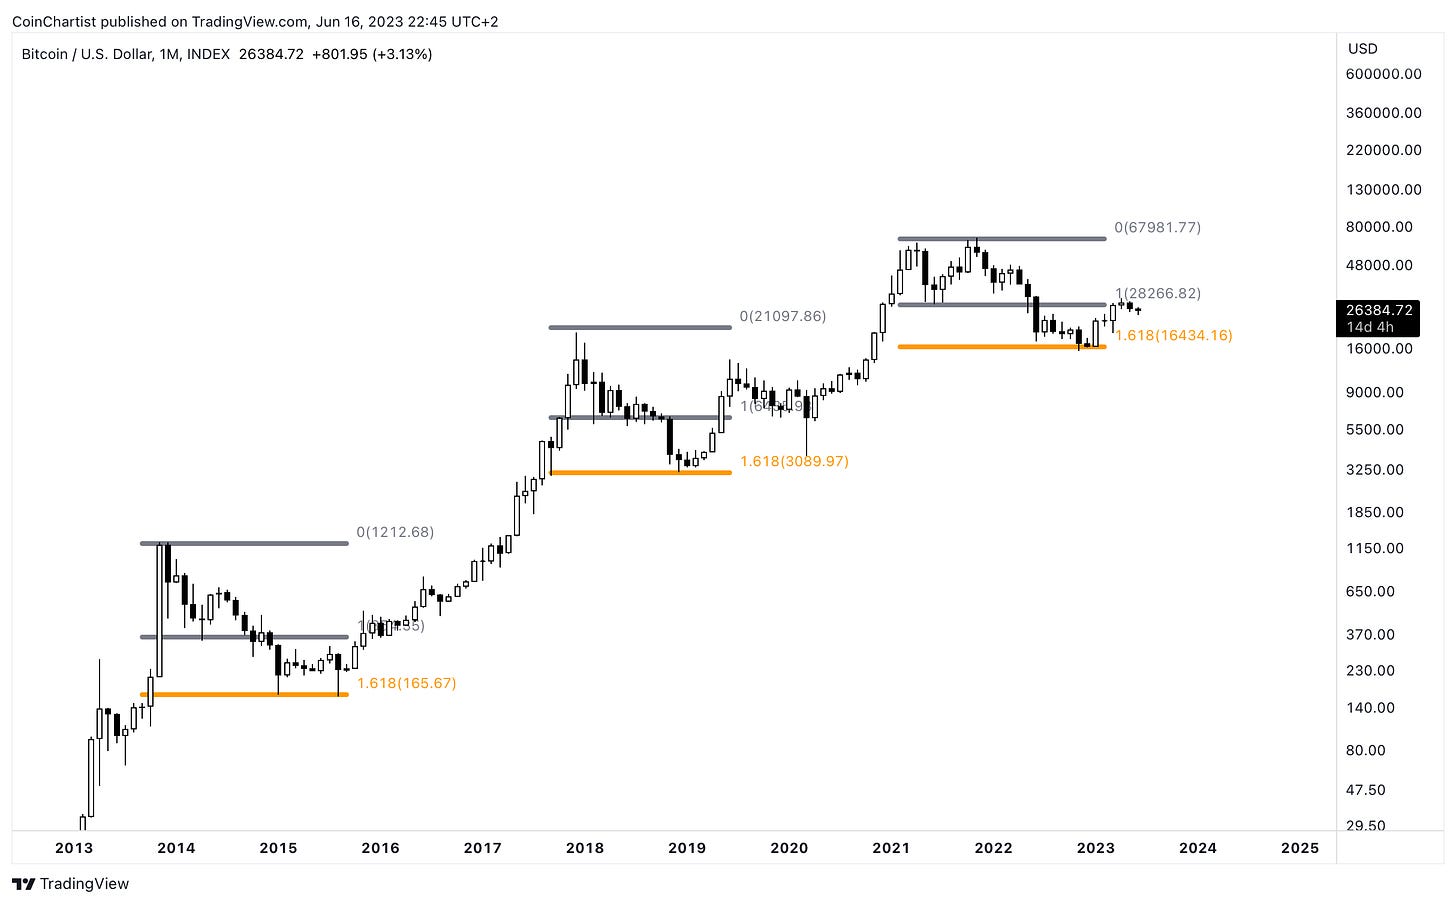
More evidence that BTC might have found a local bottom is by reaching the 1.618 Fib extension in the latest correction.
Learn more about Elliott Wave Principle here.
For those skeptical about how this works, in Elliott Wave Principle, C waves often reach the 1.618 extension of wave A.
Here is a preview of the exclusive technical indicators you get access to when you subscribe to CoinChartist (VIP) premium.
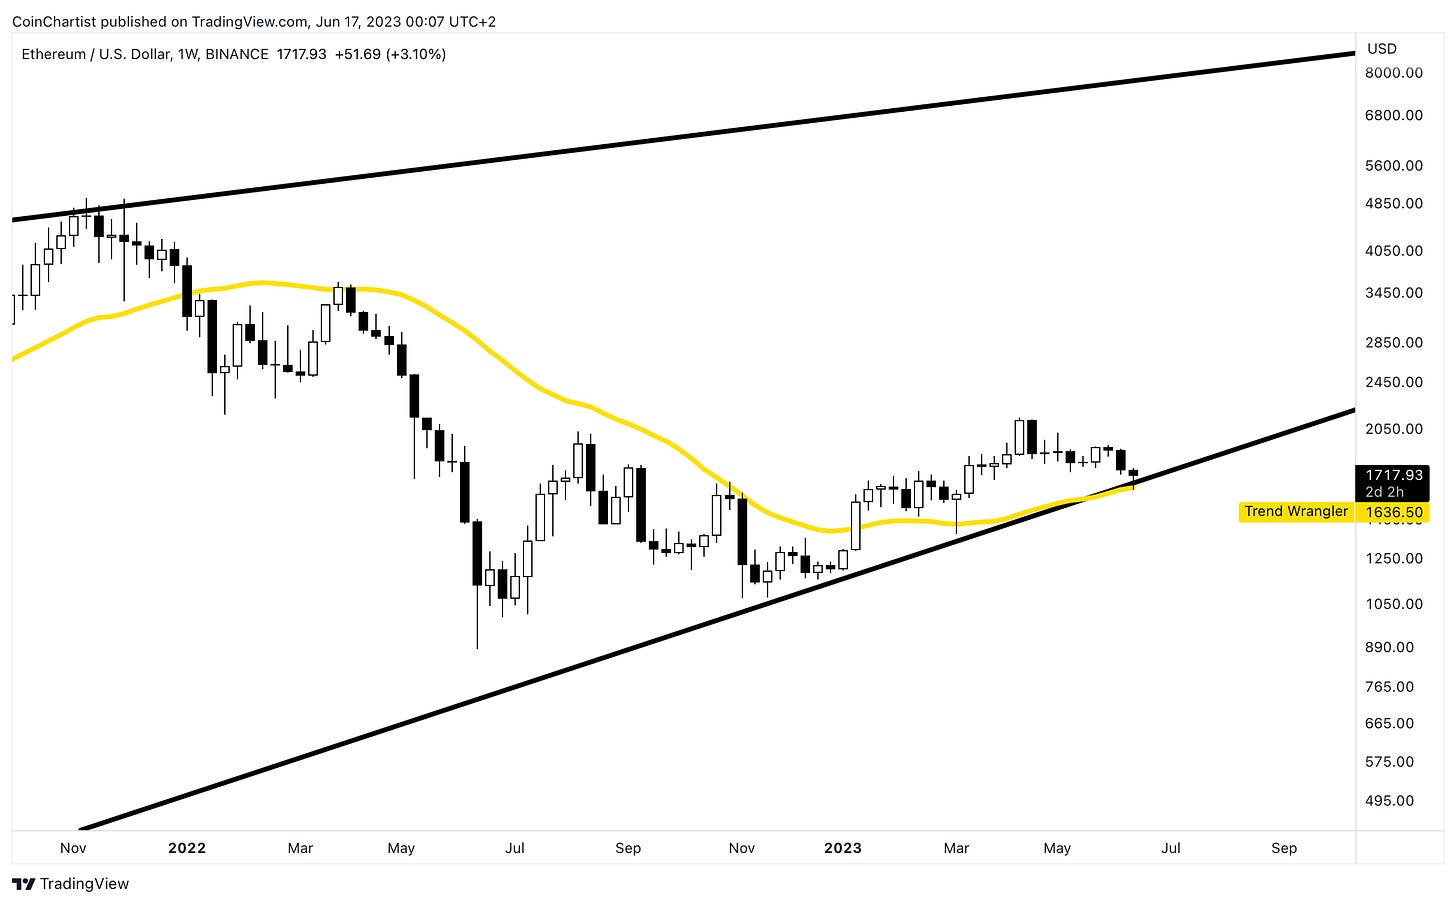
Although there was carnage across crypto this week, one thing the kept me relaxed was Ethereum holding above the Trend Wrangler.
Learn more about Trend Wrangler here.
If this is a situation like 2020, the Raging Bull should light up within the next few weeks, telling us the raging bull market is here.
Learn more about Raging Bull here.
At that point, I plan to stay long until the Bitcoin bullseye triggers, when I will begin selling my BTC.
Remember: You can unlock these tools by upgrading to a premium membership below.
That’s it for this week’s free content. Behind-the-paywall content includes:
Macro charts on British pound, Chinese yuan, the DXY, and Nasdaq
A closer look at altcoins LINK, FET, and MATIC
A lesson on why inverse head and shoulders form via waves
Please subscribe for premium and support CoinChartist.io, or share CoinChartist (VIP) with friends and family. You can also follow CoinChartist on YouTube and Twitter. Don’t forget to also like and comment to let us know how we’re doing.
Keep reading with a 7-day free trial
Subscribe to CoinChartist to keep reading this post and get 7 days of free access to the full post archives.


