

Liberation Uncertainty
Where does Bitcoin and the cryptocurrency market go after Liberation Day? This key market inflection point is deeply examined.

Disclaimer: The information provided in this Substack newsletter is for general informational purposes only and should not be considered as financial advice. Investing involves risk, and past performance is not indicative of future results. Please conduct your own research or consult a financial advisor before making any investment decisions. The newsletter disclaims any liability for losses or damages arising from the use of this information.
Liberation Uncertainty overview:
“So much higher” vs “its so over”: A special segment on Elliott Wave counts in Bitcoin
Key levels to watch for Bitcoin’s uptrend to remain in tact and how to strategize
Even if Bitcoin moves higher, it won’t be 2017 all over again
A bounce is due across crypto – will this be a recovery or a dead cat bounce?
Macroeconomic mayhem: Examining Gold and the stock market
At the end of last week, we saw one of the largest single day stock market corrections in history. The market panicked over the potential impact of the Trump administration’s sweeping tariffs. The Liberation Day crash made news headlines and investors braced for a Black Monday-style selloff to start the new week.
“Have you said thank you once?”
Yet, additional downside was muted, and a sudden, 90-day pause in tariff implementation caused one of the largest intraday upside moves in stock market history. With records set both to the downside and upside, the outlook is rather confusing, leading to a sense of uncertainty. The only certainty, is that this type of volatility should continue now that the fuse is lit.
Volatility typically comes with a negative connotation. For example, the VIX volatility index is often referred to as the fear index. However, volatility can release in both directions, as we’ve seen. So while I remain steady that high timeframe technicals on Bitcoin and other cryptocurrencies have turned bearish, there are still enough explosive ingredients to pull together one final rally in Bitcoin and stocks. This issue will explore this idea and alternative viewpoint.
What’s going on in financial markets isn’t just a cryptocurrency-specific event – this is one of the most significant macroeconomics events in the last 20 years and potentially longer. As such, macro assets outside of Bitcoin and crypto are once again chiefly important to understanding the bigger picture and how the cryptocurrency asset class fits within it. Let’s take a deeper look at these themes.
So much higher or it’s so over?
Bitcoin could move sideways a while longer, but that doesn’t seem likely. Financial markets are just too volatile at this very moment. The tariffs lit a fuse, essentially, and the explosion is coming any moment — we just don’t quite know in which direction things are going to explode.
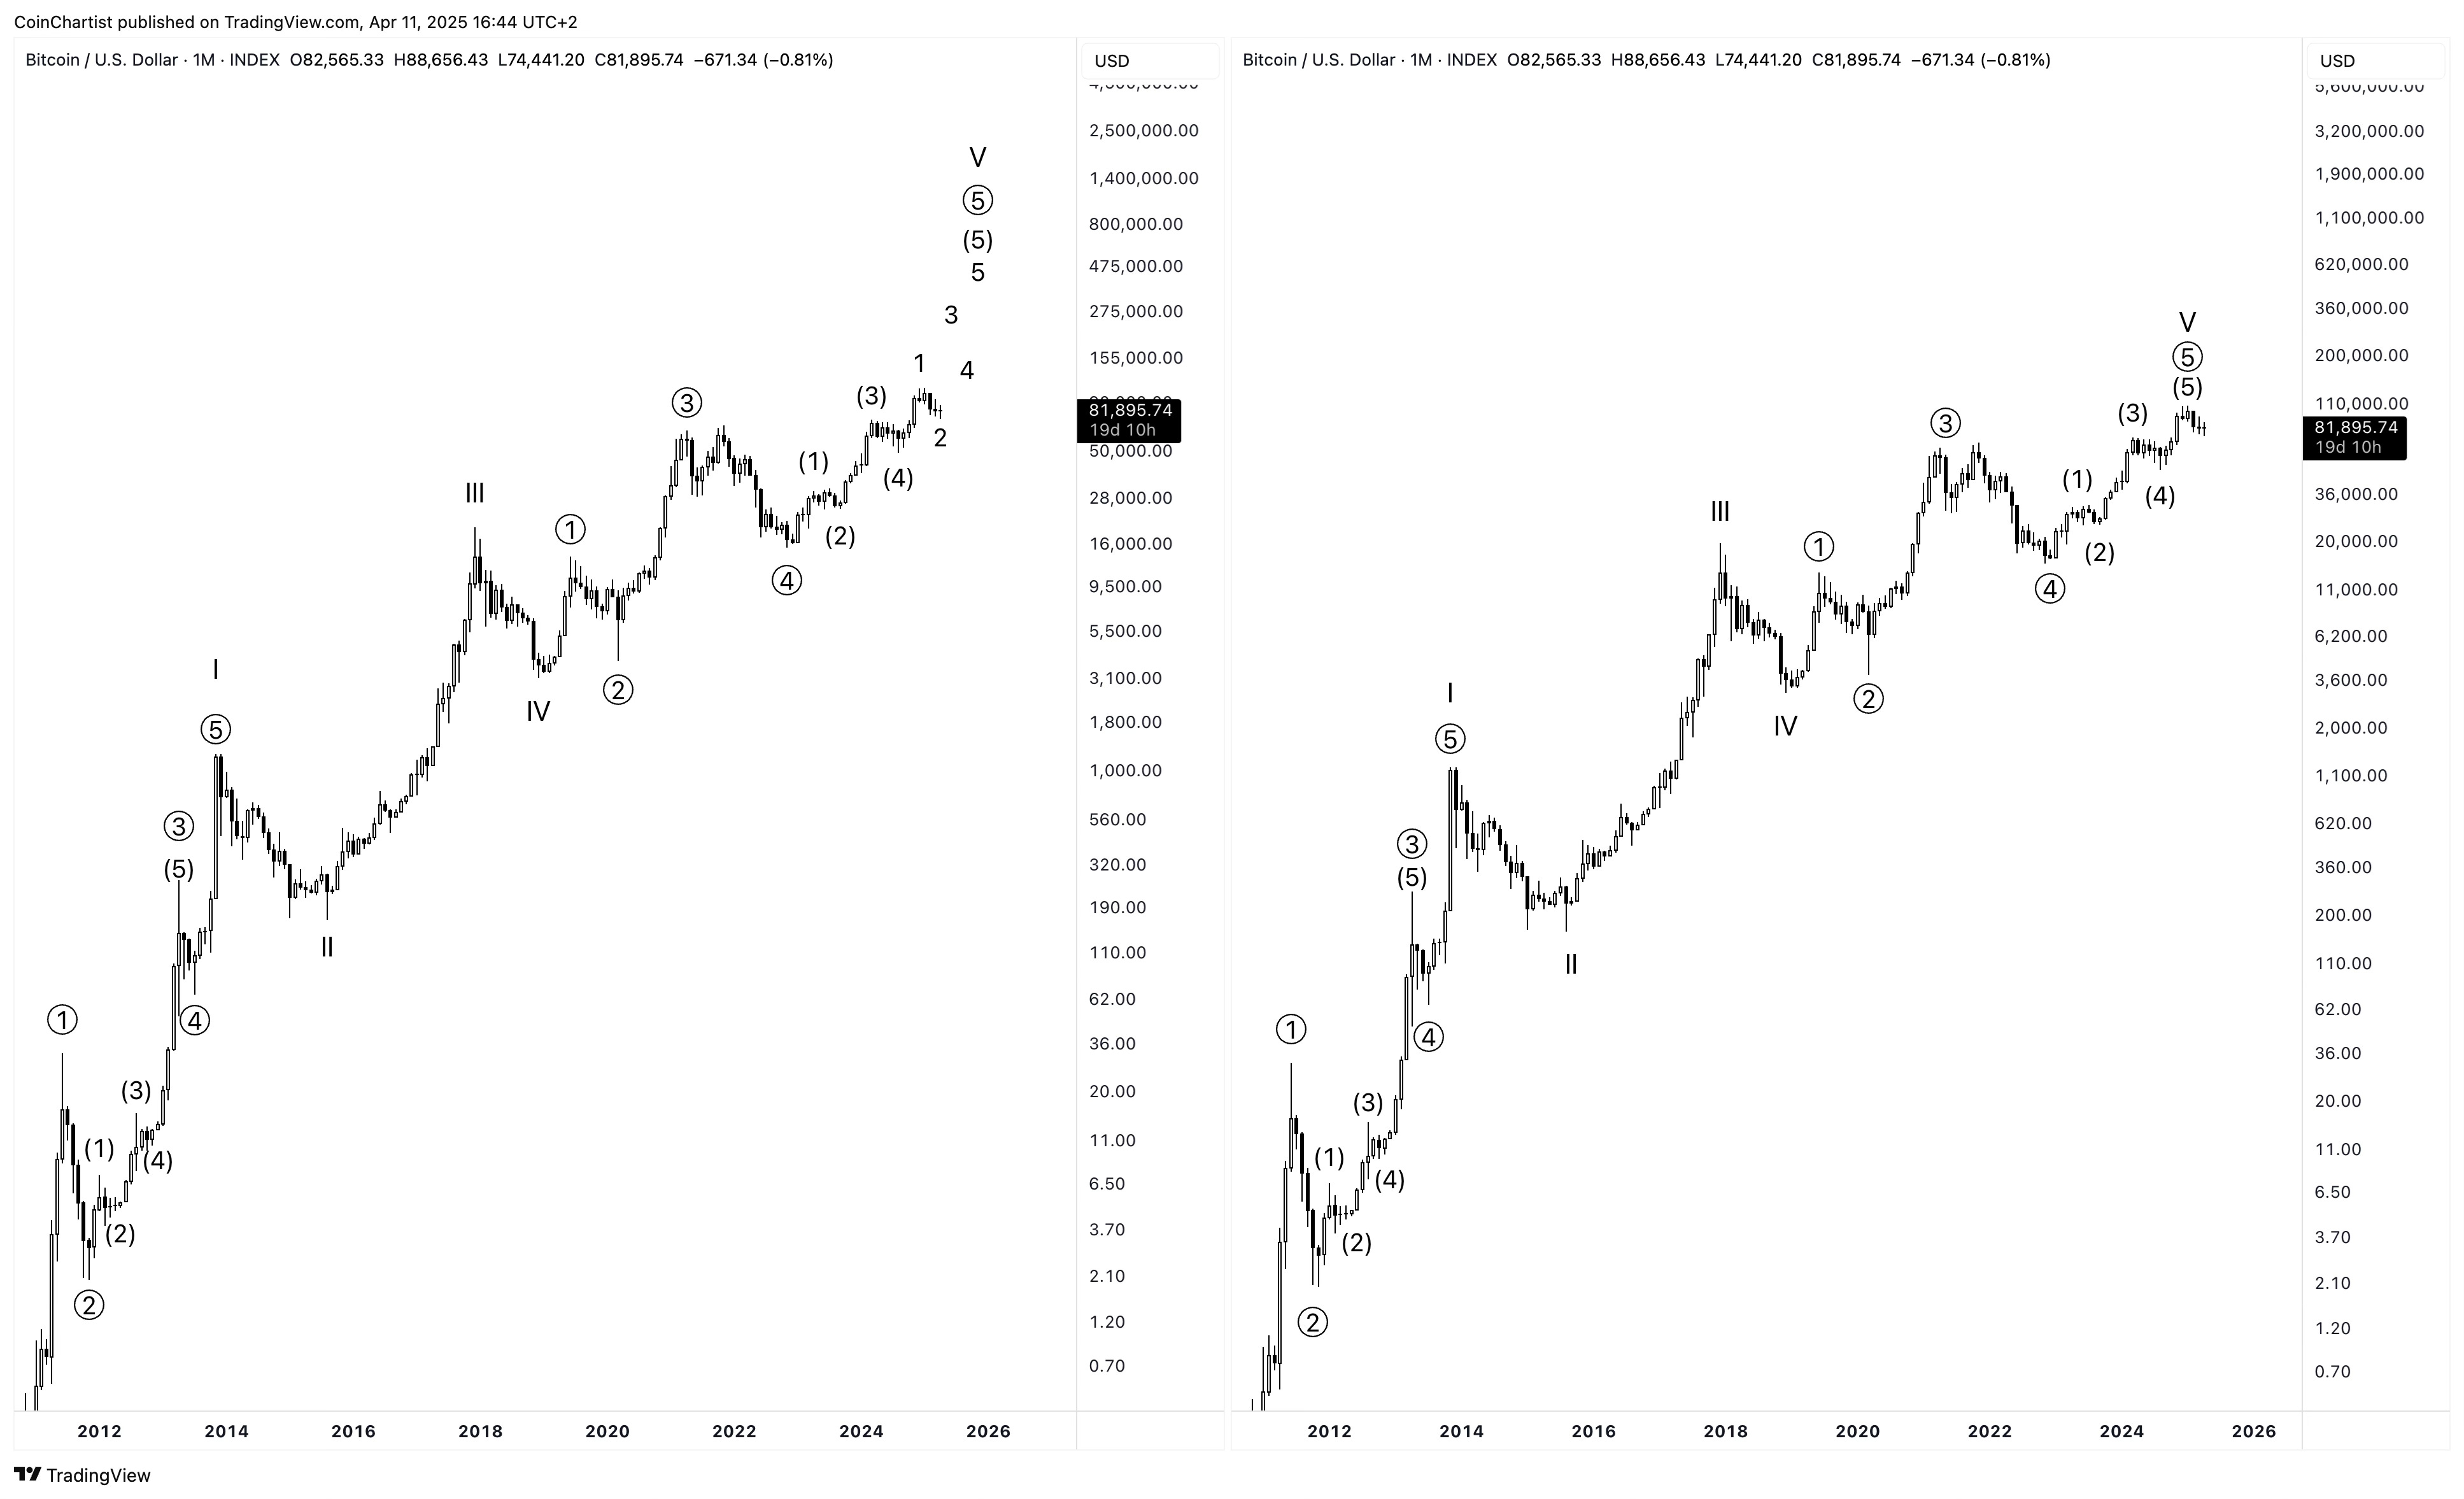
On the left, we have the “so much higher” camp with Bitcoin’s extended fifth wave. On the right, we have the “it’s so over” crowd, where Bitcoin’s wave 5 is now over and was relatively muted. At this very moment, both scenarios are still valid. However, there is limited evidence that wave 5s in Bitcoin extend, while there is substantial evidence that Bitcoin wave 3s extend instead.

On the left, the so much higher crowd is hoping that fear in the market drives prices back above $100,000 and possibly beyond $200,000. On the right, Bitcoin would be looking for more short term downside before a bounce, followed by an intermediate lower high and lower low.
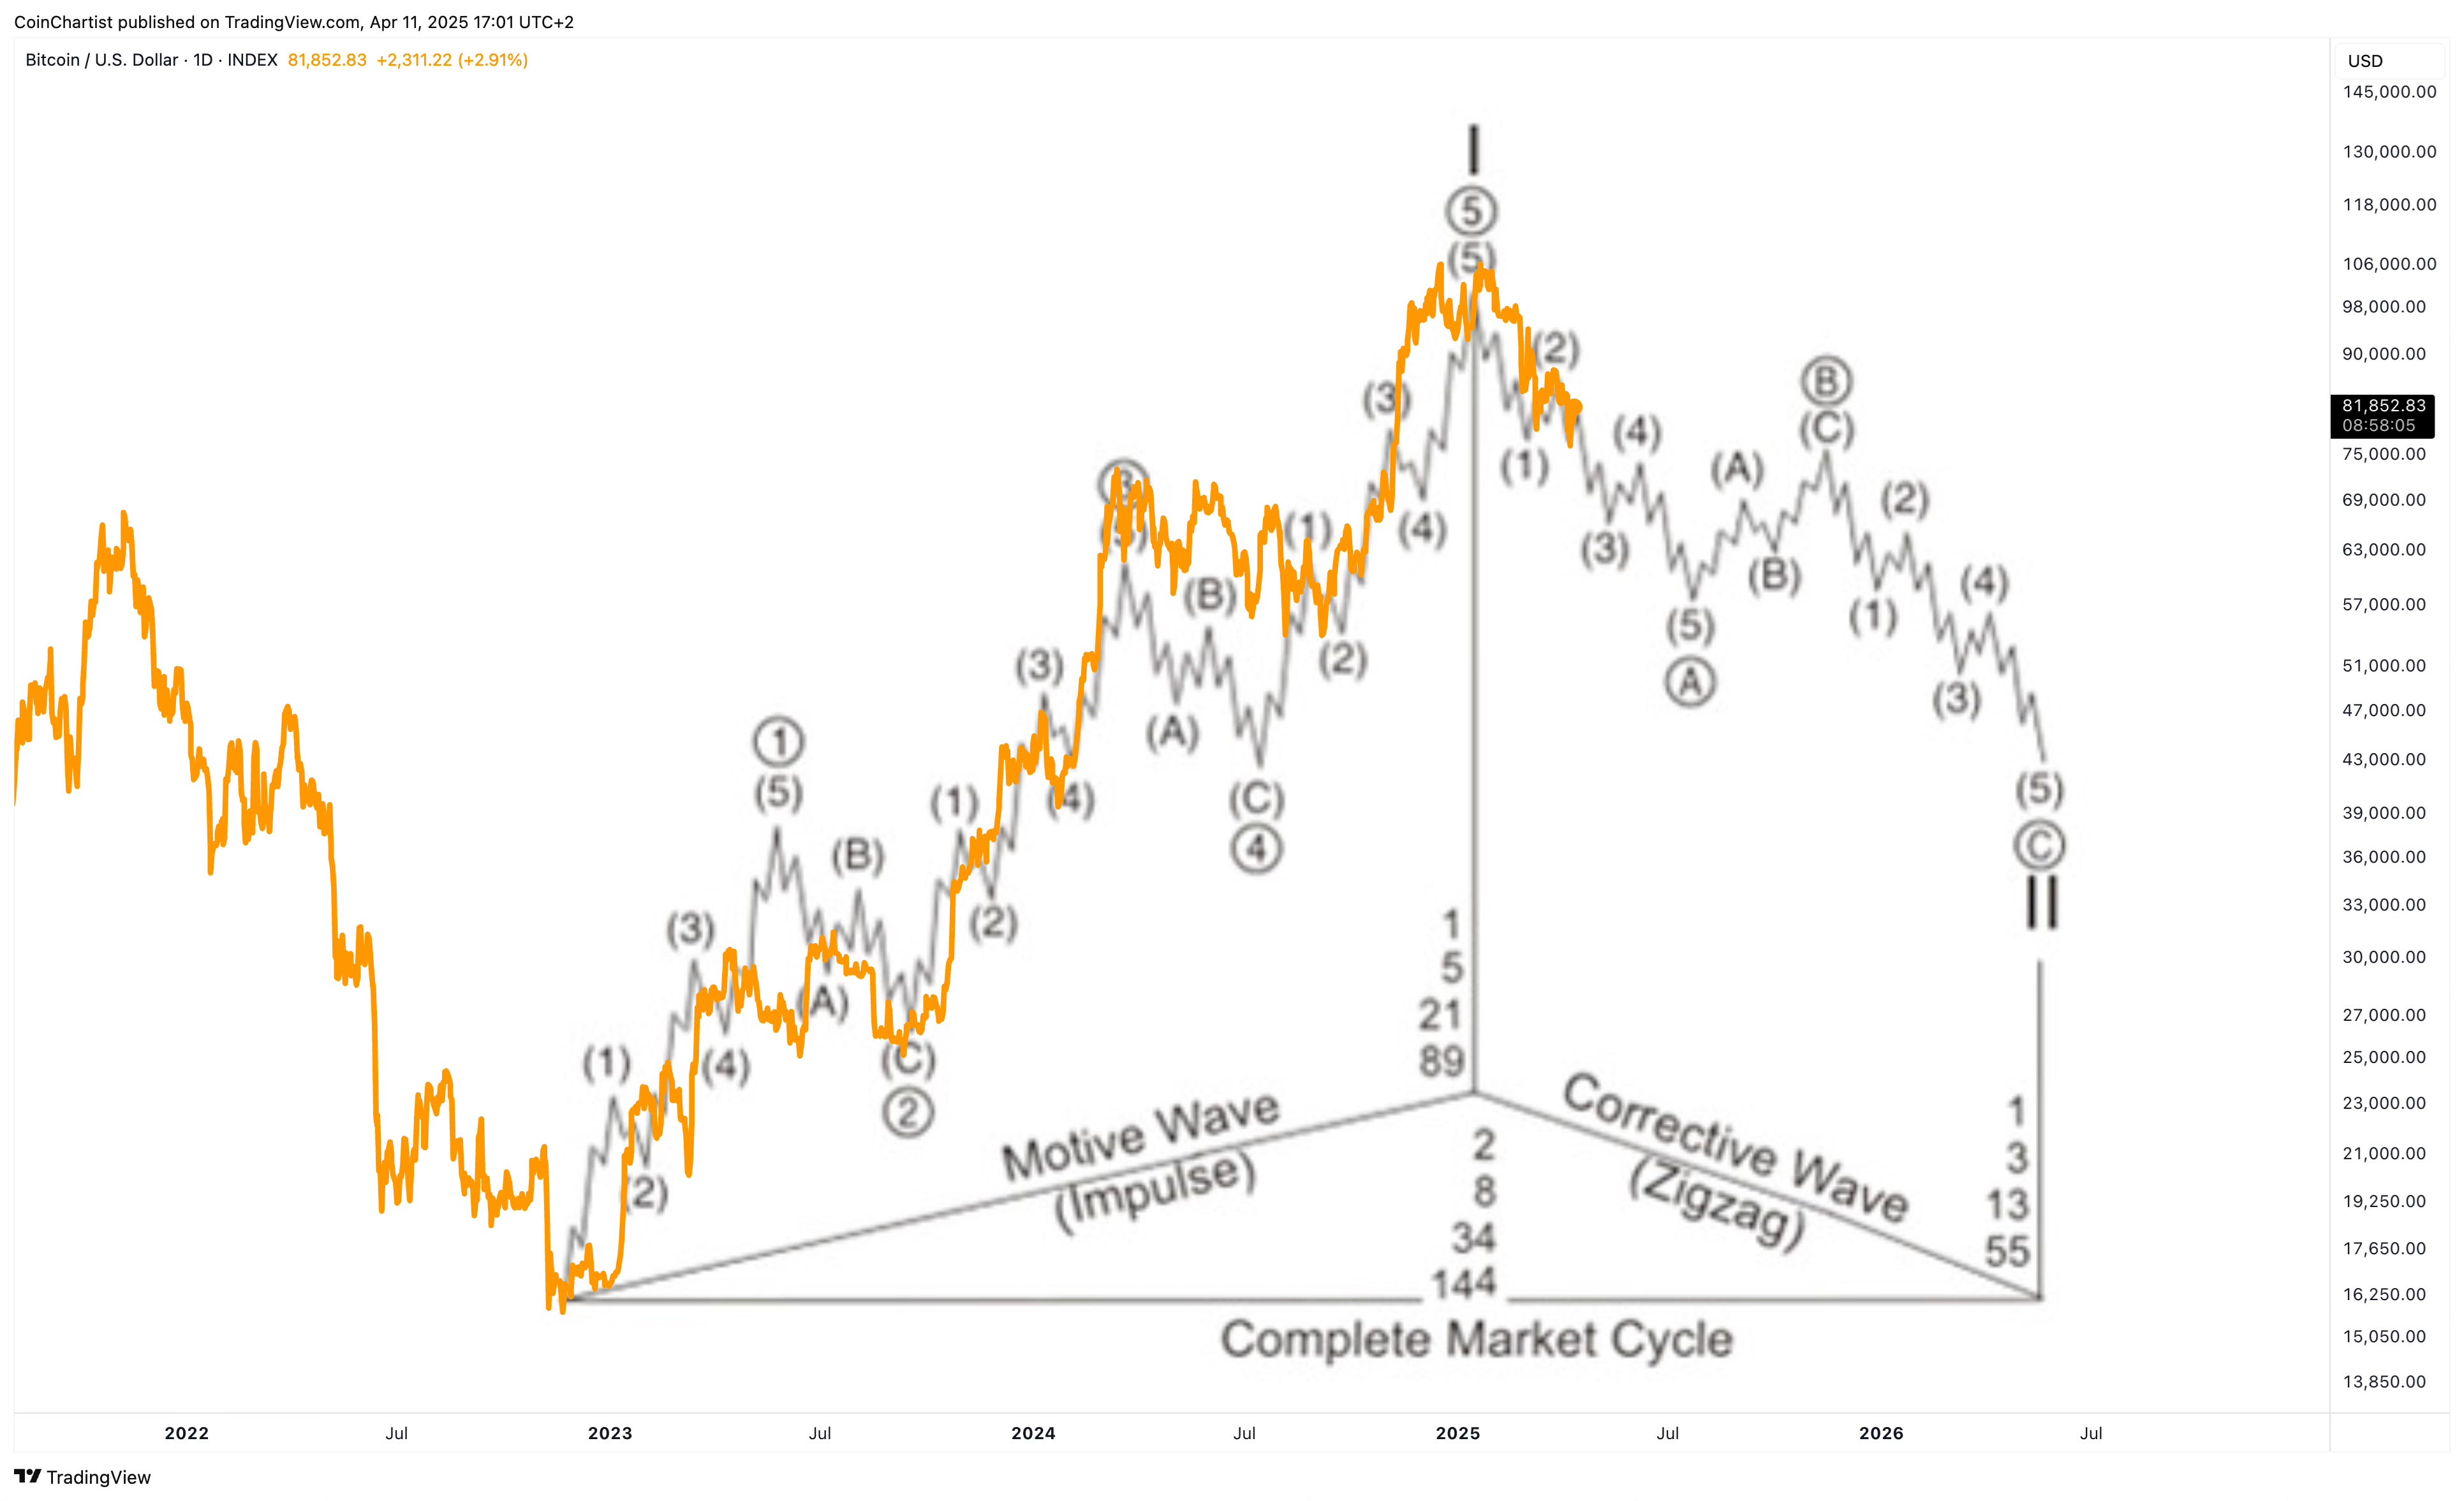
I continue to lead towards the bull market having ended, as depicted by Bitcoin overlaid on top of the Elliott Wave complete market cycle chart. Interestingly, the waves match up almost perfectly from a timing standpoint, suggesting that the trend has since changed.
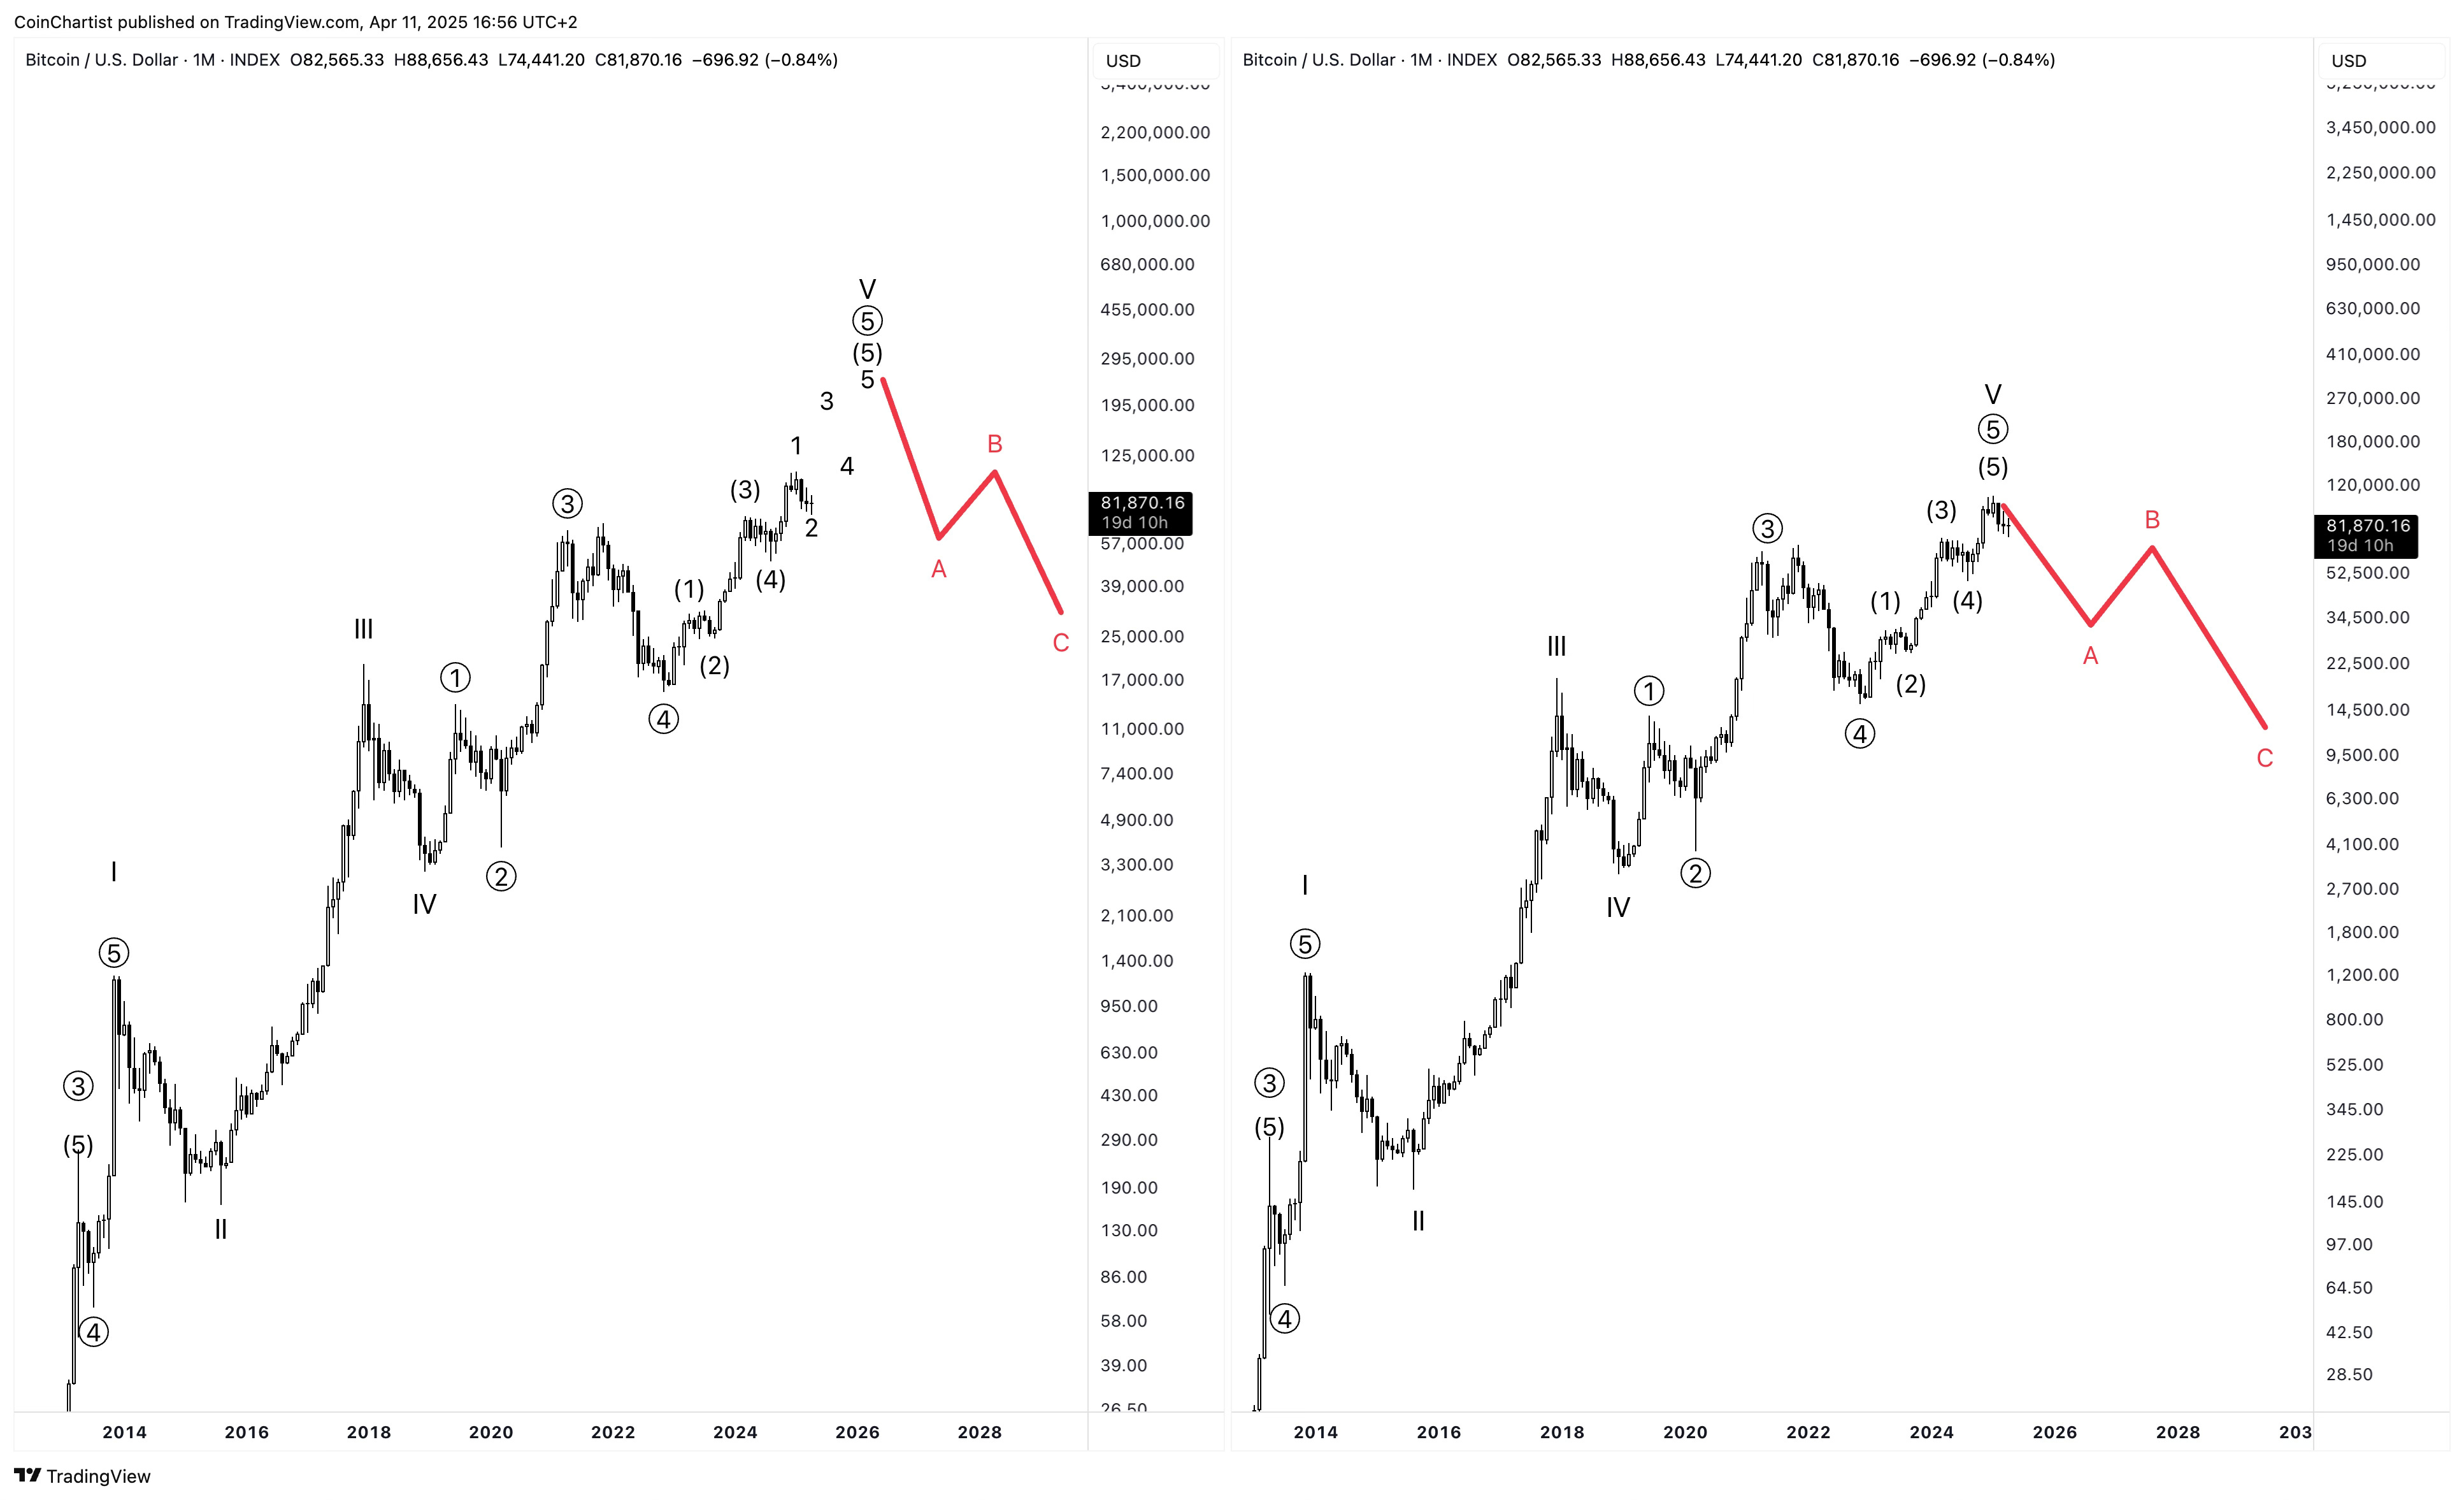
In either case, Bitcoin is more than likely ready to face a larger degree correction of its entire first complete supercycle. Bulls might not want to believe in such a scenario, but the extended fifth wave pictured on the left, is only possible at the end of this high of a wave degree. Topping out higher likely means a larger percentage correction, but Bitcoin finds its footing above $16,000. However, if Bitcoin topped out at $108,000 back in January, the correction could go deeper than the last cycle’s bear market low.
While we can’t be sure about the direction, cyclically, it does appear that Bitcoin is ready for a very large move, as each of these impulses are spaced out at exact intervals.
Crossing the line into a bear market
Because we are still at this inflection point in Bitcoin where it could still go back up, few are ready to admit that a bear market might have started nor have positioned themselves appropriately. Those looking for very clear signals that the trend has changed are risking facing large losses before those signals appear.
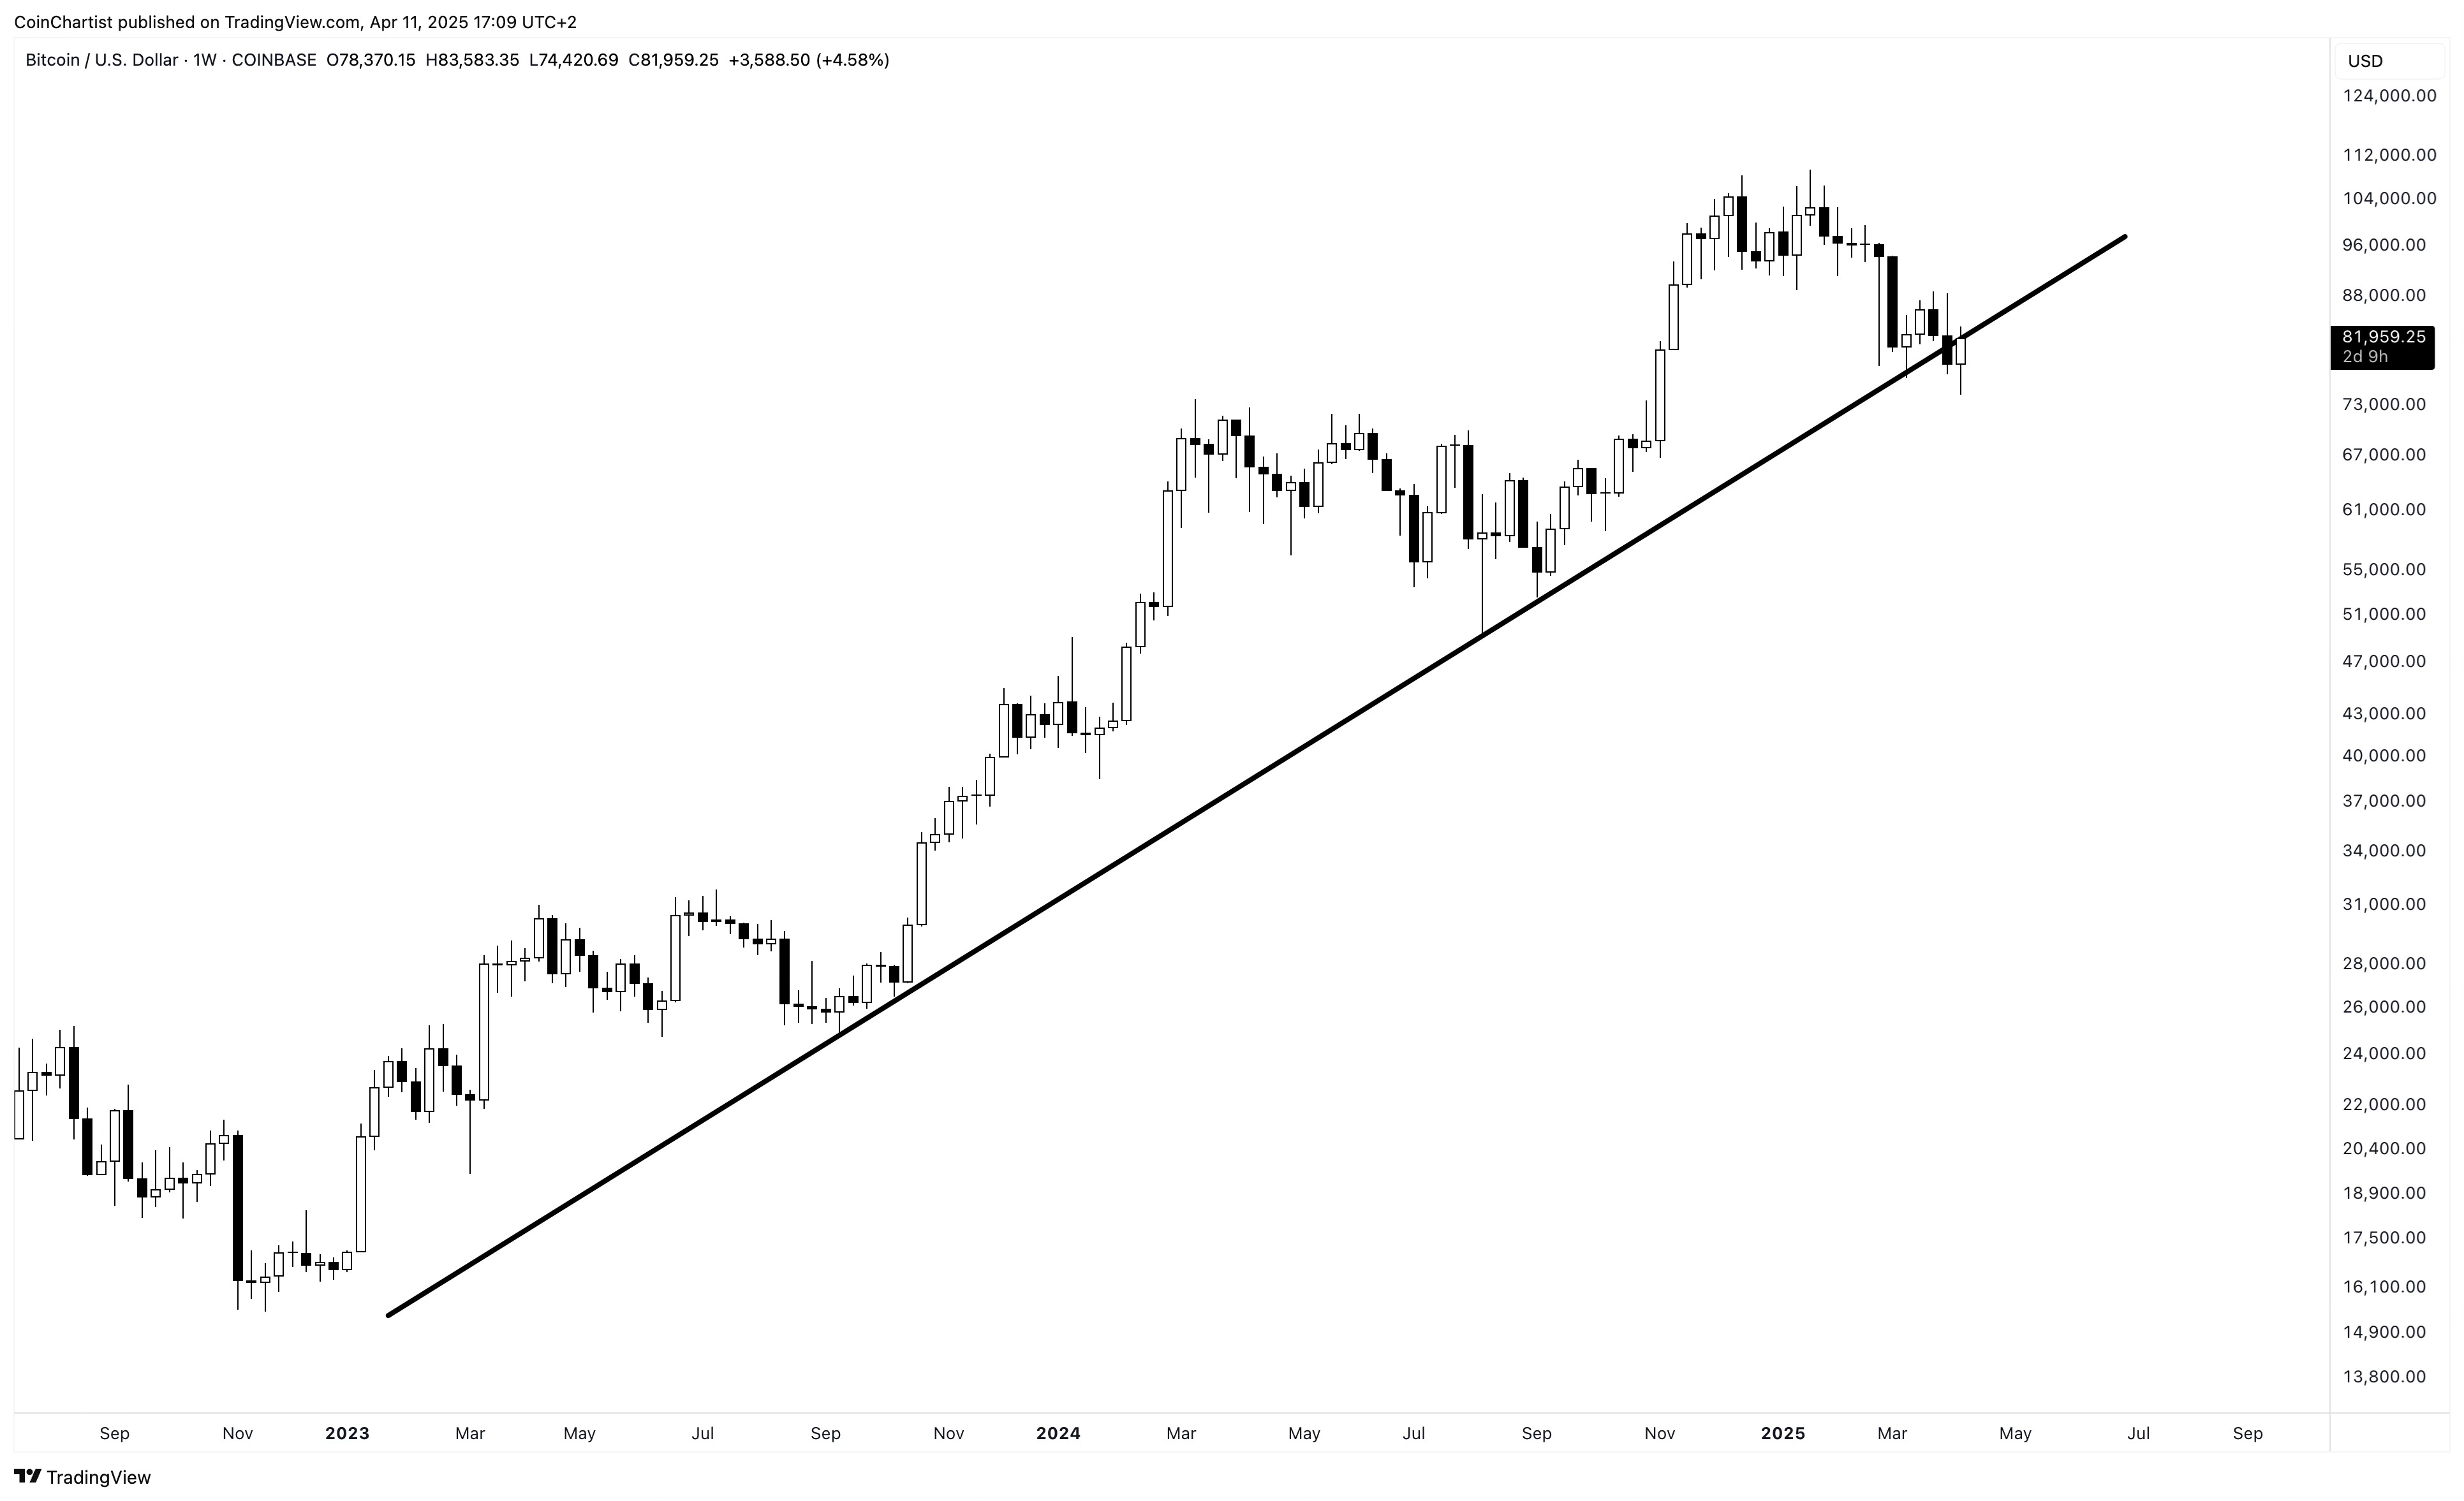
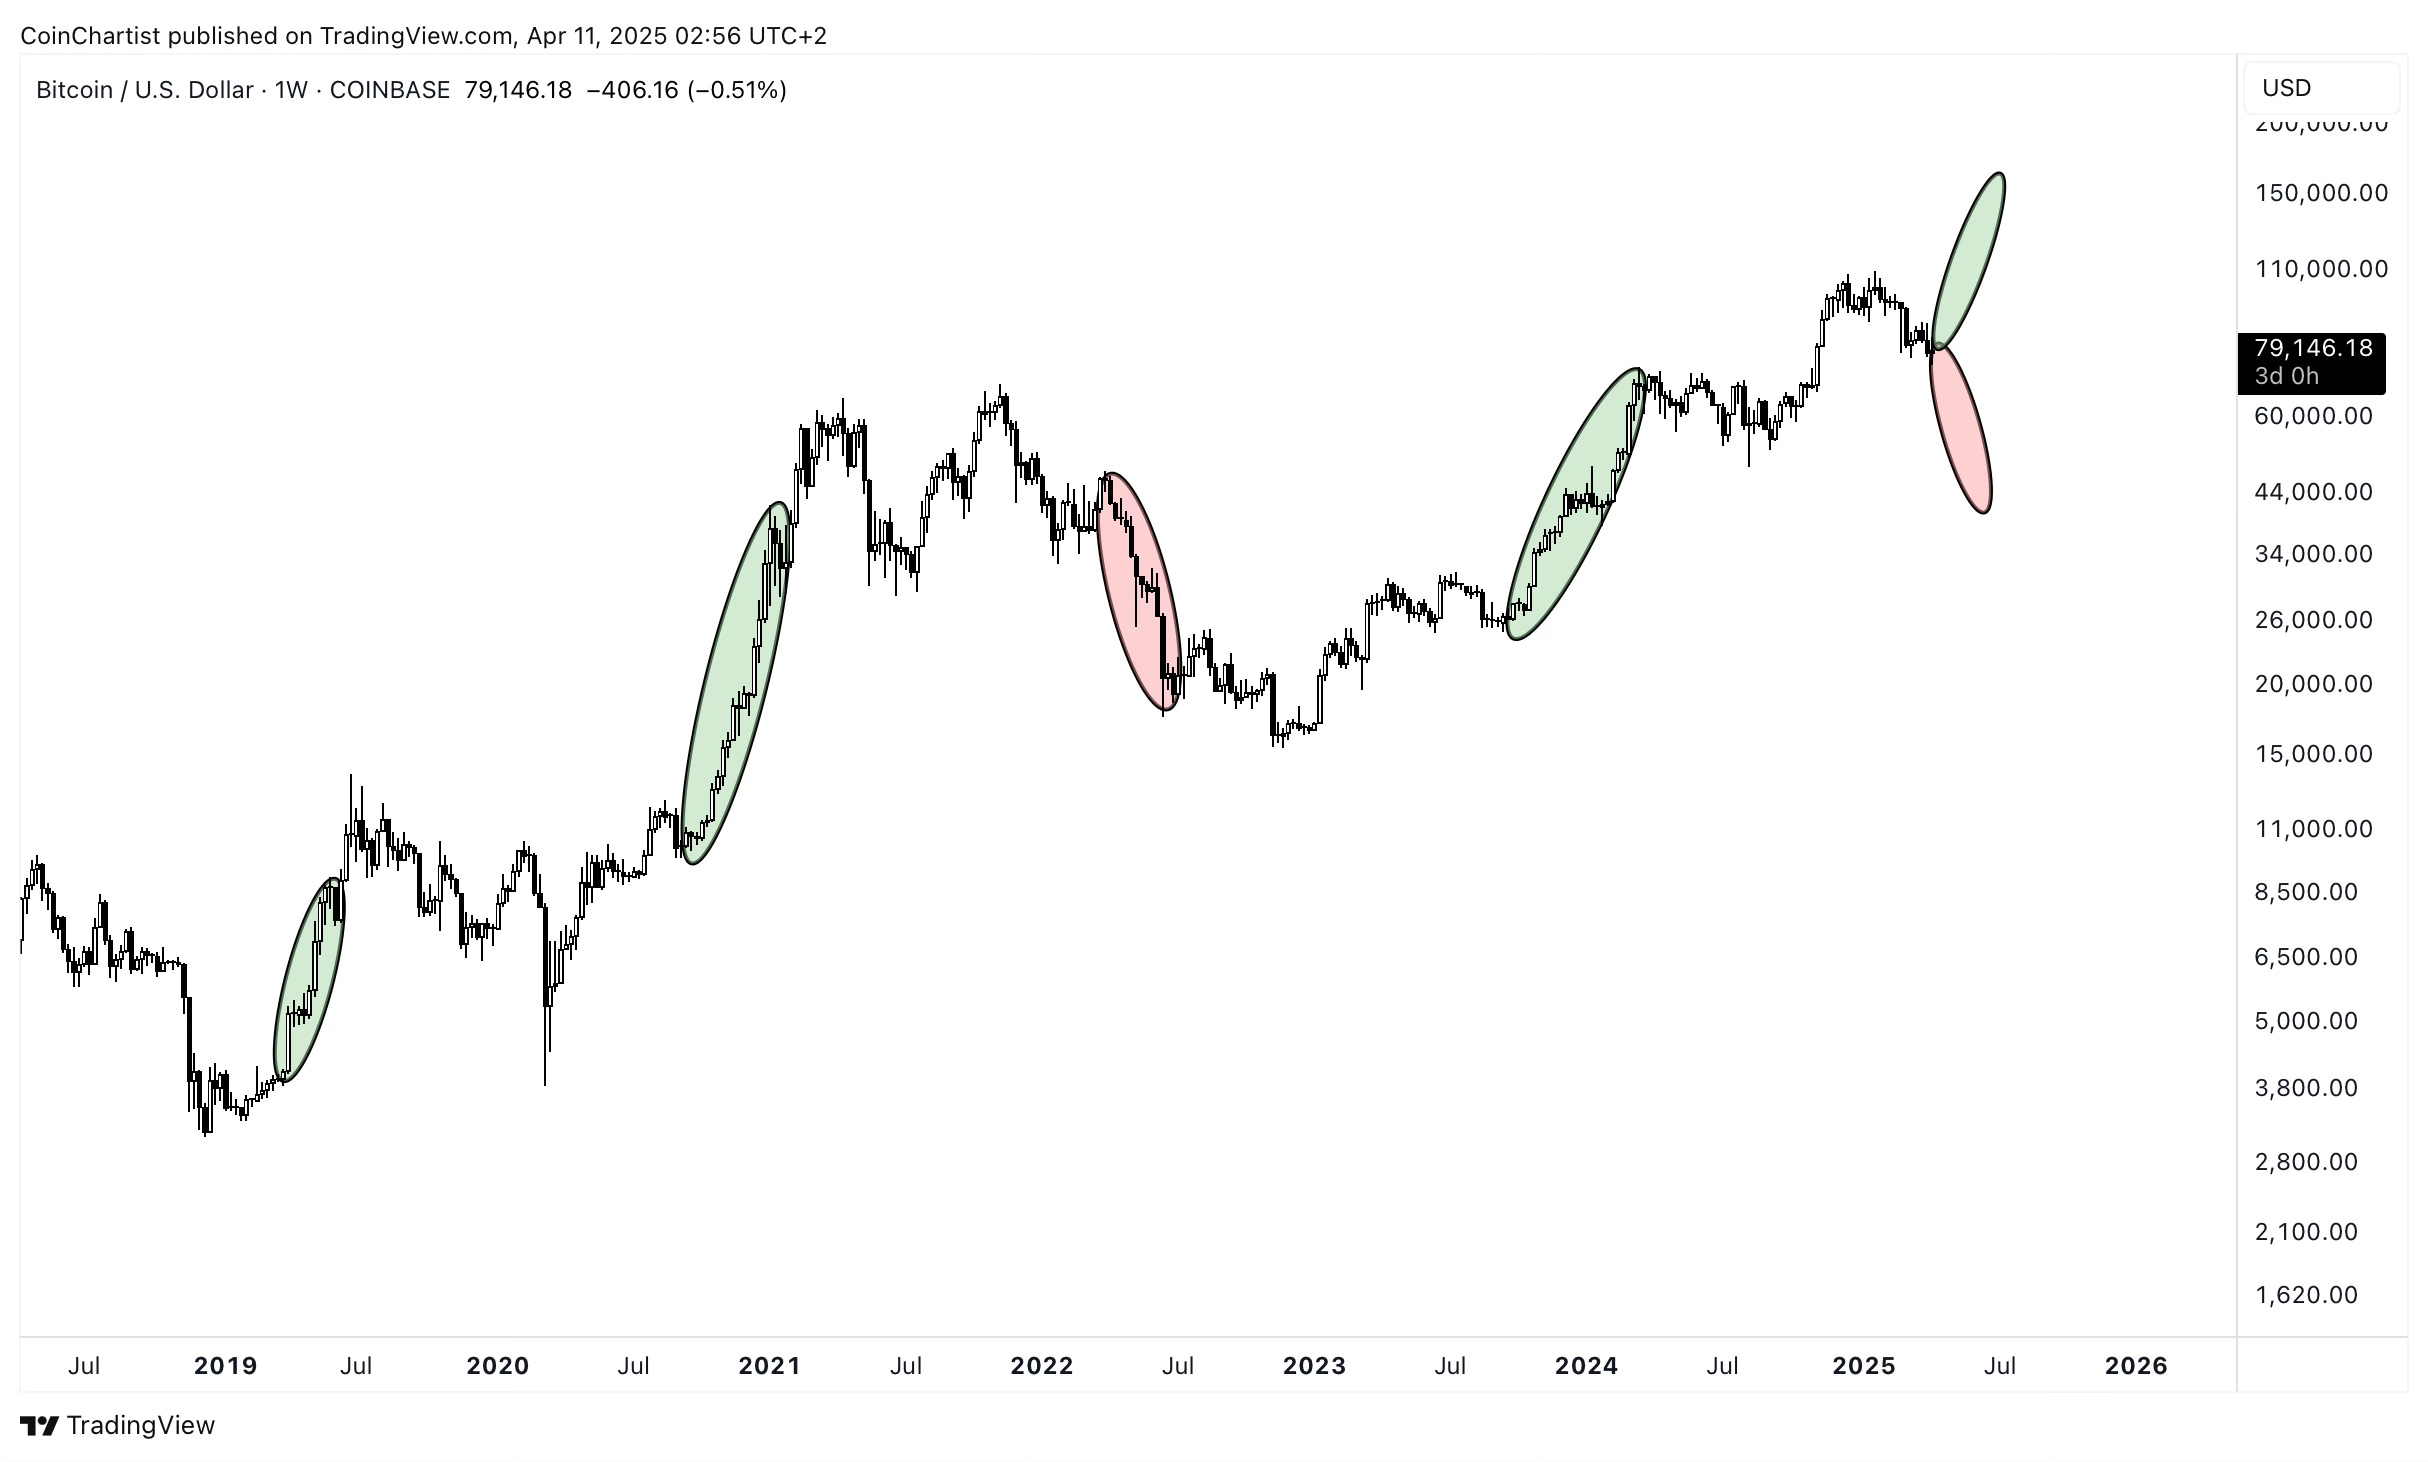
The first potential signal that the uptrend has ended, is the fact that Bitcoin closed below this diagonal uptrend line. Price is retesting it this week, possibly hinting at a bearish retest of support turned resistance. Once again, although there’s a possible signal here, most are choosing to ignore this and hold out hope for “so much higher.”
Keep reading with a 7-day free trial
Subscribe to CoinChartist to keep reading this post and get 7 days of free access to the full post archives.