

MicroTragedy
Bitcoin is back above $100,000, but still teetering between bearish and bullish technicals. Plus, why MicroStrategy is starting to pose a threat to Bitcoin.

Disclaimer: The information provided in this Substack newsletter is for general informational purposes only and should not be considered as financial advice. Investing involves risk, and past performance is not indicative of future results. Please conduct your own research or consult a financial advisor before making any investment decisions. The newsletter disclaims any liability for losses or damages arising from the use of this information.
MicroTragedy overview:
Why I am still not ready to FOMO into Bitcoin
COIN gets added to the S&P 500 - what this could mean for crypto
Two top technical indicators are almost equally bullish and bearish – how is this possible, and which side will win?
First altcoin season fires, is it finally time?
Elliott Wave updates with bullish and bearish scenarios outline
A special feature on the risk MicroStrategy poses to BTC
In my last issue, I outlined key levels that needed to be hit for me to resume being bullish on Bitcoin. Despite BTC making a dramatic comeback with much more bullish strength than I had anticipated, my invalidation levels aren’t yet hit.
Still, technical signals are starting to turn bullish after this latest push above $100,000. At this point, I am assigning a higher probability to my bearish thesis being invalidated – but as of right now it hasn’t been, and there are still some non-confirmations in the BTCUSD chart that leave room for a resumption of a downtrend.
It will all come down to the May monthly close to confirm the technical signals and cement them on the chart. With weekly technicals looking bullish, Bitcoin and the rest of risk assets simply need to remain that way for the rest of the month. Three weeks are left in May, leaving plenty of time for the outlook to change.
This issue looks at this recovery compared to past bear market recoveries, which critical technical signals are teetering on the line between bearish and bullish, and what both bull market continuation and a bear market might look like. Finally, I’m sharing some high-risk charts associated with Bitcoin and MicroStrategy after the company’s latest BTC purchase.
No FOMO
Even with Bitcoin back above $100,000 – something I didn’t think would happen – I am not yet feeling any FOMO (fear of missing out). A 40% comeback is definitely noteworthy. But if it ends up being nothing more than a bear market bounce, it will be among one of the most muted rallies in BTCUSD history.
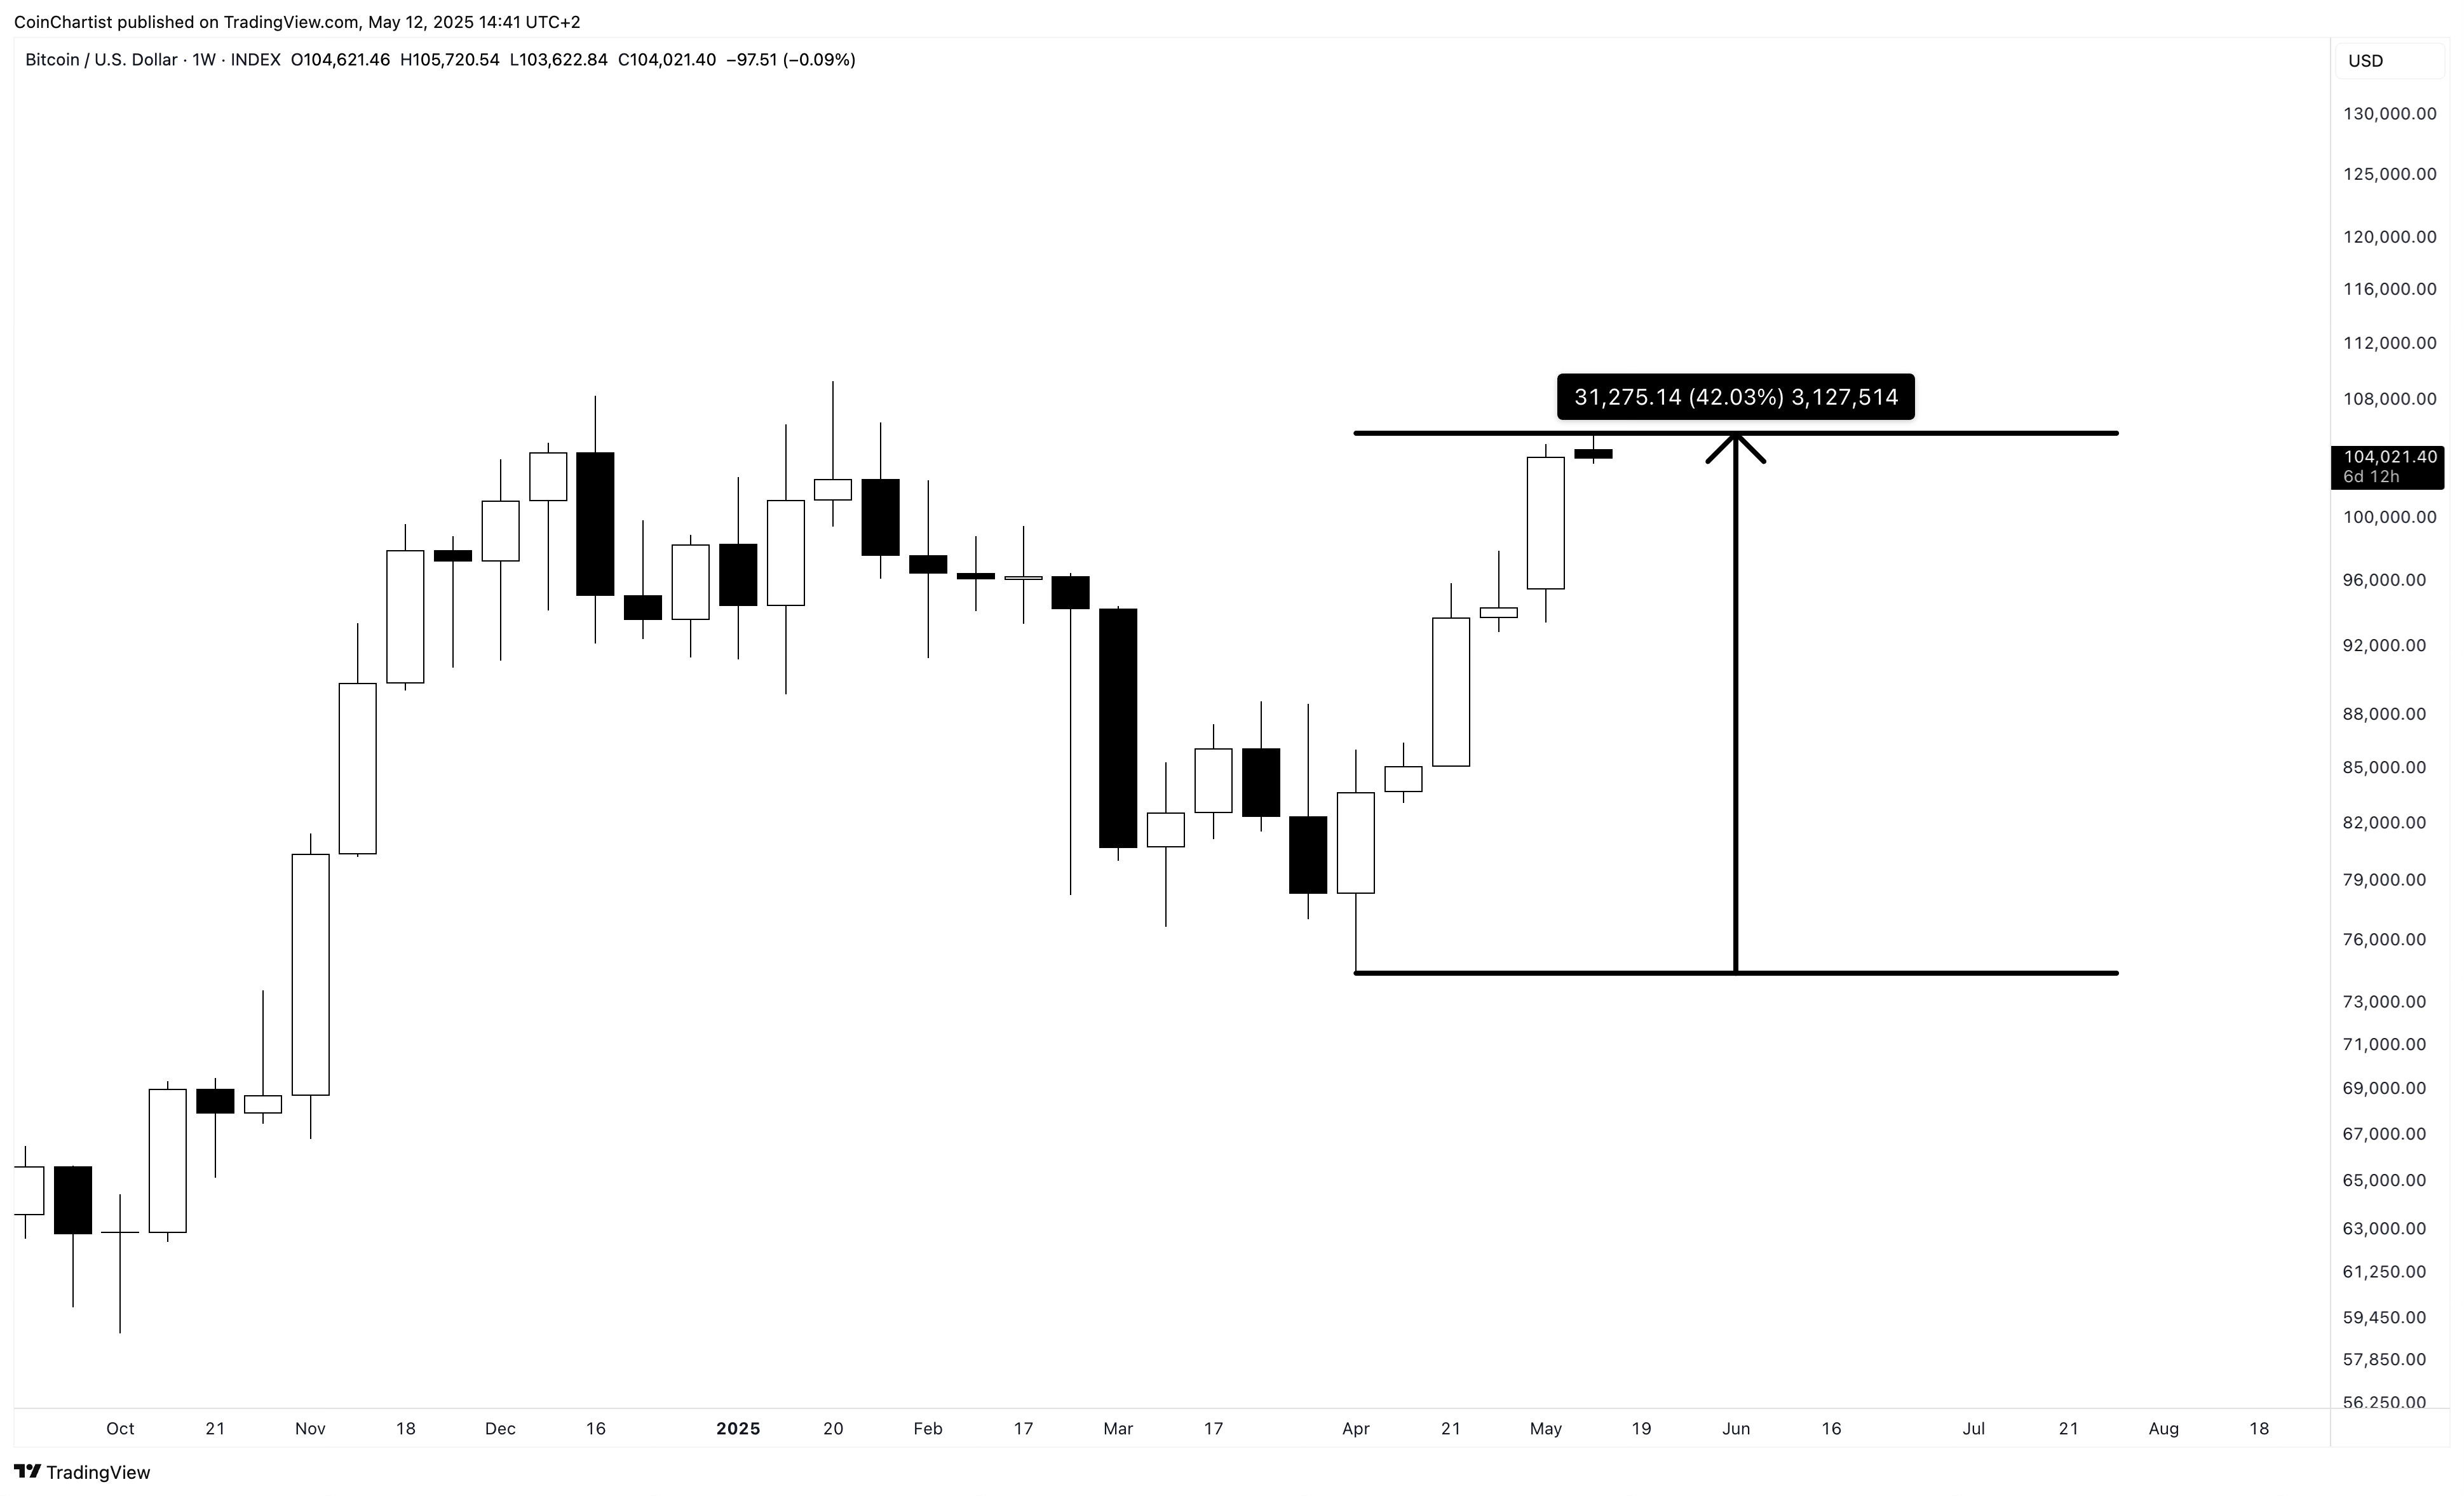
From the early April lows set below $75,000, Bitcoin has gained $30,000 per coin and risen by 42%. At current levels, Bitcoin is about 5% away from a new all-time high. Considering the proximity to ATHs and technicals starting to teeter back towards being bullish, I’m at this point assigning a higher probability to the ATHs being exceeded and the bull run continuing. That said, we still cannot rule out some type of reversal here back into some type of downtrend – short – or longer-term.
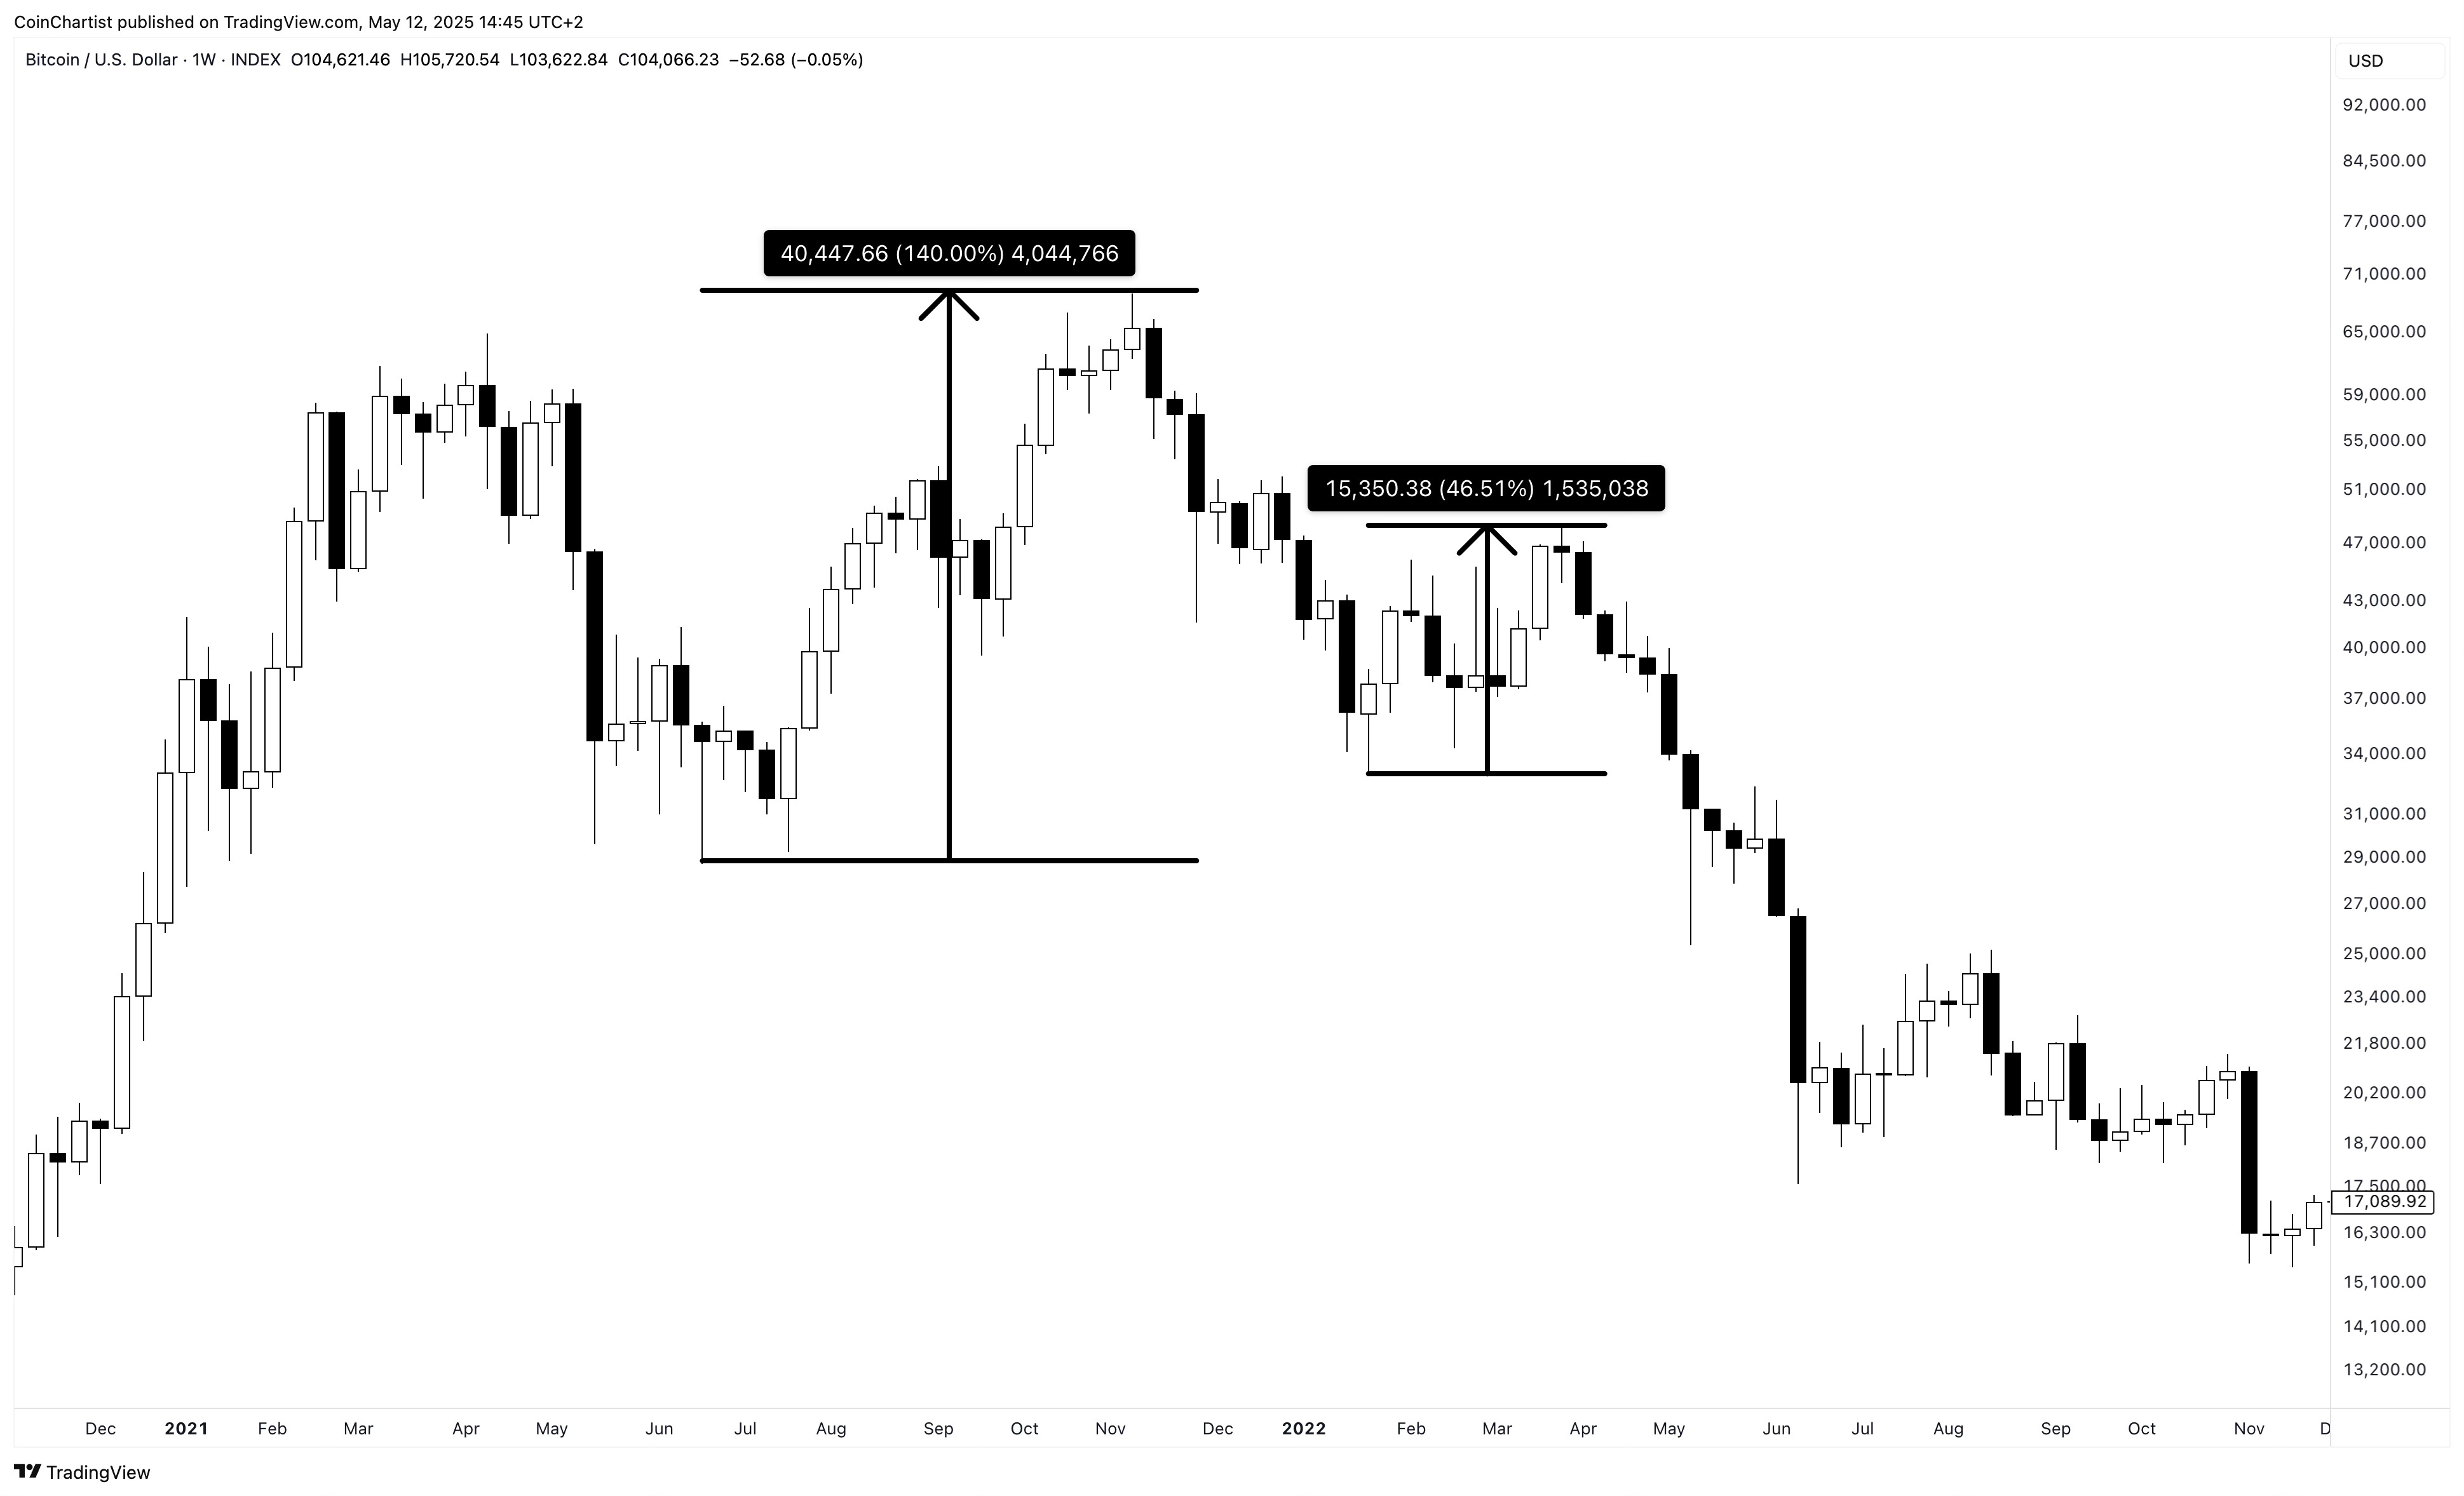
The most recent bear market was a confusing one. Most people view the second top in 2021 as the cyclical peak. However, this pattern is an Expanded Flat, in which the second 2021 top was a B wave. This B wave bounced 140% before turning into the more aggressive C wave. In an Expanded Flat, the C wave features five sub-waves down. Sub-wave 2 was another 46% bounce before the worst of the bear market began and new lows were made.
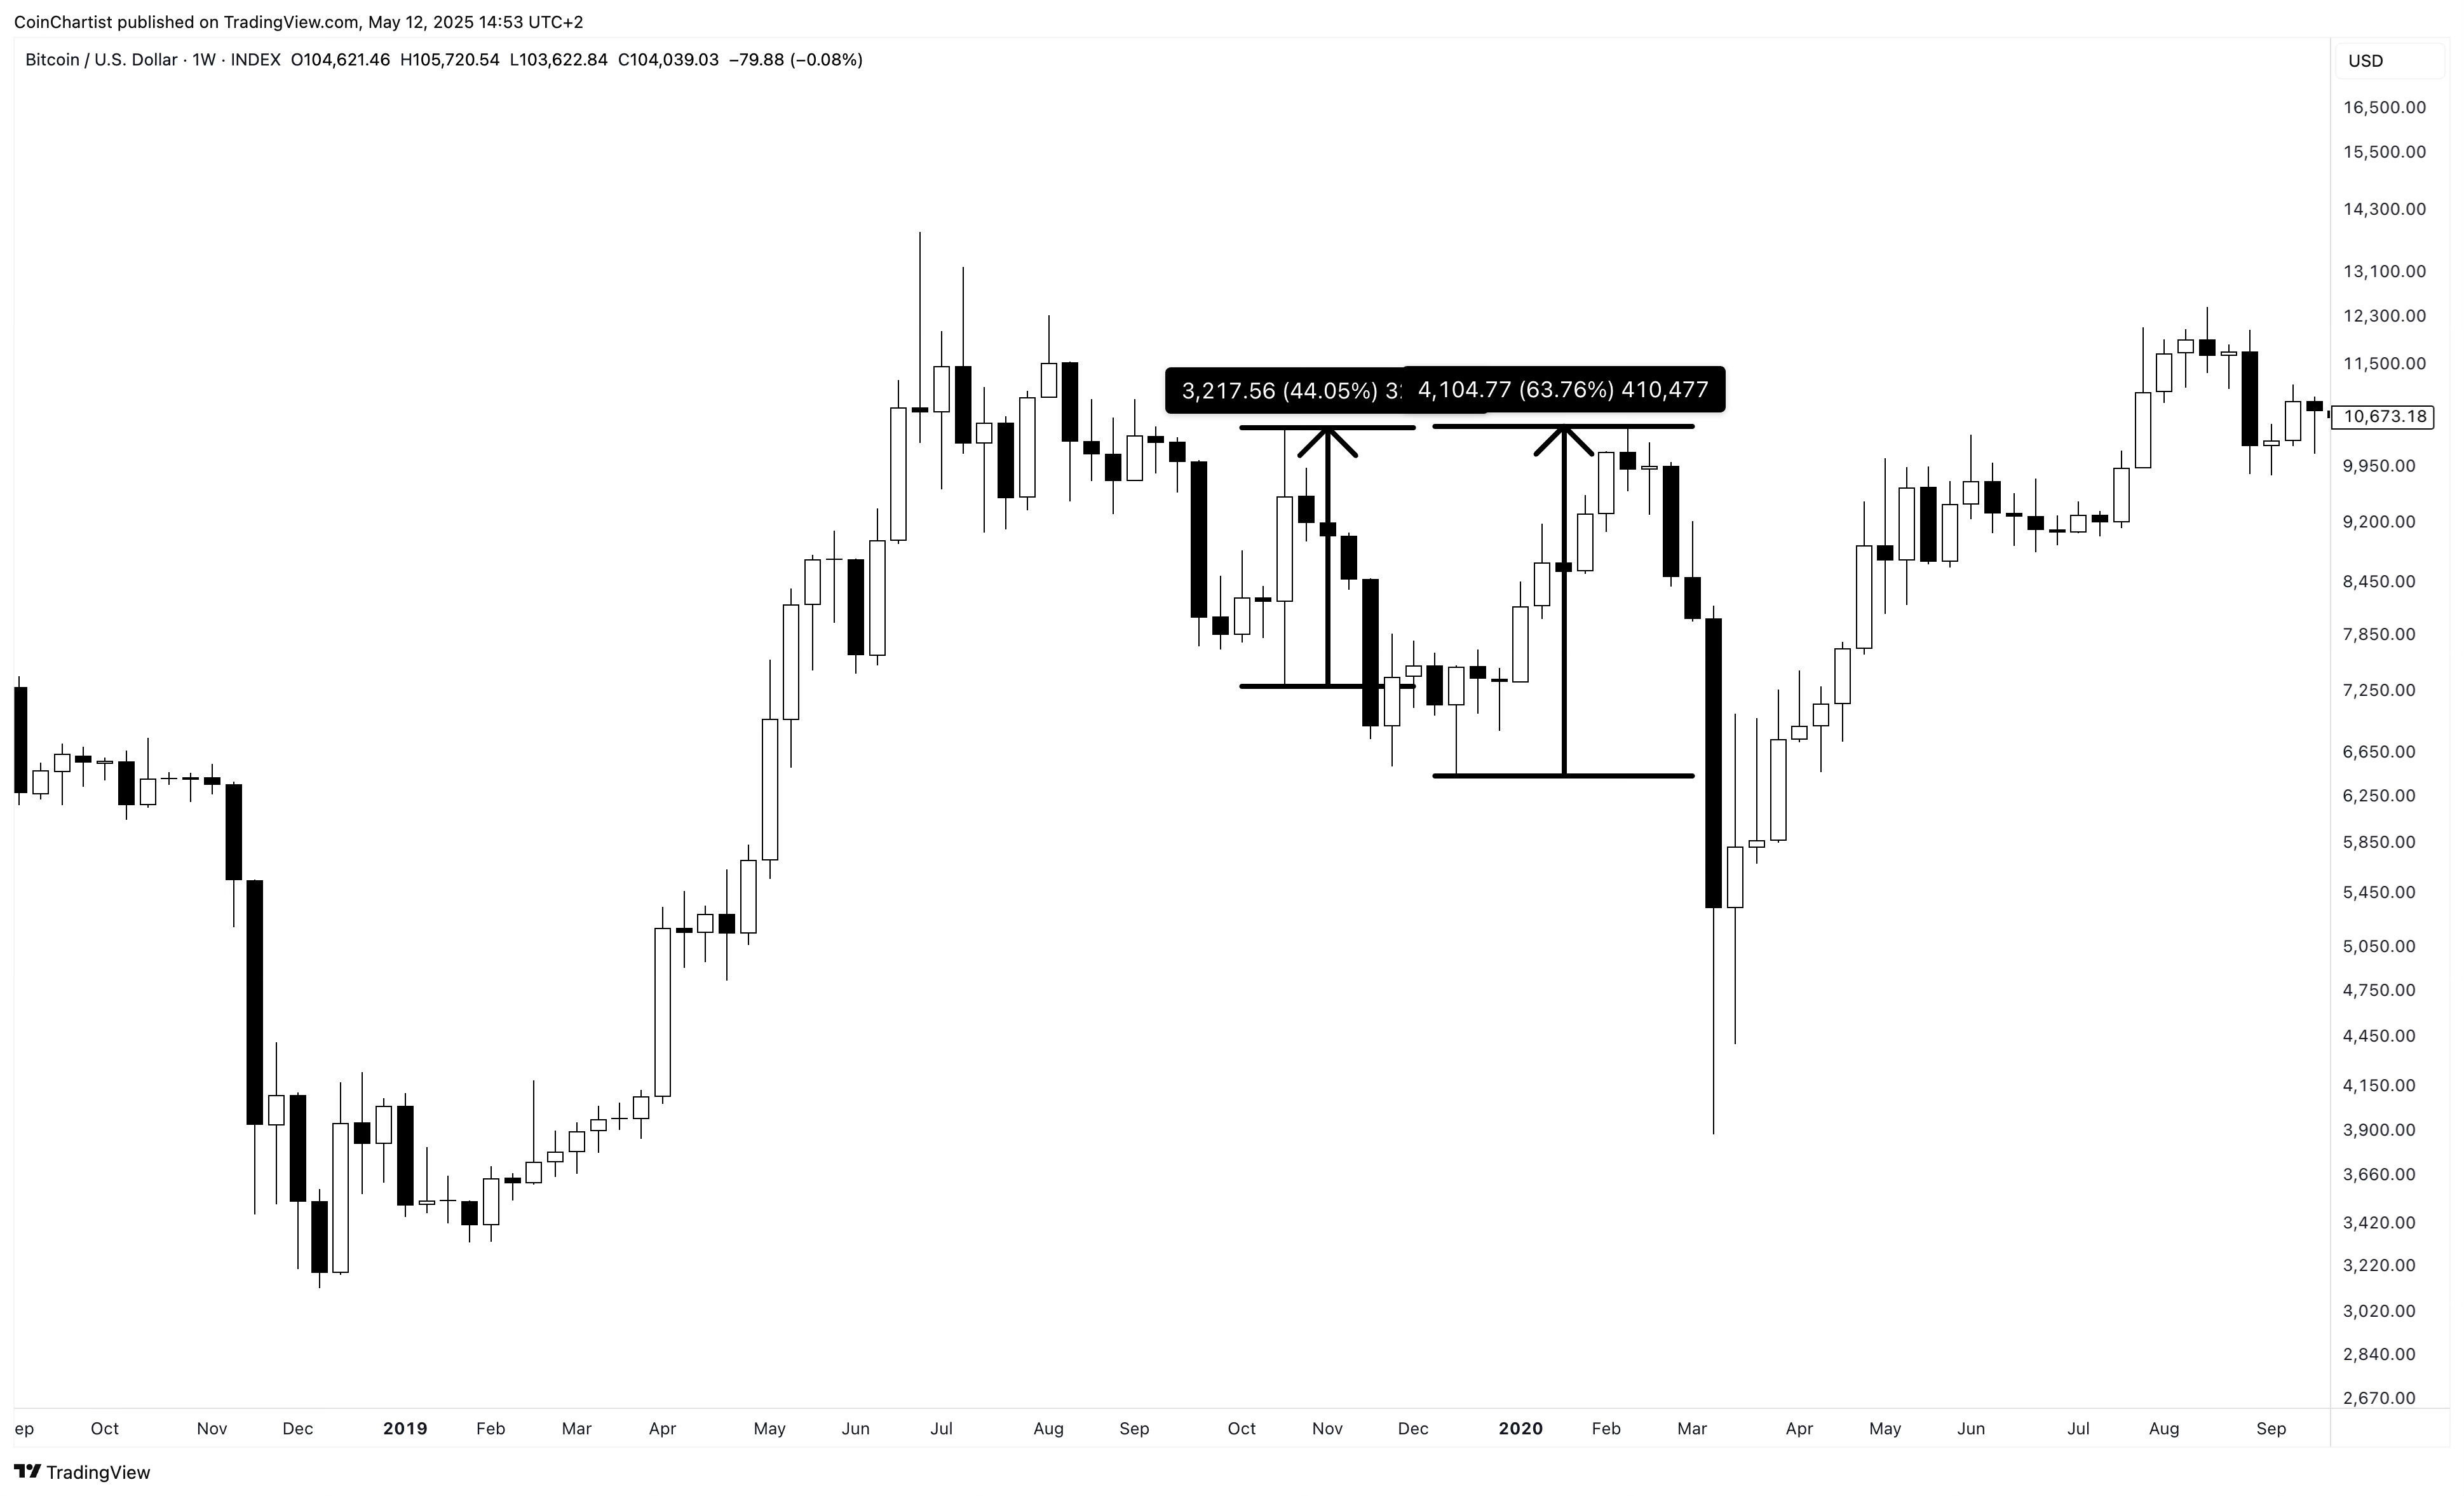
After 2019’s rally in Bitcoin. It immediately entered a short-term bearish trend. The first decent bounce resulted in a 44% rally in a single, one-week candle. At the end of 2019 into 2020, Bitcoin rallied another 63%. The COVID collapse happened immediately following this rally, taking Bitcoin to new local lows once again.
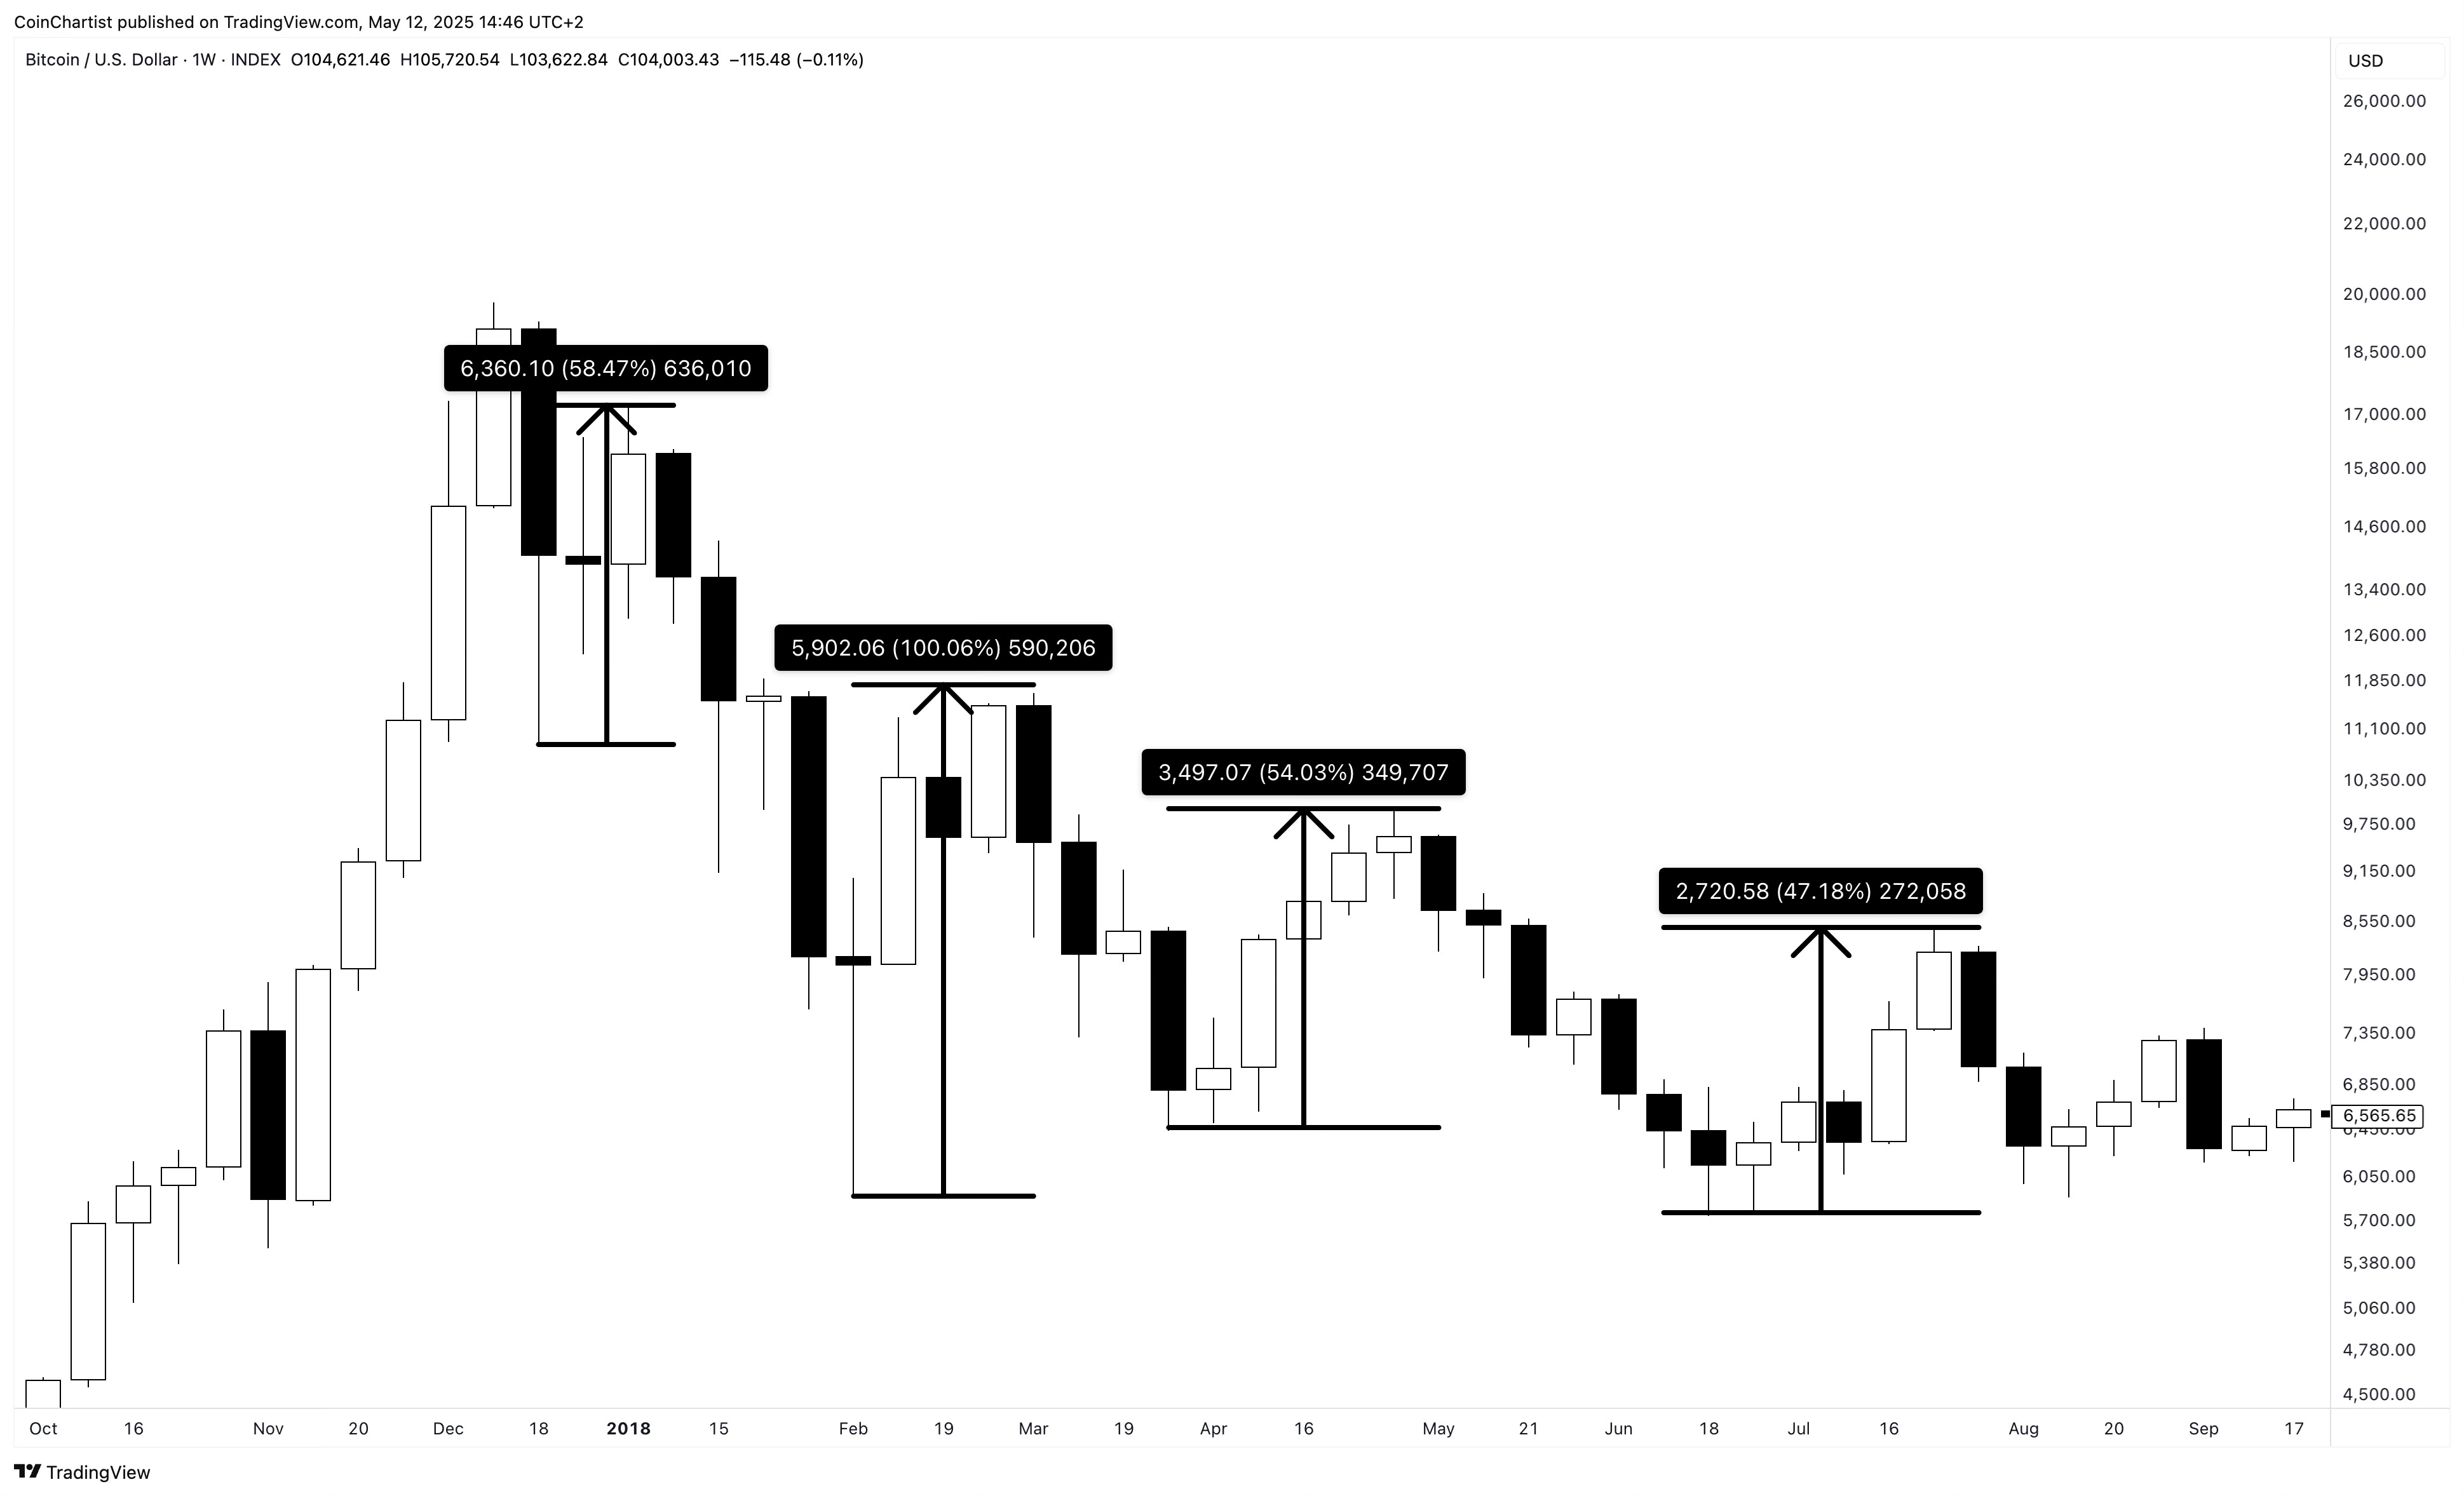
2018’s bear market was especially painful with several bear market rallies all leading to more downside in the following months. The first major bounce after the late 2017 peak, resulted in a 58% gain. From the second swing low to the next lower high, Bitcoin rallied 100%. The next two bear market bounces brought in 54% and 47% respectively. Ultimately, Bitcoin sank more than 50% from the bottom of each of these bounces.
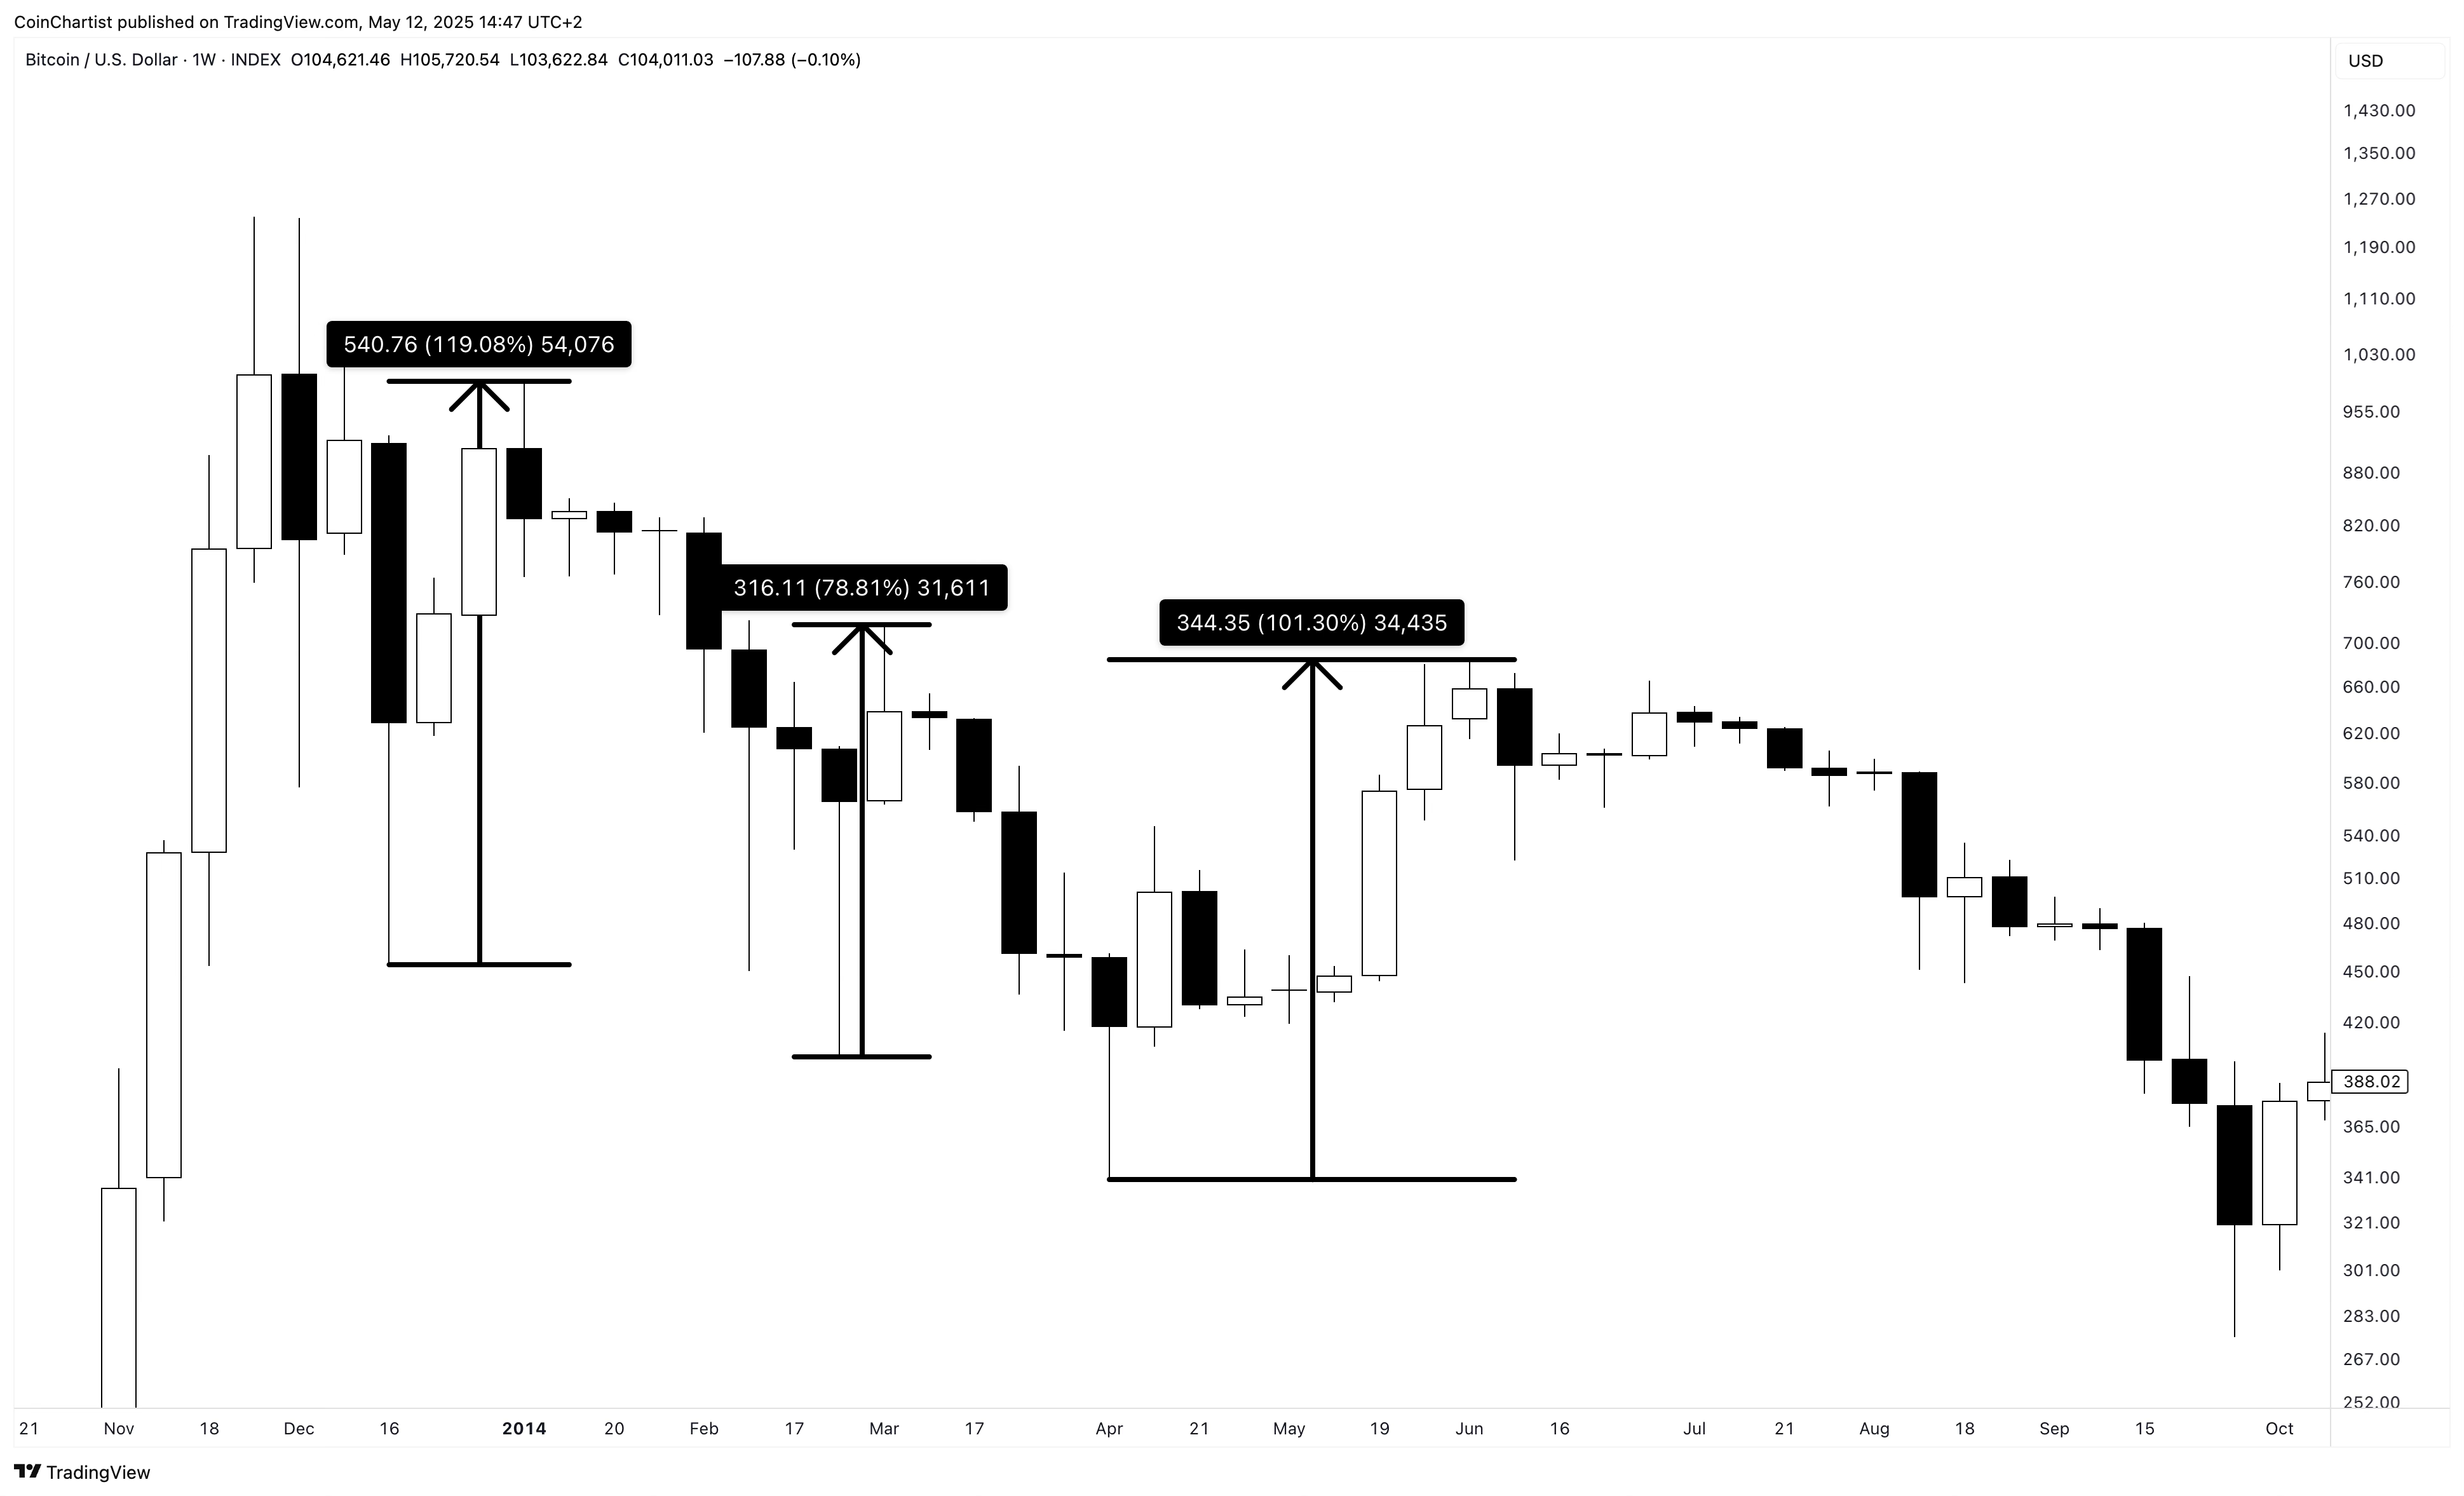
Dating back even further, Bitcoin’s 2013 bear market bounce took the top cryptocurrency 119% higher before making another local lower low. Bitcoin pumped 78% from there, before making yet another local lower low. From this low, Bitcoin once again rallied more than 100% before making the final bear market low.
Simply put, a strong bounce here doesn’t necessarily mean we are out of the woods. Which is why I prefer to wait for confirmation.
Coinbase on S&P500
While producing this newsletter, a few things came up that caught my attention. One of the more significant changes is the fact that Coinbase Global shares (COIN) will be added to the S&P 500.
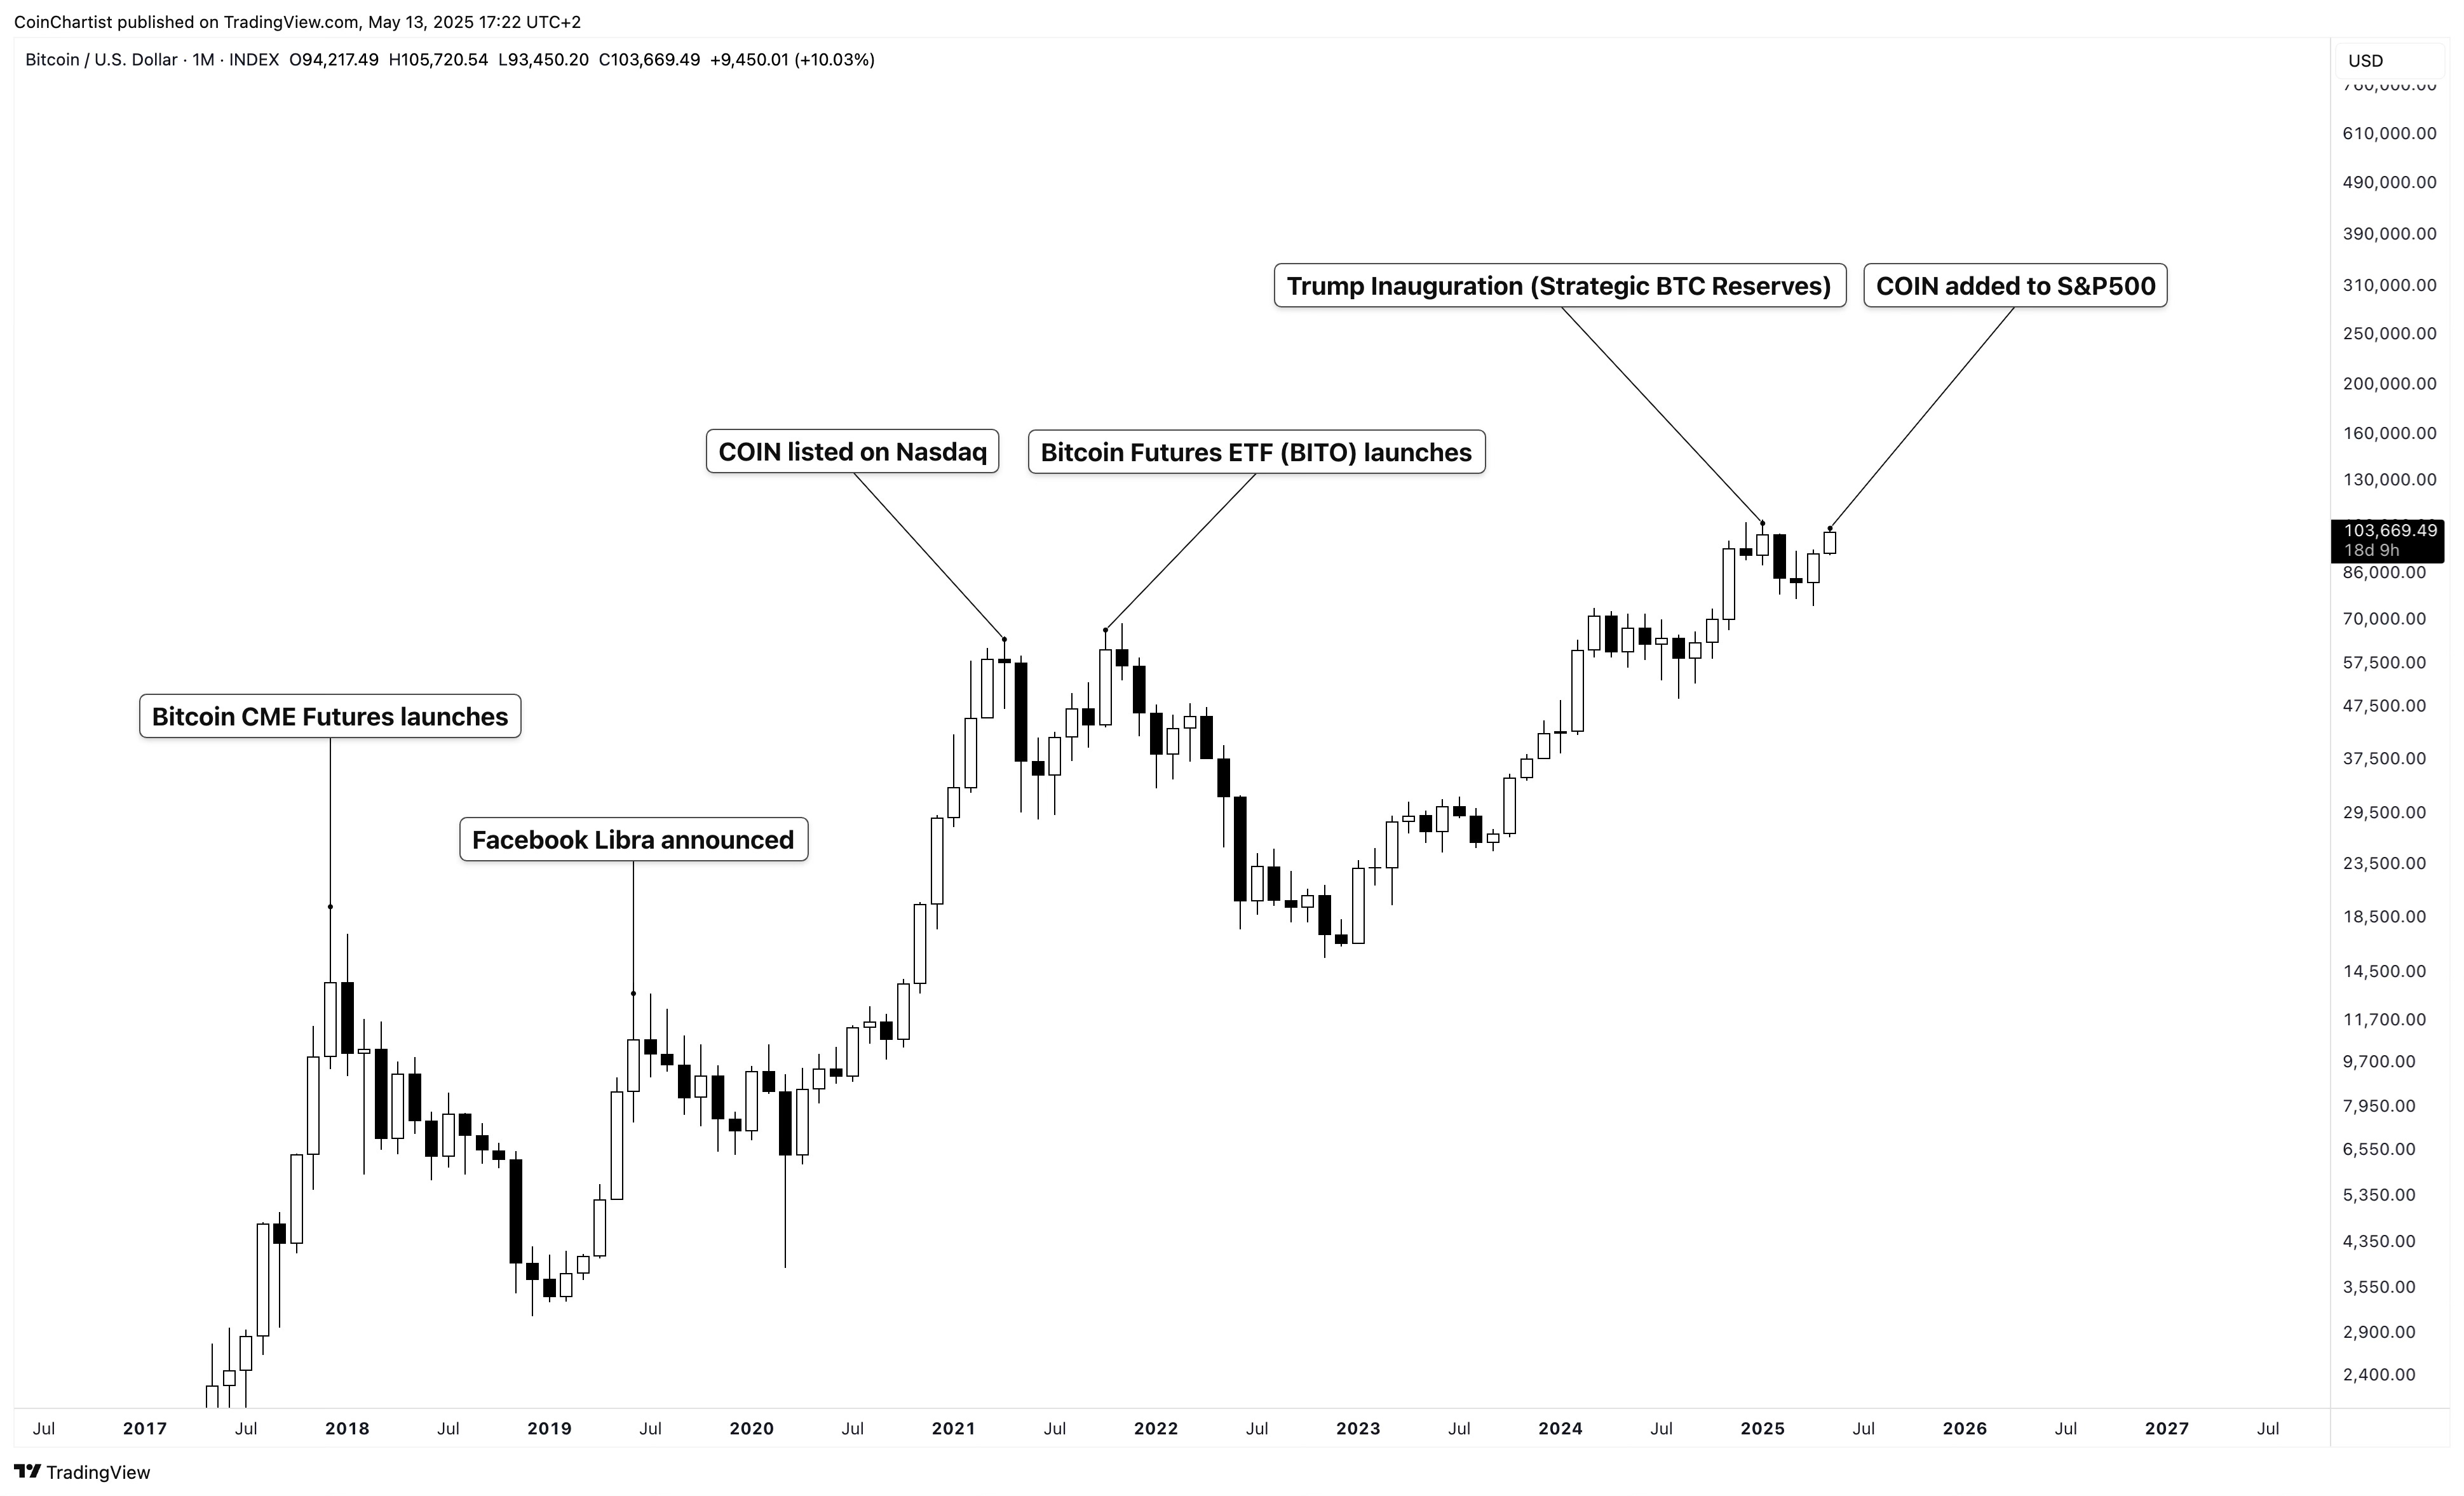
Hearing COIN is being added to the S&P 500 immediately reminded me of when COIN was listed on Nasdaq. This was the “new paradigm” moment of 2021’s market cycle which put in the first of the two tops that year. The second top was the launch of the first Bitcoin Futures ETF. In fact, big debuts or announcements often put in local or cyclical peaks. Even the 2017 peak happened just as Bitcoin CME Futures began trading for the first time. While this isn’t a technical signal, these positive news events are often associated with euphoric market sentiment and become “sell the news” events. To me, it is worth paying attention to and could be a sign that sellers step in and prevent Bitcoin from reaching a new ATH.
Bullish = Bearish
As I have stated for several issues now, one of the primary reasons I began leaning bearish was due to the fact that momentum was beginning to roll over on the monthly timeframe. Weekly and daily momentum has started to turn back up, which is pulling monthly momentum out of the gutter. Signals are still teetering on the bull/bear line, however, keeping up the confusion in the crypto market.
