

Priced in Gold
Is a weak Dollar making Bitcoin look more bullish, while Gold is telling the real story?

Disclaimer: The information provided in this Substack newsletter is for general informational purposes only and should not be considered as financial advice. Investing involves risk, and past performance is not indicative of future results. Please conduct your own research or consult a financial advisor before making any investment decisions. The newsletter disclaims any liability for losses or damages arising from the use of this information.
Priced in Gold overview:
An updated look at the quarterly candlesticks for Bitcoin versus Gold, BTCUSD, altcoins, Gold, and the DXY Dollar Currency Index
A deep dive into Bitcoin versus Gold using the BTCUSD/XAUUSD trading pair
Is Gold warning of a crypto bear market around the corner?
Bitcoin is showing the lowest volatility readings in history – is this the calm before the storm?
Technical target confluence warns of a potential 50% drop in BTCUSD if momentum continues to roll over
A zoomed out look at cyclical timing of BTC tops and bottoms against Gold and USD
Gold is overextended and the Dollar looks ready to bounce – how does this impact crypto?
This week, Bitcoin dropped by roughly 5%. The initial crash caused over $1.5 billion in crypto market liquidations, highlighting just how bullish sentiment is surrounding BTC. Altcoins, which had been looking strong despite Bitcoin’s overall weakness, took an even larger hit to the tune of 10 to 25% in some cases. While all of this is typically par for the course in the high-volatility crypto market. the timing of this collapse isn’t ideal for higher timeframe technical signals.
If Bitcoin doesn’t recover sharply by the end of the week, or first thing next week, the monthly – and more importantly – the quarterly, will close with some ugly-looking signals. Altcoin charts aren’t quite as in danger, but a falling Bitcoin means that alts won’t perform, even if the altcoin chart is hinting at potential upside.
What’s potentially worse for Bitcoin, is Gold’s continued performance. When Gold is rising, it is typically a sign something is wrong with the economy or financial system, and a recession or collapse is on the horizon. With the dollar so weak, it also may be time to start addressing the topic of pricing certain assets against Gold: the former monetary Gold standard. If that’s the case, BTC and altcoins could be in even more of a dangerous position currently.
In fact, the Gold versus BTC chart could be suggesting that Bitcoin is already in a bear market, and has been since the January “top” I had been calling attention to. And it isn’t just Gold— even pricing Bitcoin against the Euro, for example, also shows a distinct lack of a new all-time high in 2025 after January.
Could January have actually been the “top” in Bitcoin, and what we’ve experienced recently has been Dollar weakness instead? And what happens if the Dollar starts to strengthen? Finally, with Gold smashing all expectations, but starting to get overheated itself – will we finally see a peak in the precious metal? All of these important intermarket factors are explored in this issue.
Critical Quarterly Close
To begin this issue, we are looking at updated quarterly Japanese candlesticks in Bitcoin versus USD and Gold, TOTAL3 (altcoins) versus USD and Gold. We’ll also separately examine Gold itself on the XAUUSD pair and the DXY Dollar Currency Index.
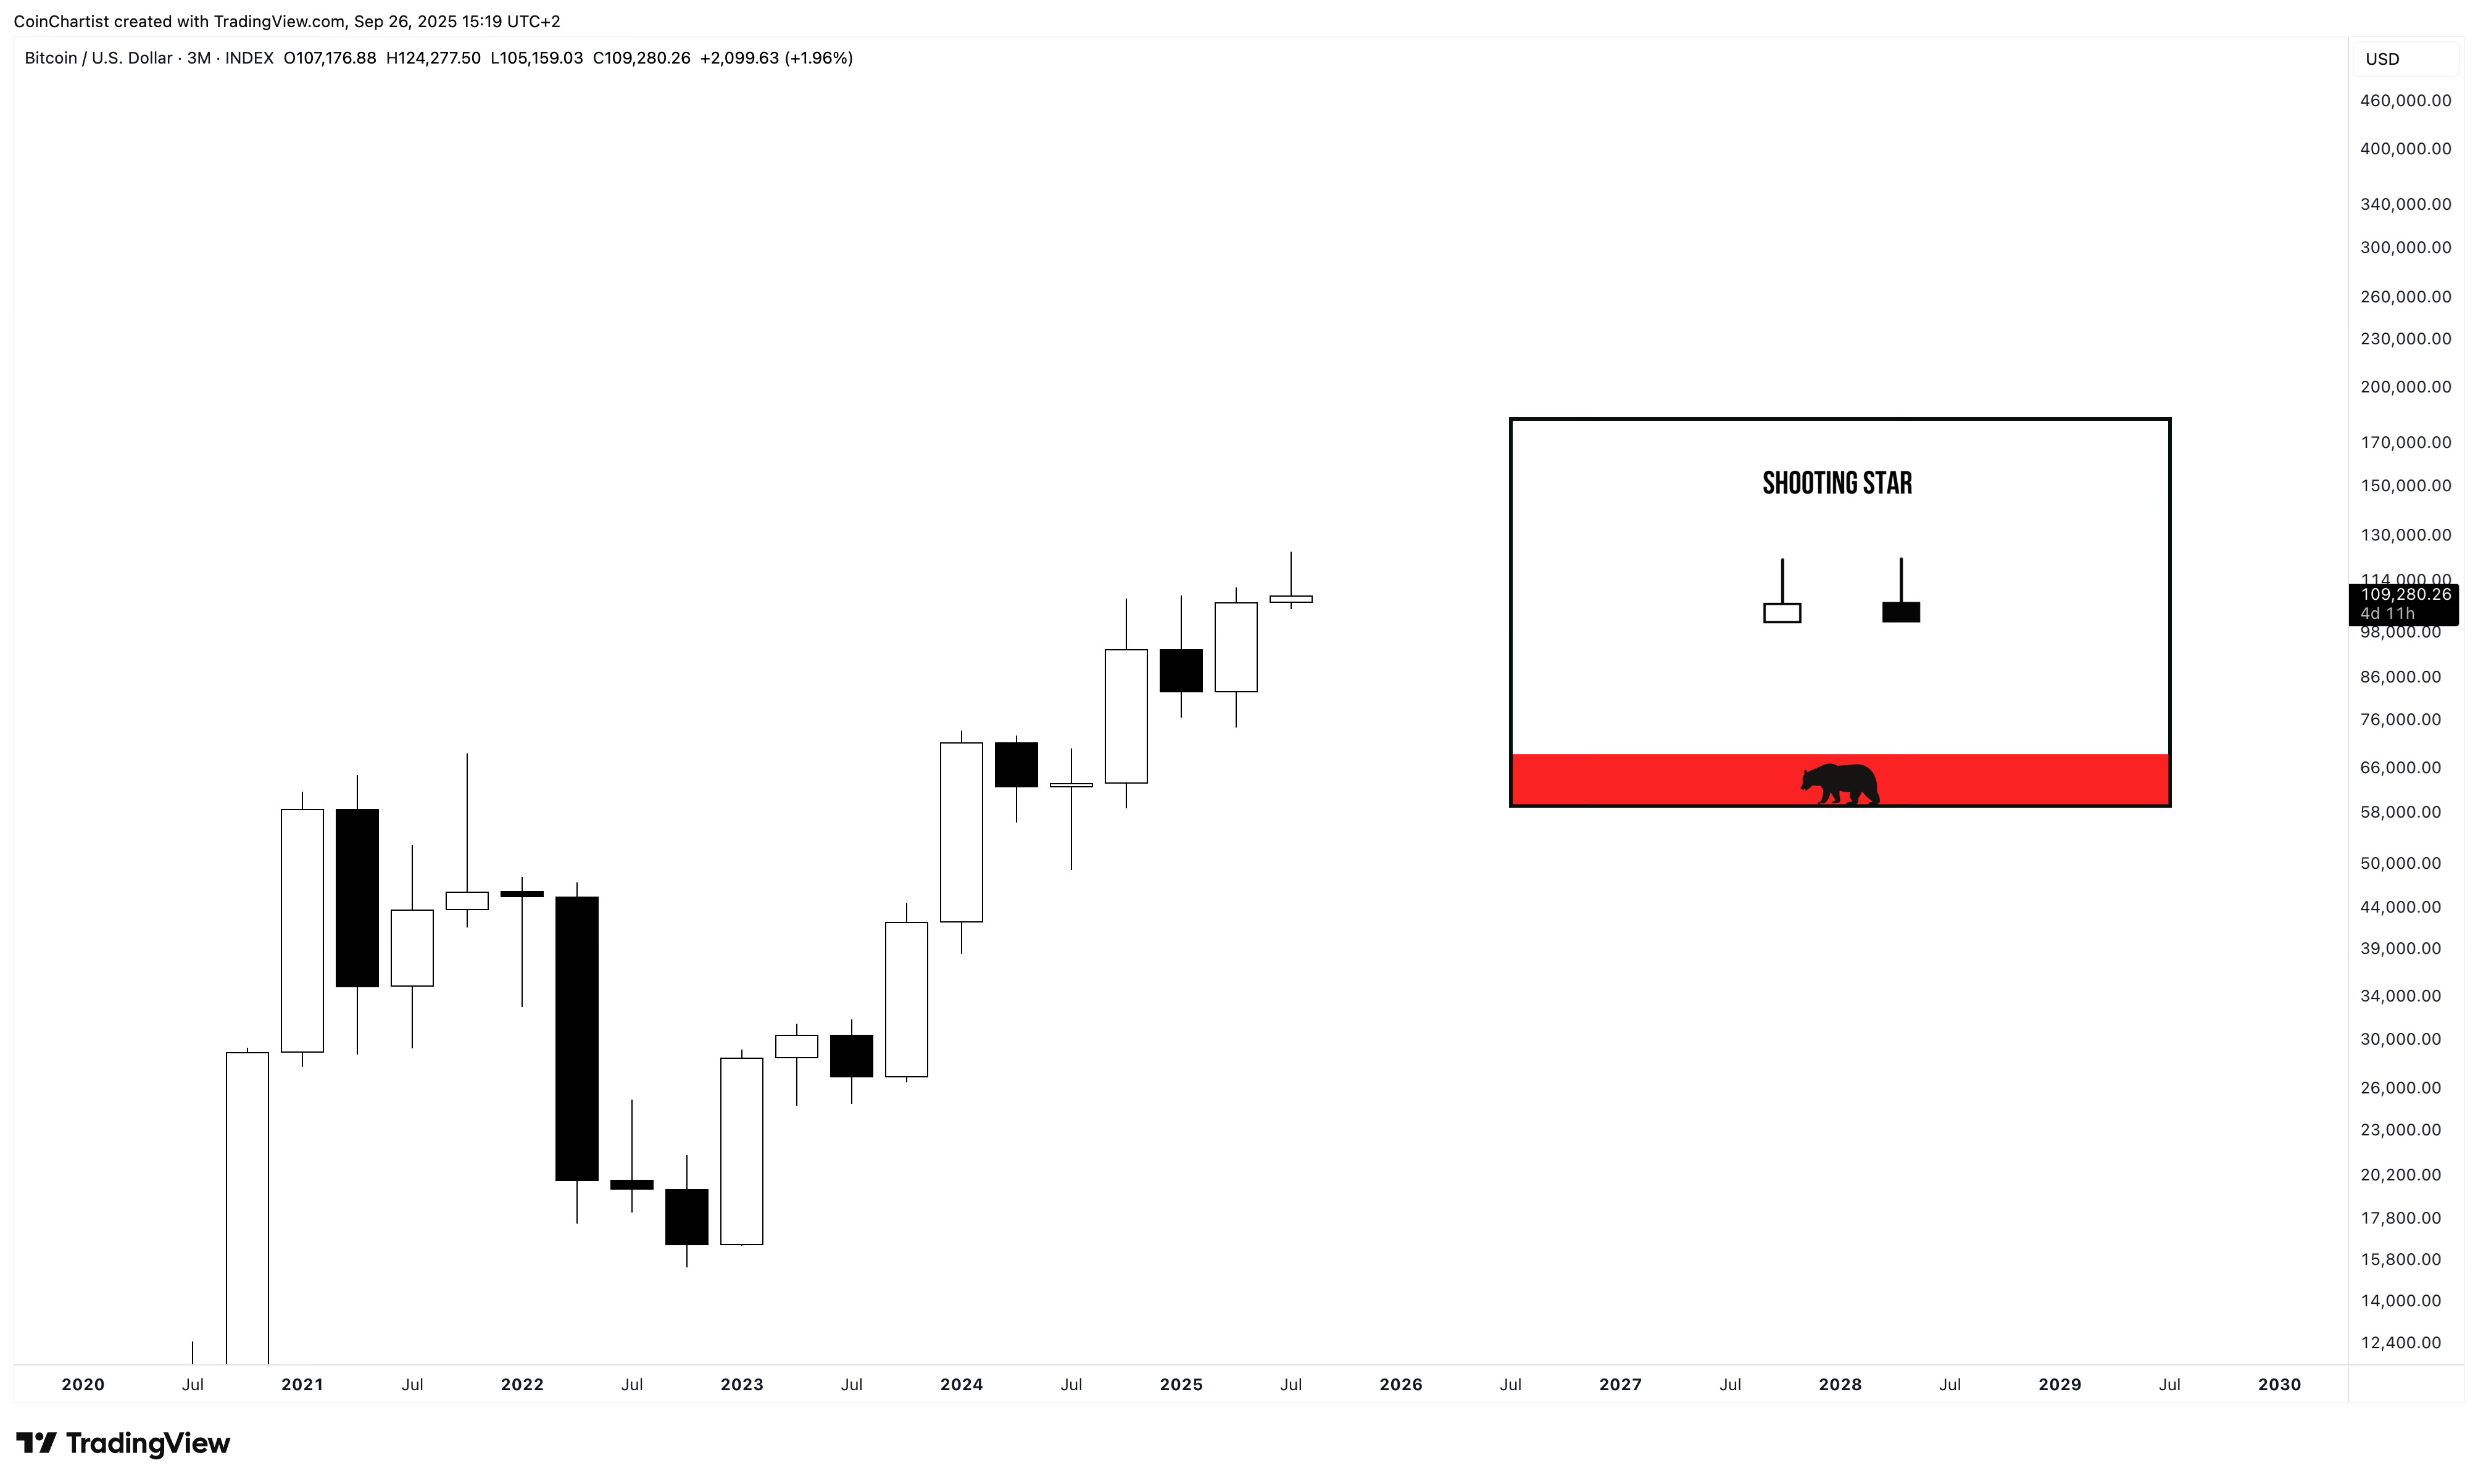
Bitcoin priced in USD is showing what is potentially a Shooting Star candle. If price drops a little further by the quarterly close, it could end up a Gravestone Doji, which would be even worse of a signal. A Shooting Star candle suggests that price has found supply and sellers stepped in to sell the candlestick down. These are more often than not a bearish reversal signal.
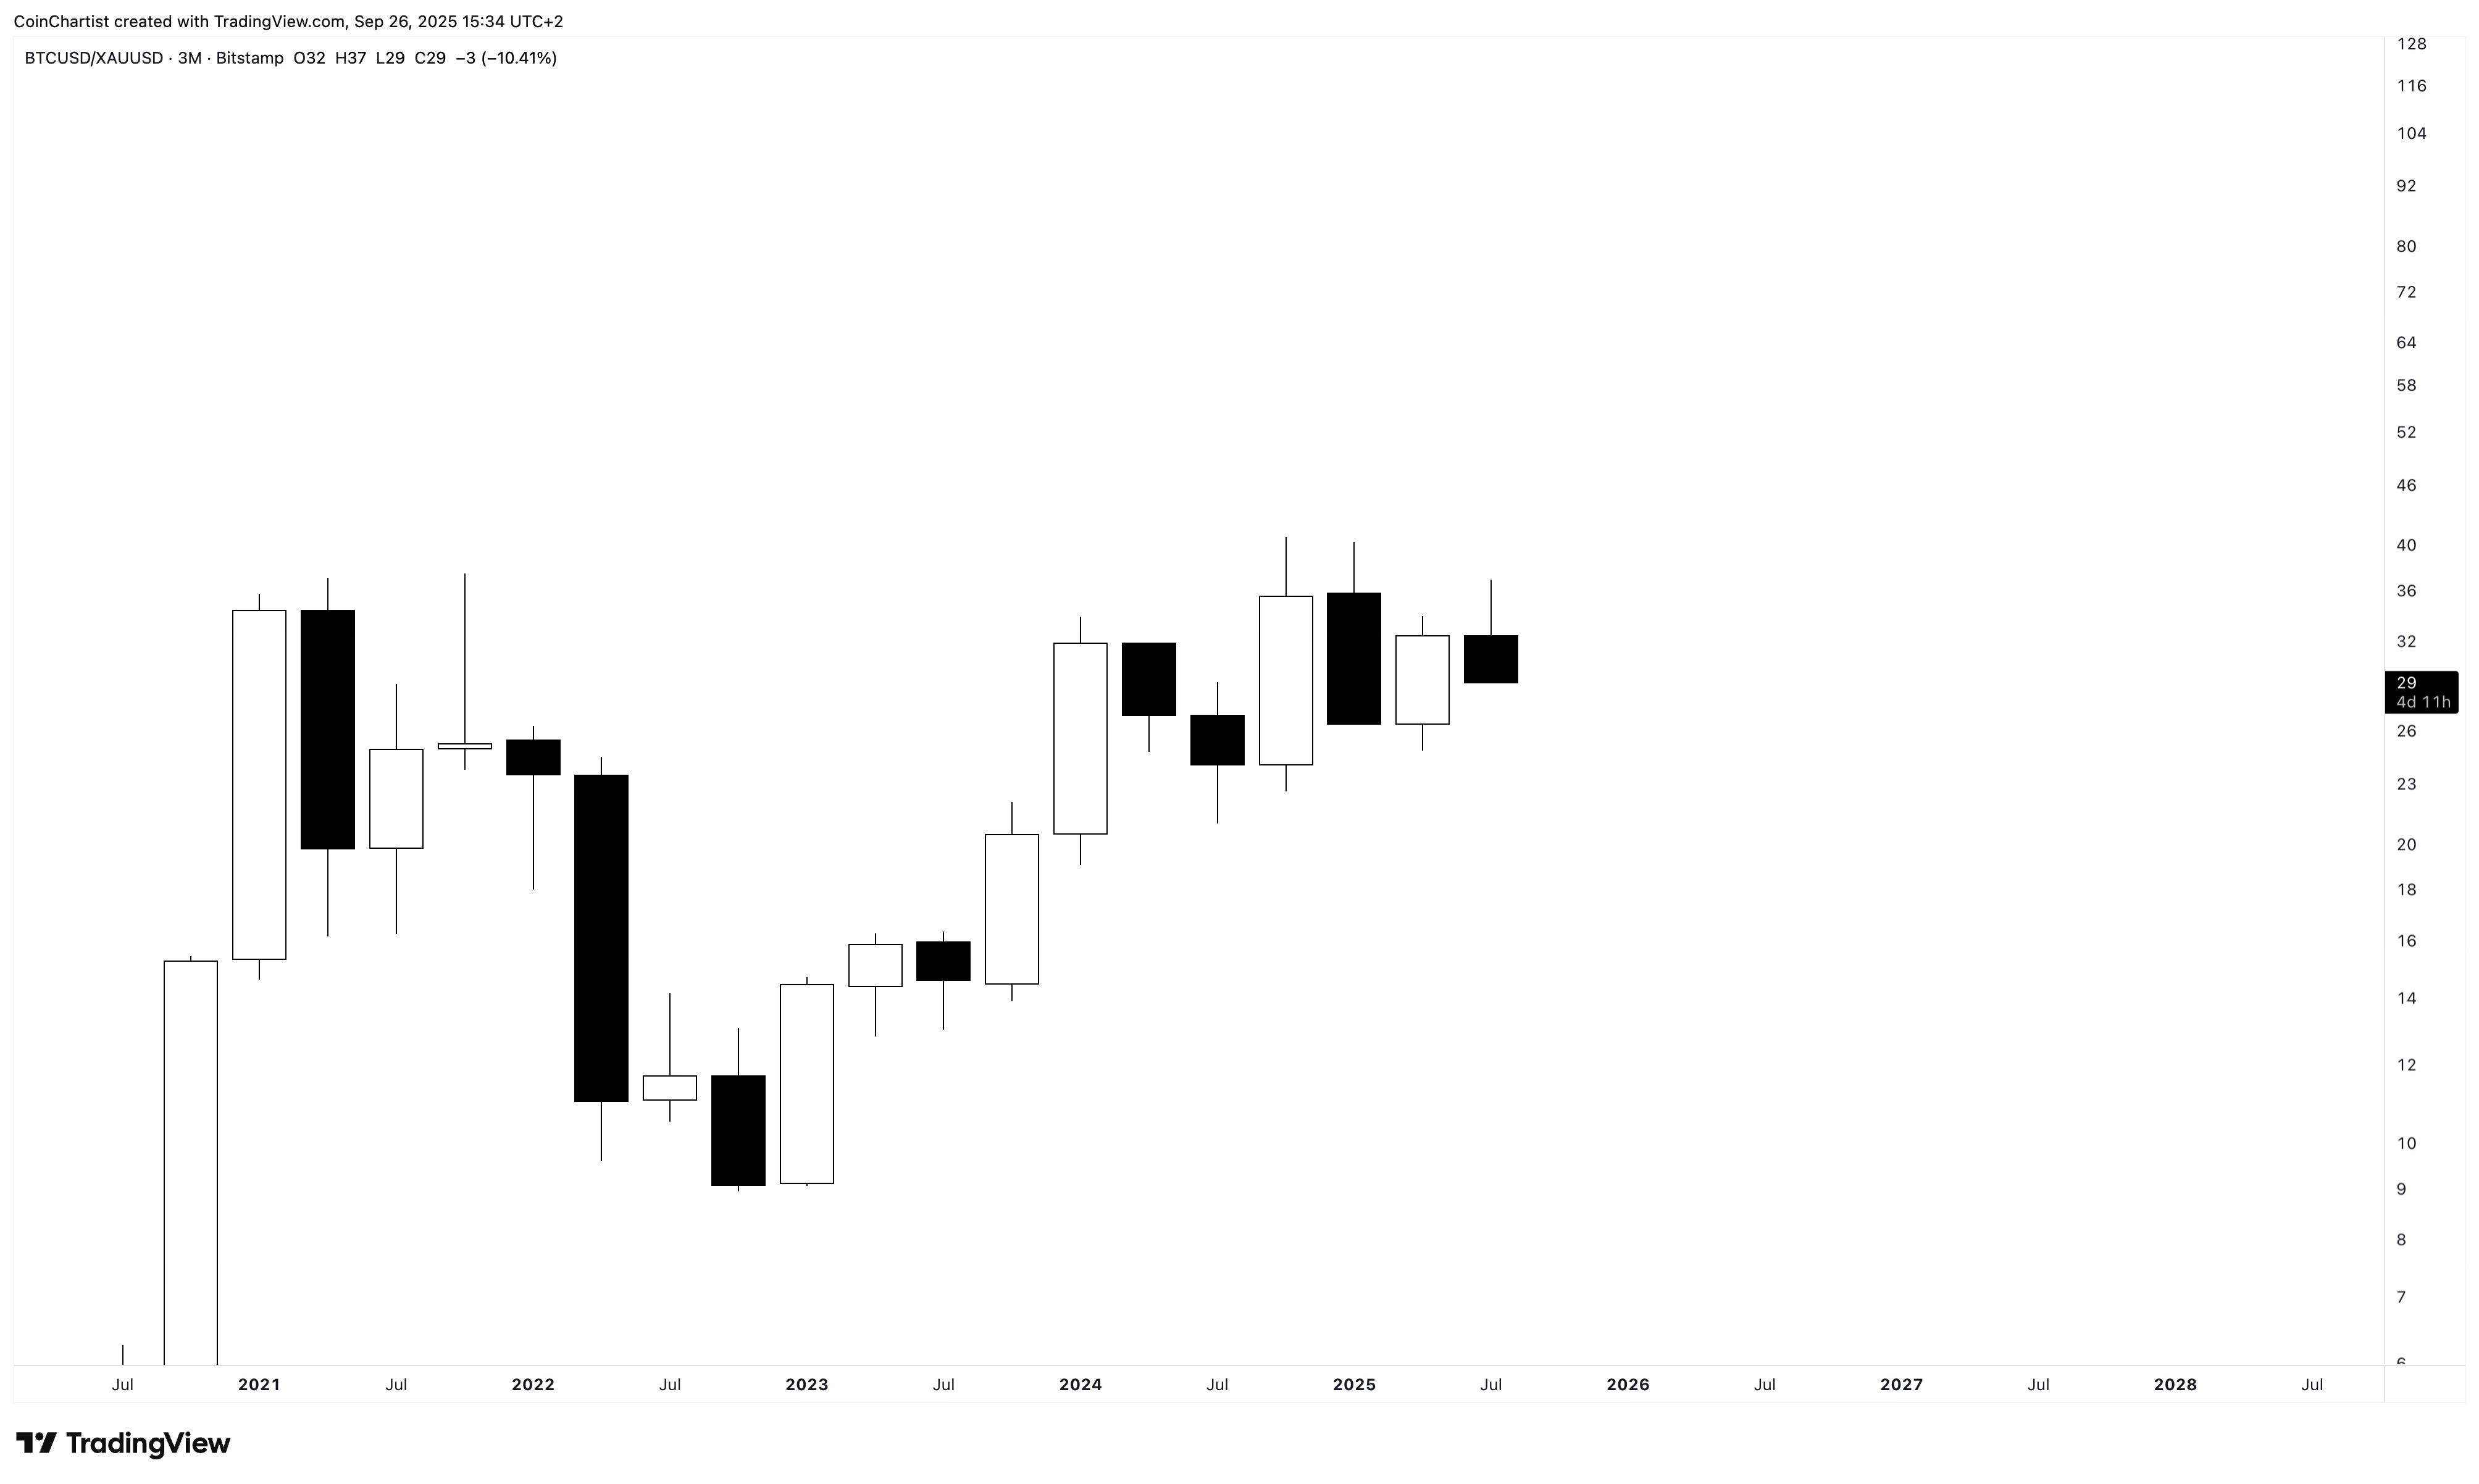
The Bitcoin priced in Gold chart is very different, showing a black candlestick with a shaved bottom. This could possibly be a Shooting Star as well, although the wick should be roughly two thirds of the overall candle, while the real body represents roughly one third. The real body is a little large here, but the fact Bitcoin reached resistance in Gold and failed to make another higher high is potentially a negative sign for BTC.
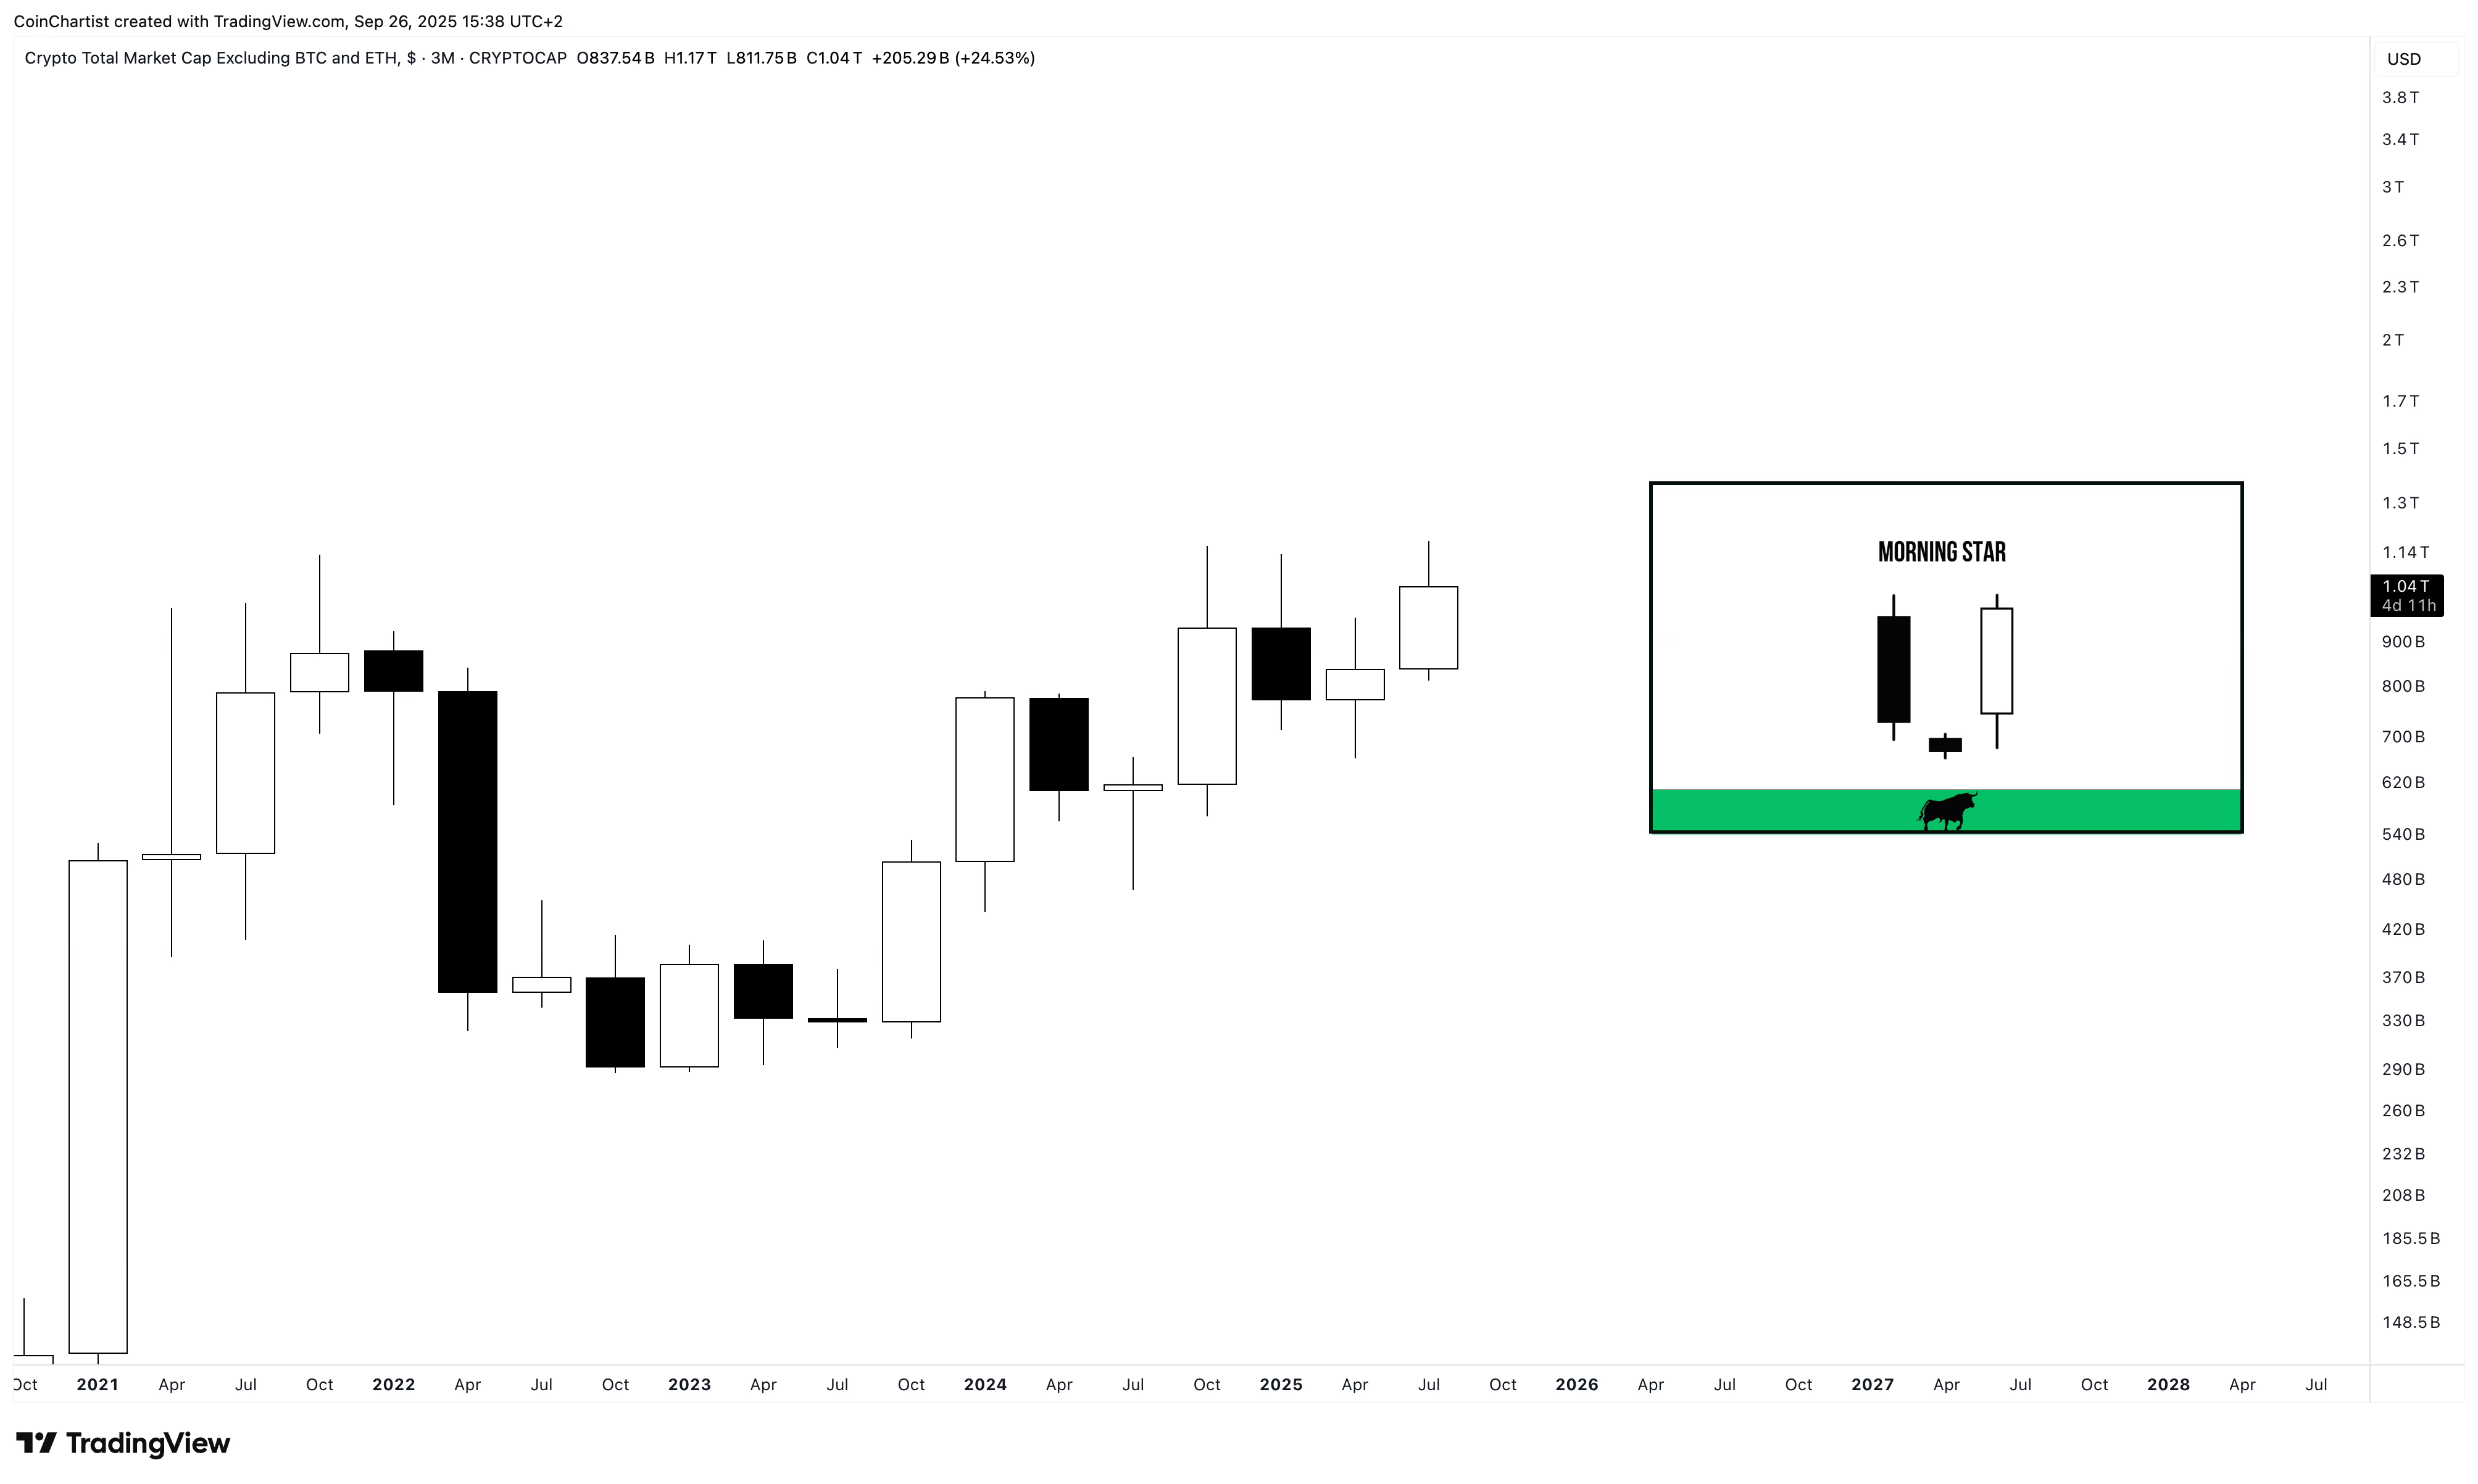
Here is where the debate on if we should be pricing assets in USD or Gold becomes more interesting. This is TOTAL3 representing altcoins, and we have what is a bullish Morning Star pattern on the quarterly, with a large white up candlestick. This quarter’s real body is also above all previous quarterly candle closes, which would typically be a bullish signal.
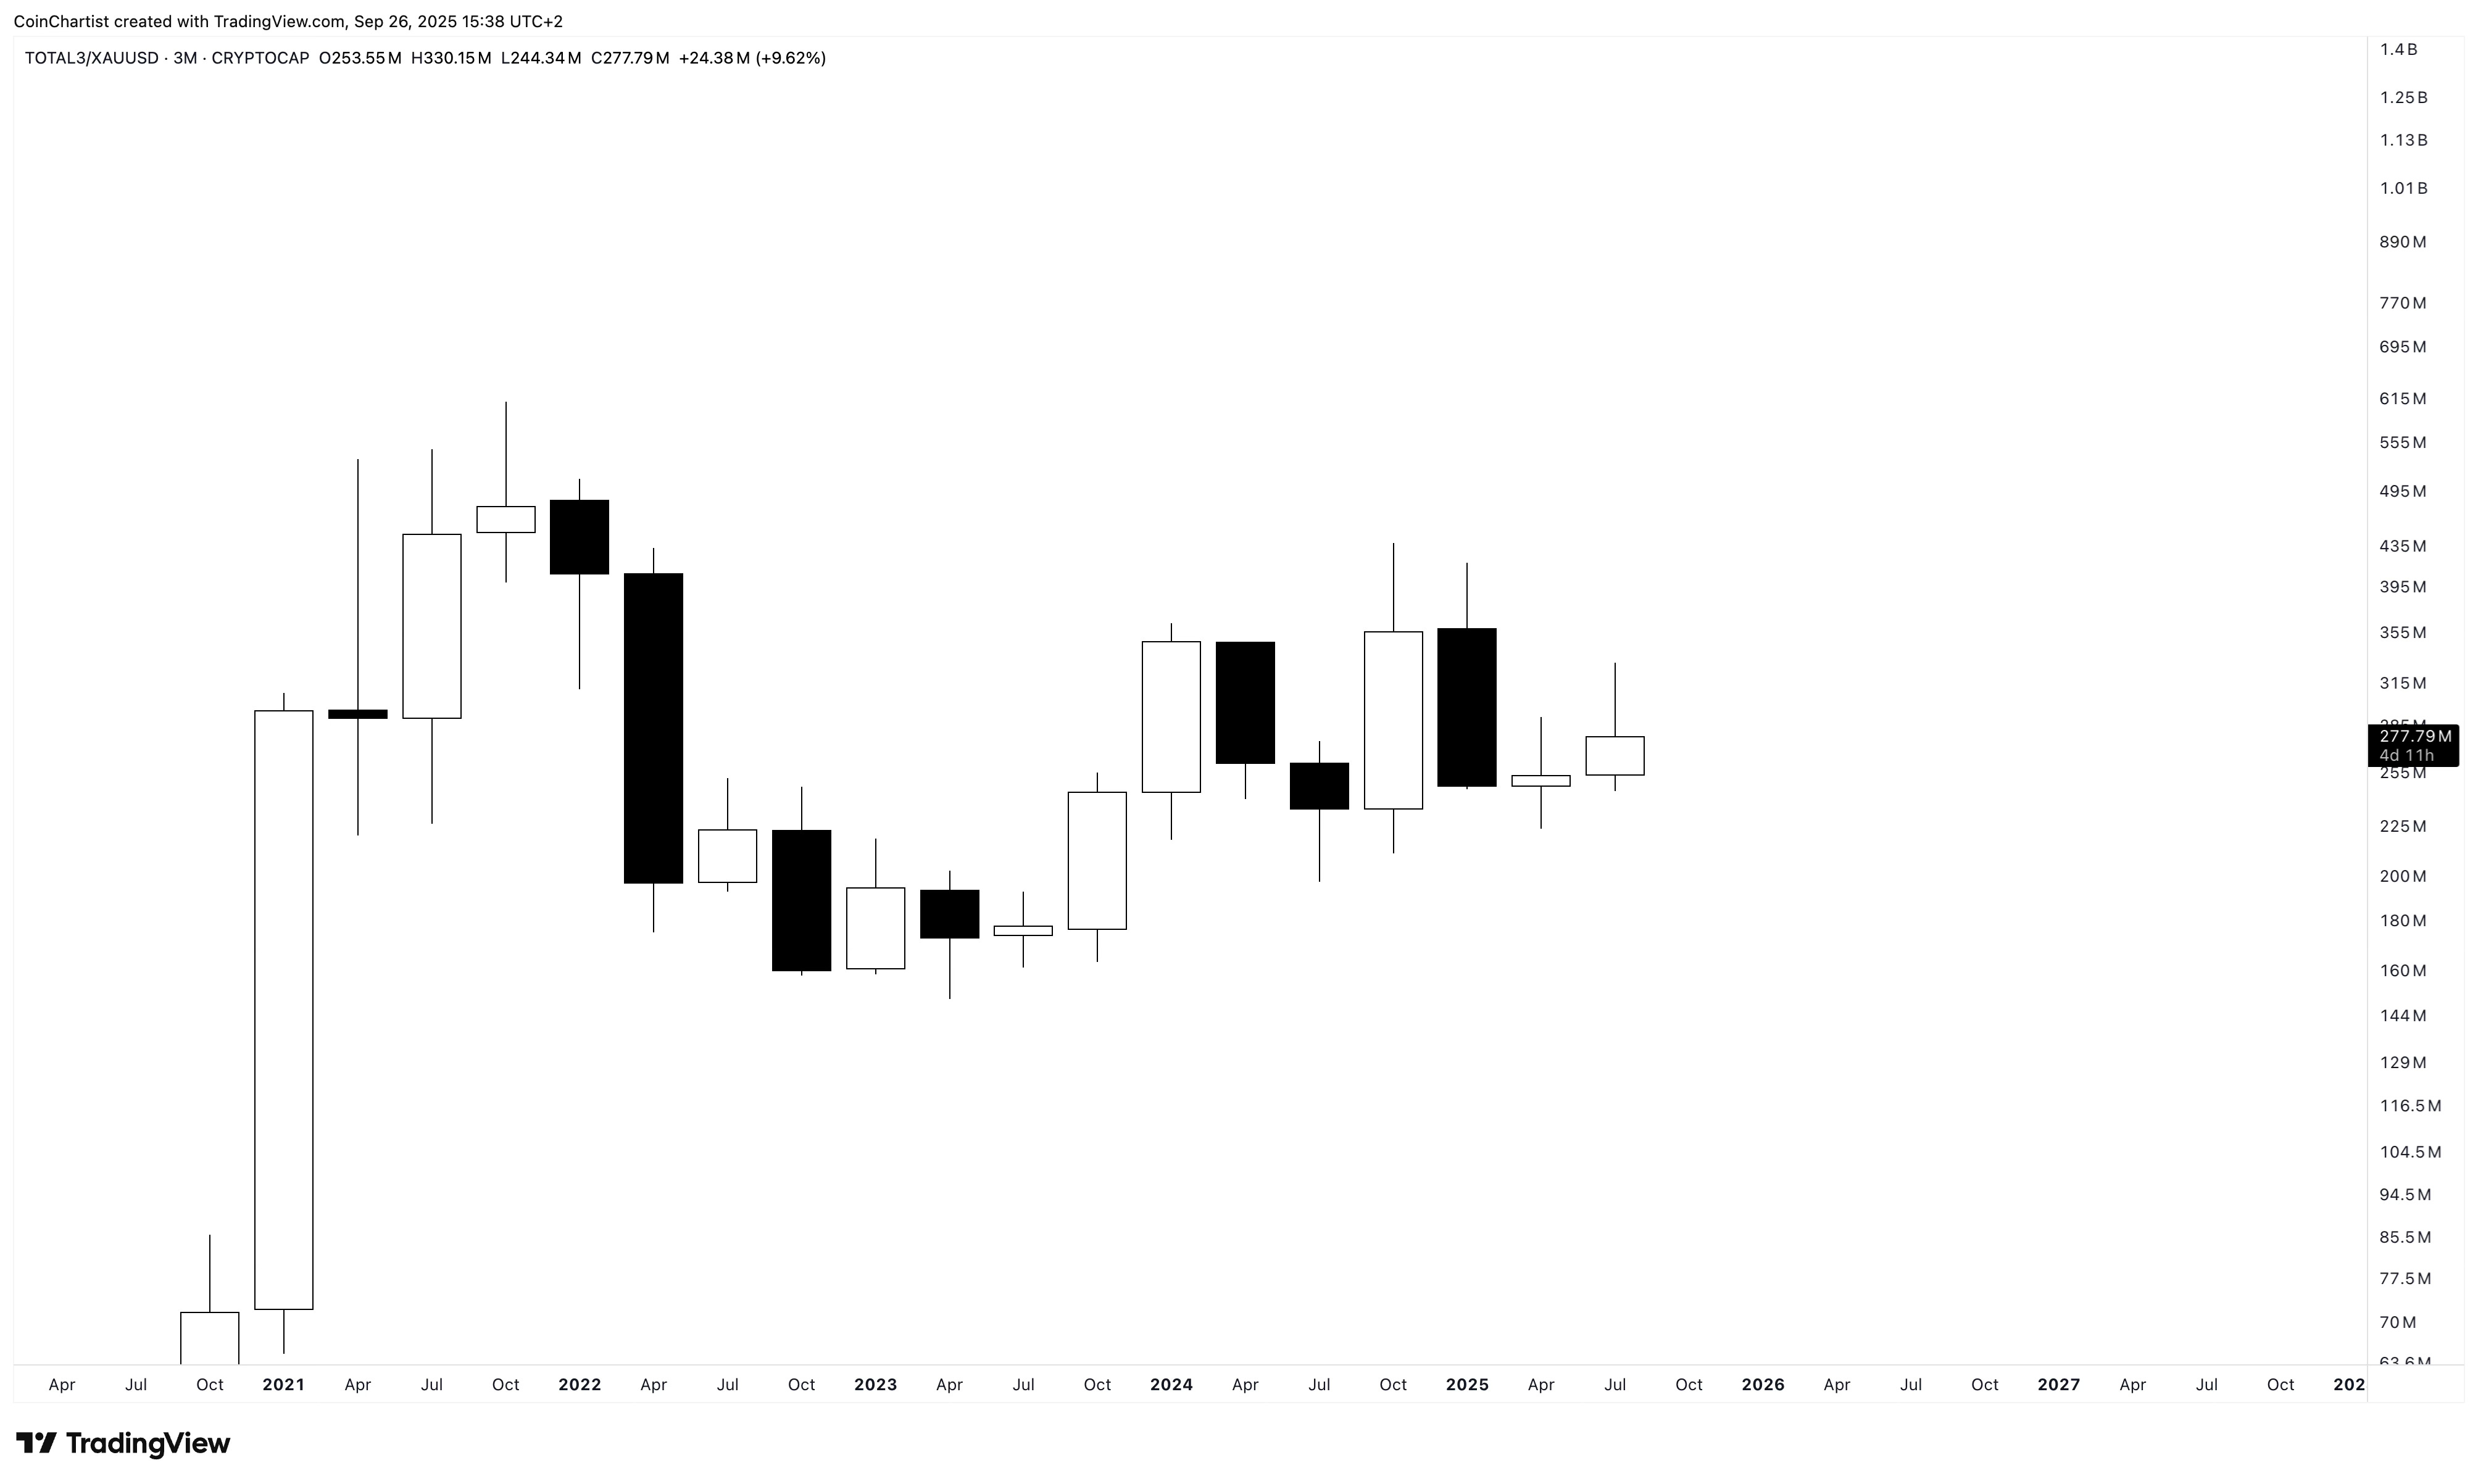
Meanwhile, TOTAL3 (altcoins) priced in Gold, shows a Morning Star pattern that’s currently below the buy trigger, suggesting the pattern is potentially failing to confirm. The buy trigger is hit when the white up candlestick rises above the 50% mark on the down black candle. The quarterly candlestick on this pair is also a Shooting Star, so there are a few bearish signals to speak of.
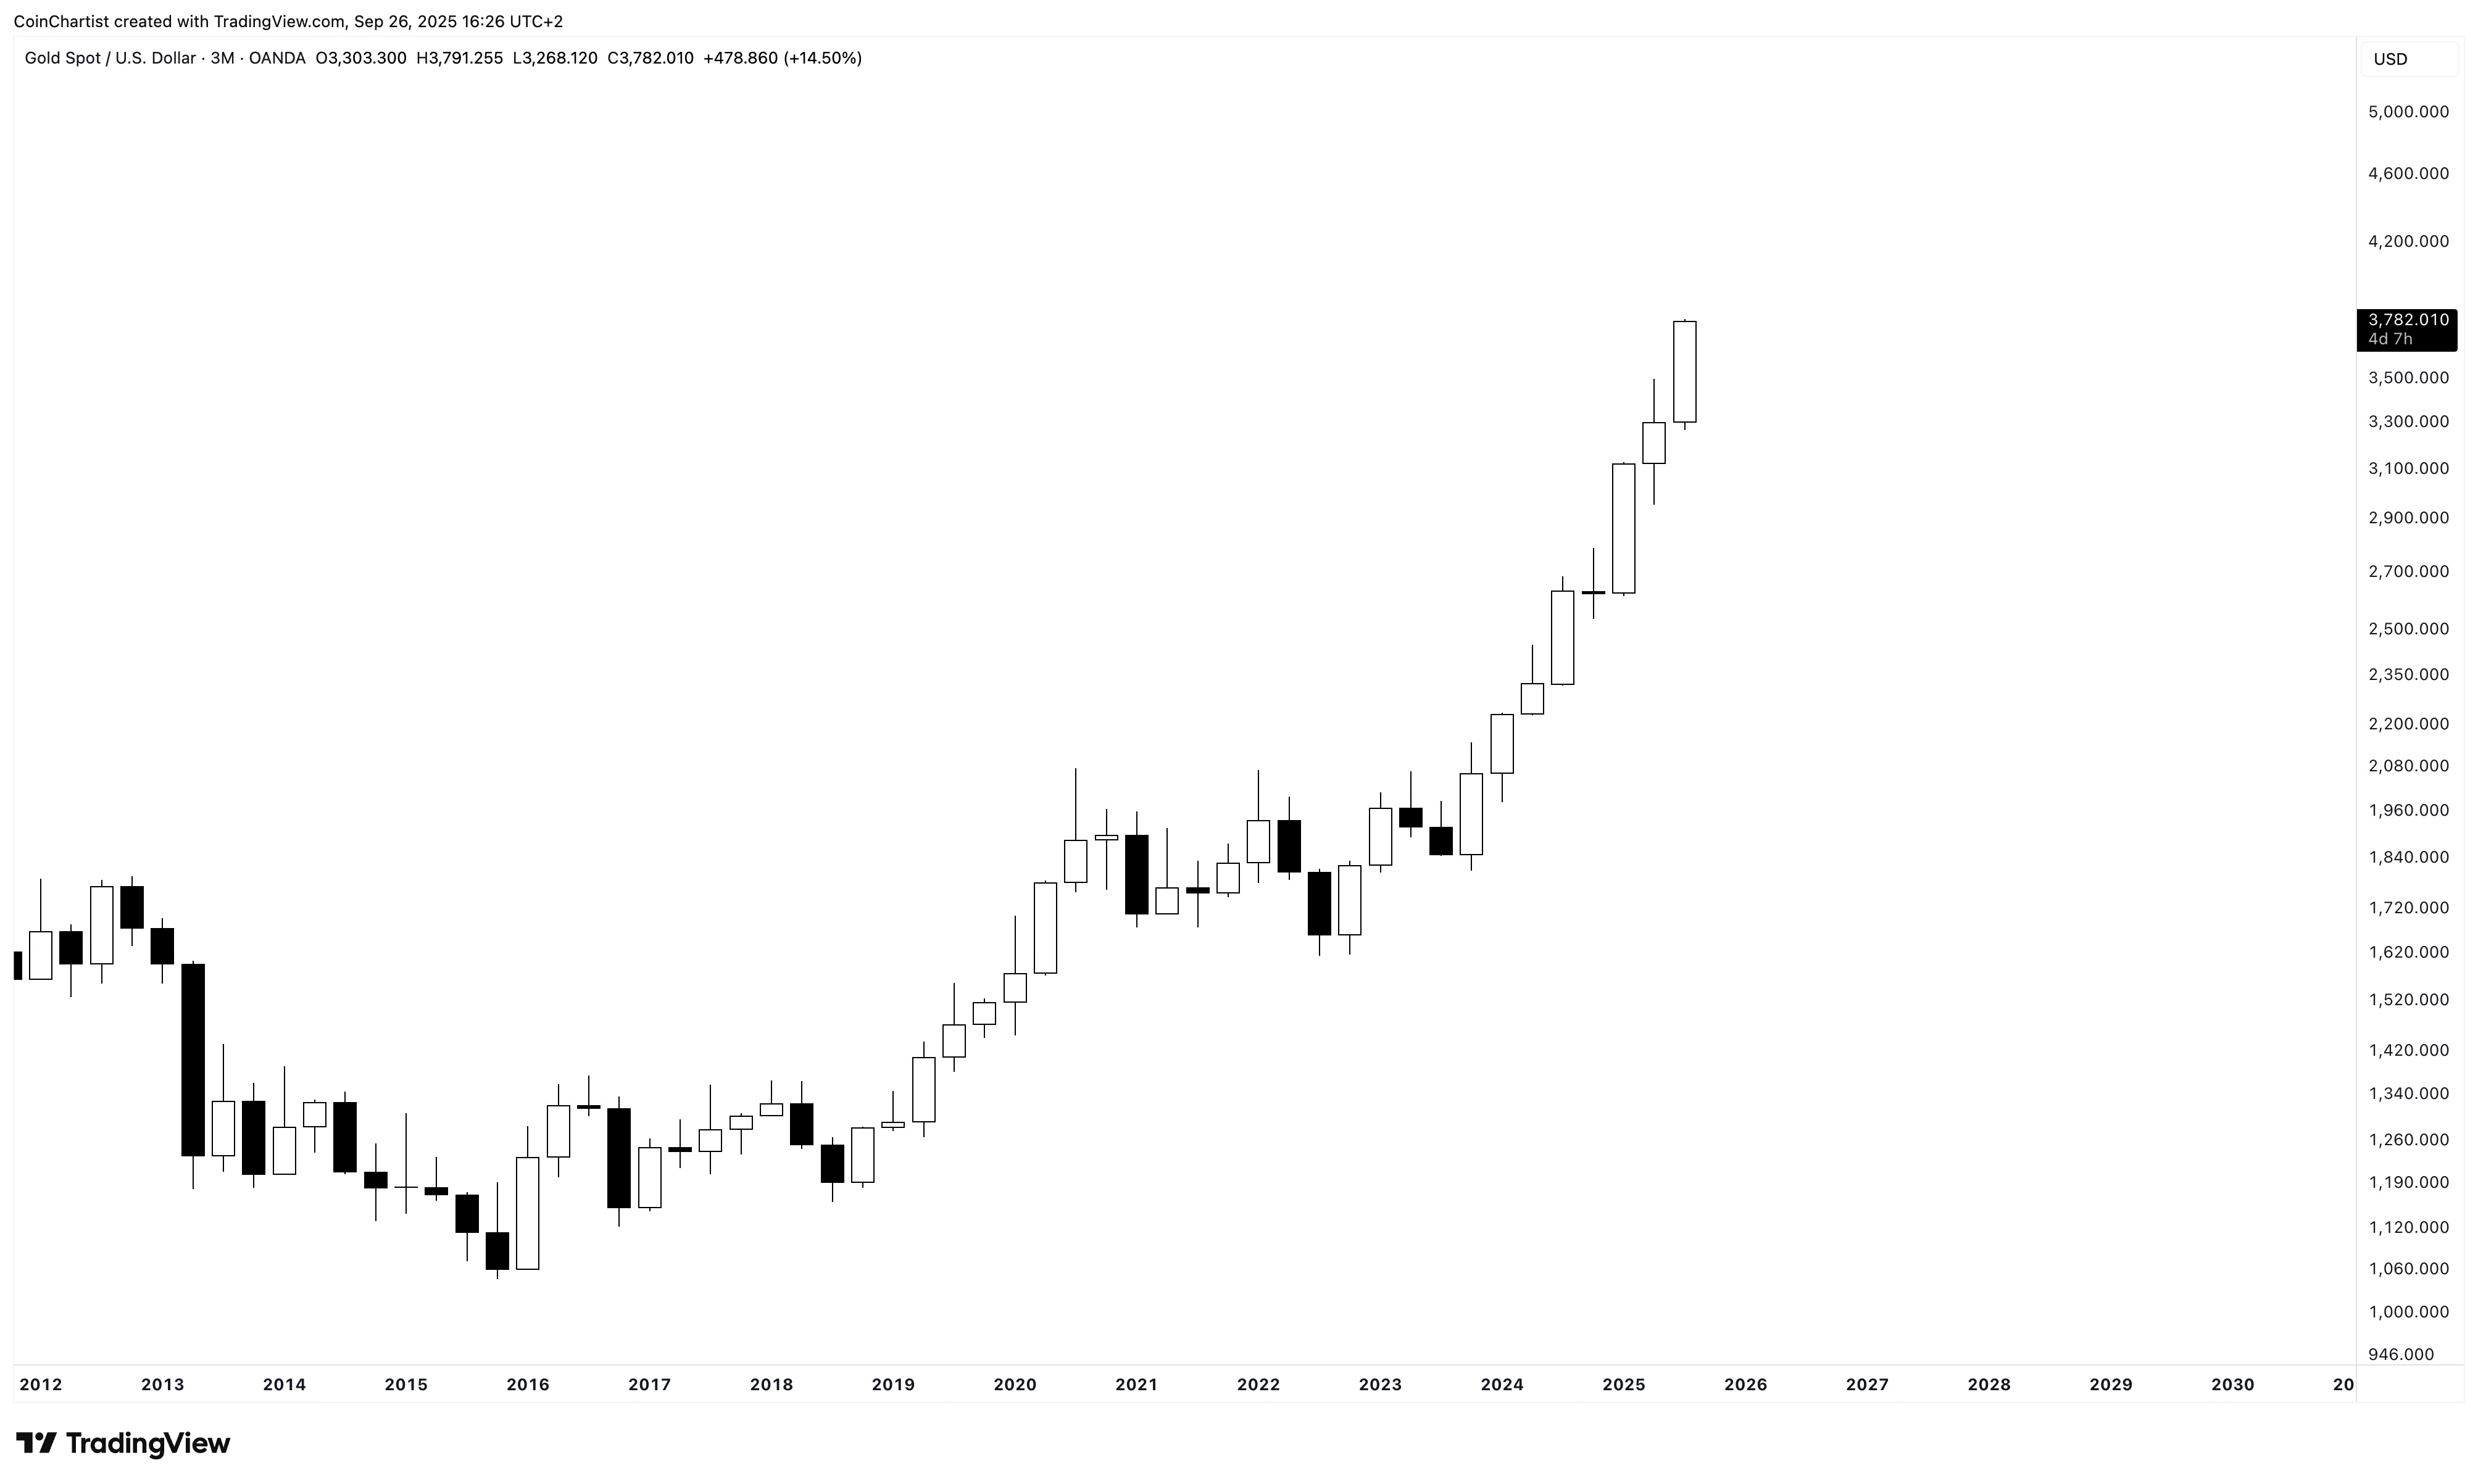
Gold’s quarterly chart is a sight to behold. The precious metal just doesn’t appear that it wants to stop rallying and is starting to rise vertically and go parabolic. Gold is beginning to look a little overheated on higher timeframes, however, Gold tends to rise a lot more during bull runs than most expect. The strength in Gold is what’s contributing to such bearish signals on the crypto priced in Gold charts.
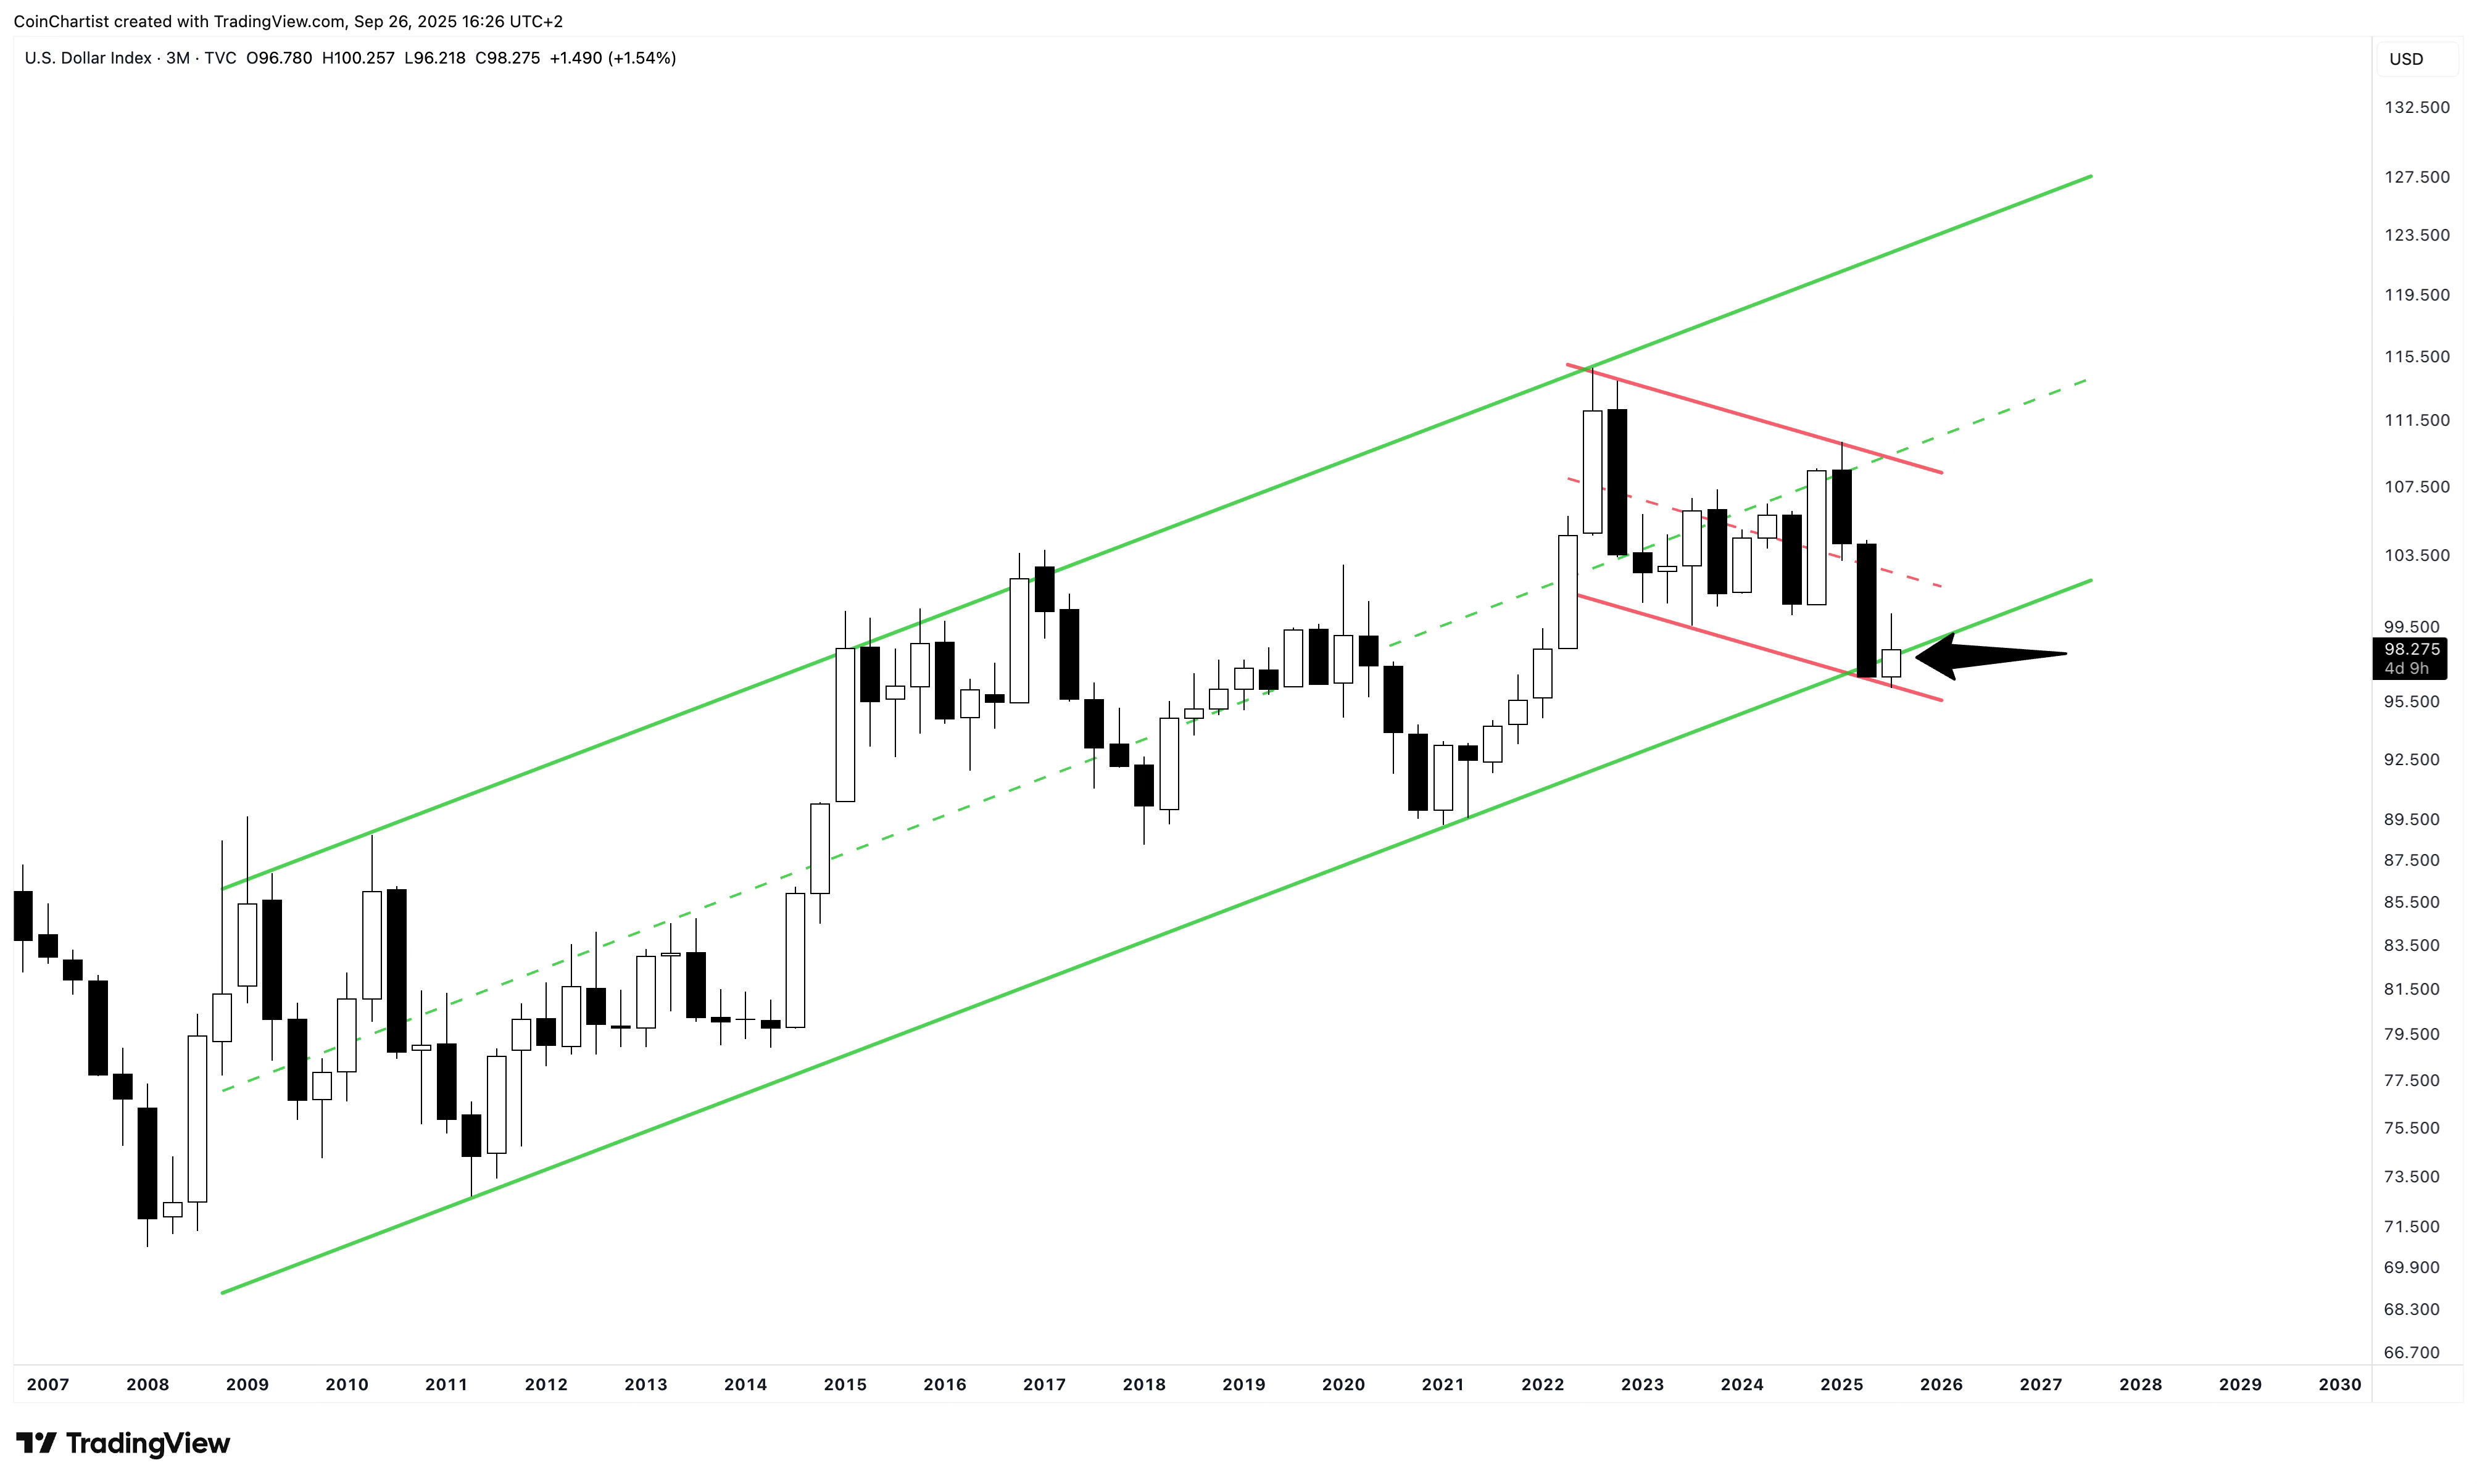
The DXY is the Dollar Currency Index, which is a weighted basket of other currencies trading against USD. This gives us an idea of the Dollar’s strength, or in this case, weakness. The problem here is that although the DXY closed the last quarter outside of the green uptrend channel, it is bouncing from the red downtrend channel and trying to get back into the green. If it does reclaim the green uptrend channel, there’s risk of the DXY making a strong contrarian move up. If the DXY reverses higher, it could finally put a stop to Gold’s reign. But it would more than likely hurt BTC and altcoins further – especially on the USD pairs.
Ultimately, the huge divergence between bearish charts when pricing crypto in Gold versus bullish charts pricing crypto in USD is a very confusing situation, and something that no one in crypto has ever seen before. The topic of whether to price assets in Gold or USD has come up a number of times recently with other top analysts and the majority are in agreement that the BTCUSD/Gold chart could be telling the truth about the state of the crypto market. It’s also worth noting that Bitcoin didn’t make a new ATH against the Euro much like it failed to do so with Gold. If the Gold chart is telling the truth, and BTC failed to make a new ATH after the January “peak,” then I may have actually nailed calling the cycle top back at the start of the year. BTC made a new ATH in USD terms, which made it seem as though the top call was inaccurate. Priced in Gold or the Euro, and it was spot on. We’ll find out very soon what’s going on, as volatility is about to explode after a history-making lull – aka, the calm before the storm.
Note: Behind the paywall, we’re doing a full analysis of Bitcoin versus Gold, BTCUSD, Gold, and the DXY. We’ll also be looking at Bollinger Band Width (and the Bollinger Bands) and Historical Volatility, which are at record-lows. We’ll share a detailed chart that shows how far Bitcoin might drop if we are about to see a more significant decline. Finally, we’ve got a cyclical chart that could help time when Bitcoin might find a bottom if we do move into a downtrend.
Keep reading with a 7-day free trial
Subscribe to CoinChartist to keep reading this post and get 7 days of free access to the full post archives.