

Special Issue | Crypto's Savior Signal
Bitcoin and altcoins are looking bearish in general. But one significant signal could save the day.

Disclaimer: The information provided in this Substack newsletter is for general informational purposes only and should not be considered as financial advice. Investing involves risk, and past performance is not indicative of future results. Please conduct your own research or consult a financial advisor before making any investment decisions. The newsletter disclaims any liability for losses or damages arising from the use of this information.
Special Issue overview:
Comparing correlations between DXY and Bitcoin/altcoins/etc.
DXY trend line breakdown supports potential plunge in the Dollar
Global liquidity breaks out. How does Bitcoin react?
Decade long volatility downtrend line is next to breakout
Analyzing the flow of money in BTC and altcoins using Chaikin Money Flow
Bitcoin’s monthly chart is the last line of bullish defense left
This week, we are ditching the normal newsletter format in favor of something that’s more narrative-driven. To start, crypto is leaning bearish on most timeframes – especially altcoins. Bitcoin still looks decent on the monthly timeframe, but appears to be at risk of triggering several top signals if this monthly candlestick doesn’t close above $59,000.
Rather than report on the same bearish technicals discussed in last week’s issue, “Now or Never,” I decided to dig deep into less-used charting methods to see if there was something unique to discuss. The result was a variety of charts focusing on the correlation between Bitcoin and the Dollar Currency Index, historical volatility, money flow, global liquidity, and more.
Crypto Currency Correlation
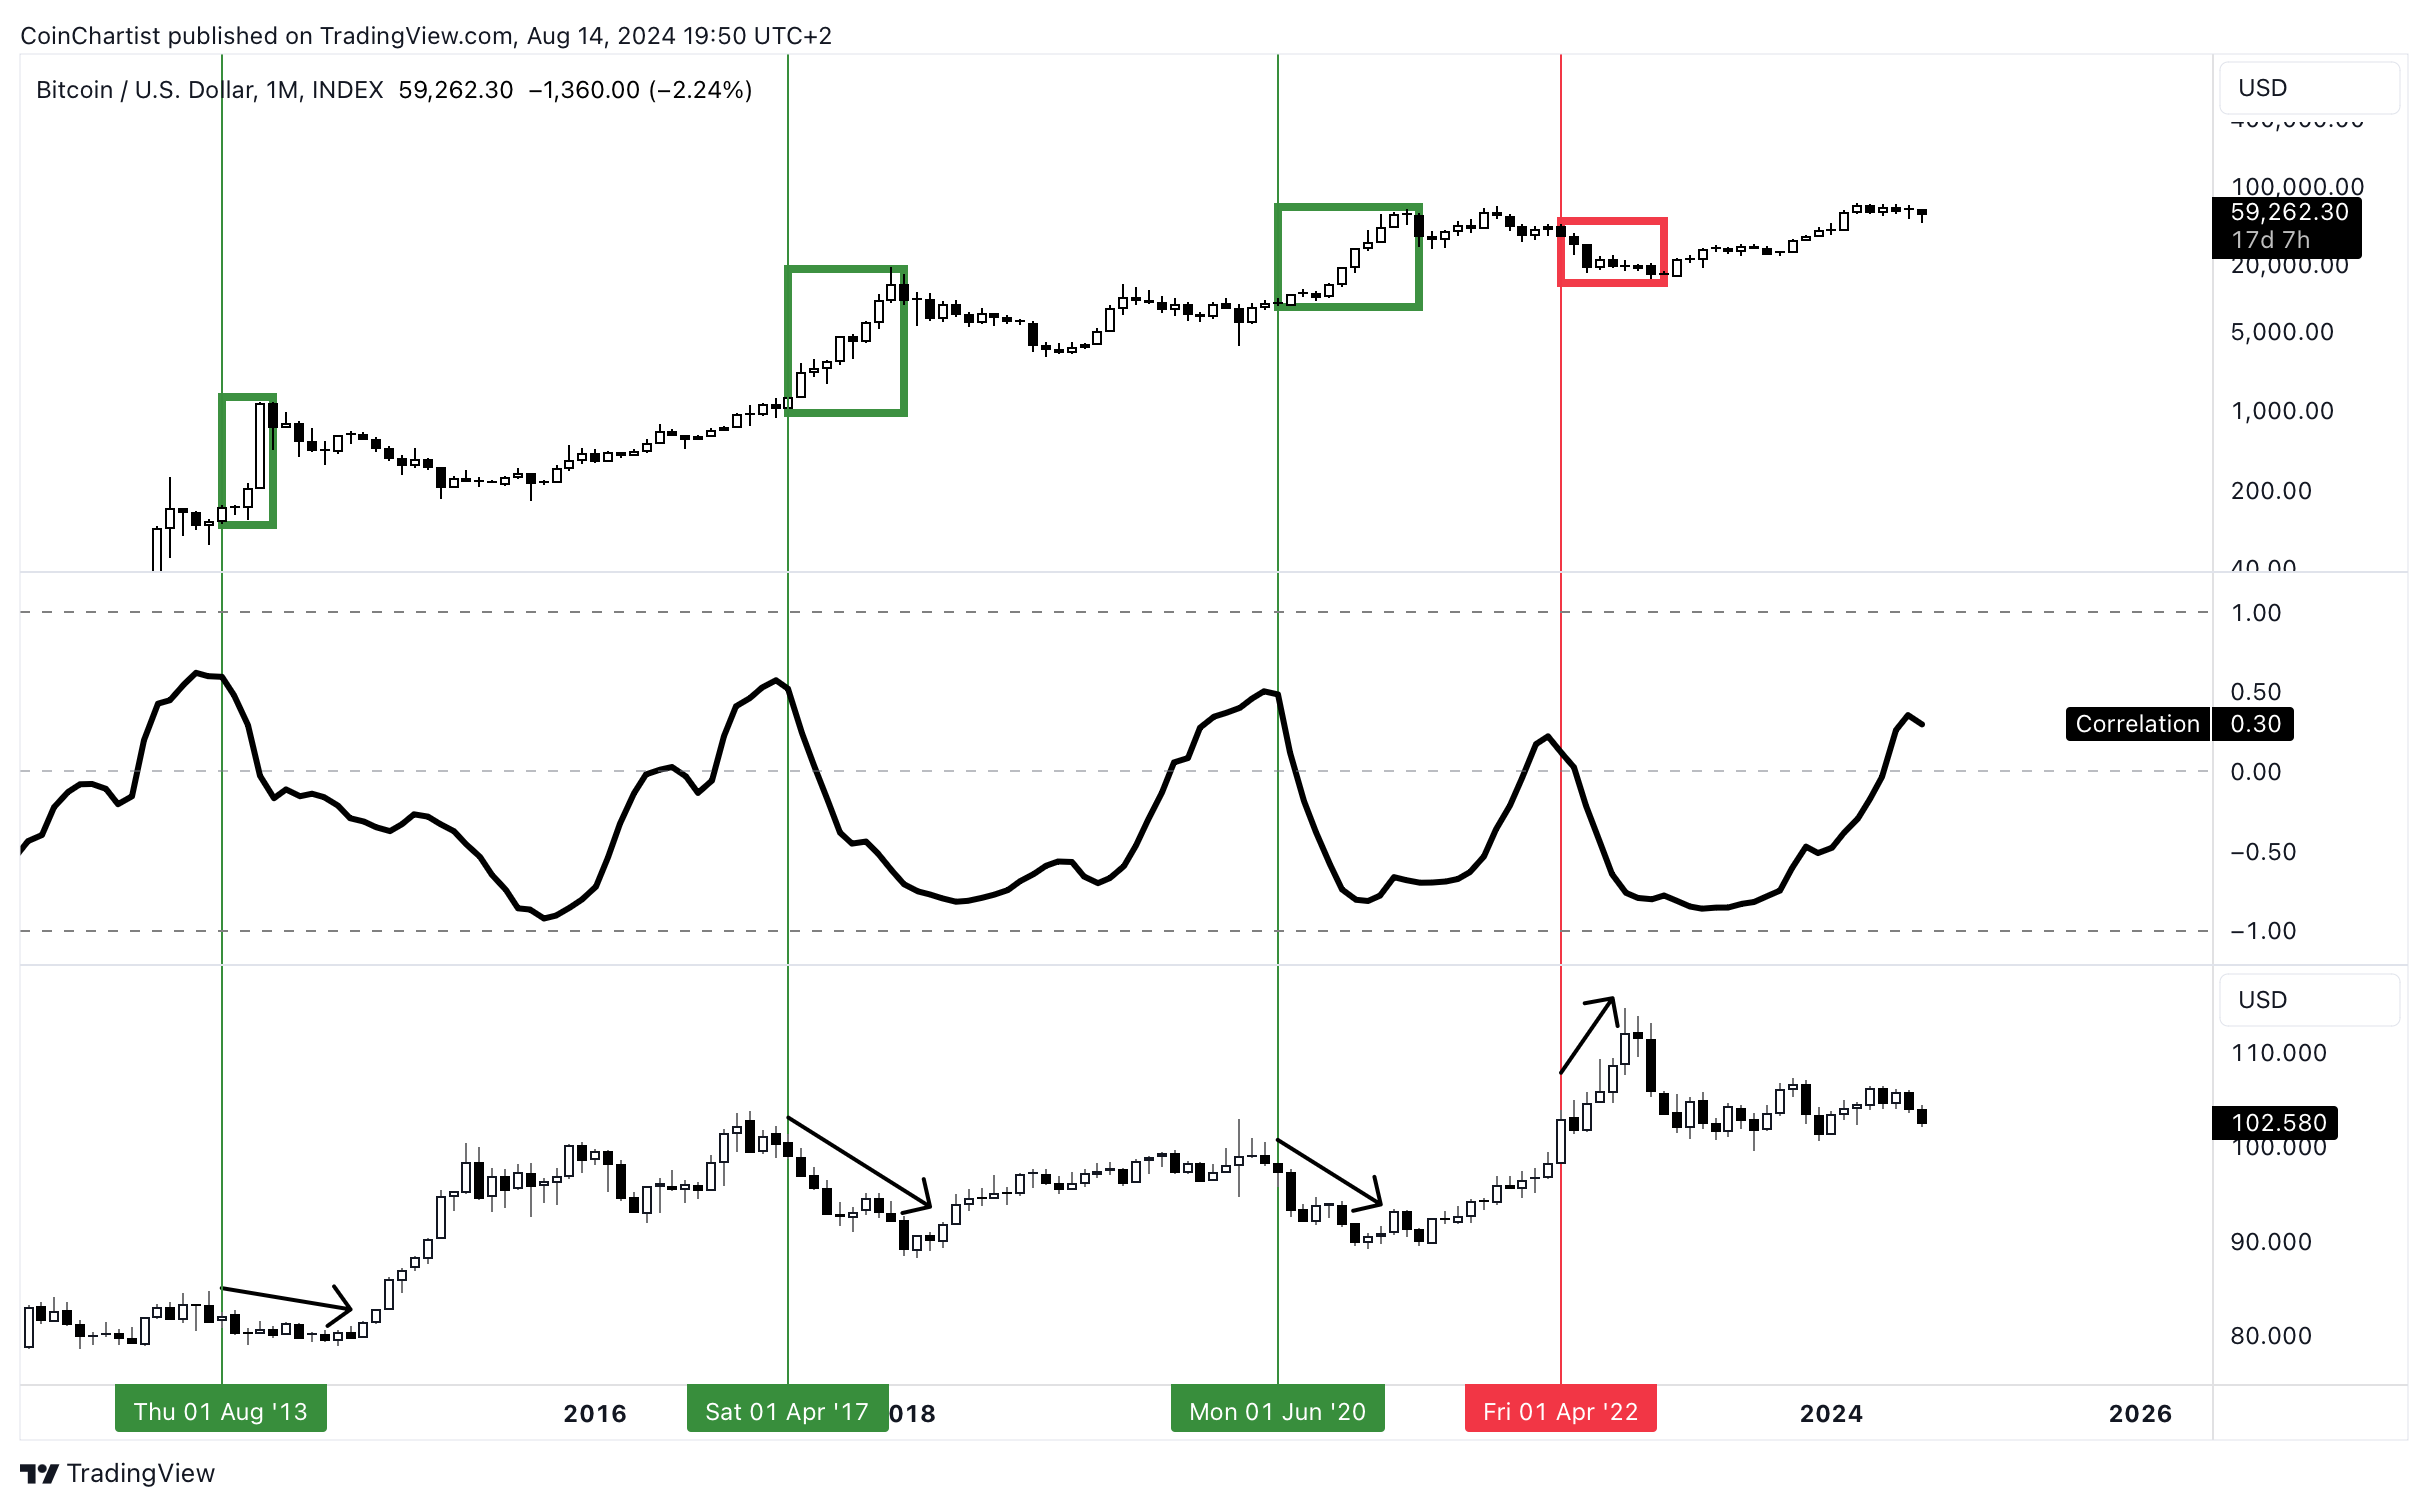
This issue’s first chart is probably the most significant in terms of potential signals. The top chart is BTCUSD, and the bottom chart is the DXY Dollar Currency Index. The middle indicator is the Correlation Coefficient. The tool visualizes not just strength of the correlation between assets and if that correlation is negative or positive, but the direction of that relationship as well. Historically, the Correlation Coefficient rolling over from a strong positive correlation leads to some of the strongest moves in Bitcoin history. Of the four times this occurred, three instances lead to the final leg up in the three previous bull markets. The fourth instance brought Bitcoin deeper into the last bear market. With a 75% hit rate and the Correlation Coefficient rolling over from a strong positive at this very moment, something big could be on the way in Bitcoin. But it depends on the direction of the DXY. Because the strong positive correlation is ending and potentially going to switch to a negative correlation, we should look for these two assets to diverge in trend direction. Three out of four instances in the past, the DXY fell in value, causing a historic grand finale to each Bitcoin bull market. Only when the DXY rose in 2022 did Bitcoin collapse after the Correlation Coefficient rolled over. Several charts in the DXY later in this issue point to the DXY dumping, potentially giving a higher probability that Bitcoin explodes into its last leg up during this cycle.
Keep reading with a 7-day free trial
Subscribe to CoinChartist to keep reading this post and get 7 days of free access to the full post archives.