


Special Issue: Crypto's Supernova Moment
Why Bitcoin, Ethereum, and the rest of the crypto market are about to go supernova.

Special Issue “Crypto's Supernova Moment” Overview
Using the Bitcoin Bollinger Bands to explain volatility
The Total Crypto Market is at the lowest volatility state ever
Individual charts for Ethereum, XRP, and Litecoin
Understanding standard deviation and extreme price movements
Improve probabilities with statistical tools
A long-term wave count that ties it all together
Remember, a premium subscription comes with access to custom technical indicators like the Raging Bull, Trend Wrangler, and more.

Disclaimer: The information provided in this Substack newsletter is for general informational purposes only and should not be considered as financial advice. Investing involves risk, and past performance is not indicative of future results. Please conduct your own research or consult a qualified financial advisor before making any investment decisions. The newsletter disclaims any liability for losses or damages arising from the use of this information.
Bitcoin is trading at $37,000 – more than double from November 2022 lows. A year has gone by without further collapse, despite a constant onslaught from the United States Securities and Exchange Commission, the recent Binance case, and during one of the toughest macroeconomic environments in recent history. Yet for some reason, the amount of skepticism surrounding the crypto market and the hesitancy around Bitcoin is shocking.
Between a lack of proper vehicles for institutional investors to deploy capital in and retail investors fearful of another FTX-like situation, interest in the crypto market faded fast throughout 2023. Even with BTC price increasing, the slow rise has prevented excitement from boiling over into a bull run. But if Bitcoin continues higher, which it appears poised to do, it could revive interest in the crypto market en masse.
Because of the low interest, low volume, low liquidity state of the market, and because sellers are mostly exhausted and buyers aren’t stepping up to the plate just yet, order books are extremely thin. This could cause price to cruise rapidly higher as these order books suddenly become full, and interest, volume, and liquidity return sharply.
All of this has the potential to produce an incredible bull market, but it doesn’t guarantee it. What it does guarantee, however, is extreme volatility as all of these conditions return to crypto. The crypto market supernova is coming and this issue is going to show you why.

The Bollinger Bands are a trend-following, breakout style trading system created by John Bollinger in the 1980s. The tool measures volatility using a 20-period simple moving average and an upper and lower band set 2 standard deviations. Shortly, I will explain what this all means.
The tool has been the key to properly reading Bitcoin price action since June 2023. The failure to push outside the upper Band in July caused a breakdown in August. The crash in August also failed to close outside the lower Bollinger Band, setting up a possible “Head Fake” scenario.

The Head Fake was valid, with 1W BTCUSD suddenly bursting above the upper Bollinger Bands and “walking the bands” higher. The breakout happened on higher than normal volume, which should have confirmed the buy signal. Price action ideally remains above the upper Bollinger Band, so closing back inside it warranted some caution.
Notice on the left-hand side of the chart, there is a box with a 49% drawdown in a matter of six weeks. When price closes above or below the Bollinger Bands, it is usually due to a strong trend which is powerful enough to continue. The same should be about to happen to the upside after the close above the upper Bollinger Band, but when?
The Bollinger Bands expand and contract with volatility. When volatility is low, the bands narrow and tighten. When the bands expand, it’s because volatility is returning. Do not forget this point as we proceed through the issue.
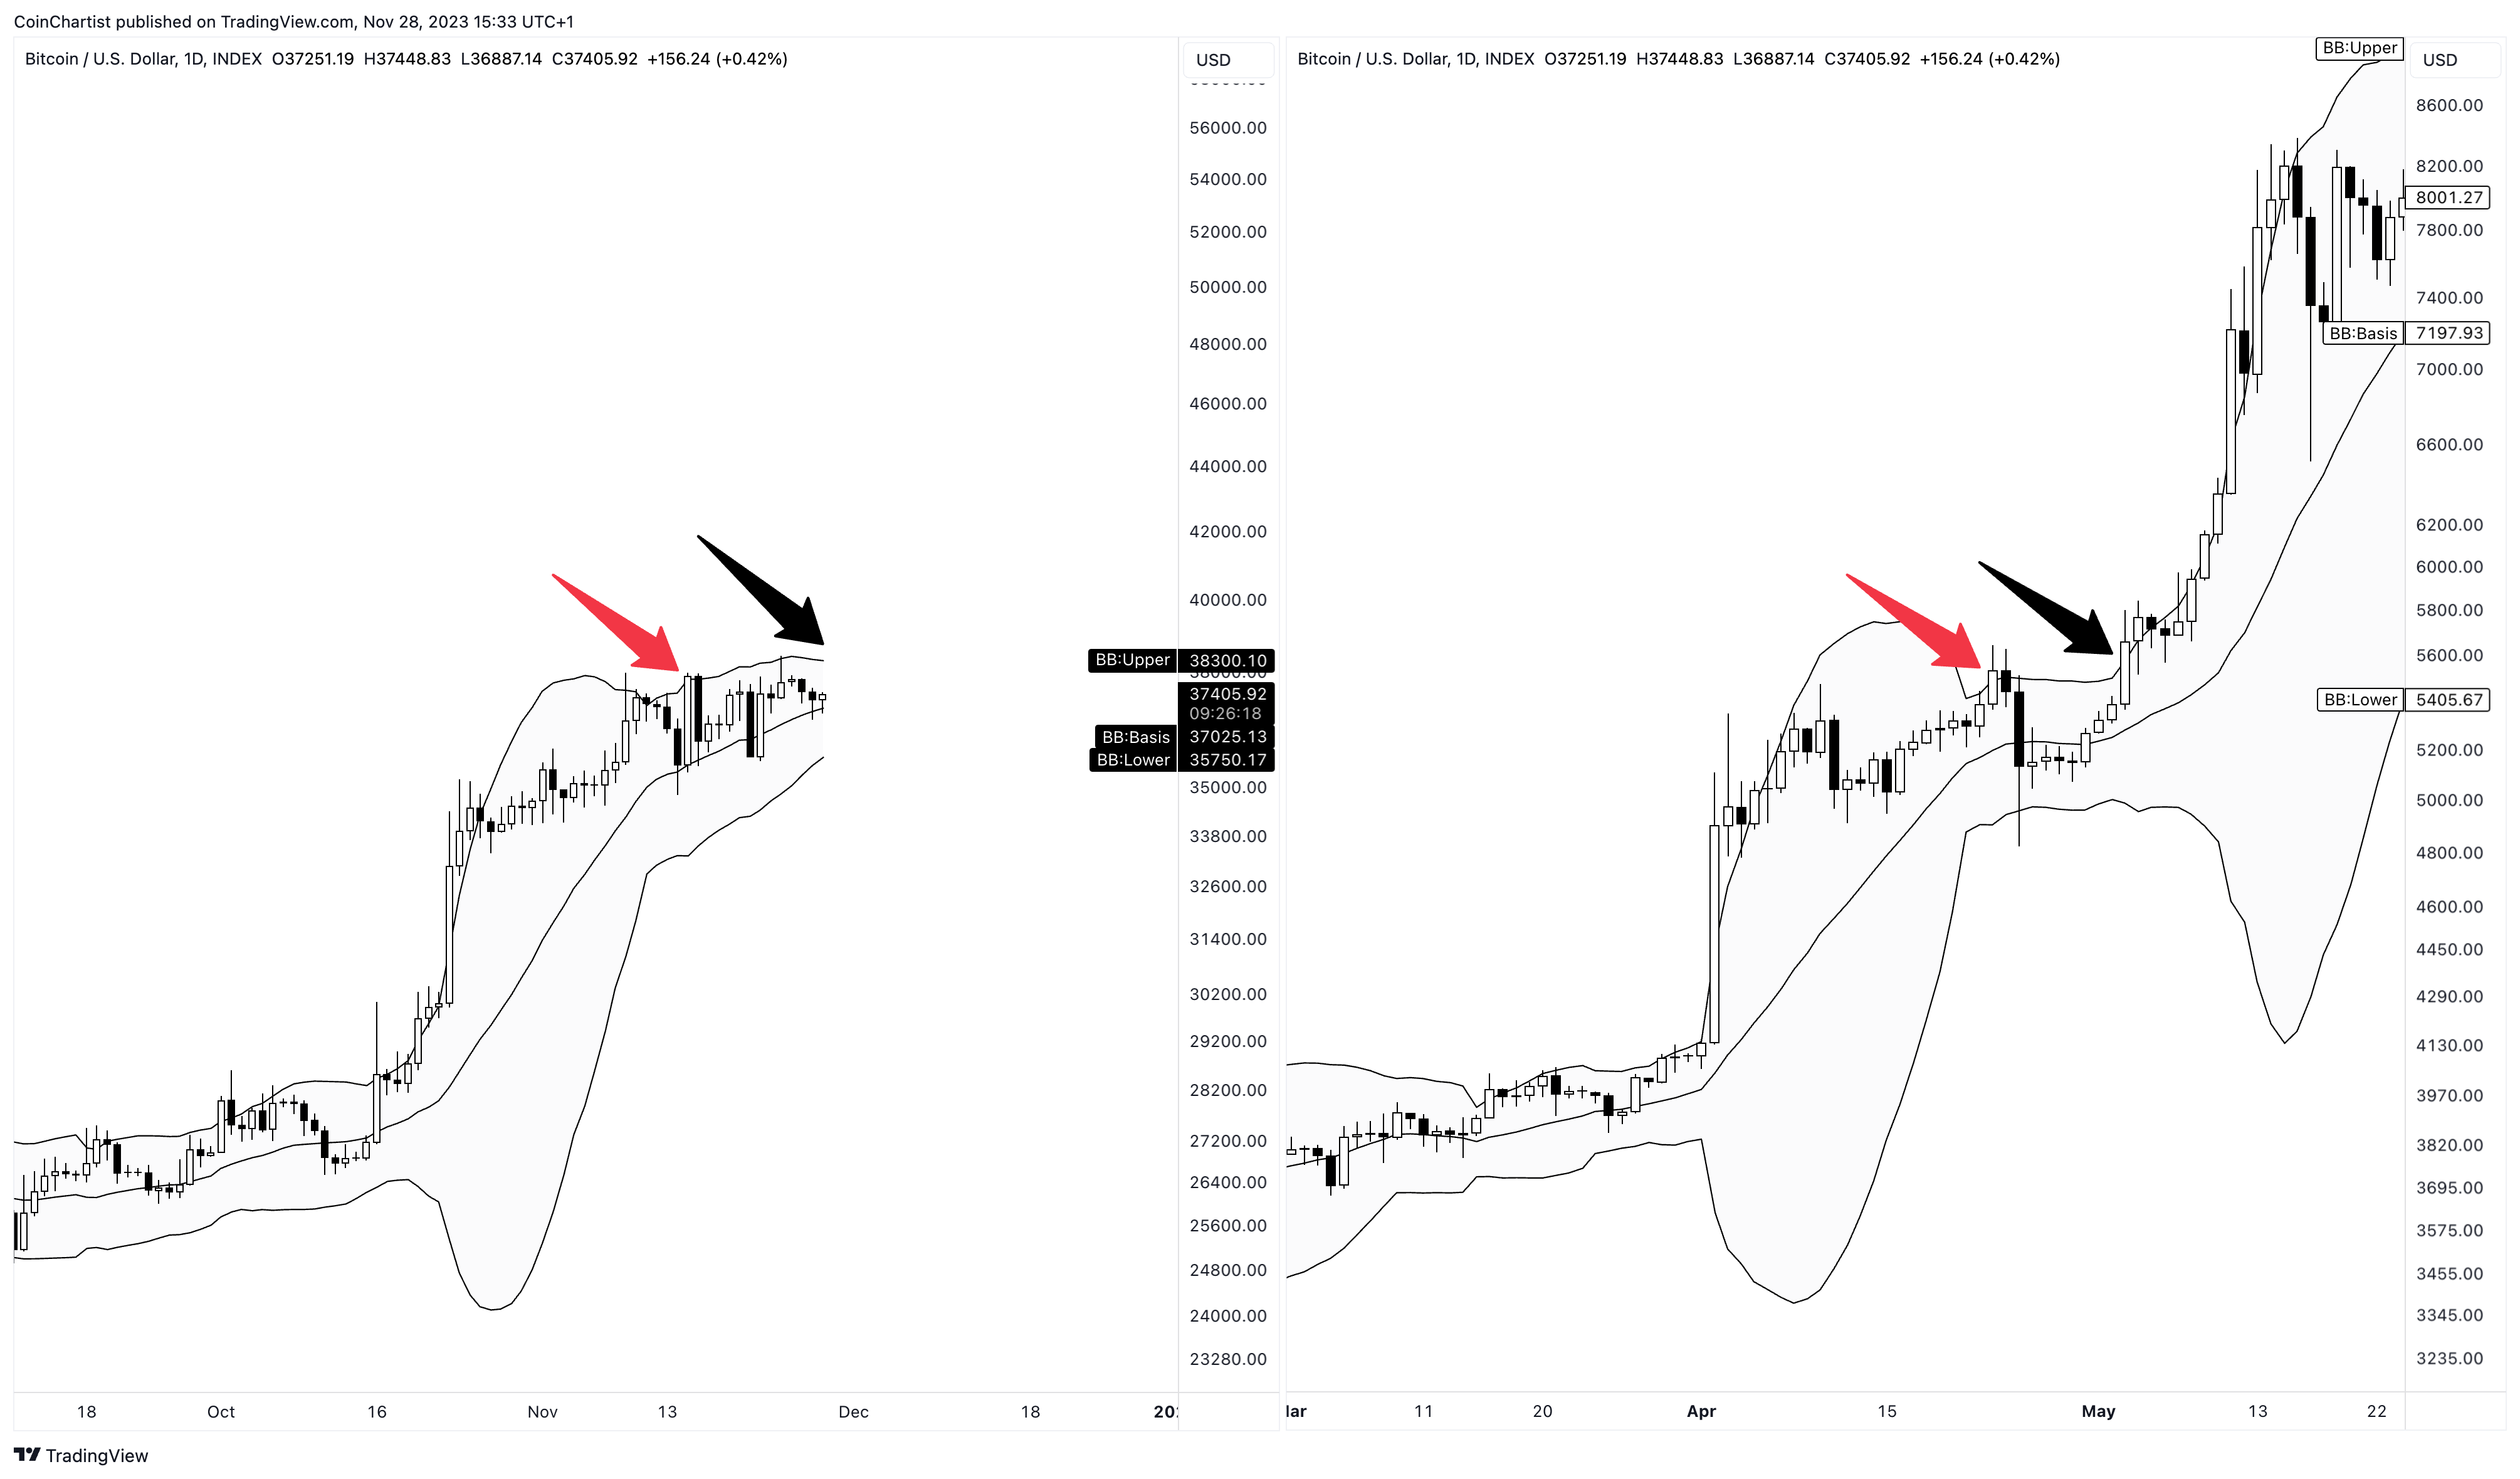
On the left hand-side, we have Bitcoin BTCUSD 1D Bollinger Bands. The daily timeframe tool explains why we have closed back inside the weekly Bollinger Bands for now. After the last big move, the bands are narrowing again, likely to continue its expansion phase higher.
The same behavior is seen in a comparison with 2019, where the red arrow points to a failed buy signal and breakout, only for the black arrow to represent a valid Bollinger Band breakout. The price comparison could send Bitcoin to above $50,000 within a couple of weeks.
At $50,000 per coin, does the market finally wake up to the fact that Bitcoin is bullish? And if BTCUSD is already $50,000 a coin and people are just starting to enter, what does that ultimately do to the price per BTC? And perhaps a more important question, does retail even touch Bitcoin at that high of a price point? This fact could be the key to why the next altcoin season is the biggest yet.

Before I move into why I am confident the so-called “supernova” is coming soon, I want to stop and explain in more detail how the Bollinger Bands work using standard deviation. Standard deviation is a term in statistics that refers to the measure of how dispersed data is in relation to the mean. The chart above does a good job of representing how this works.
The vast majority of price movements will fall within the -1 to +1 range, representing 68.26% of all price movements. Moves into the -2 to +2 range are more rare, representing only 27.18% of the data. The Bollinger Bands are set at a standard deviation of -2 and +2, which suggests that as much as 95.44% (68.26 + 27.18) of price action takes place within the Bollinger Bands.
What I am ultimately getting at, is that price action only moves outside the upper or lower Bollinger Bands, a shockingly rare 4.56% of the time. These rare moves tend to be powerful enough to lead to sustained trends. This is why a buy signal occurs above the upper Bollinger Band and a sell signal occurs below the lower Bollinger Band.
To reiterate: Only the strongest moves make it above a -2 or +2 standard deviation. And because all of this is based on probabilities and statistics of price data, these signals can be used with a higher degree of confidence than other technical signals, in my opinion. This is why understanding how certain technical indicators are calculated and how they work, not just how they are used, is important.

Another important fact about volatility in general, is that low volatility states tend to give way to high volatility phases. Volatility is cyclical in this manner, and these cycles can be predicted with some degree of accuracy. Because the Bollinger Bands contract and narrow when volatility is lower than normal (called a squeeze), is can be used as a signal to prepare for when volatility is going to return.
1M Bitcoin Bollinger Band Width (BBW) is at the lowest point in its history. The tool is currently two for two in predicting the two most recent bull markets in crypto history. Using the vertical dotted line, you can see how the BBW matches the most extreme narrowing on the Bollinger Bands themselves, and how price went on a substantial rally after pushing above the upper Bollinger Band for the first time out of the squeeze.
Bitcoin is showing the same technical conditions, sans one missing ingredient: The %B indicator at the bottom shows where price is relative to the upper or lower band. This can be used for overbought or oversold signals. Bitcoin is approaching overbought, which tends to only appear when the top cryptocurrency is in its most bullish phases.
Take advantage of the Cyber Monday discount, getting you 25% off annual subscriptions. Note: Subscription prices are increasing in 2024. Don't miss this deal.
Note: CoinChartist (VIP) Founding Member Coin NFTs are back! Sign up for the Founding Member subscription through Substack to secure your favorite. Above you’ll find a list of all currently available coins. Founding Member Coins enable access to a VIP Telegram channel, 1-on-1 TA training with Tony, and more.
Keep reading with a 7-day free trial
Subscribe to CoinChartist to keep reading this post and get 7 days of free access to the full post archives.