Special Issue | Target, Sir?
Technical targets for top cryptocurrencies using the measure rule, Fibonacci extensions, etc.
Disclaimer: The information provided in this Substack newsletter is for general informational purposes only and should not be considered as financial advice. Investing involves risk, and past performance is not indicative of future results. Please conduct your own research or consult a financial advisor before making any investment decisions. The newsletter disclaims any liability for losses or damages arising from the use of this information.
Target, Sir? overview:
Price targets for BTC, ETH, XRP, SOL, BNB, DOGE, ADA, TRX, LINK & AVAX using:
Fibonacci extensions: 1.618, 1.414, & 1.236
The measure rule based on a chart pattern
Boundary-based technical analysis
The crypto market is still consolidating, seemingly building up steam like a pressure cooker, ready to release some explosive price action. While price action takes a pause, this issue looks upward and ahead, providing speculative, technical price targets using commonly practiced methodology. That’s right — I am answering the most frequently asked question I get, which is: target, sir?
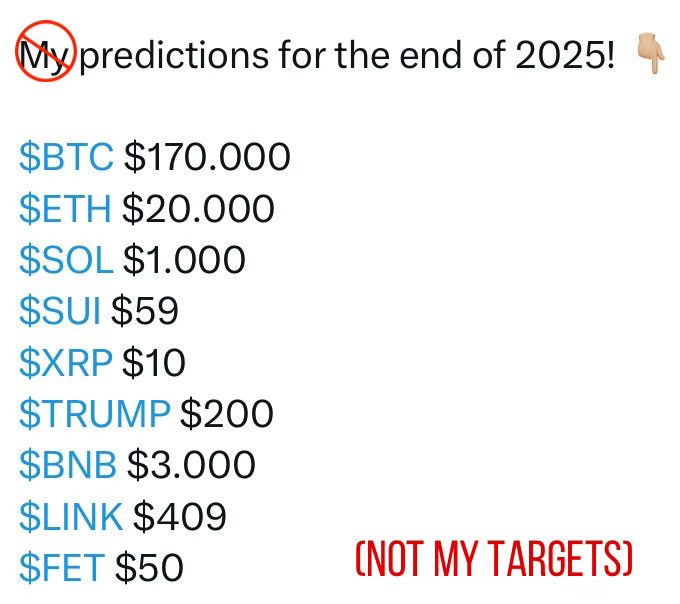
All over X (formerly known as Twitter) you can find a lists like the above which contain targets that are completely made up based on what the original poster thinks. You wont find that here. Instead, every target has some sort of evidence to support it. Supporting evidence includes Fibonacci ratios, measured moves, and moves that could potentially reach a channel or pattern boundary. This ensures any listed price targets are within reality.
All price targets should be considered speculative and for entertainment purposes. Please understand that there is zero guarantee any price targets listed are hit. Quite often, targets aren’t reached, instead only reaching 75%, 50%, or 25% of a proposed target. Targets can also be exceeded by 100%, 161.8%, 200%, etc.
Targets, although highly speculative with lots of room for error, are still valuable by providing a rough guideline to strategize around. Finding potential targets in advance allows a trader to find take profit zones and risk:reward ratios. Targets should be considered the maximum price movement. An ideal strategy involves placing related sell orders below the price target to front run any possible reversal after the target is met.
Target Methodology
Fibonacci Extension Targets
Fibonacci extensions are mathematical ratios thought to be related to mass crowd psychology.
Fibonacci extensions project targets via internal wave structure. Examples include projecting an inverse extension of a previous downtrend wave, or projecting an extension of an active uptrend. Extensions can even be used to find the C-wave target by projecting from a completed A-wave in a correction.
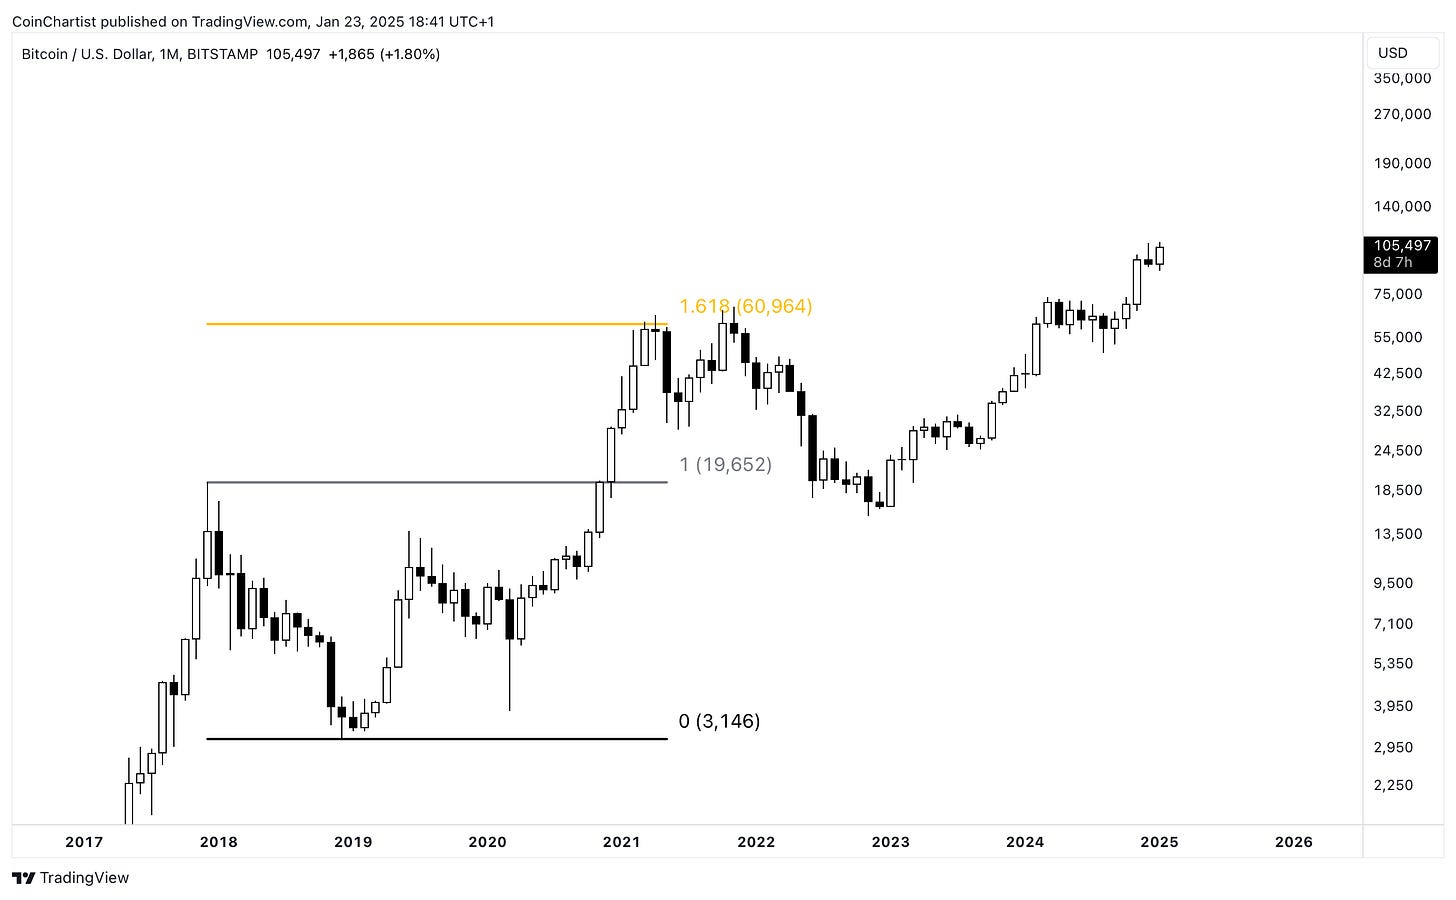
In this example, we are taking the inverse extension of the 2017 cycle peak. This projected around $60,000.
Here, we can see that the 2021 cycle peaked right at this price target. Price exceeded the target by a few thousand dollars, but didn’t close above it until the current cycle in 2024.
For further proof this 1.618 extension has validity, we can see that when drawn from the A-wave low from each cyclical peak, it perfectly projected the C- wave termination point at each bear market bottom. Simply put, this stuff works.
Measure Rule Targets
The measure rule is a widely accepted methodology for finding price targets.
Execution is straightforward — measure the height of a pattern and then project the measurement to the point of breakout. This practice should provide a valid price target.
Remember, patterns can morph causing price targets to change, and movements can over or undershoot potential targets.
In this example, the measure rule is applied to a bull flag with a horizontal flag. The target is another 37% move.
The end result was price meeting and slightly exceeding the measured move price target.
Boundary-Based Targets
Boundary-based targets are among the most subjective of all, but do offer some value in evaluating the probability of price action further filling out a pattern.
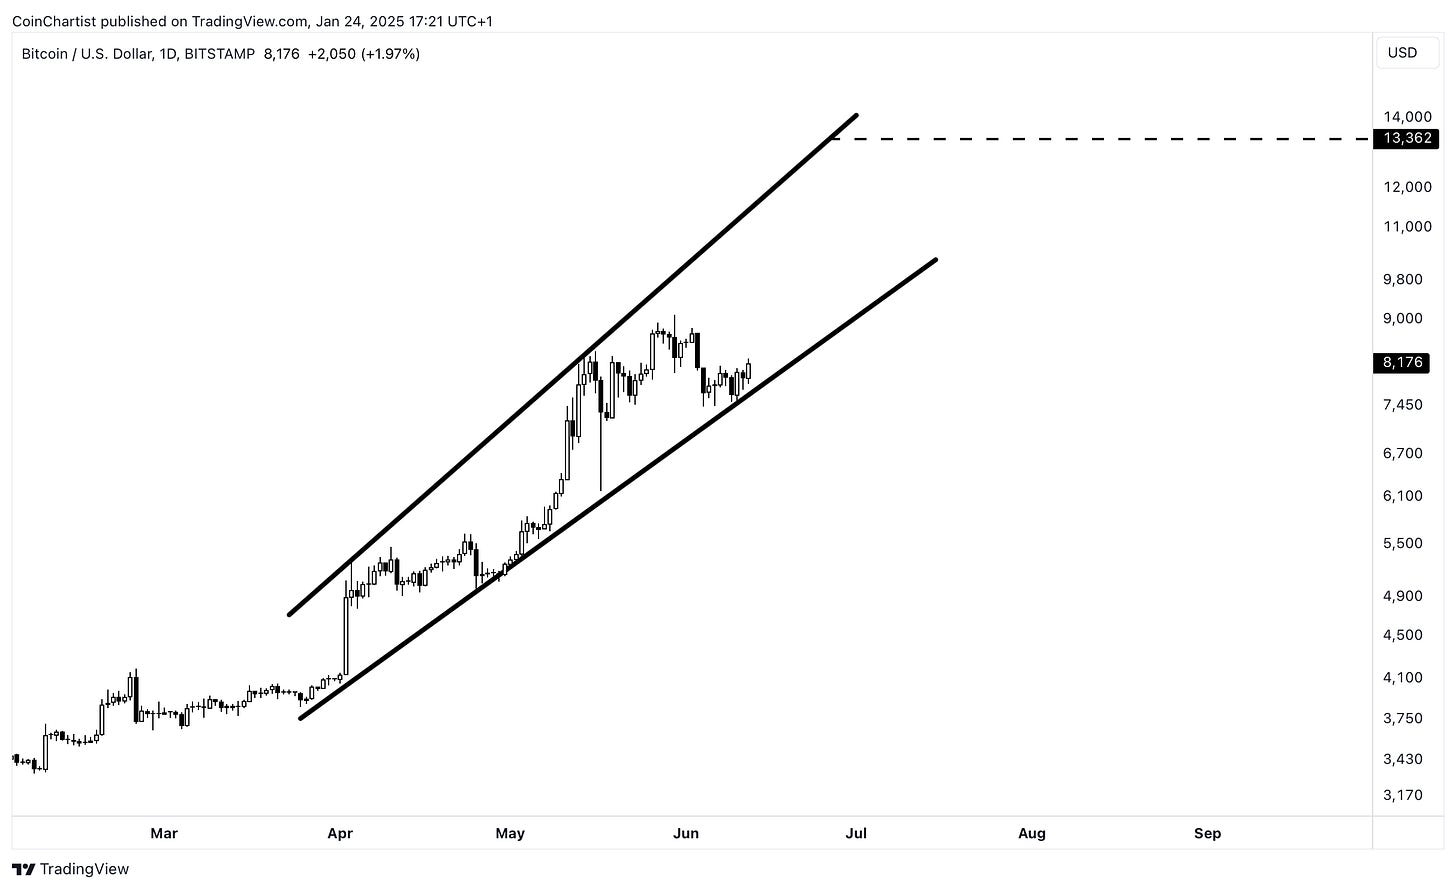
In this example, a dashed line is added to the chart to project a possible future touch point of the upper boundary.
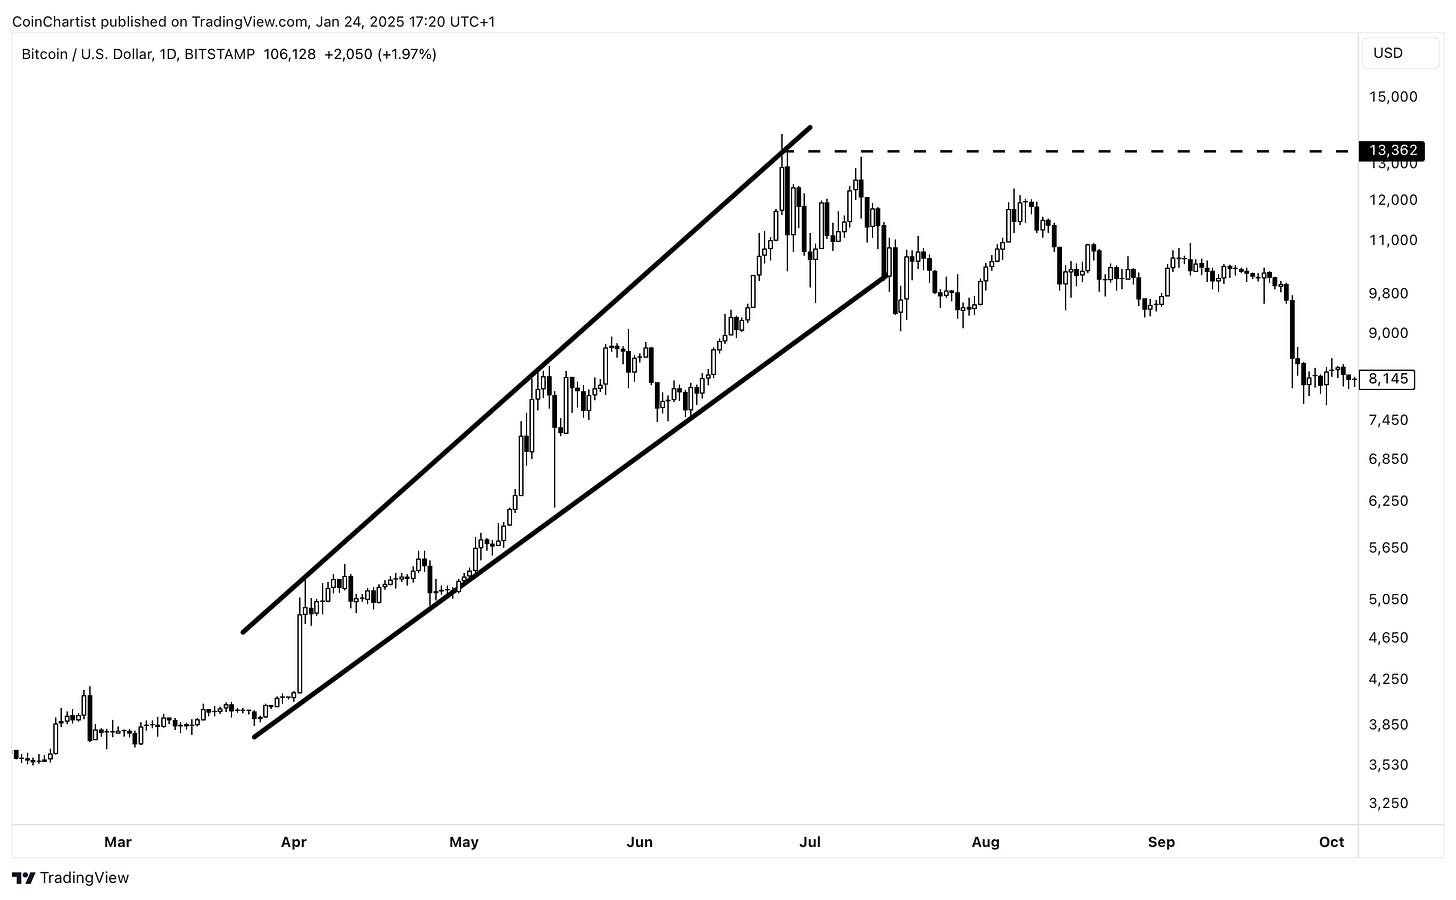
The end result was the pattern being filled out with yet another touch of the upper boundary.
Price Targets
Bitcoin (BTC)
Bitcoin is by far my most analyzed cryptocurrency, in which I have the best “read” on. As such, I am able to provide the most possible supporting evidence to Bitcoin price targets compared to others down the list.
Much like the 2017 cycle peak inverse 1.618 Fibonacci extension projected the 2021 cycle peak, the 2021 cycle peak inverse Fibonacci extension could project the 2025 cycle peak as well. This is located at among the lowest estimates for Bitcoin at $158,000.
Another method using the 1.618 Fibonacci extension involves projecting the target from the peak of wave 3 from the bottom of wave 1. This calls for a potential target of $194,000.
This version projects the 1.618 Fibonacci extension from the top of subwave iii of 5 to the bottom of subwave i of 5. We end up with a slightly lower target of $186,000.
If this is a valid bull flag pattern, the measured move points to a possible target of $191,000.
If the above is a valid head and shoulders pattern, it projects a maximum target of $321,000 per BTC. Frankly, I feel this is too high — but it’s the math.
The highest target of them all involves a touch of the upper boundary of the primary uptrend channel over the last 8 years or so, at around $345,000.
Subscribe below to see price targets for ETH, XRP, SOL, BNB, DOGE, ADA, TRX, LINK & AVAX.


