Special Issue: The AI Bubble & Bitcoin's Role
An AI-bubble could be brewing according to early signs. But how will this impact Bitcoin and the rest of crypto?
Welcome to CoinChartist (VIP), a premium newsletter collaboration between Tony "The Bull" and CoinChartist.io
Premium (VIP) subscribers will receive full access to weekly newsletters delivered to their inbox, Tony’s custom technical indicators, and much more
The Anatomy of an AI Bubble
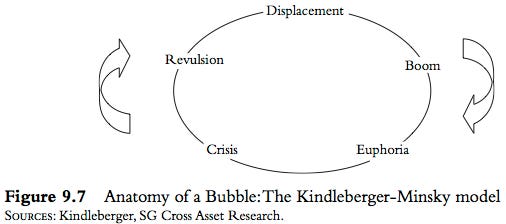
In the book Manias, Panics and Crashes, by Charles Kindleberger, the author builds on ideas from economist Hyman Minsky to label the five distinct phases of a bubble: Displacement, Boom, Euphoria, Crisis, and Revulsion.
Displacement is typically caused by the emergence of a new technology. The best example of this is the dot com bubble, or perhaps crypto itself. Economic expansion is based on productivity. Disruptive new technologies like the internet and AI hold the potential to increase productivity by leaps compared to before.
Not fully understanding the potential of what AI truly offers is an area that’s ripe for euphoric speculation and overvaluation of asset prices that leads to a bubble. And that’s where crypto comes into play. And because a rising tide raise all boats, a tech-heavy bubble would undoubtedly benefit cryptocurrencies like Bitcoin.
Usable AI applications like ChatGPT, Google’s Bard, and others have the greatest potential impact to improve productivity in the business world since the dawn of the internet. A resulting increase in stock prices, especially in the tech sector, makes sense considering the sheer potential alone.
In a future dominated by AI, eventually these autonomous systems must be able to move money and value around the internet. Chatbots and other types of artificial intelligence aren’t going to be counting greenbacks or gold bars: AI is not only going to leverage, but the technology is going to require cryptocurrencies to verify, not trust, what these AI agents are doing autonomously.
Examining Nvidia and Nasdaq 100
This special edition is dedicated to providing technical-based and theoretical evidence to support the idea that the market is in the early phases of a bubble. It begins with an overlay of the Nasdaq 100 (NDX) Index.
The chart above is taken from the local bottom in the NDX through today, with the anatomy of a bubble chart superimposed. It isn’t unrealistic to envision the NDX turning upward further from here. The launch of ChatGPT was the first sign of displacement.
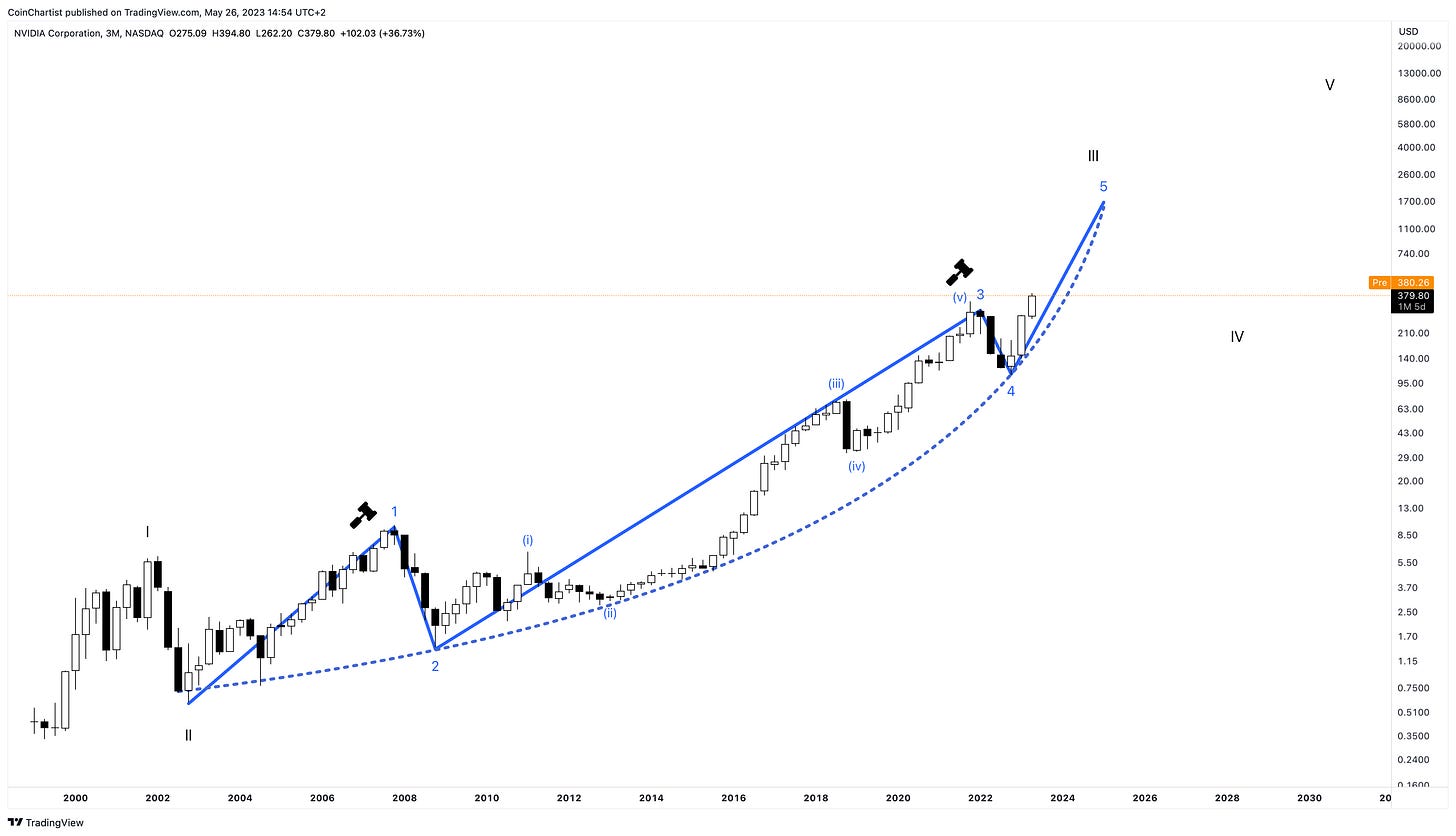
The next most important chart in financial markets right now, is Nvidia (NVDA). Nvidia earnings beat expectations thanks to powering most AI applications in the wild. The result was a higher high on the chart – something that must be confusing bears who were expecting the entire stock market to fall off a cliff.
The Nasdaq 100 is a weighted index featuring a basket of the top 100 tech stocks in the United States. NVDA is a key component, and after the recent rally, one of the largest companies in the world per valuation. In all sectors, there are leaders and laggers, but it is rare the just one asset takes off and leaves all the rest behind.
More breadth is needed to confirm a larger bubble, but with companies like Google, Apple, Amazon, etc. in the same basket and with a hand in the AI-pie, it is difficult to imagine a scenario where adjacent tech and AI companies don’t follow suit. Several of these tech giants are also components of the S&P 500, which could ultimately pull the entire US stock market to new highs. If that happens, there is no doubt Bitcoin would also be a beneficiary.
A direct comparison between Bitcoin and NVDA shows that after a phase of outperformance by the tech stock, BTCUSD blows up and makes a substantial peak above Nvidia price. Not only would this suggest new ATHs in Bitcoin with a higher high in NVDA, but considerably higher prices in the top cryptocurrency could also result if historical correlations remain.
While a correlation between two assets isn’t guaranteed to last, the correlation between NVDA and BTCUSD remains very strong, according to the correlation coefficient. You might wonder why a correlation might still exist since Nvidia GPUs are no longer that effective for crypto mining. However, correlations aren’t causation, and the relationship could be due to similar investors classes and behavioral patterns. For example, someone ahead in understanding tech might also have a good grasp on crypto.
The correlation between the two assets has been falling lately, but that isn’t necessarily a bad thing. After the short divergence, the correlation strengthens and Bitcoin outperforms. With BTCUSD superimposed, it and NVDA are following a similar wave count and trajectory.
The wave count in NVDA appears to support a grand finale rally before a longer bear market. Part of the reason why the last correction felt so significant, was due to it being the end of a lower degree wave. But in the larger wave count, the trajectory is still up. Price action continues to follow an increasingly parabolic path.
With less emphasis on wave counting, technicals also support the importance of each turning point. The current degree wave 1 ended on a TD9 and reversal candlestick back inside the Bollinger Bands. Wave 3 ended with the exact same setup. With wave 4 complete, wave 5 is all that’s left for NVDA on this degree motive wave. The ADX further strengthening is indicative of more upside.
The point of counting out NVDA was less to look at Nvidia, but instead to demonstrate it matching the Nasdaq 100 Index. Both charts are following a parabolic curve higher making the third touch. Notably, the NDX prior to Nvidia’s price action shows the tail end of the dot com bubble. It can possibly be used to highlight the increasing slope of the parabolic curve that has yet to happen this time around, and could still happen with an AI bubble.
Outperformance in Nvidia over BTCUSD tends to end after touching back on a reading of 53-54 on the weekly RSI. Once Bitcoin blasts off above the level, BTCUSD outperforms NVDA instead. A peak has arrived in Bitcoin on average 21 weeks later. This would estimate a potential top in BTCUSD around mid-October.
Back to Bitcoin and Crypto
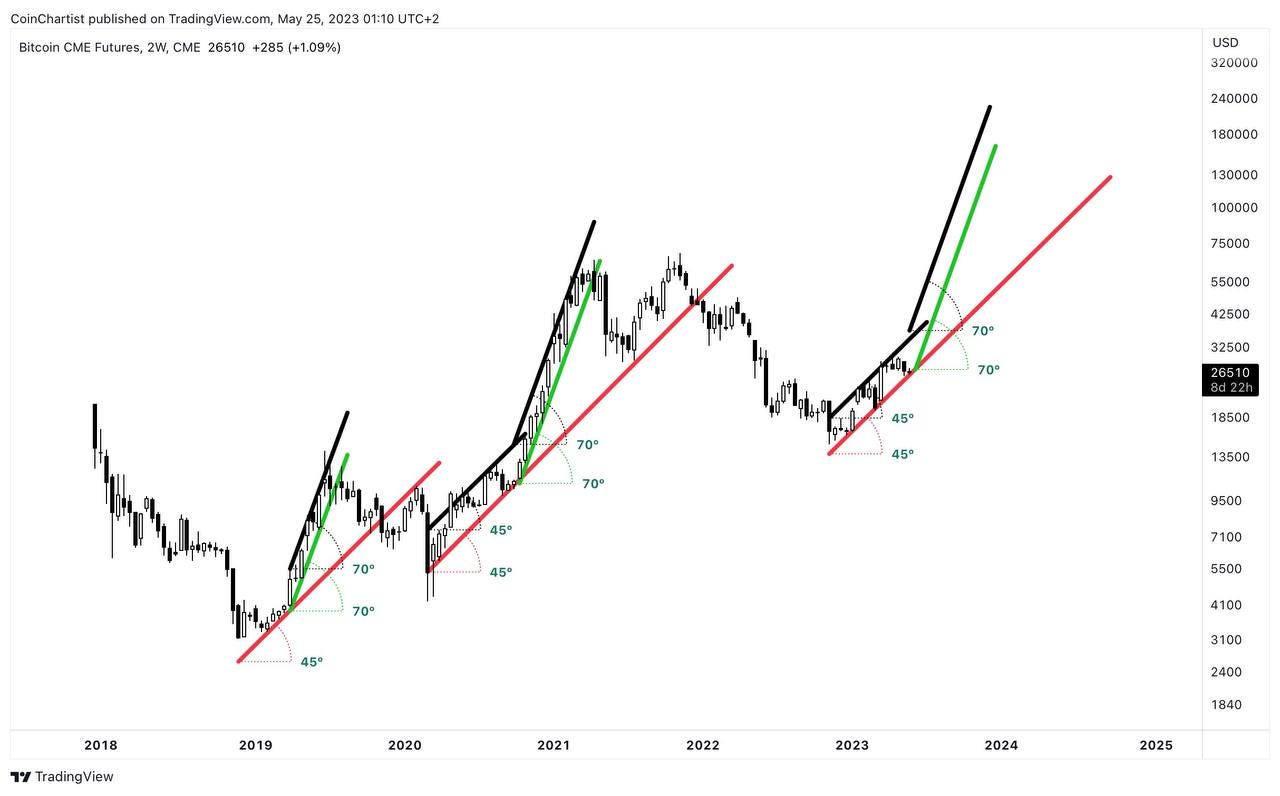
The above was designed to set the stage for why in the current macro environment Bitcoin could benefit from an AI bubble, but now it’s time to focus on pure technicals in the crypto market. The above BTC CME 2-day chart shows an important uptrend channel still holding on by a thread. A rising RSI trend line is also holding, as the oscillator converges and coils up for a larger move.
A rising RSI trend line is important for progression into a bull market. Only one step is left, and that’s for the slope to increase and push the RSI through downtrend resistance. A move to $40,000 would take BTC to the top of the channel.
The channel’s angle is of great significance. WD Gann was the first to discover that markets are geometric and used geometry in his analysis. BTCUSD in the past has first followed a 45-degree slope, until it then turned into a 70 degree parabolic uptrend. When the 70-degree line breaks down, the uptrend has ended historically. Will this trajectory and path upward continue like in the past?
Much like a rising tide in tech stocks could pull up Bitcoin, Bitcoin climbing higher is an all-clear sign for the rest of crypto to rally. The Total Crypto Market cap continues to hold above the 50-session moving average, now on its sixth consecutive candle in a row on the 4-week timeframe. Momentum is also about to turn upward for the first time since 2021.
If there truly is an AI-bubble upon us, then there will be several new opportunities for AI/crypto crossover coins like Fetch.ai. The AI-adjacent naming convention has been enough to propel FET from bear market lows to over 500% higher. Momentum crossed bullish months ago, and an important level may have been flipped from resistance to support.
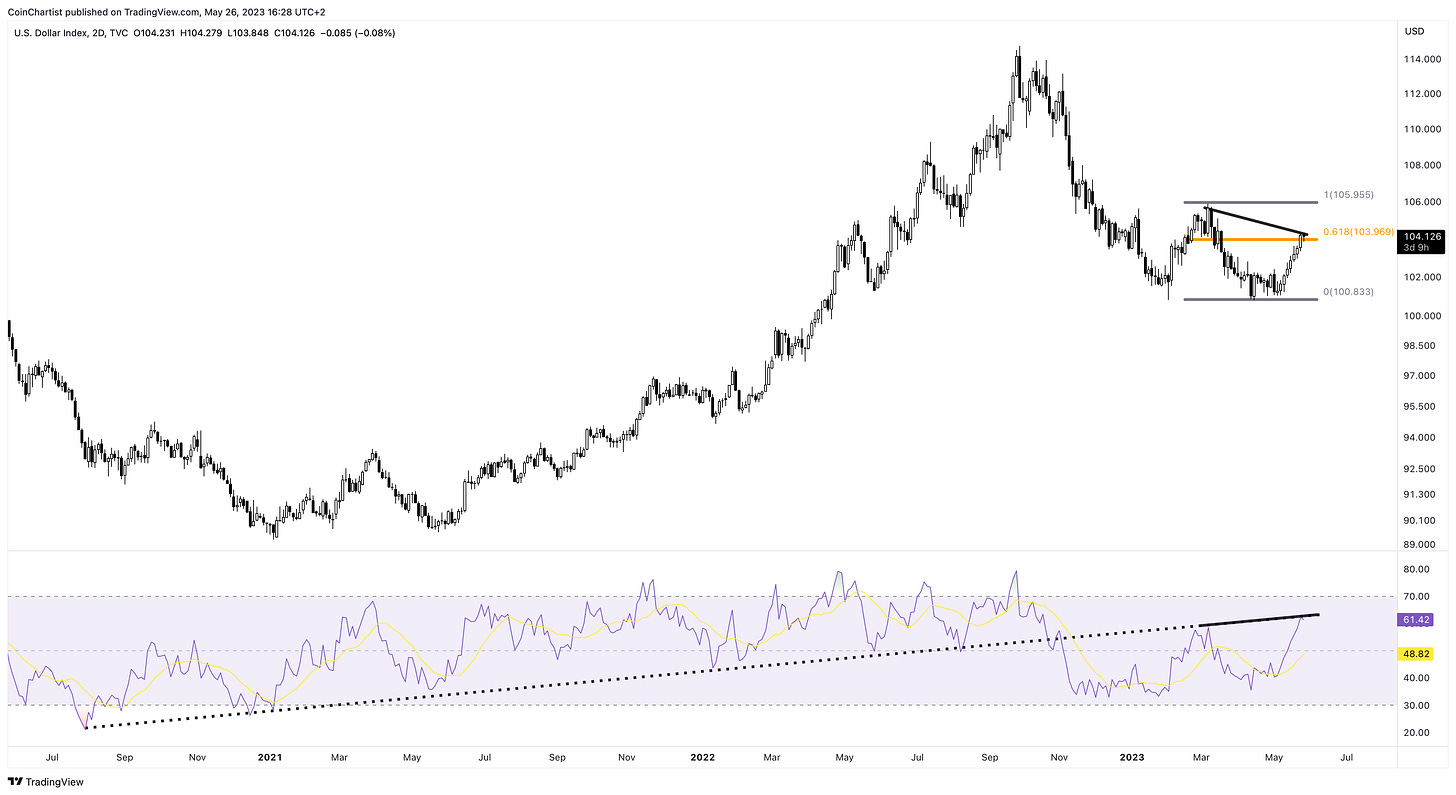
Of course everyone is asking… what about that monster rally in the DXY? The dollar did strengthen, but there was a bearish divergence at the 0.618 Fibonacci retracement. This is highly indicative of further correction in the basket of currencies trading against the dollar.
Money managers have a responsibility to make money with client’s funds. They aren’t going to sit in cash forever. It’s been a long time bearish, and the conditions are changing. If there is an AI-bubble at foot, the combination of sidelined cash, shorts unwinding, and the chase from those who sold lower expecting to buy in even lower, could turn into something incredible very quickly. The dot com bubble left many broke and wiped out the fortunes made. If an AI-bubble is truly here, then this could be a once in a lifetime opportunity that I will not be missing.
Thank you for subscribing, reading, and for your time and support.
—Tony
Introducing the full set of CoinChartist (VIP) NFTs, exclusively for Founding Member subscribers.
Owning an NFT gives you rights to 1-on-1 technical analysis training with Tony, plus access to a Founding Members (VIP) Telegram channel where you can ask Tony questions and get priority feedback.
NFTs will be minted on Ethereum and can be sold via OpenSea should you decide they ultimately don’t provide the value you expected. Alternatively, its value could grow as the CoinChartist brand does, providing additional reason to own one.
NFTs are chosen first come first serve, starting June 1. Tony will be in touch with Founding Members in the order of sign up to allow choice, draft-style, until they’re all gone.
If you have your eyes on one, don’t wait - it could be gone soon.
Below here you’ll find only the best Bitcoin and altcoin analysis money can buy. One chart under altcoins suggests it’s possible to see the largest move in cryptocurrencies since the historic 2017 bull run. Subscribe today and don’t miss a single chart from Tony.


