

Stalemate
Bears couldn't take Bitcoin lower, and bulls failed to bring Bitcoin to significant new highs. The market is at a stalemate.

Disclaimer: The information provided in this Substack newsletter is for general informational purposes only and should not be considered as financial advice. Investing involves risk, and past performance is not indicative of future results. Please conduct your own research or consult a financial advisor before making any investment decisions. The newsletter disclaims any liability for losses or damages arising from the use of this information.
Statemate overview:
Horizontal price levels to watch for a breakout or breakdown in Bitcoin
Low timeframe momentum is turning over. Could this cause a domino effect across higher timeframes?
Examining highs and lows on BTC, ETH, TOTAL, S&P 500, etc.
Coinbase shares (COIN) appear poised for a big rally – what this could mean for crypto… especially altcoins
With only ten days left in Q2 2025, what does the TD Sequential market timing tool tell us?
Debunking Elliott Wave counts across the board – plus some bullish EW alternatives
Bitcoin, crypto, stocks, etc. are holding up extremely well considering the crisis breaking out in the Middle East and despite increasing fear around a possible World War 3 or nuclear attack. Although we haven’t seen much in terms of a correction, at the very least, any bullish momentum and sentiment has begun to fizzle out. What we are left with is some kind of stalemate – where neither side is making any real progress. When this stalemate ends, the winning side should see a stronger move and trend develop – but it is still not clear as to which side will gain the upper hand.
Levels to Watch
In technical analysis, horizontal levels tend to provide the best signals when interacted with. Here are the most important price levels to watch at the moment.
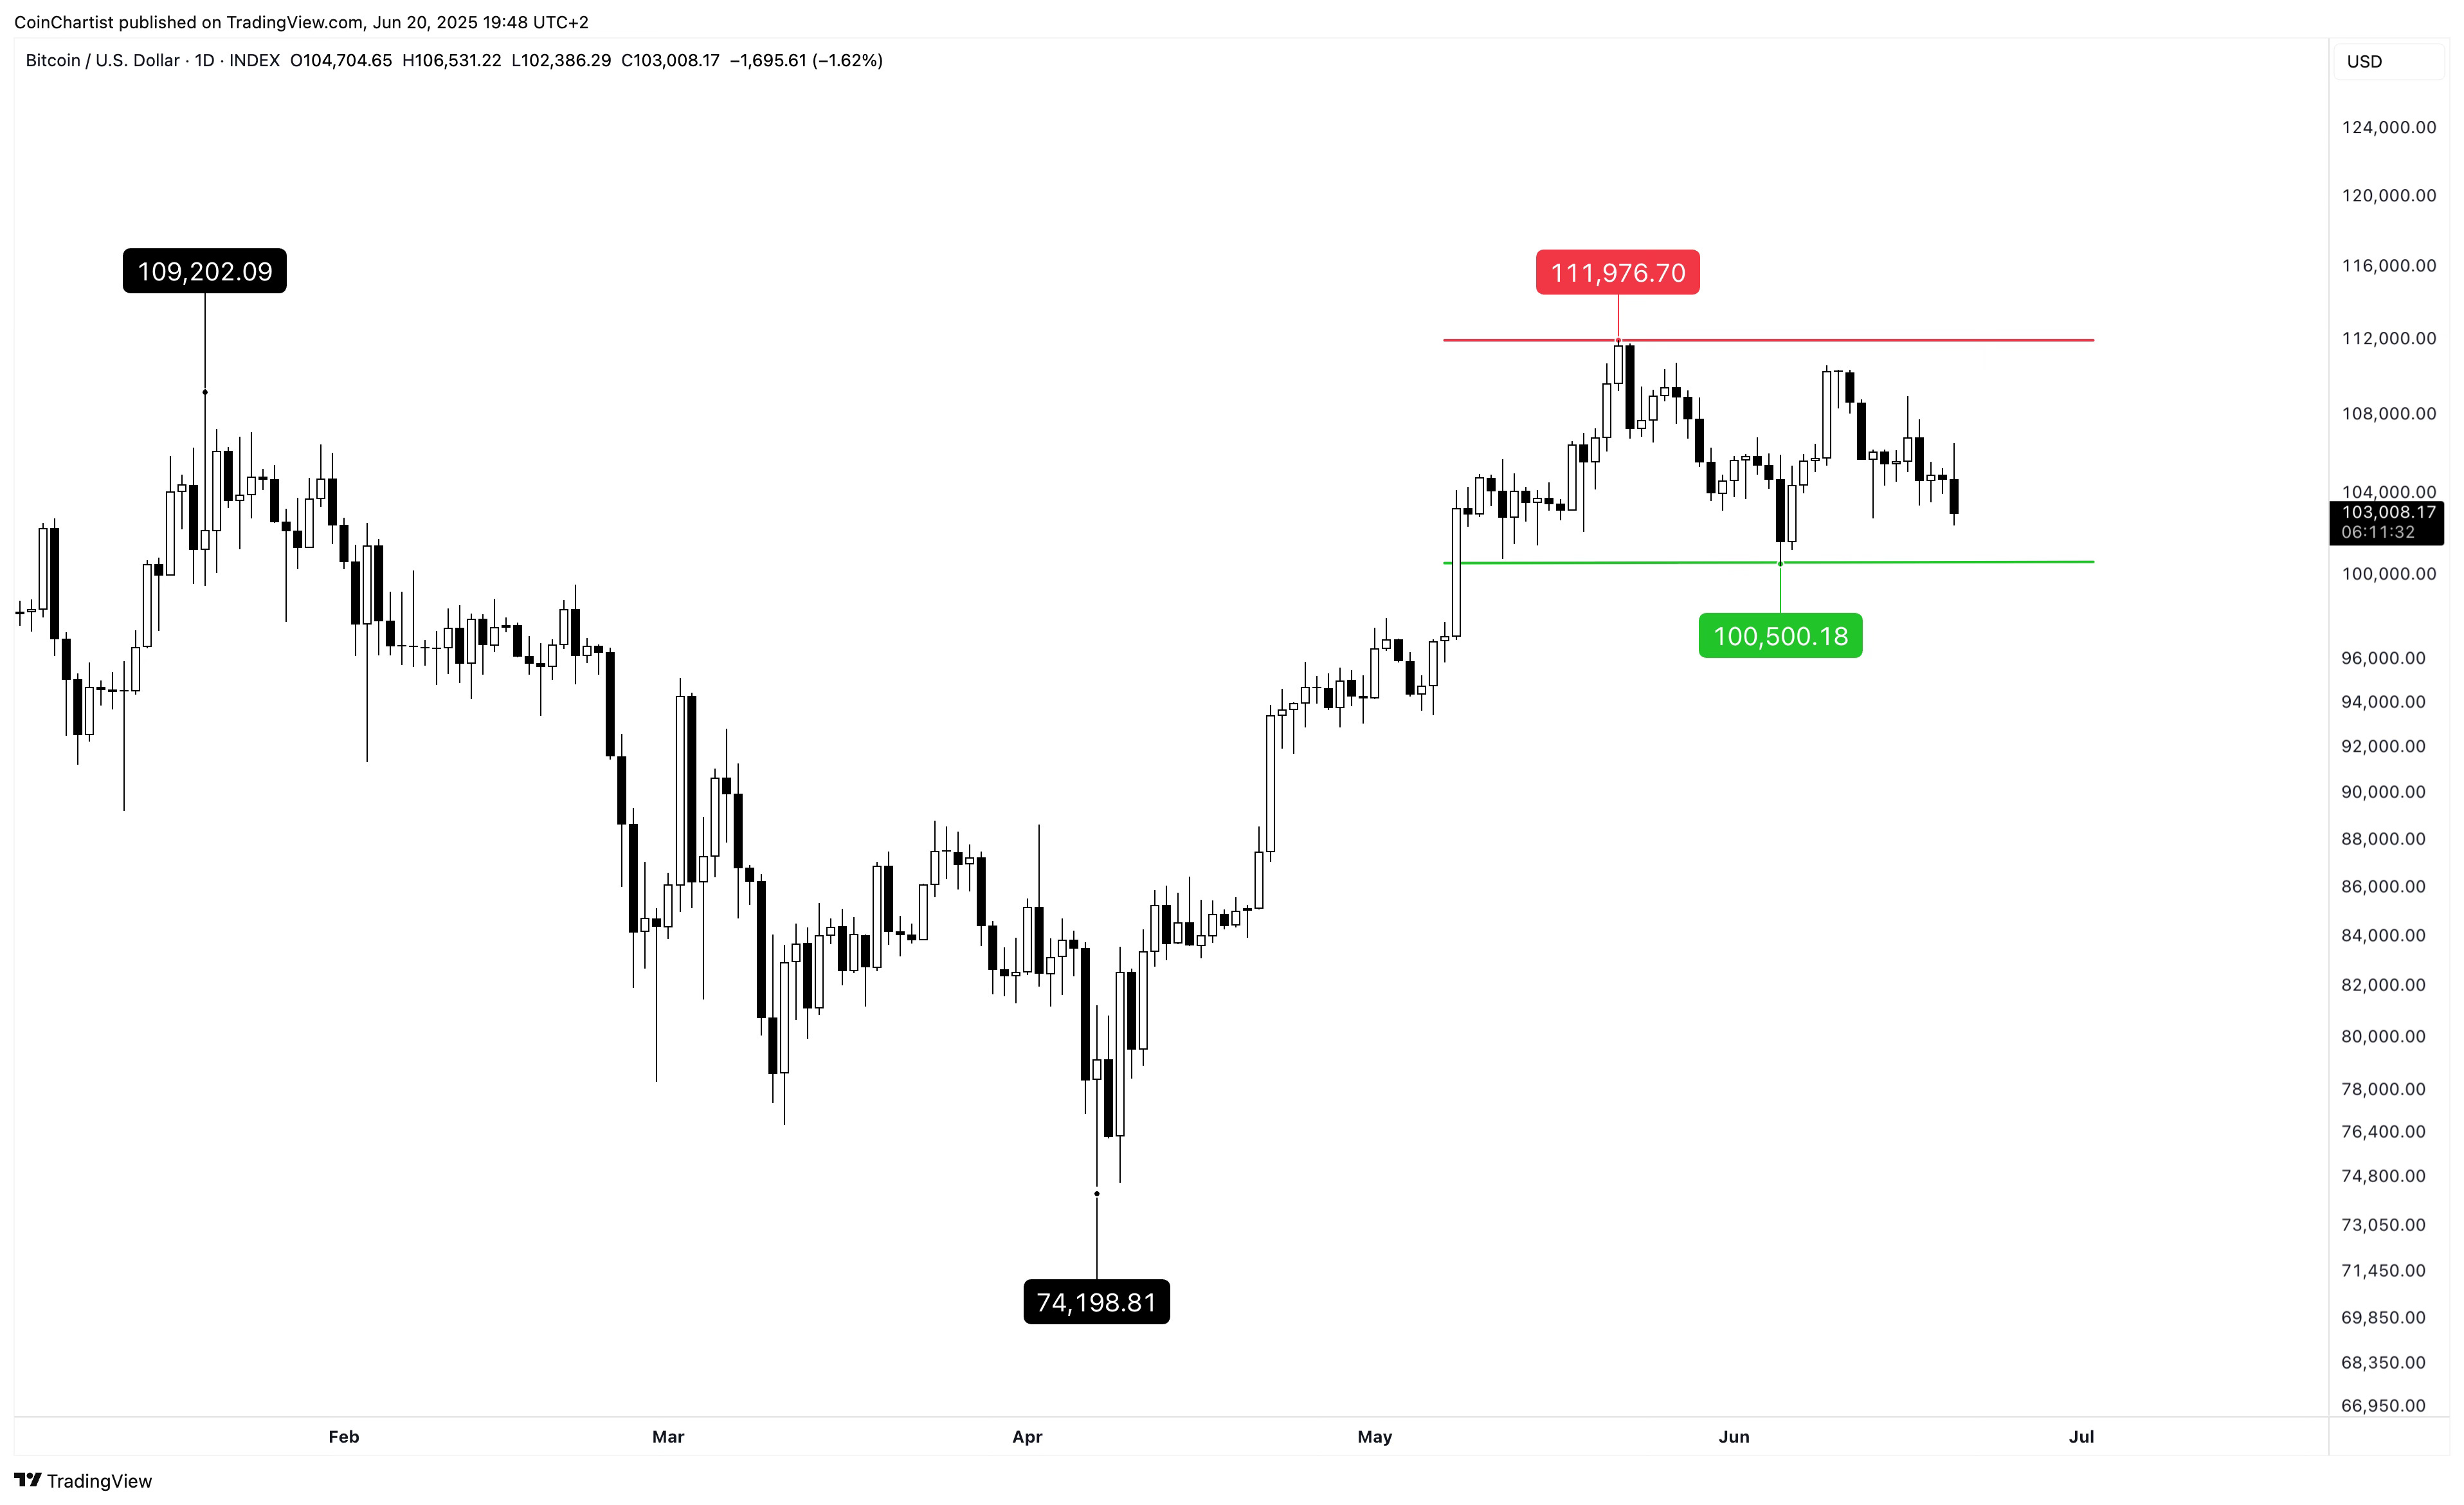
Our current all-time high and local high of the recent range is at $111,976. A clean break above $112,000 on strong volume should lead to a renewed uptrend in Bitcoin. The recent local low is currently located at $100,500.
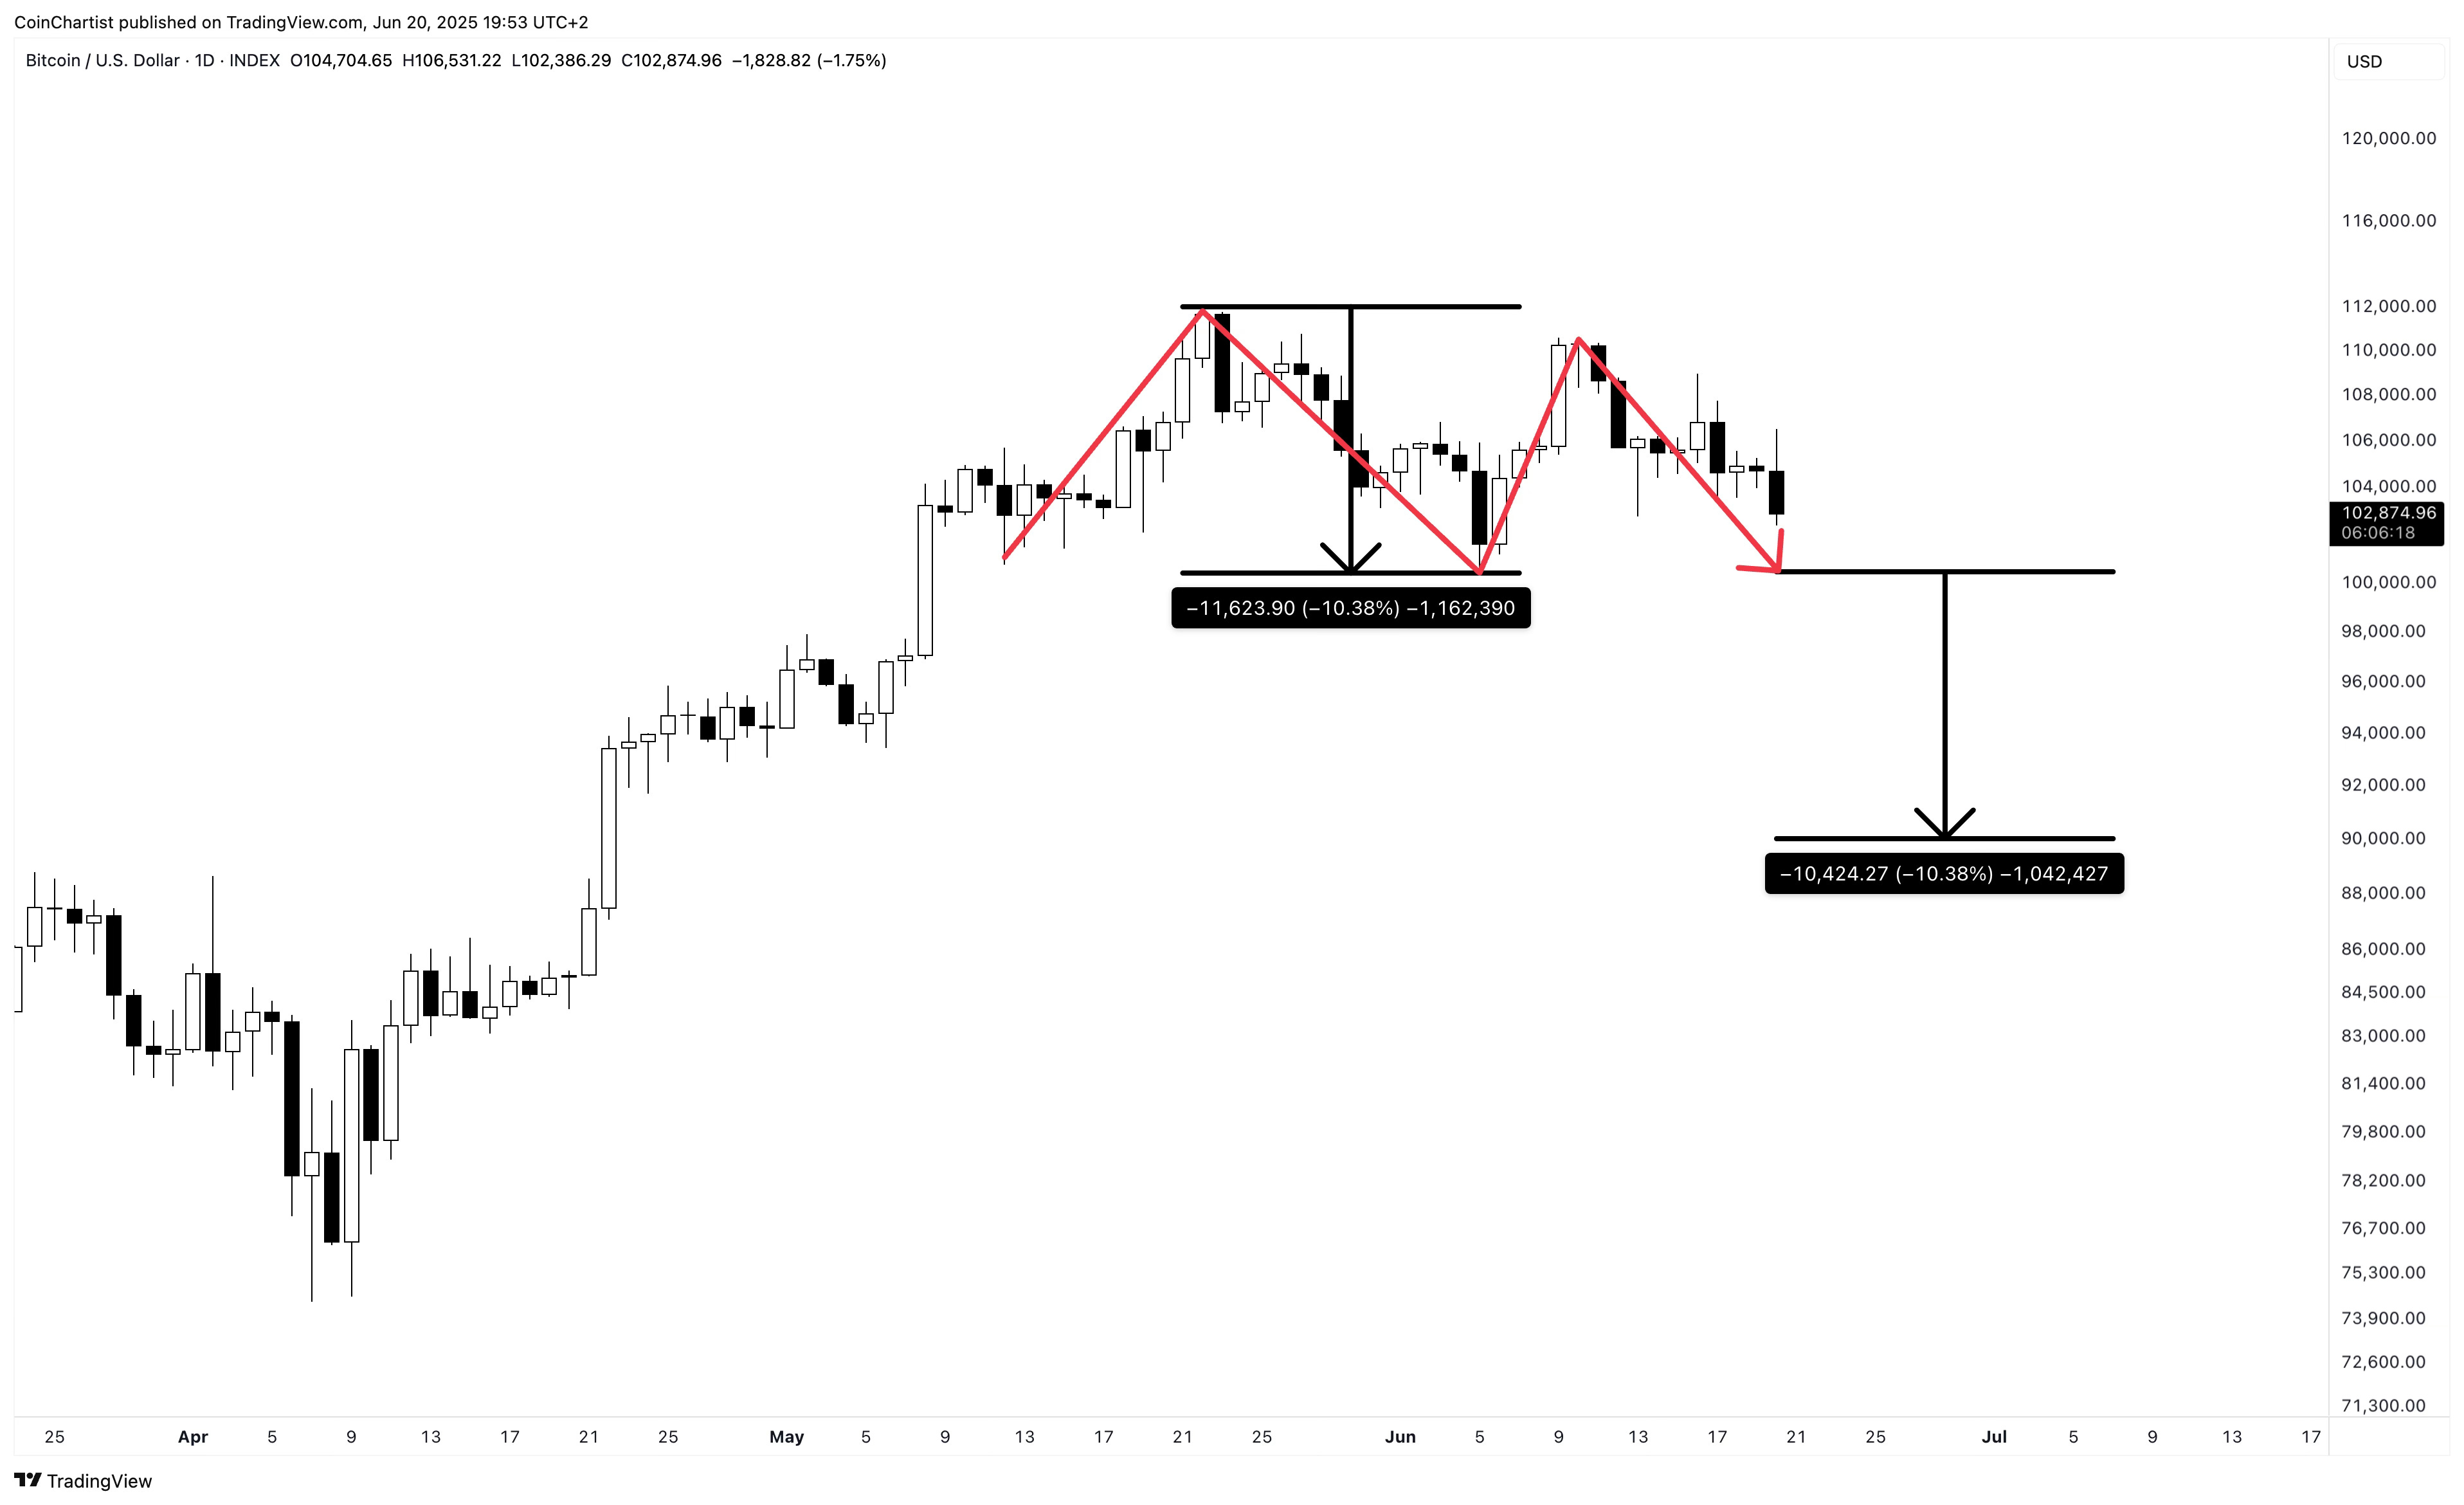
A close below $100,500 could trigger the completion of a M pattern on the daily, with a potential downside target of $90,000.
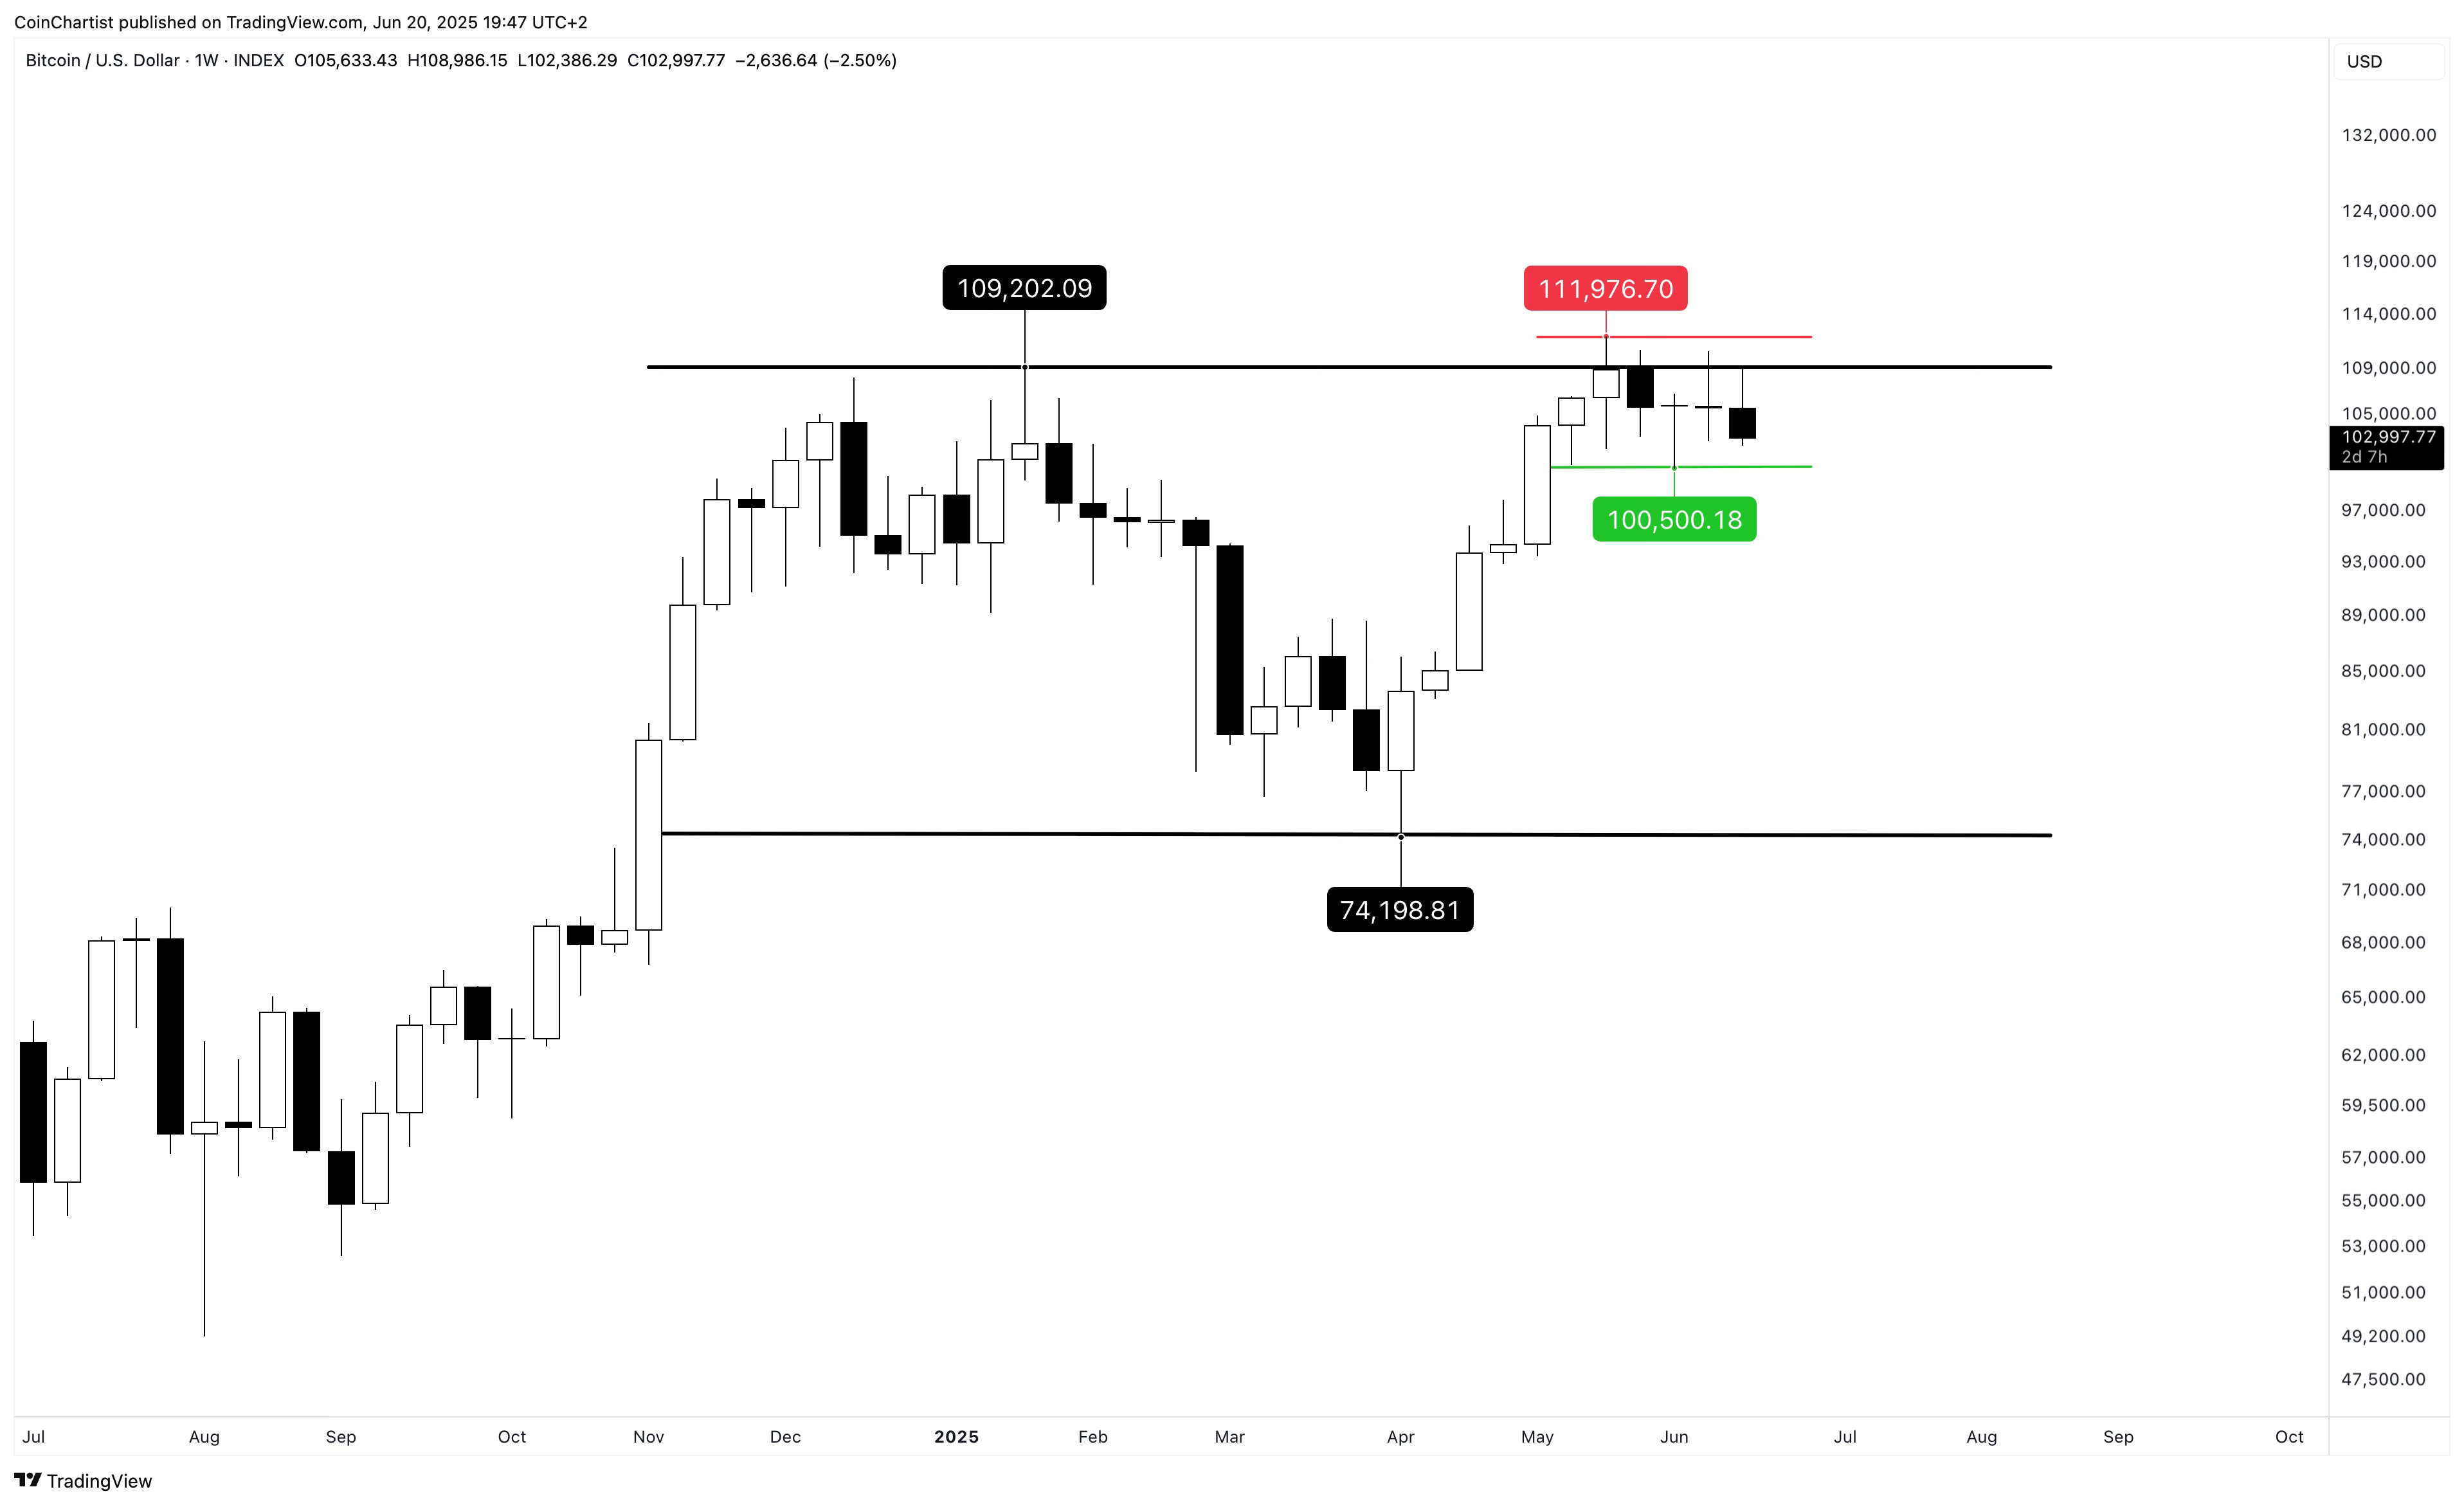
On the weekly timeframe, Bitcoin is now back below our former ATH at $109,202. Bitcoin isn’t in any sort of real trouble unless a move below the 2025 low is made. This low is set at $74,198.
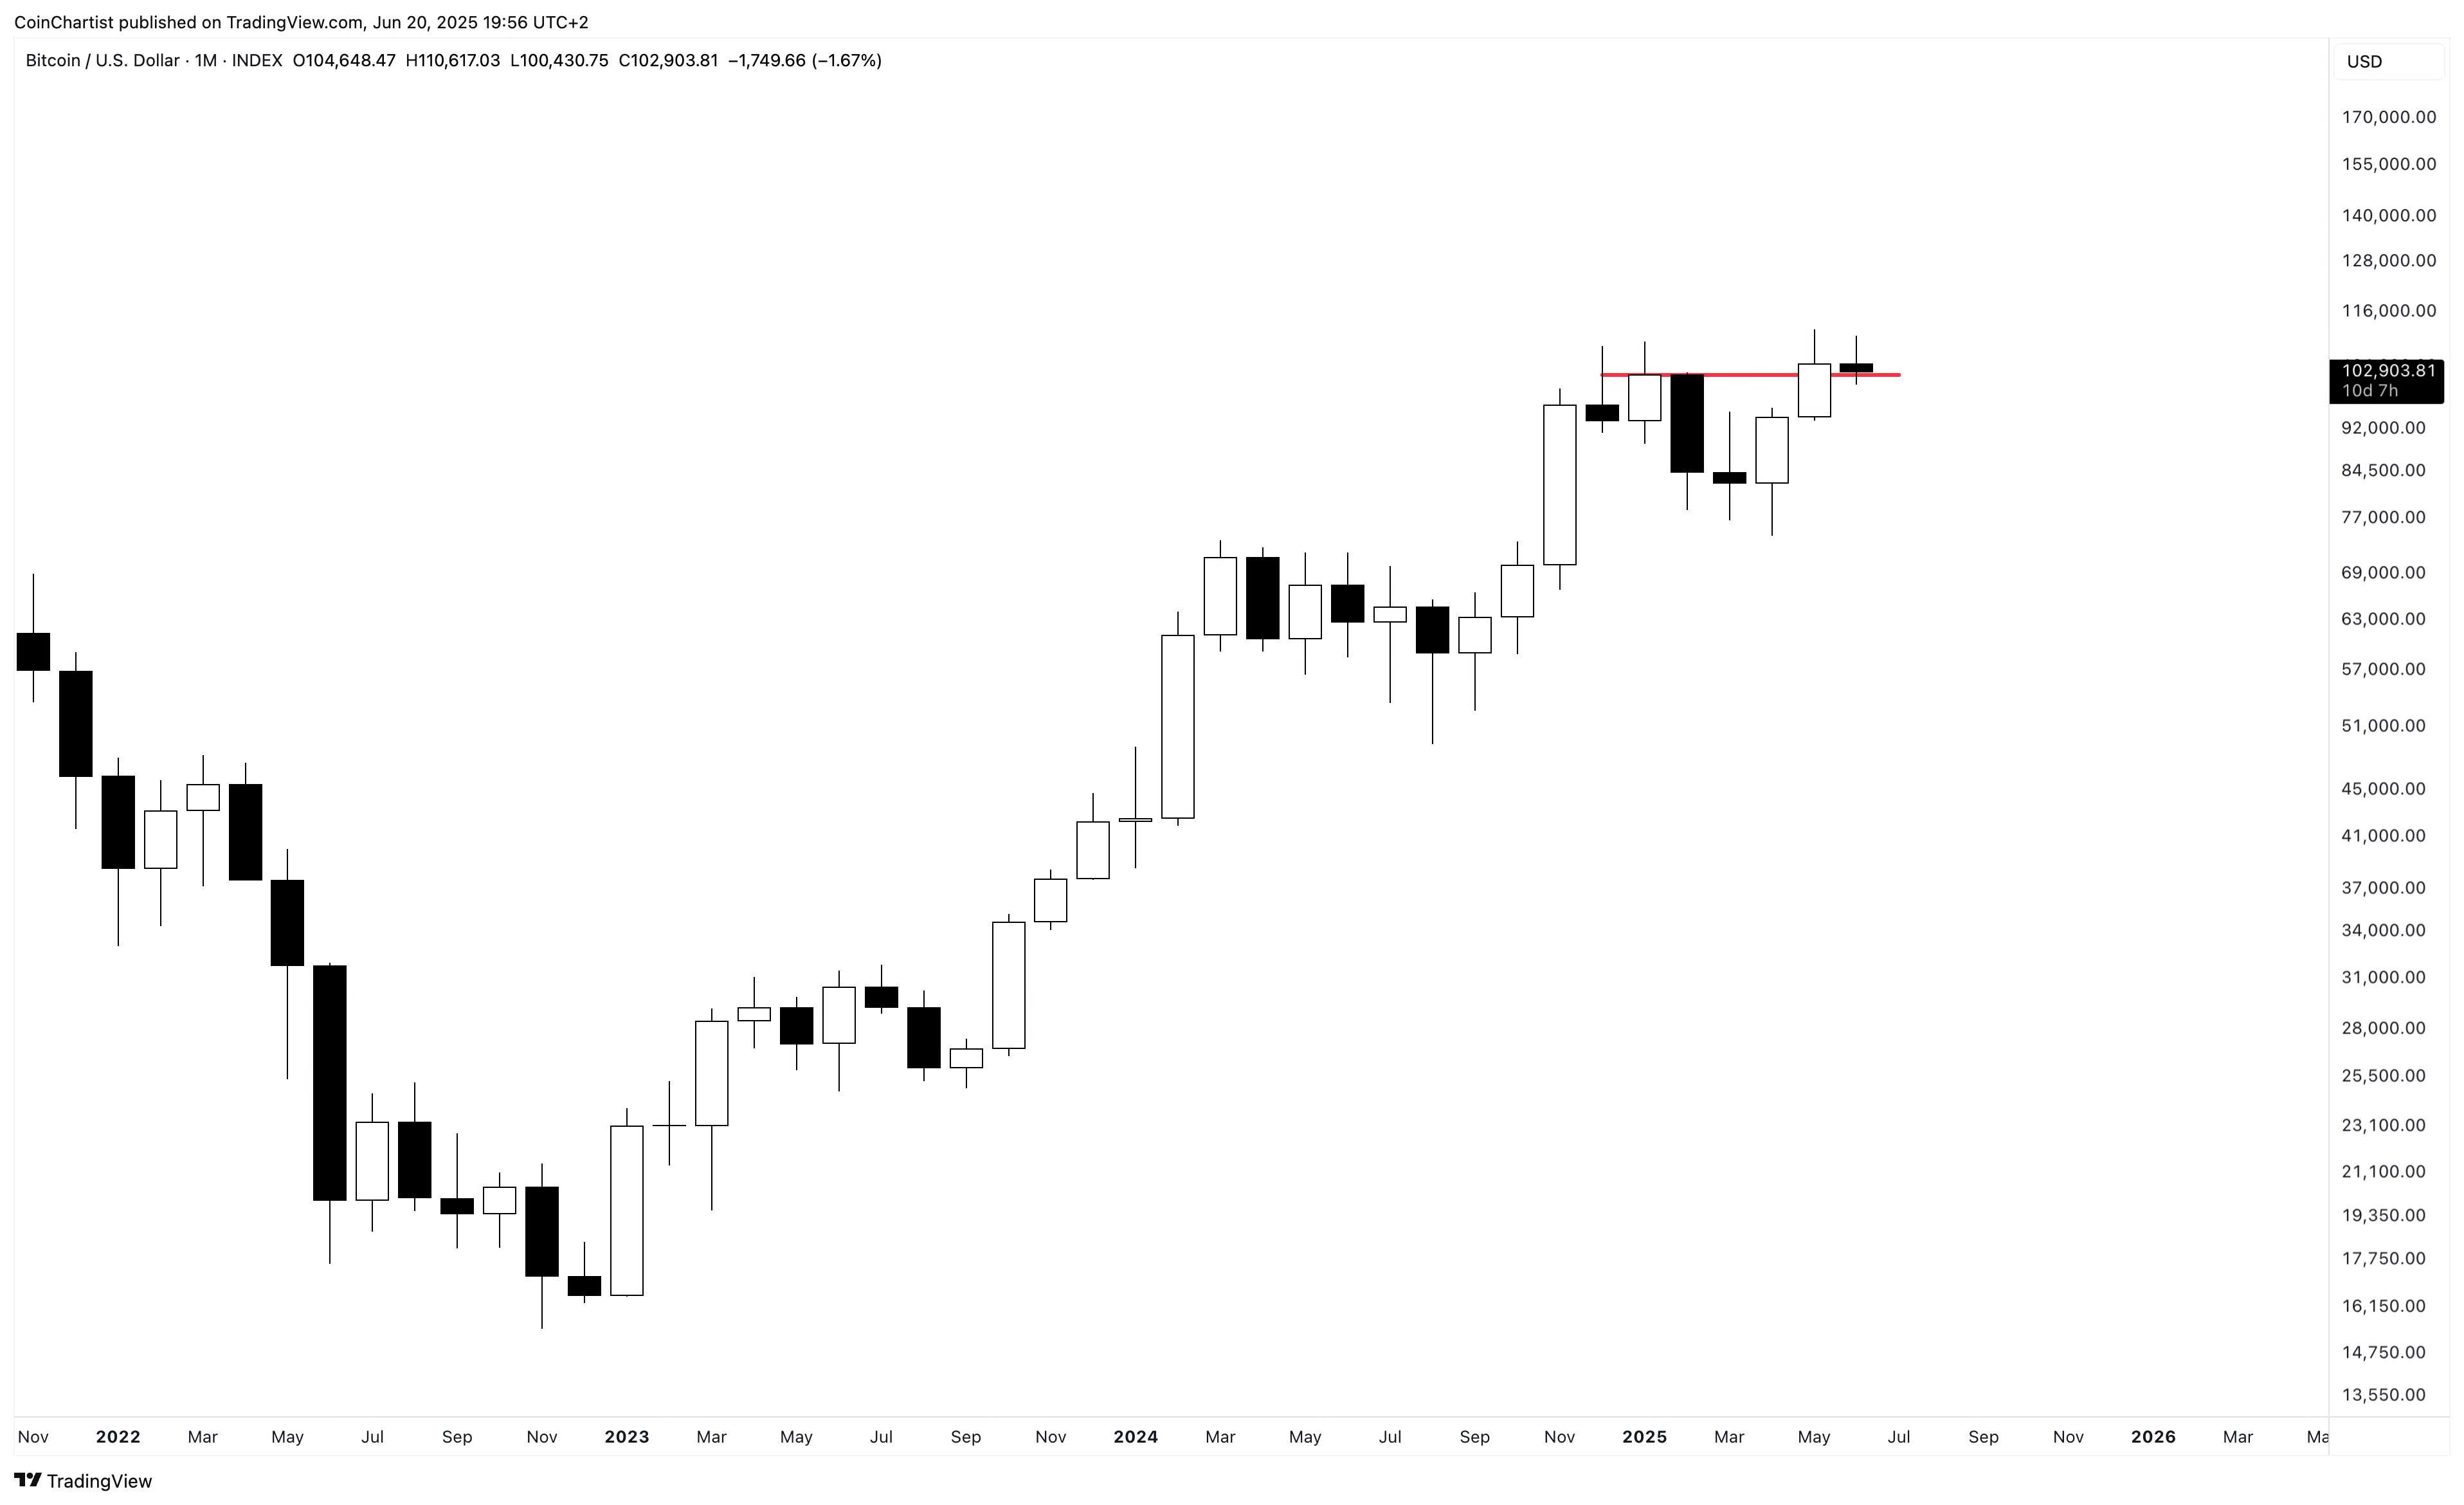
The June monthly candlestick is currently a Doji, which is attempting to hold above the closing price of our early 2025 ATH candlestick. A Doji represents a pause from indecision. Bulls want to see July turn into a large white candlestick and continuation higher, while bears want to see reversal in July back towards the $74,000 level outlined on the weekly chart.
Domino Effect
Low timeframes can have a domino effect on higher timeframes. For example, the hourly turning bullish, could then turn the daily bullish after several hours, which could turn the weekly bullish after several days.
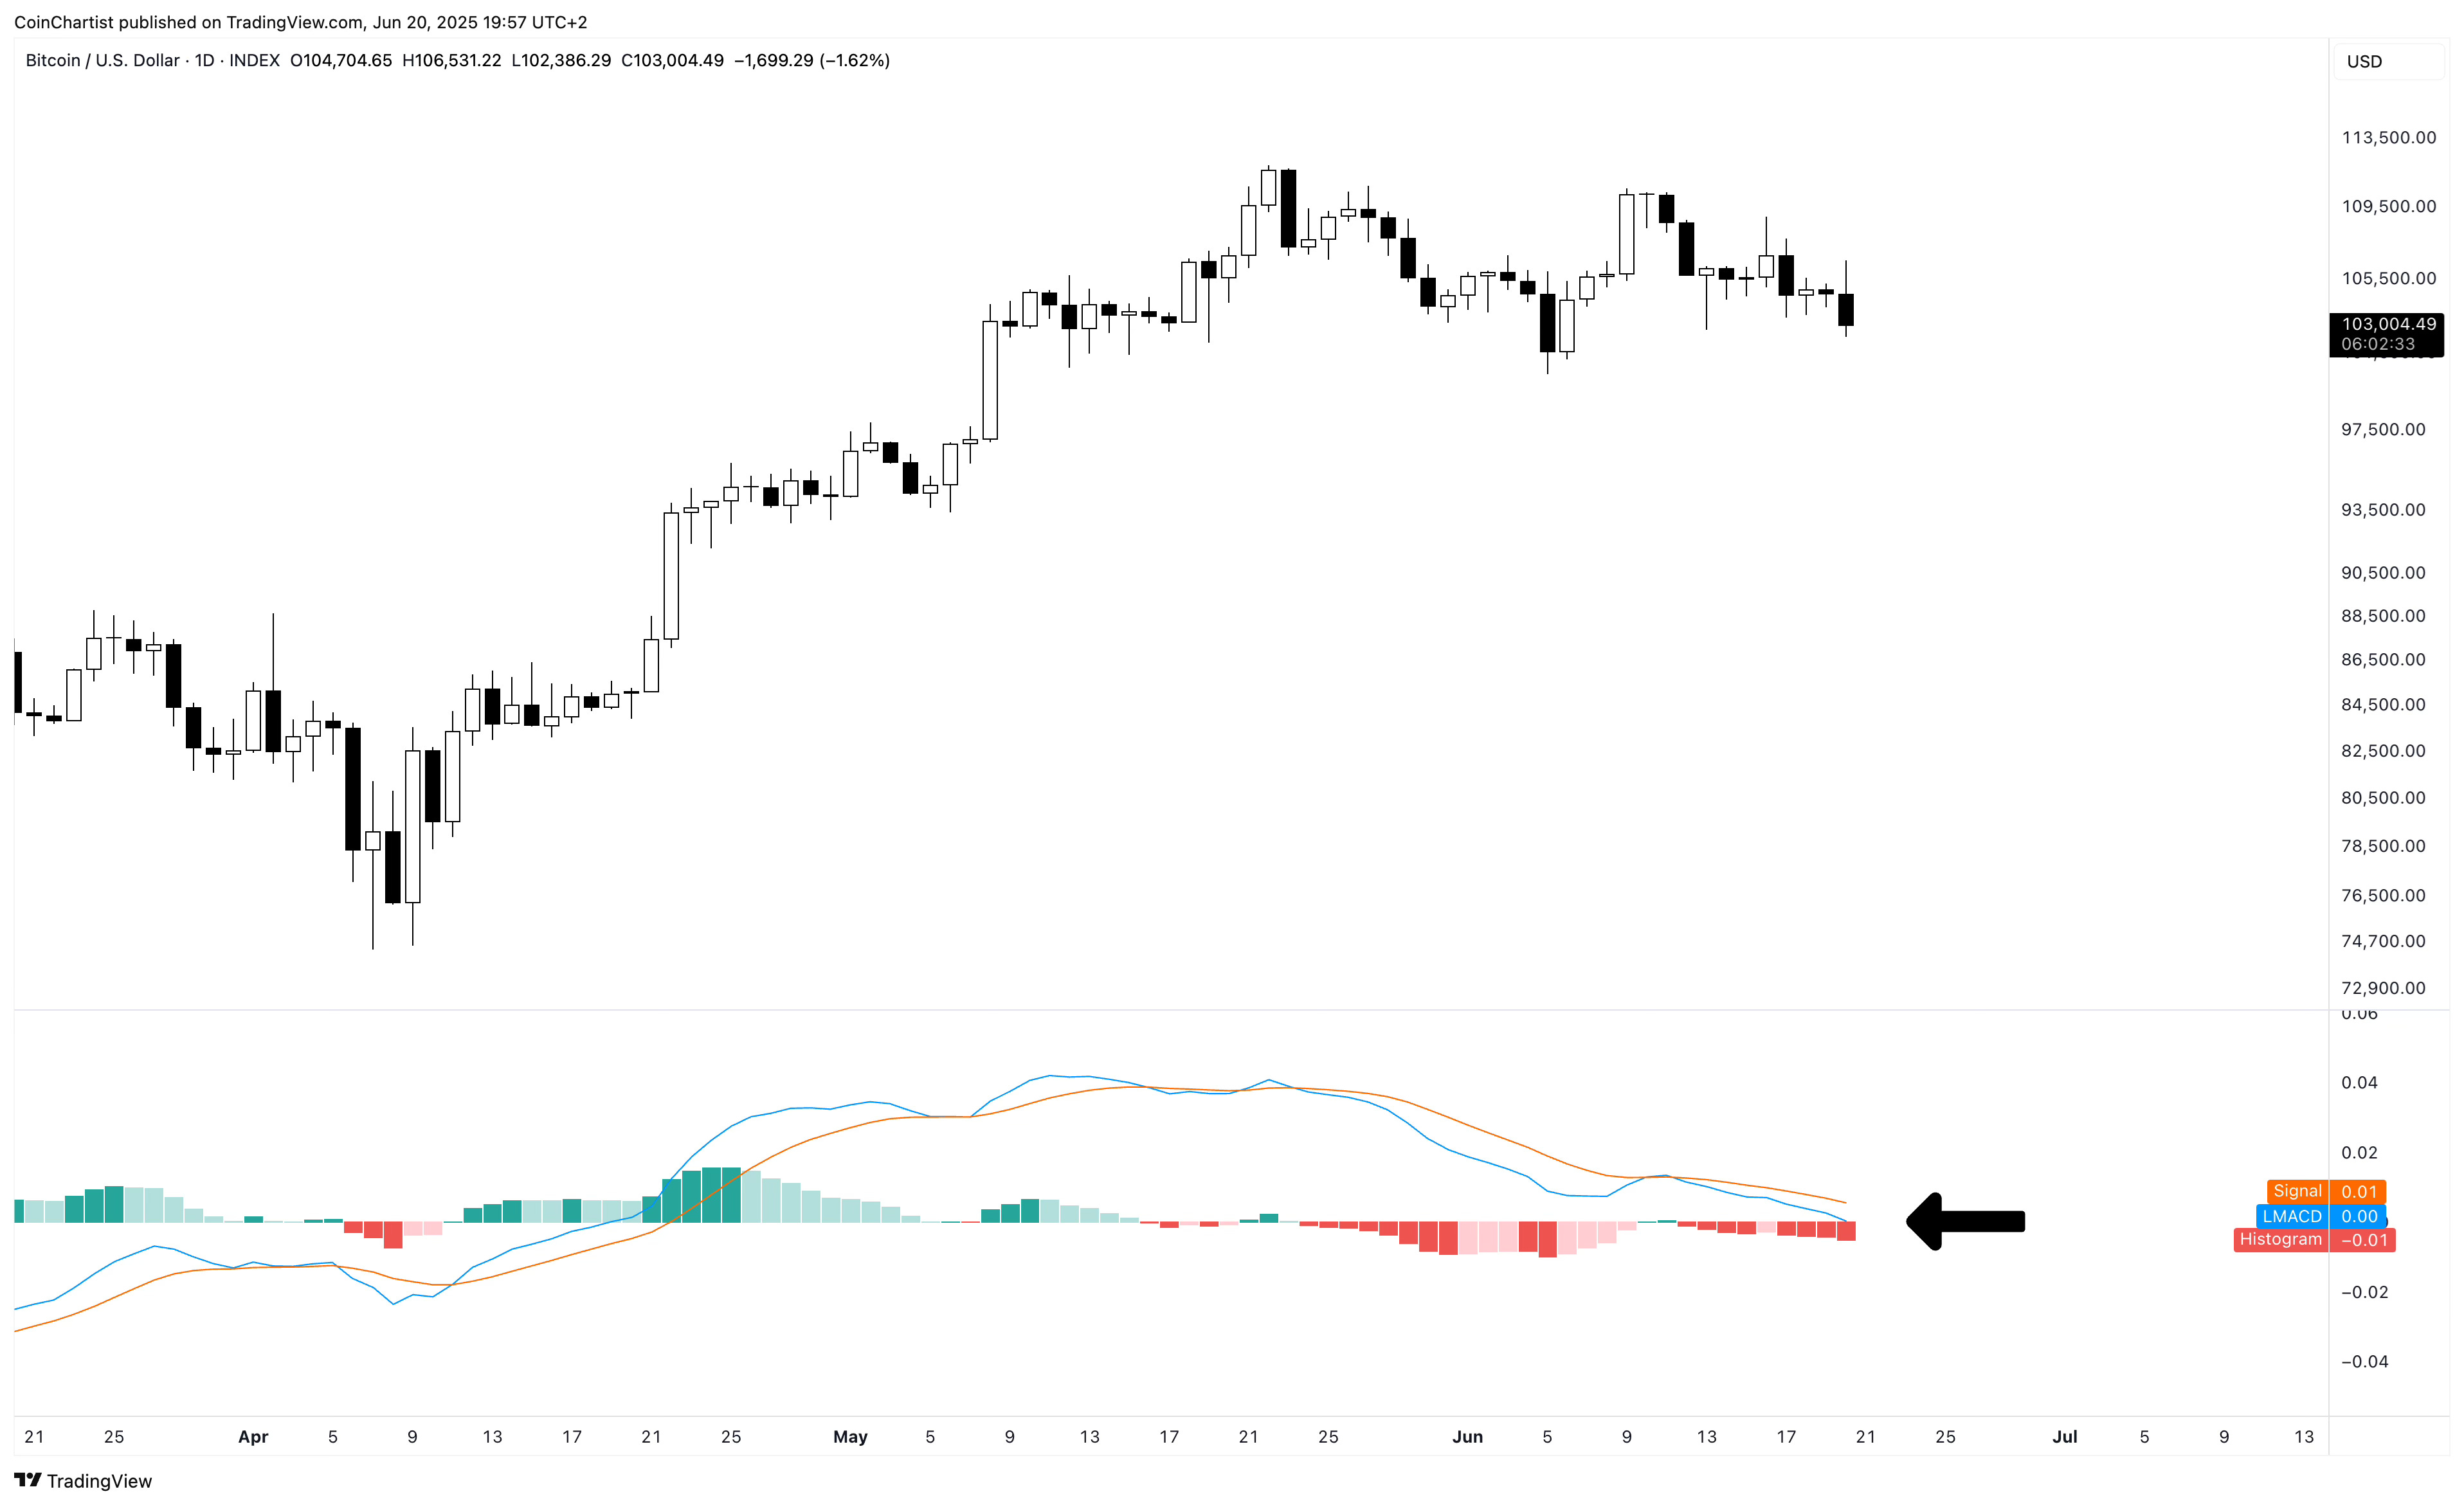
Bitcoin’s daily momentum is heavily bearish for most of June, and is now approaching a fall below the zero line on the LMACD. This line is like a trigger for price, highlighting a key inflection point for a momentum change.
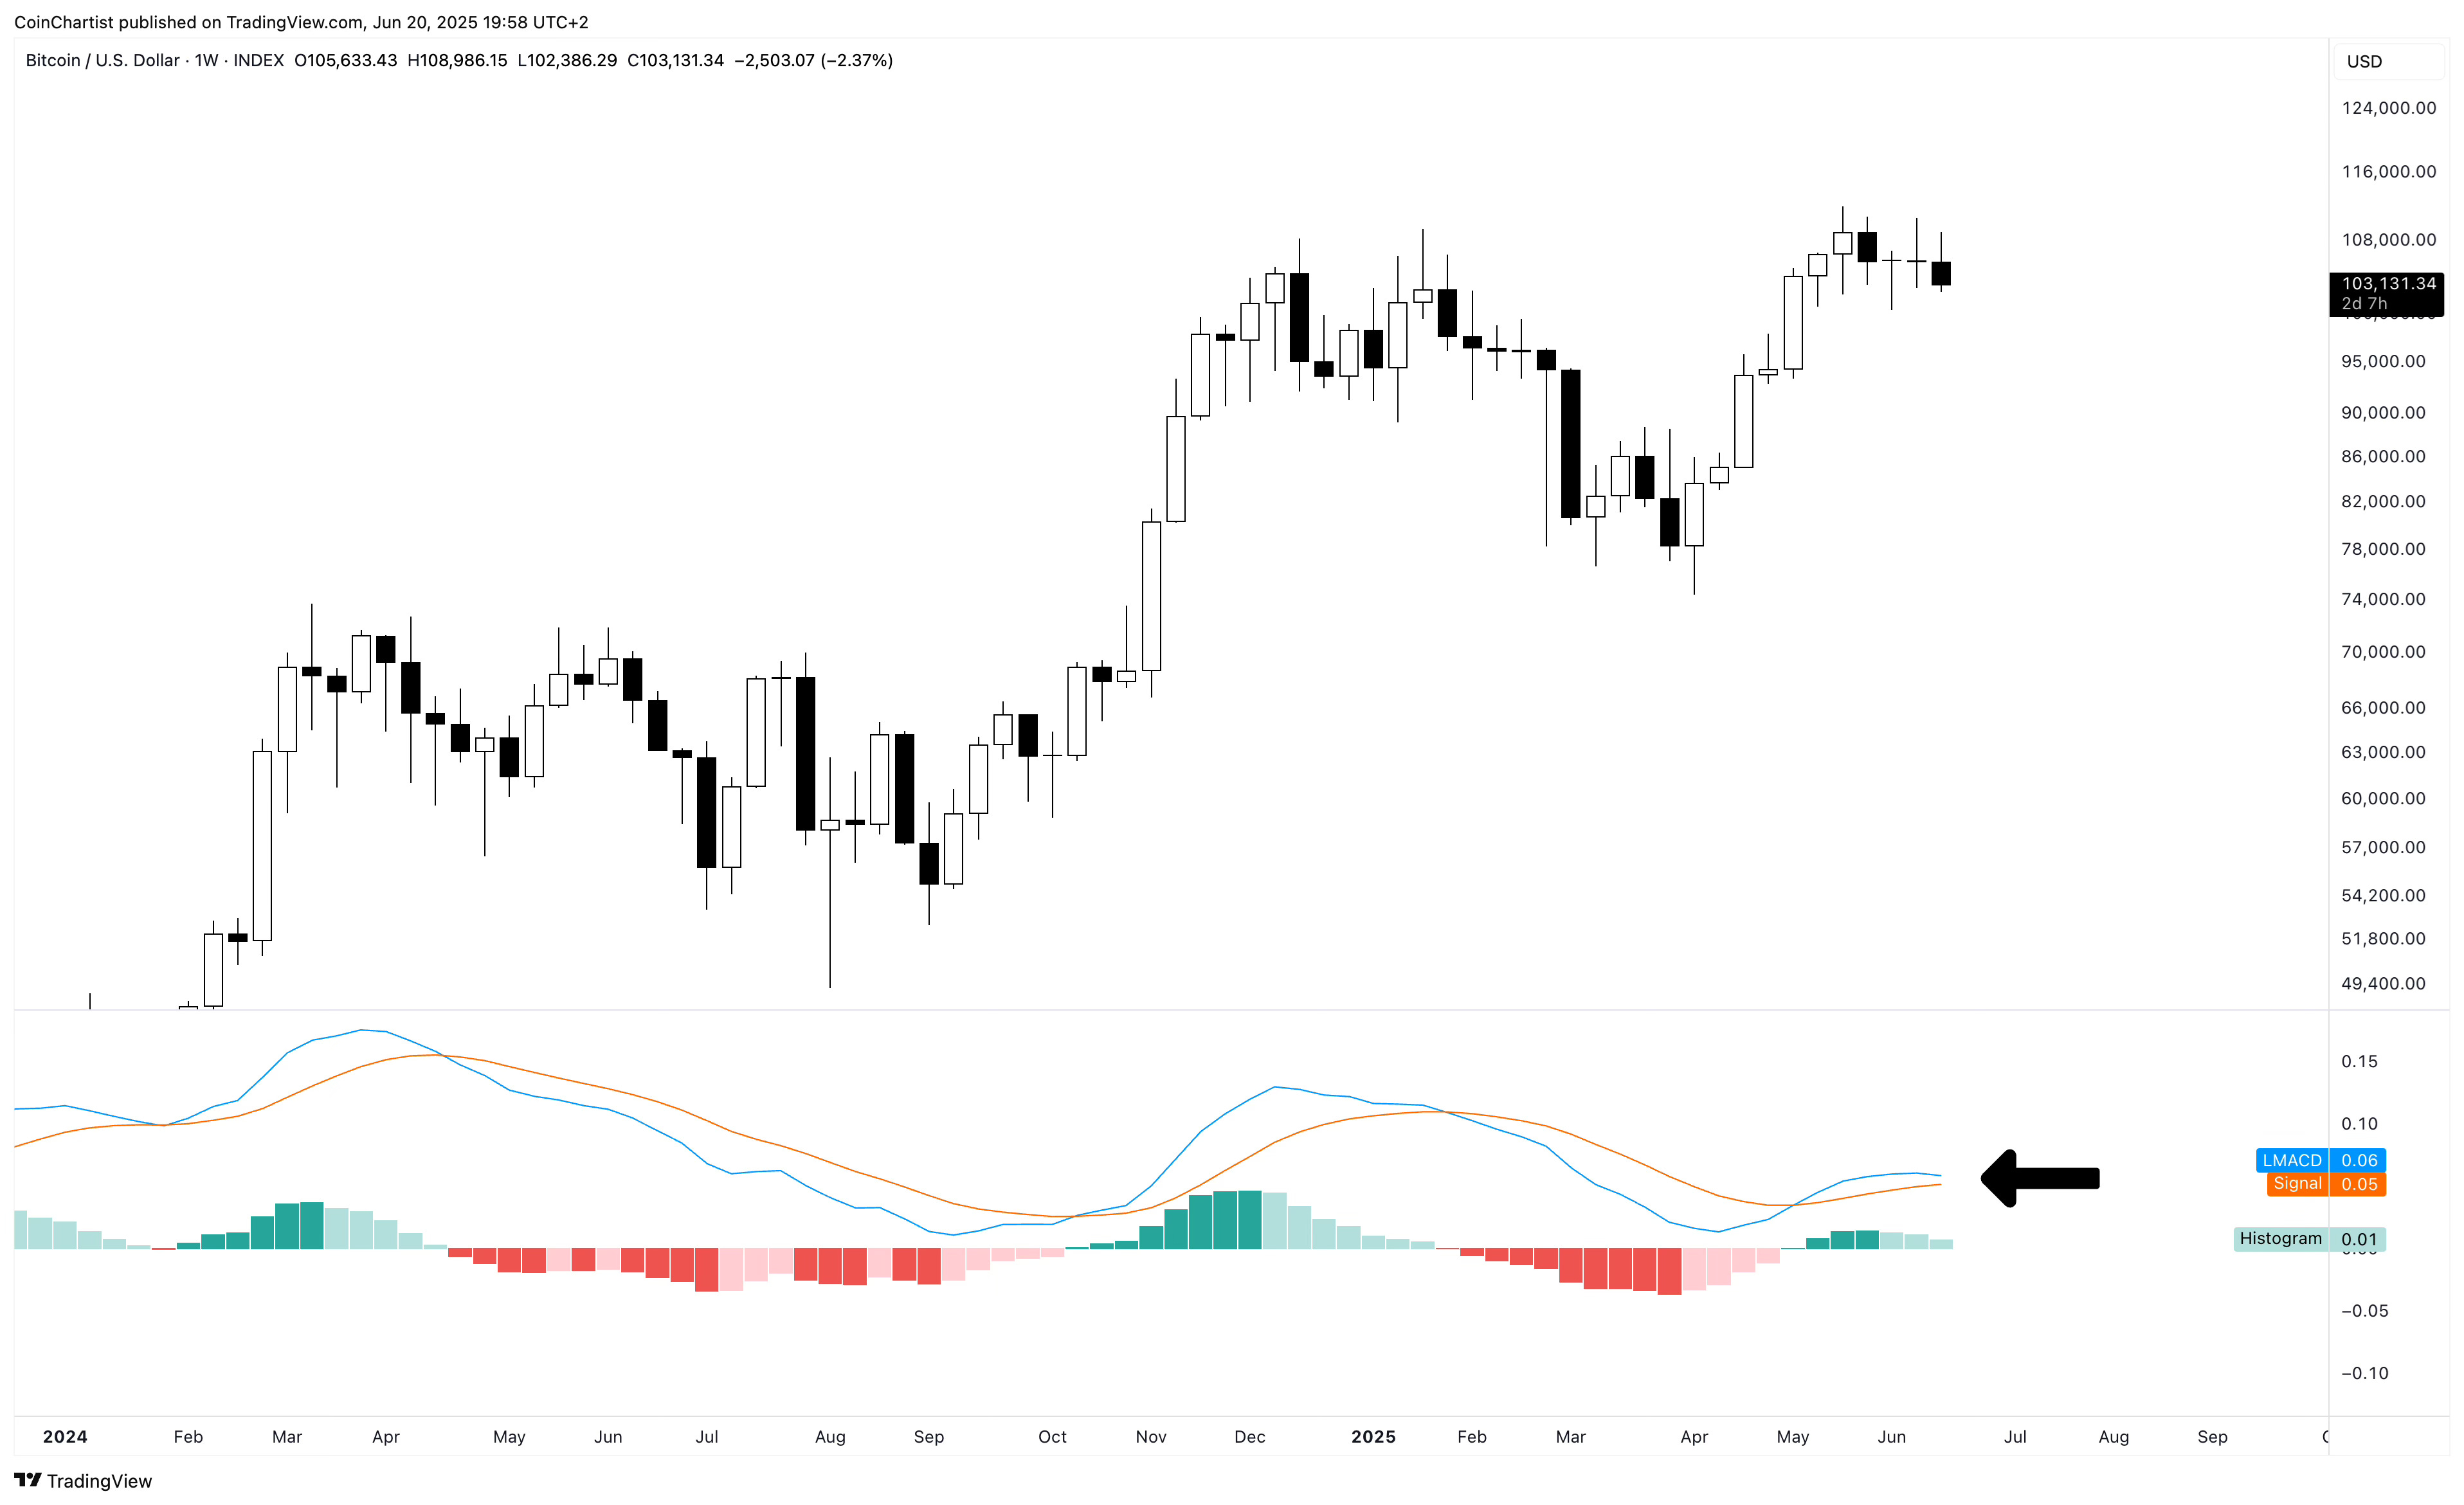
The weekly is still crossed bullish and above the zero line on the LMACD. However, the daily being bearish for so long, is starting to turn the weekly histogram light green, which denotes weakening bullish momentum. Even though price made a new high, the indicator didn't, which hints at a possible bearish divergence. If the daily pushes down lower, it could be enough to cross the weekly LMACD bearish and bring it closer to the zero line.
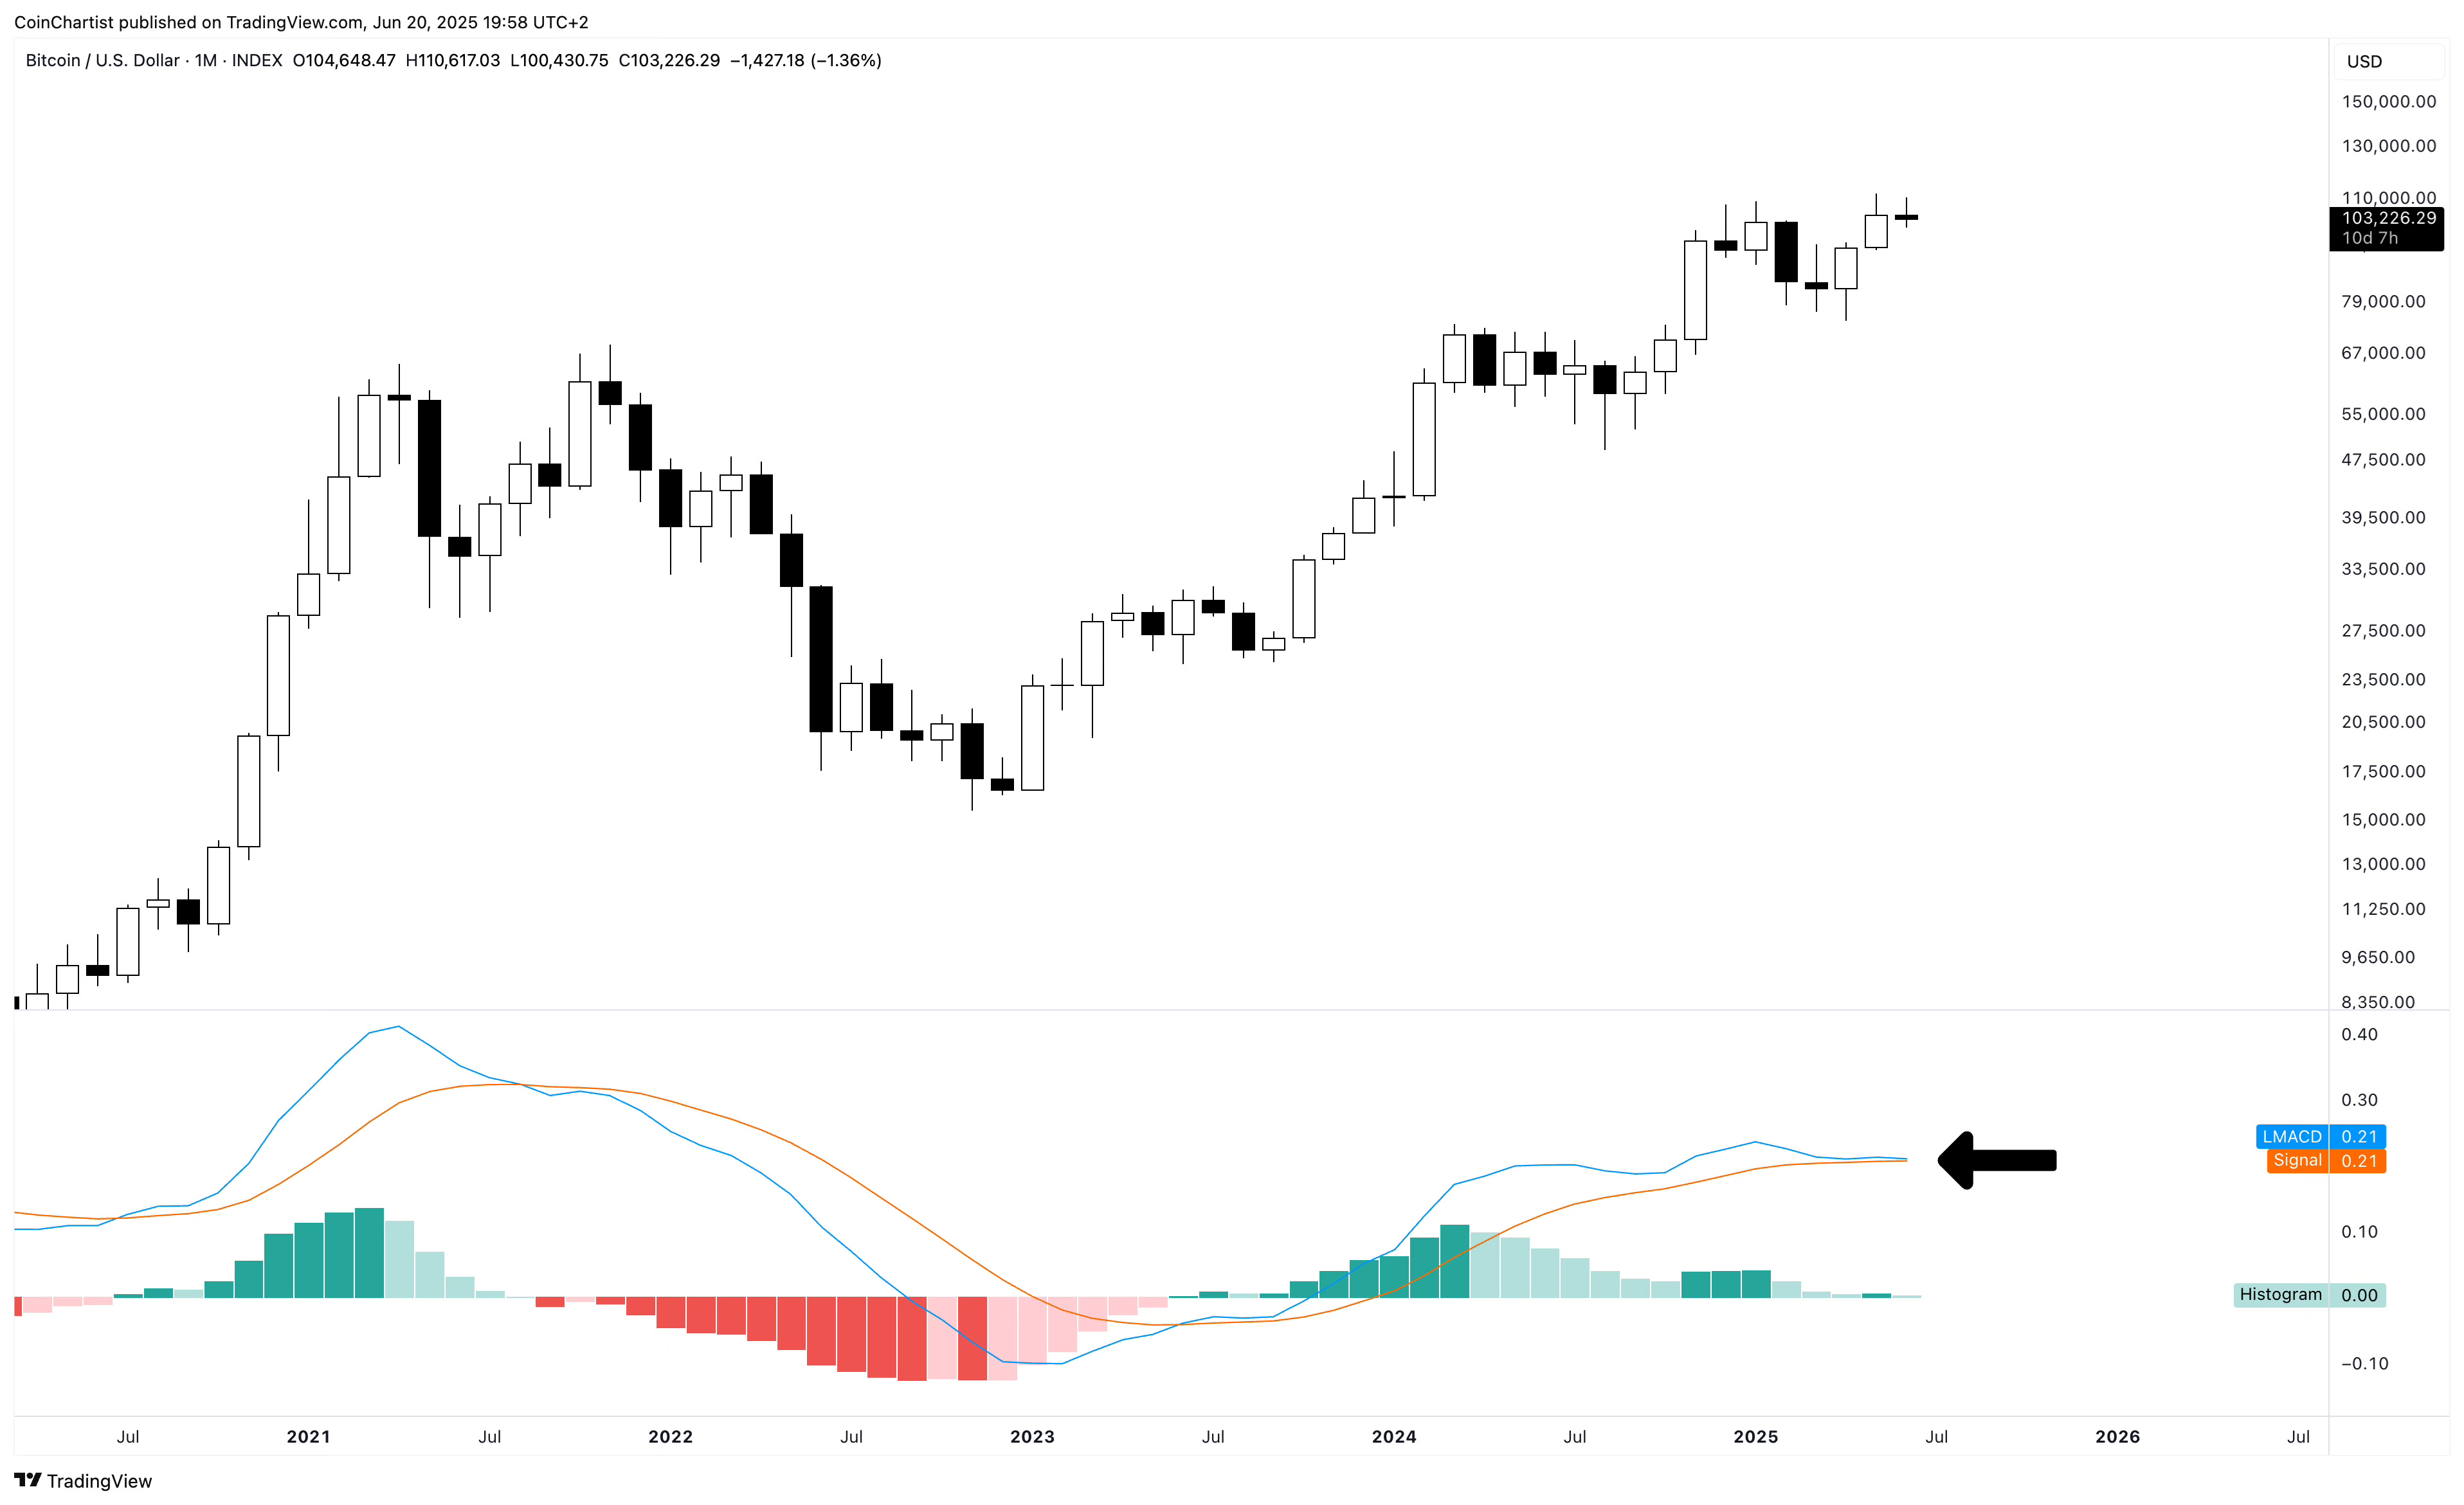
A bearish crossover on the weekly would most definitely pull down the monthly back into a bearish crossover. The LMACD opened with a bearish crossover in March or April, but bulls managed to uncross it before the month was over. Bulls still have work to do to defend another monthly crossover either before the end of June, or during the month of July.
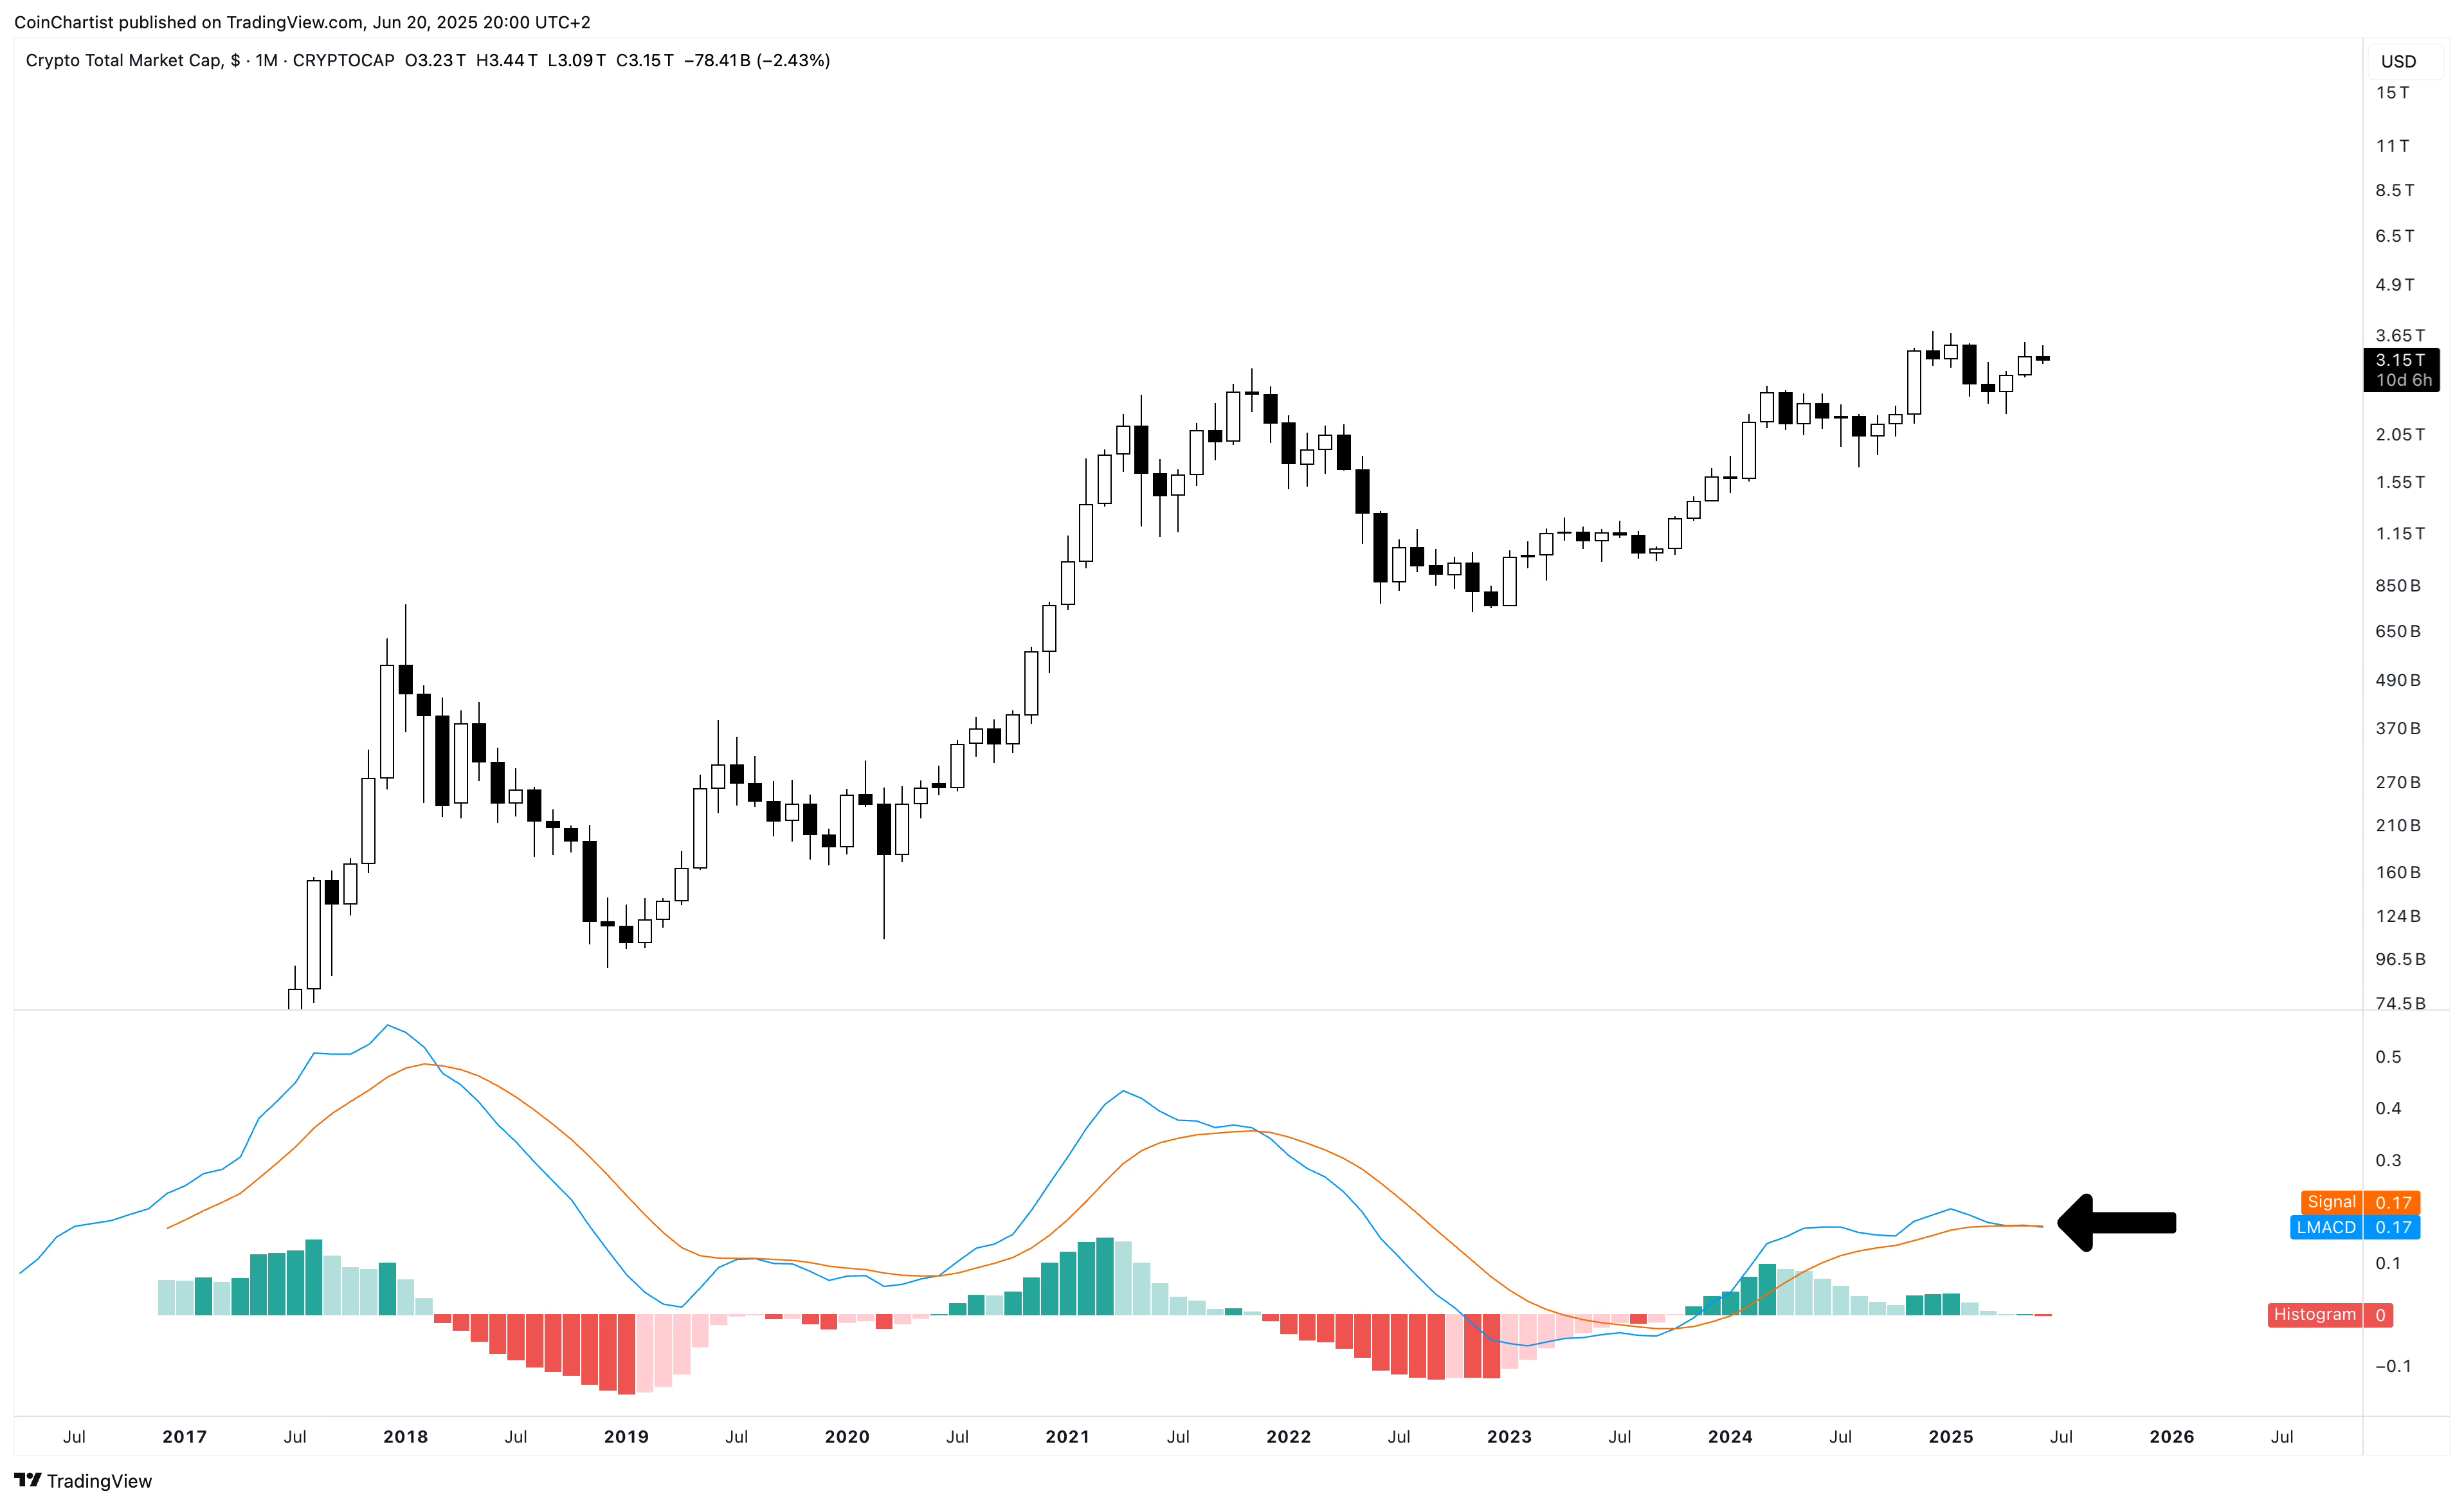
The TOTAL crypto market cap chart is back to showing a monthly bearish crossover. If bulls cannot uncross it within ten days, it will confirm on the chart. That doesn’t necessarily mean instant downtrend, but it certainly suggests that momentum is toppling over. It could also mean an extended period of sideways before crossing bullish again, as I have stressed in past issues.
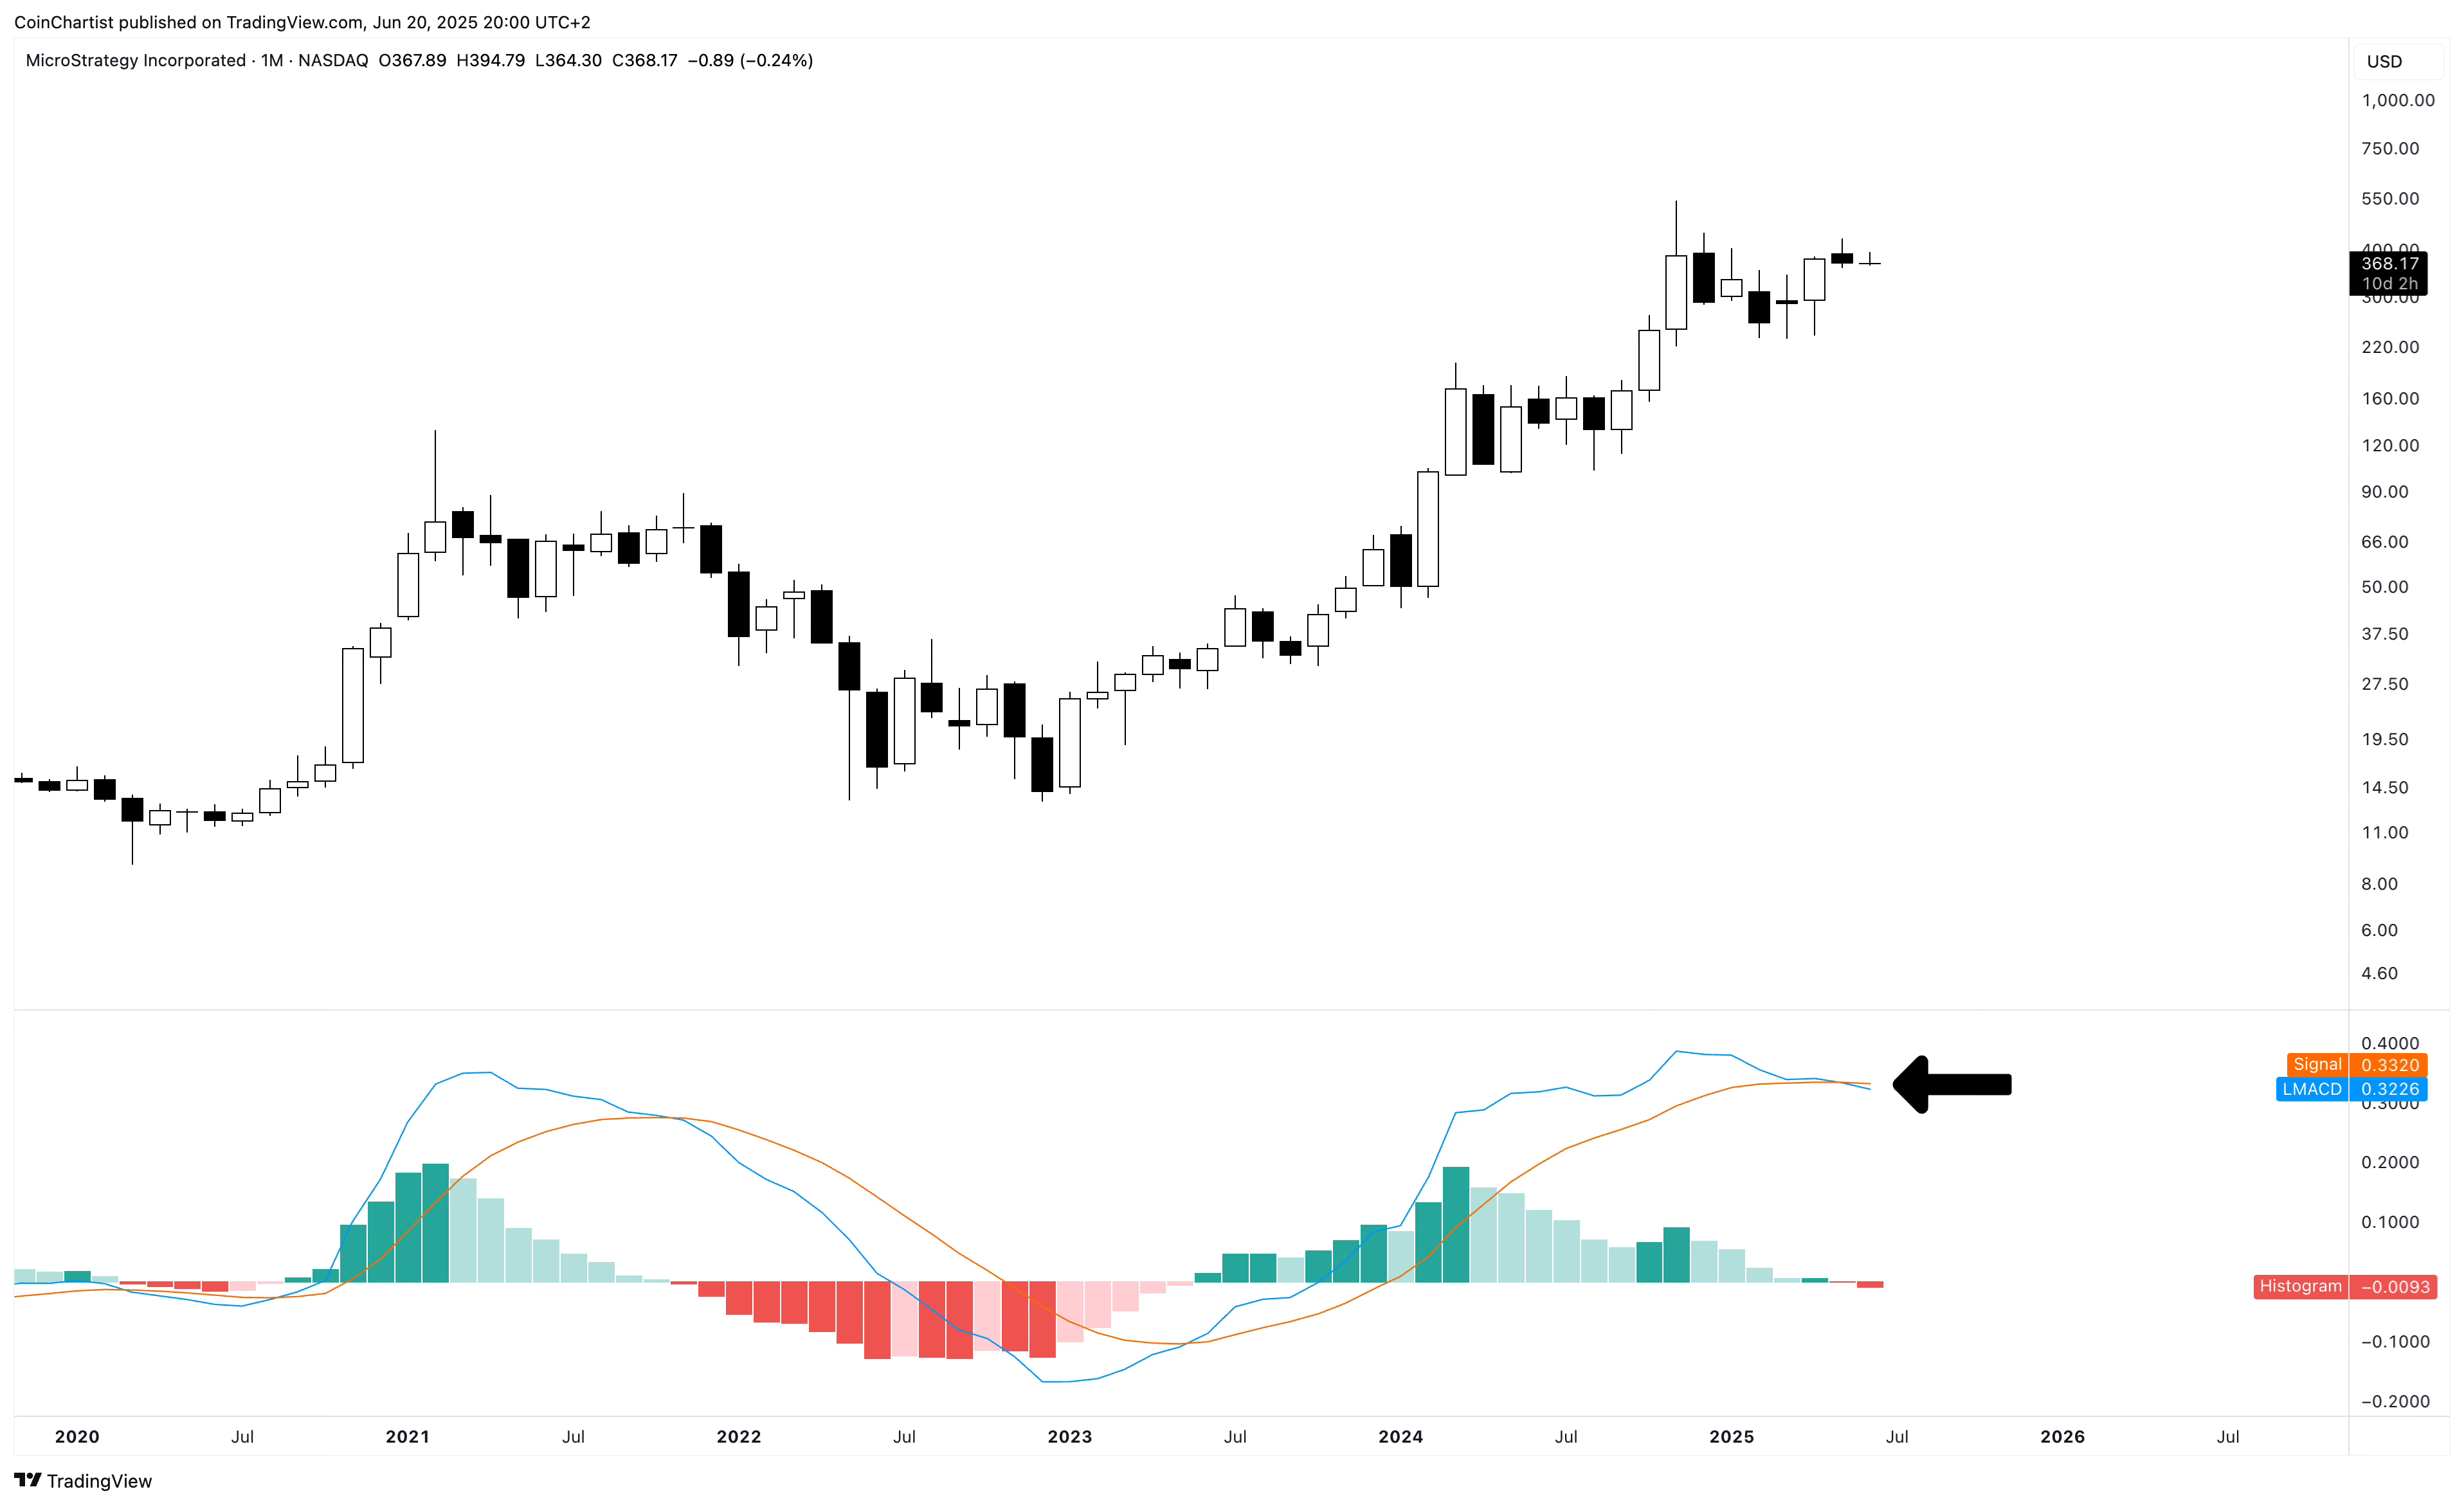
MSTR shares are showing the second month of a bearish crossover on the LMACD. Unlike Bitcoin, MSTR made a lower high in price. If MSTR makes a lower low from here, combined with momentum crossing bearish, it would increase the probability of a larger correction and downtrend.
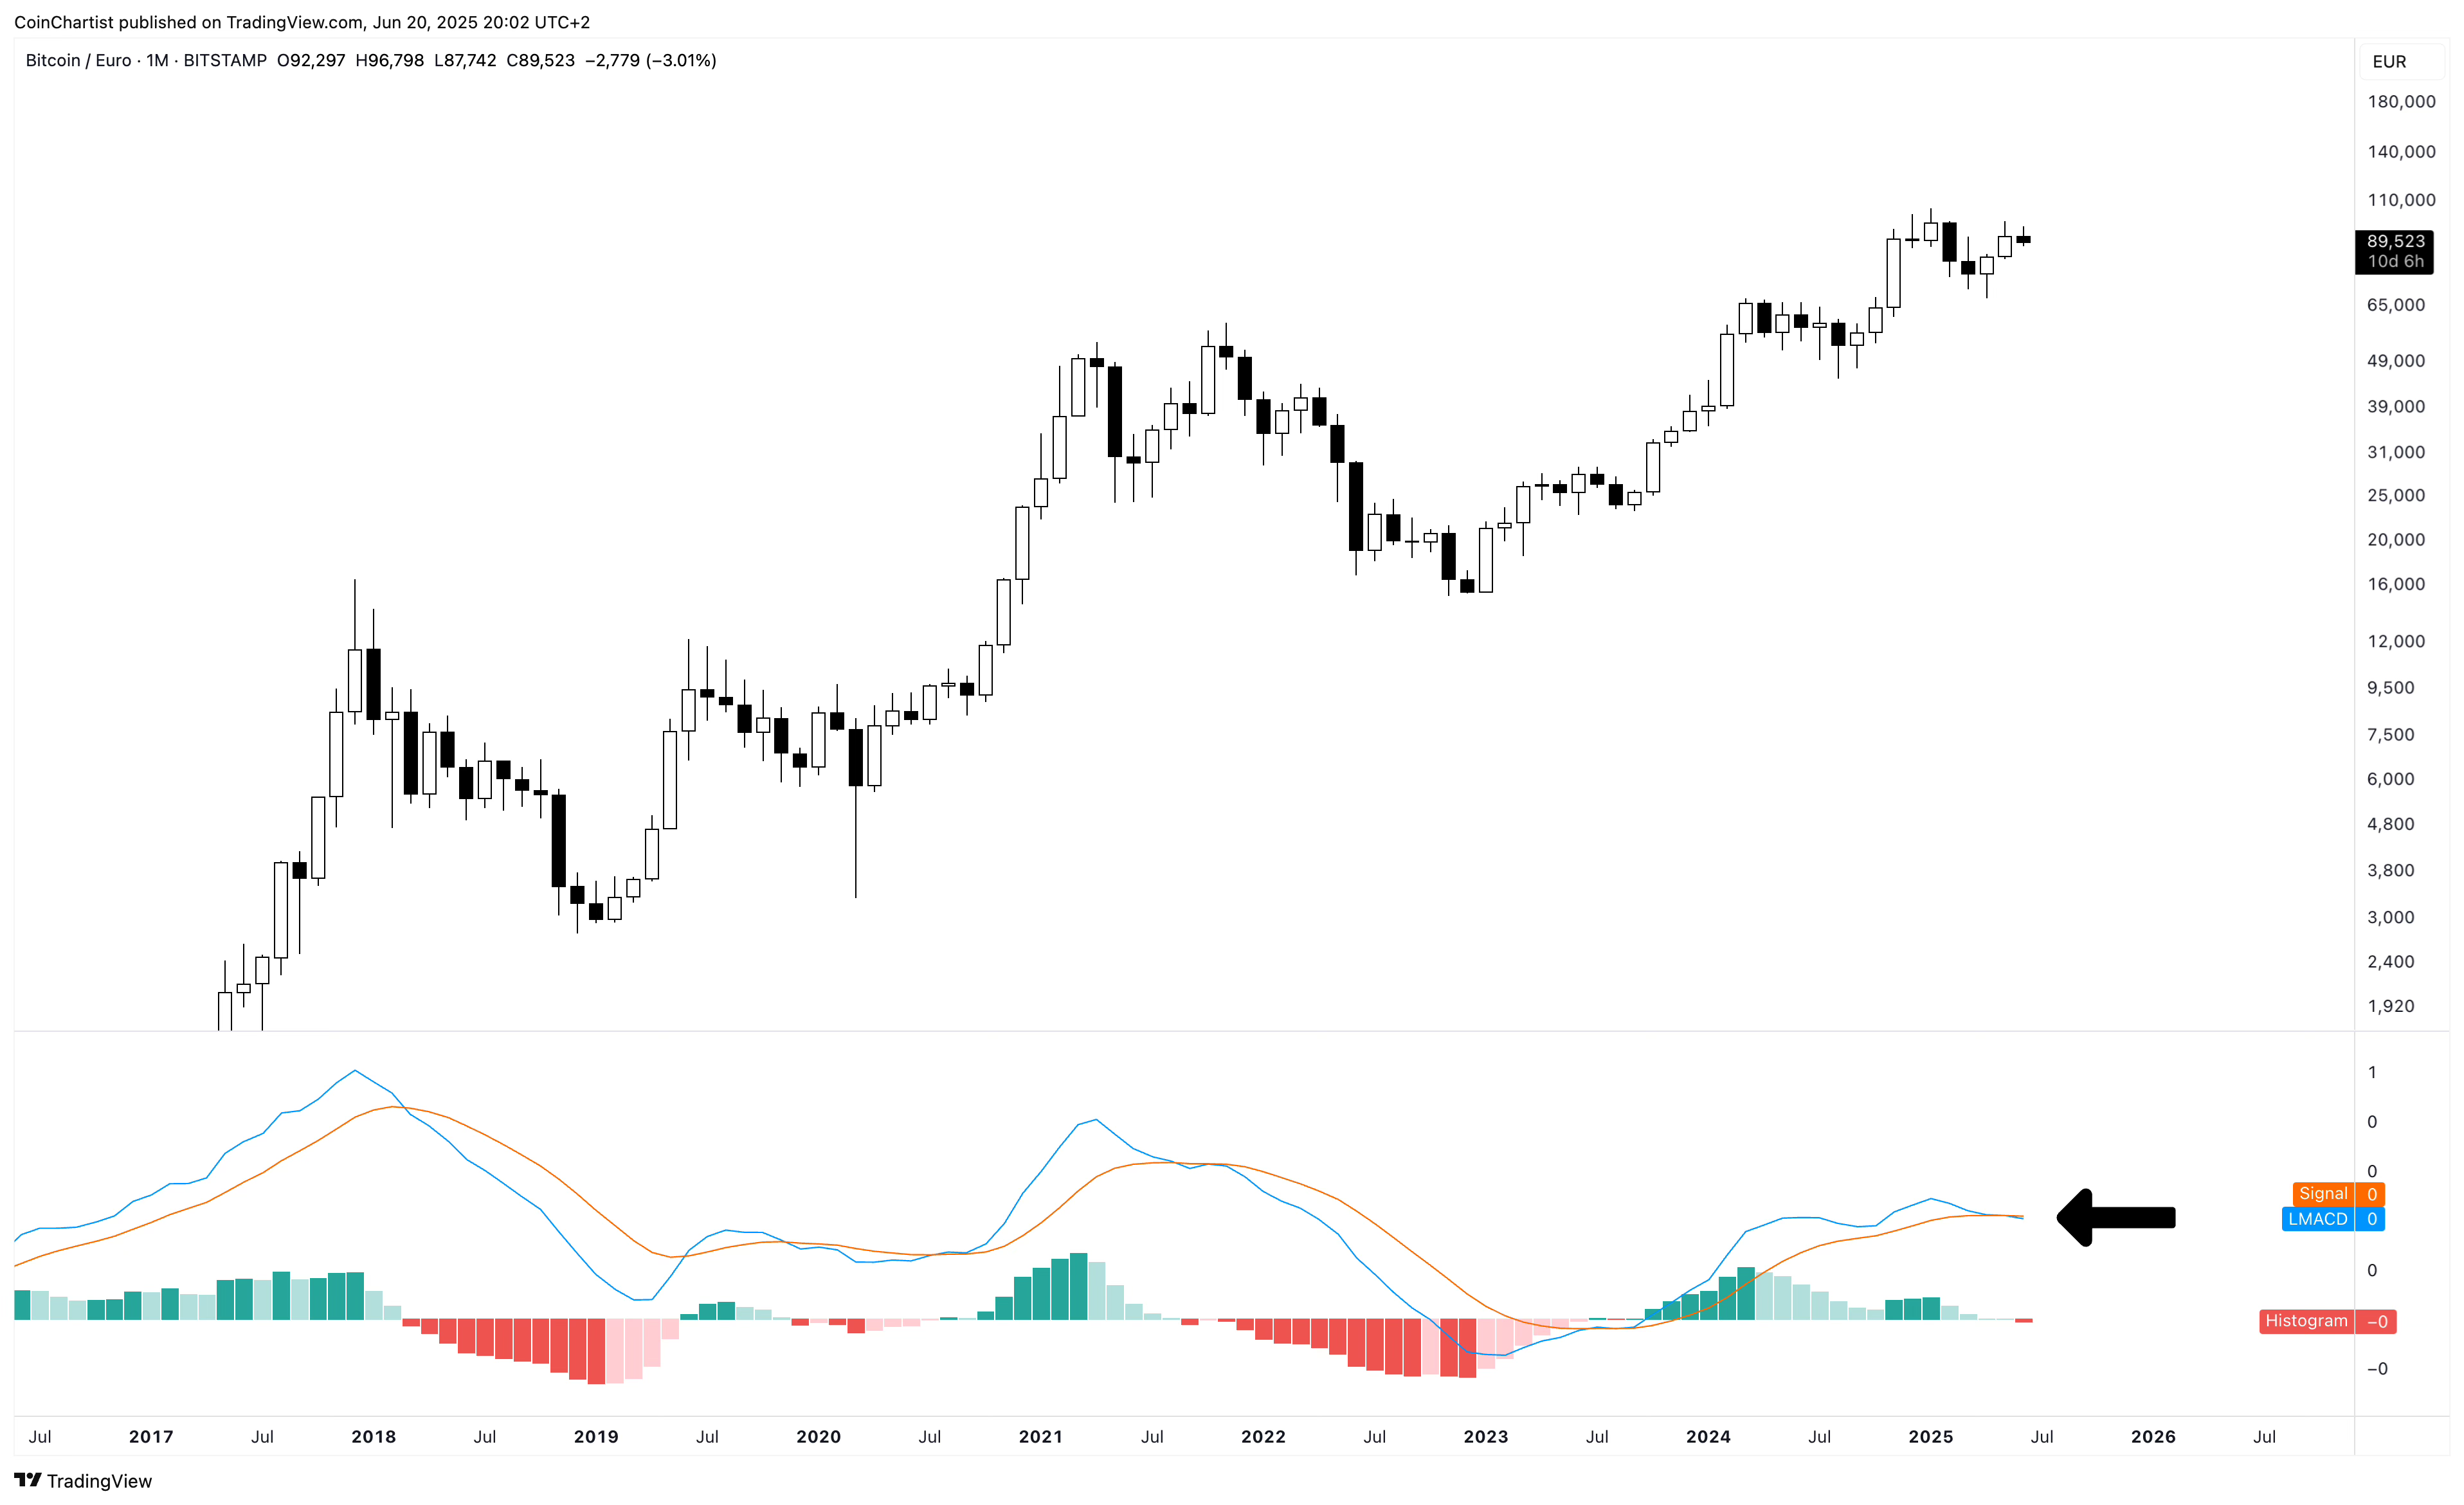
Interestingly, BTCEUR (Bitcoin priced in Euros) did not make a higher high like BTCUSD did, and is already showing a bearish crossover on the LMACD. This could confirm in ten days.
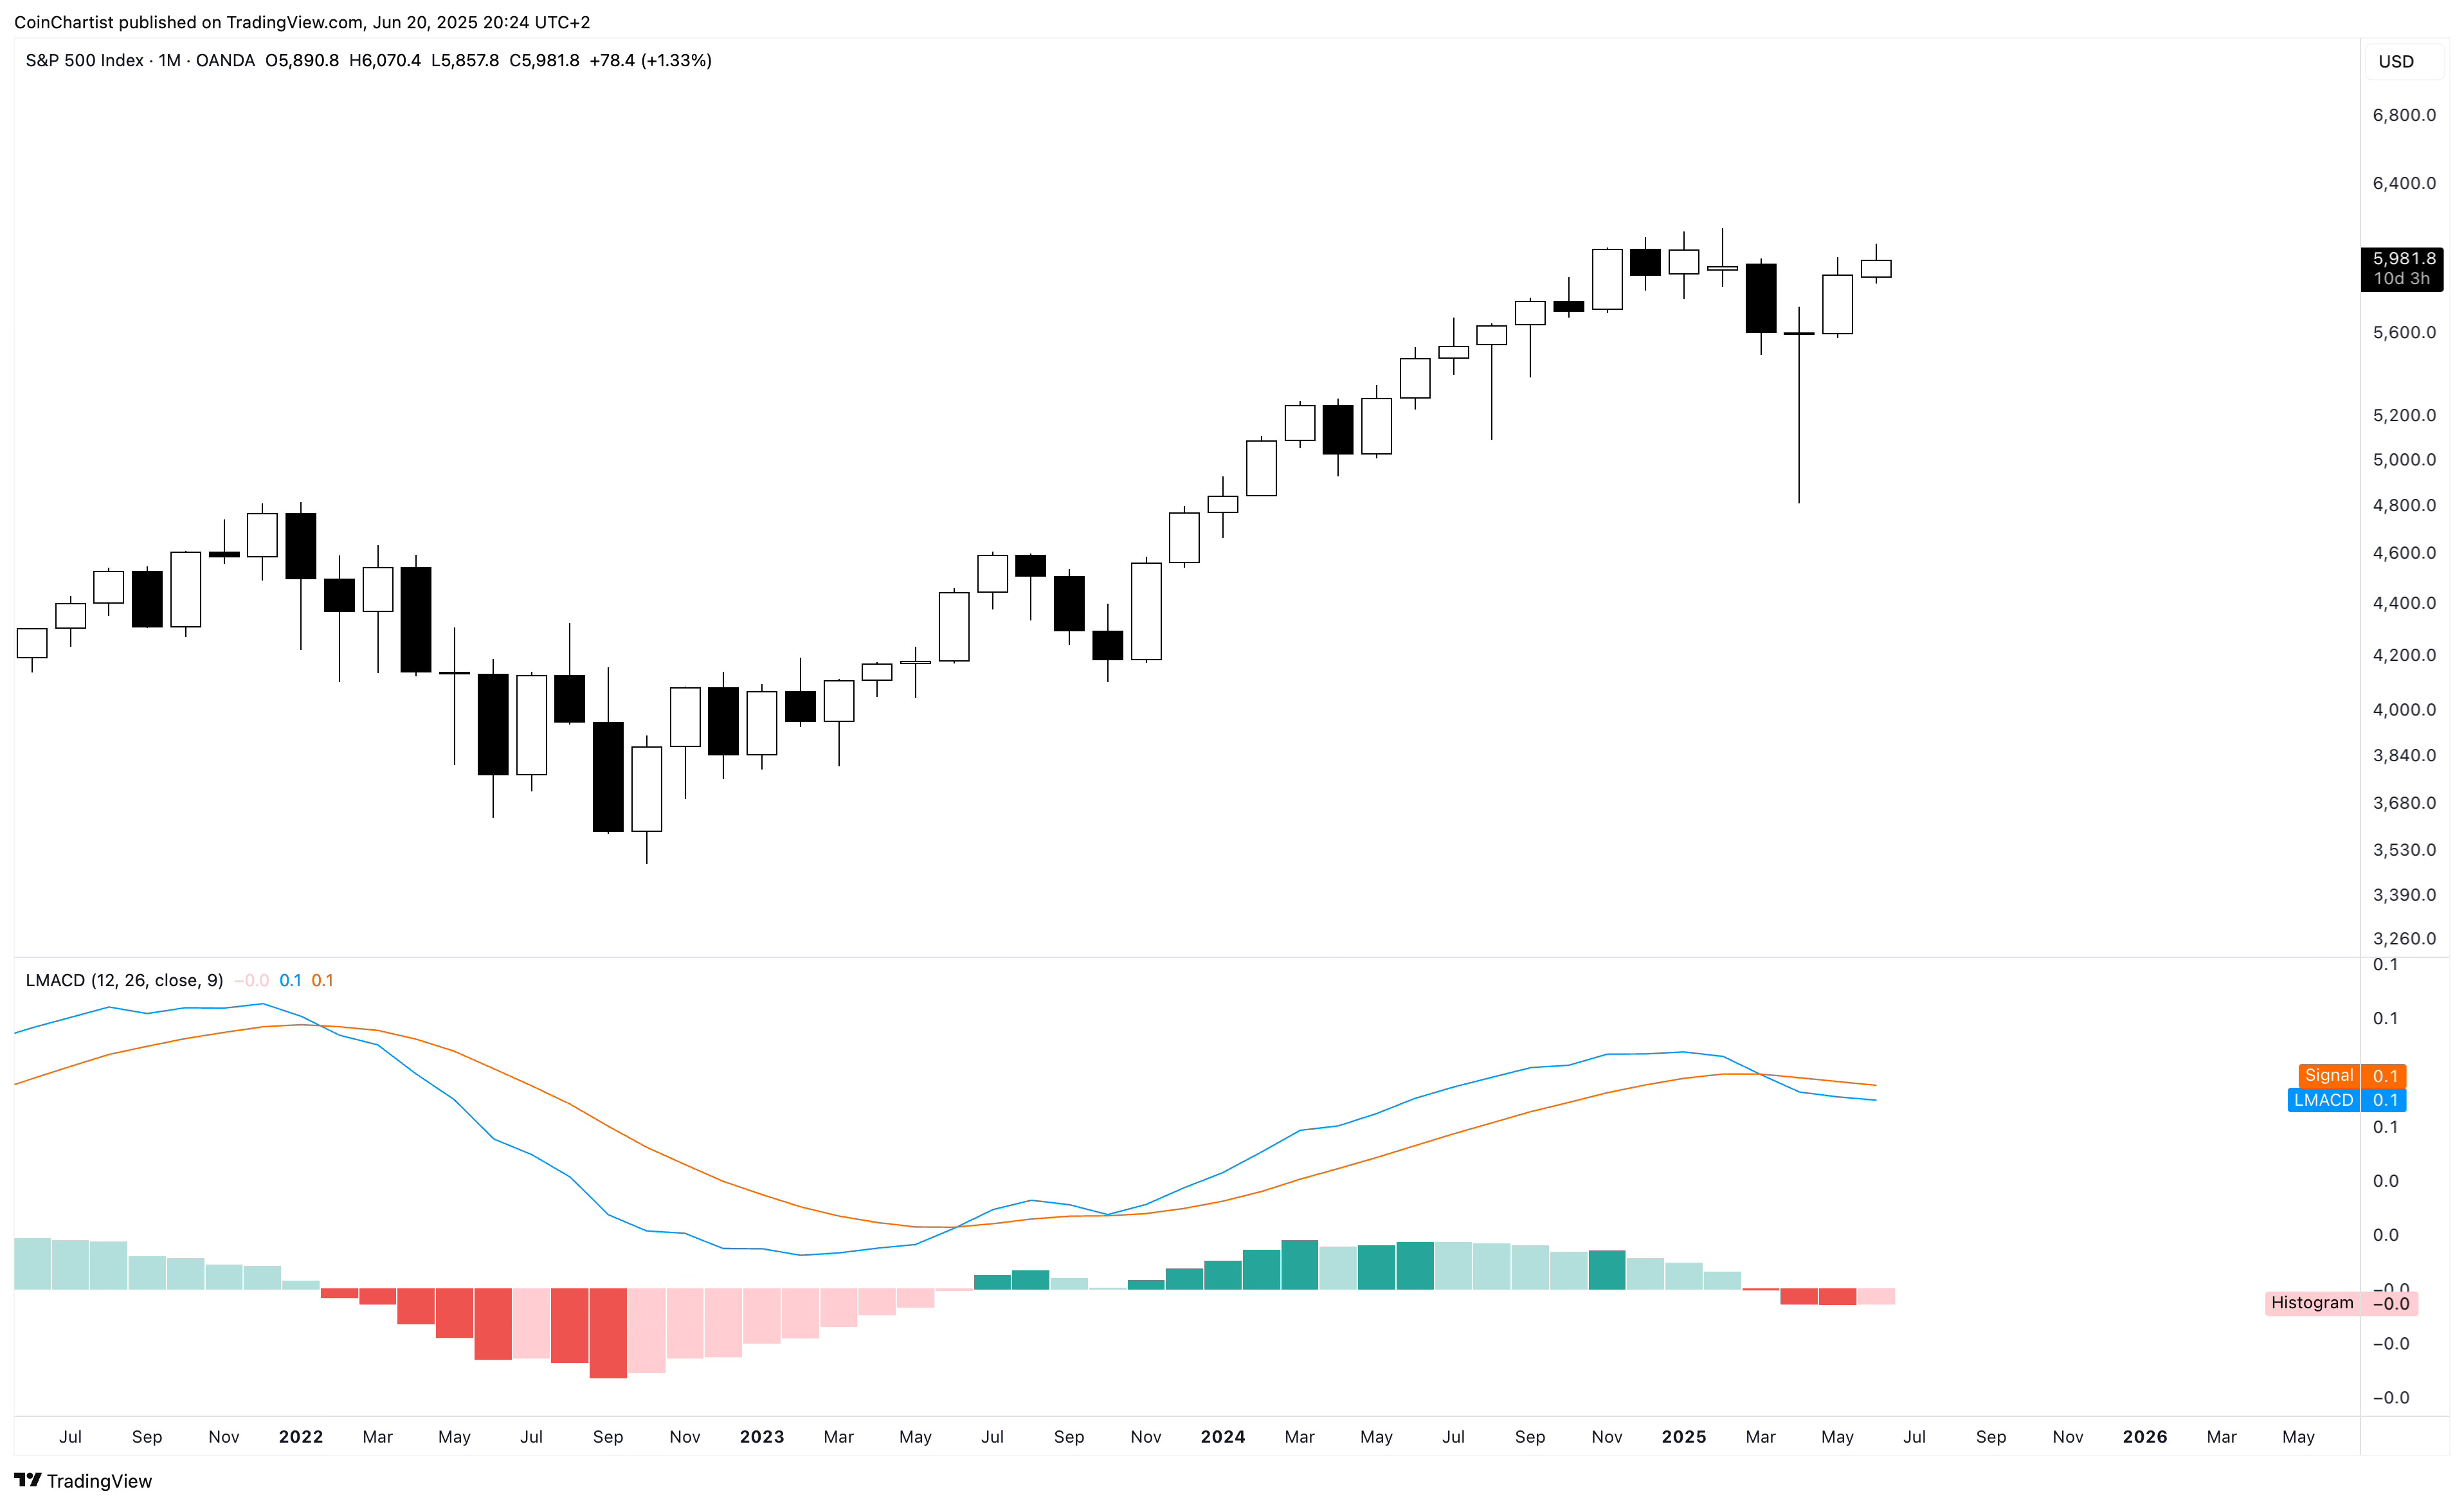
The S&P 500 has been crossed bearish now for four months. The pink tick on the histogram for June signals weakening bearish momentum. This could suggest bulls are close to turning things around, but momentum could re-strengthen to the downside in July.
Keep reading with a 7-day free trial
Subscribe to CoinChartist to keep reading this post and get 7 days of free access to the full post archives.