

Started From The Bottom
Now we're here. Let's look at how we got here to figure out where we are going next.

Disclaimer: The information provided in this Substack newsletter is for general informational purposes only and should not be considered as financial advice. Investing involves risk, and past performance is not indicative of future results. Please conduct your own research or consult a financial advisor before making any investment decisions. The newsletter disclaims any liability for losses or damages arising from the use of this information.
Started From The Bottom overview:
A recap of Bitcoin Elliott Wave counts and where we are at now
Update on the extended fifth wave scenario in BTCUSD
Examining a bullish fractal that suggests Bitcoin has another ATH left
A deep dive with 10+ charts comparing Gold and Bitcoin technicals
Altcoins Elliott Wave truncation and an extinction event
Bitcoin has recovered from local lows at $74K and is now trading at around $84-85K. This bounce has only added to the overall confusion, emboldening bulls and discouraging bears. With only 12 days left in April, some clarity should be on the way — making the next two weeks especially important (and likely especially volatile). While we wait for confirmation of a bear market or further recovery back into a bullish trend, this issue is focused on recapping where we are at, how we got here, and makes some assumptions about where we are going next. I’m also digging deeply into the underlying technicals driving the Gold rally to demonstrate why Bitcoin just doesn’t have the same strength. As I’ve noted, failure here for Bitcoin to follow Gold could severely tarnish the Digital Gold narrative around Bitcoin. Finally, you’ve probably noticed I’ve mostly stopped talking about altcoins. While opportunities across the market will soon exist, until there’s more clarity from Bitcoin I can’t in good faith recommend holding any altcoins. The lack of altcoin season remains one of the loudest arguments from bulls as to why Bitcoin hasn’t topped. But there is no guarantee we ever see another altcoin season. In fact, risk could be so high on a macroeconomic level, that altcoins could be experiencing a “bull market failure,”referred to in Elliott Wave Principle as wave 5 truncation.
Bitcoin wave count and recap
Elliott Wave Principle is only one tool in the technical analyst’s toolbox. Its usefulness revolves around understanding where in a trend we are, and at what degree. When a count has “the right look” and wave “personalities” match market sentiment and conditions, you ideally follow the count until it is invalidated. And that’s what I have done for two full years now with great success — so why would I stop now?
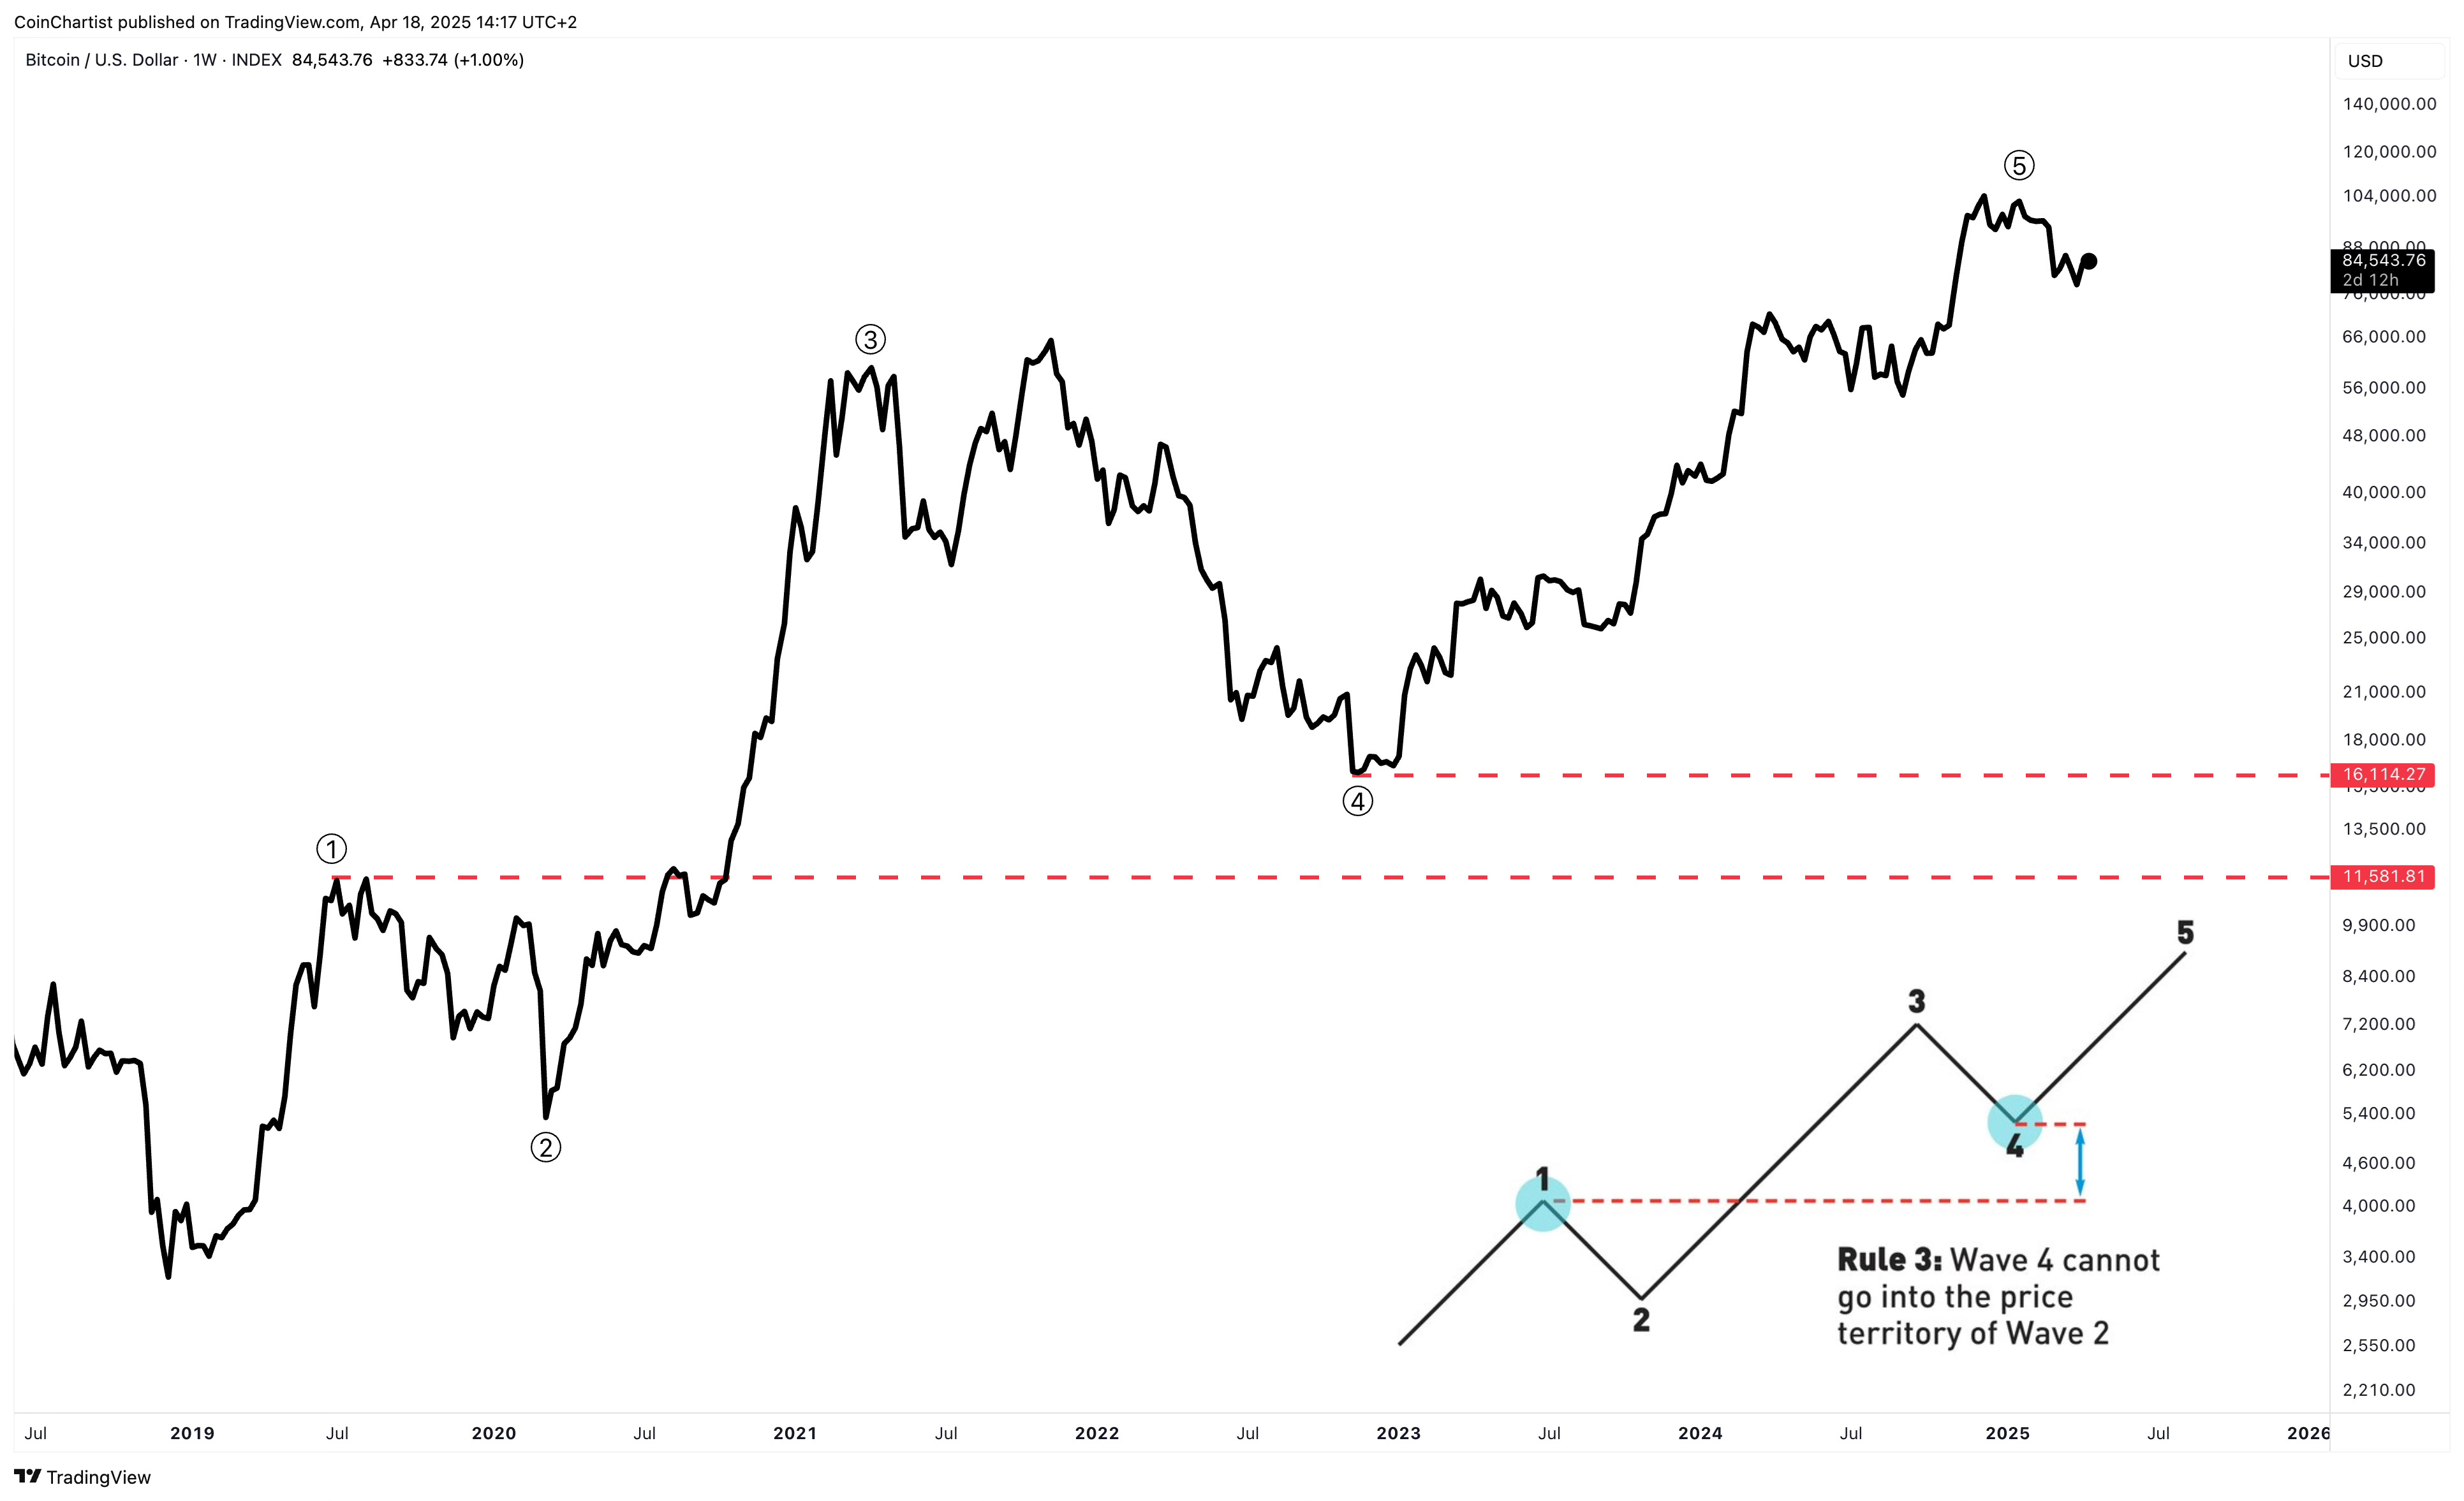
Bitcoin’s primary degree wave 5 began in late 2022 after the FTX collapse. The fact price action in wave 4 never entered the territory of wave 1 allowed us to anticipate the start of wave 5 and enter a position accordingly.
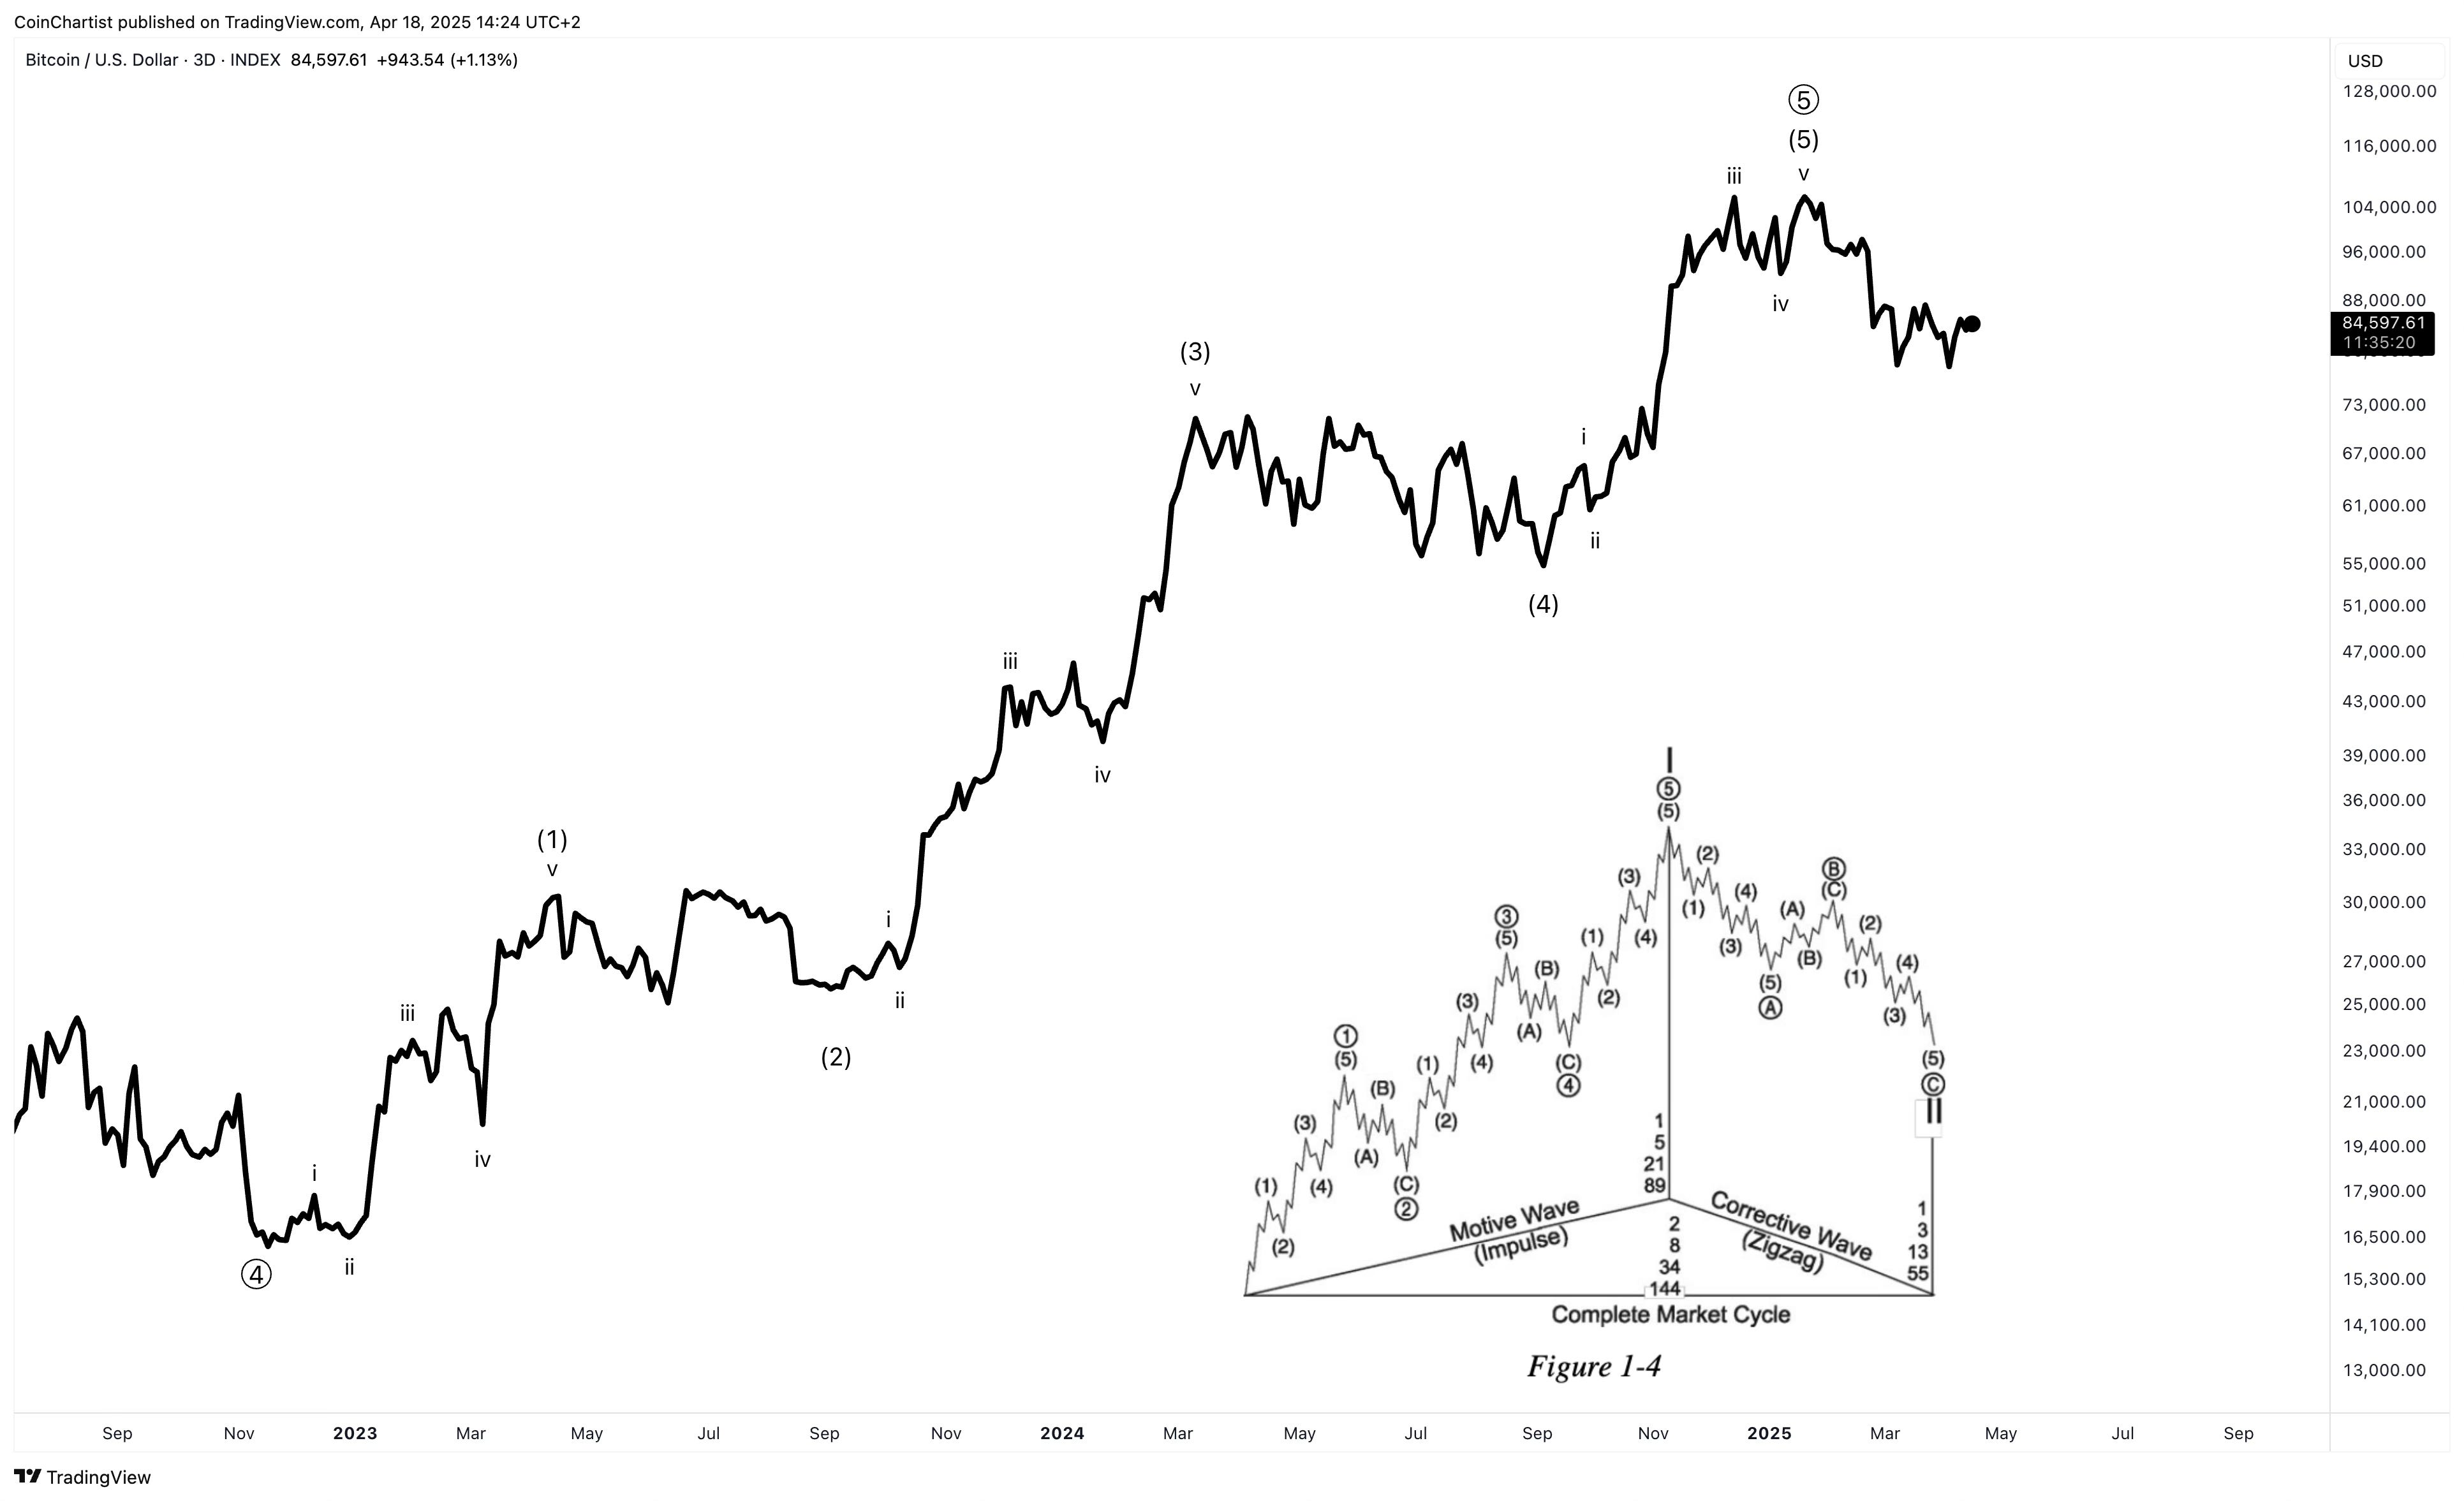
All motive waves move in five waves, with motive subwaves also subdividing into five waves. The chart above shows five intermediate waves up within the primary wave 5. Intermediate waves 1, 3, and 5 each subdivide further into five sub waves, just like the diagram in the lower right hand corner.
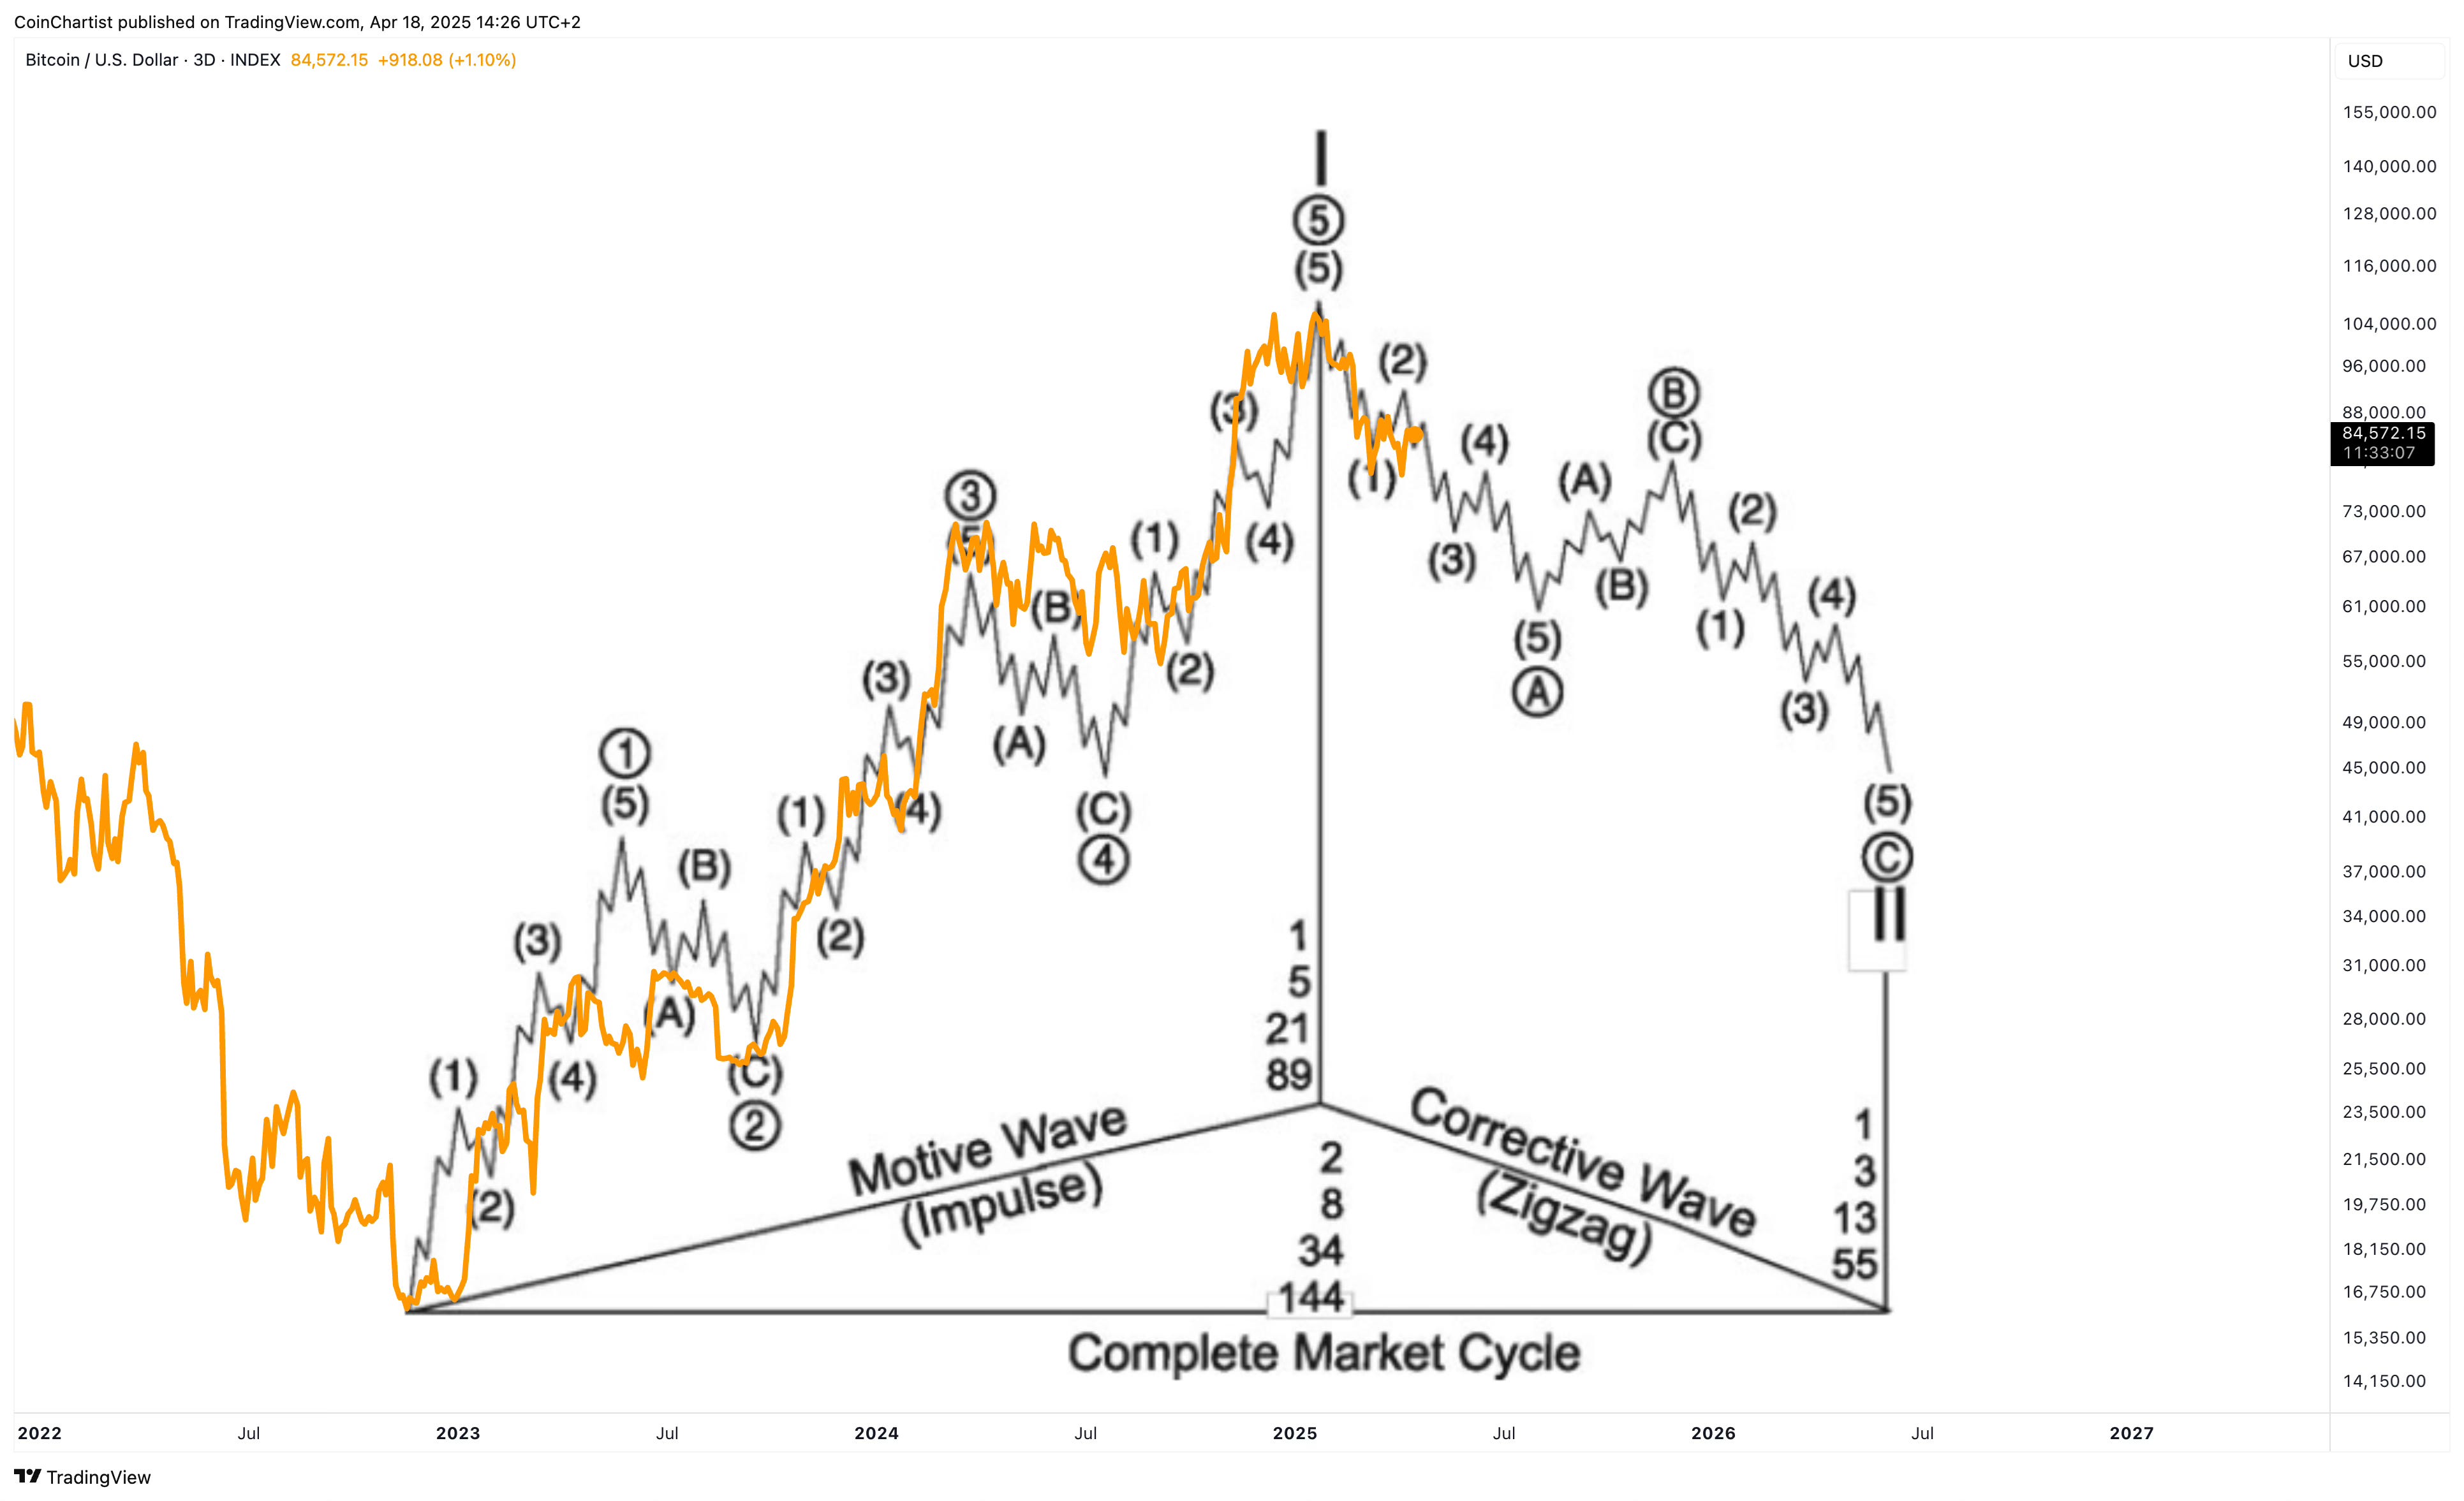
Overlaying Bitcoin onto that diagram, we can see that the wave count tracks very closely. According to its location now Bitcoin could be entering subwave 3 of A in an ABC correction.
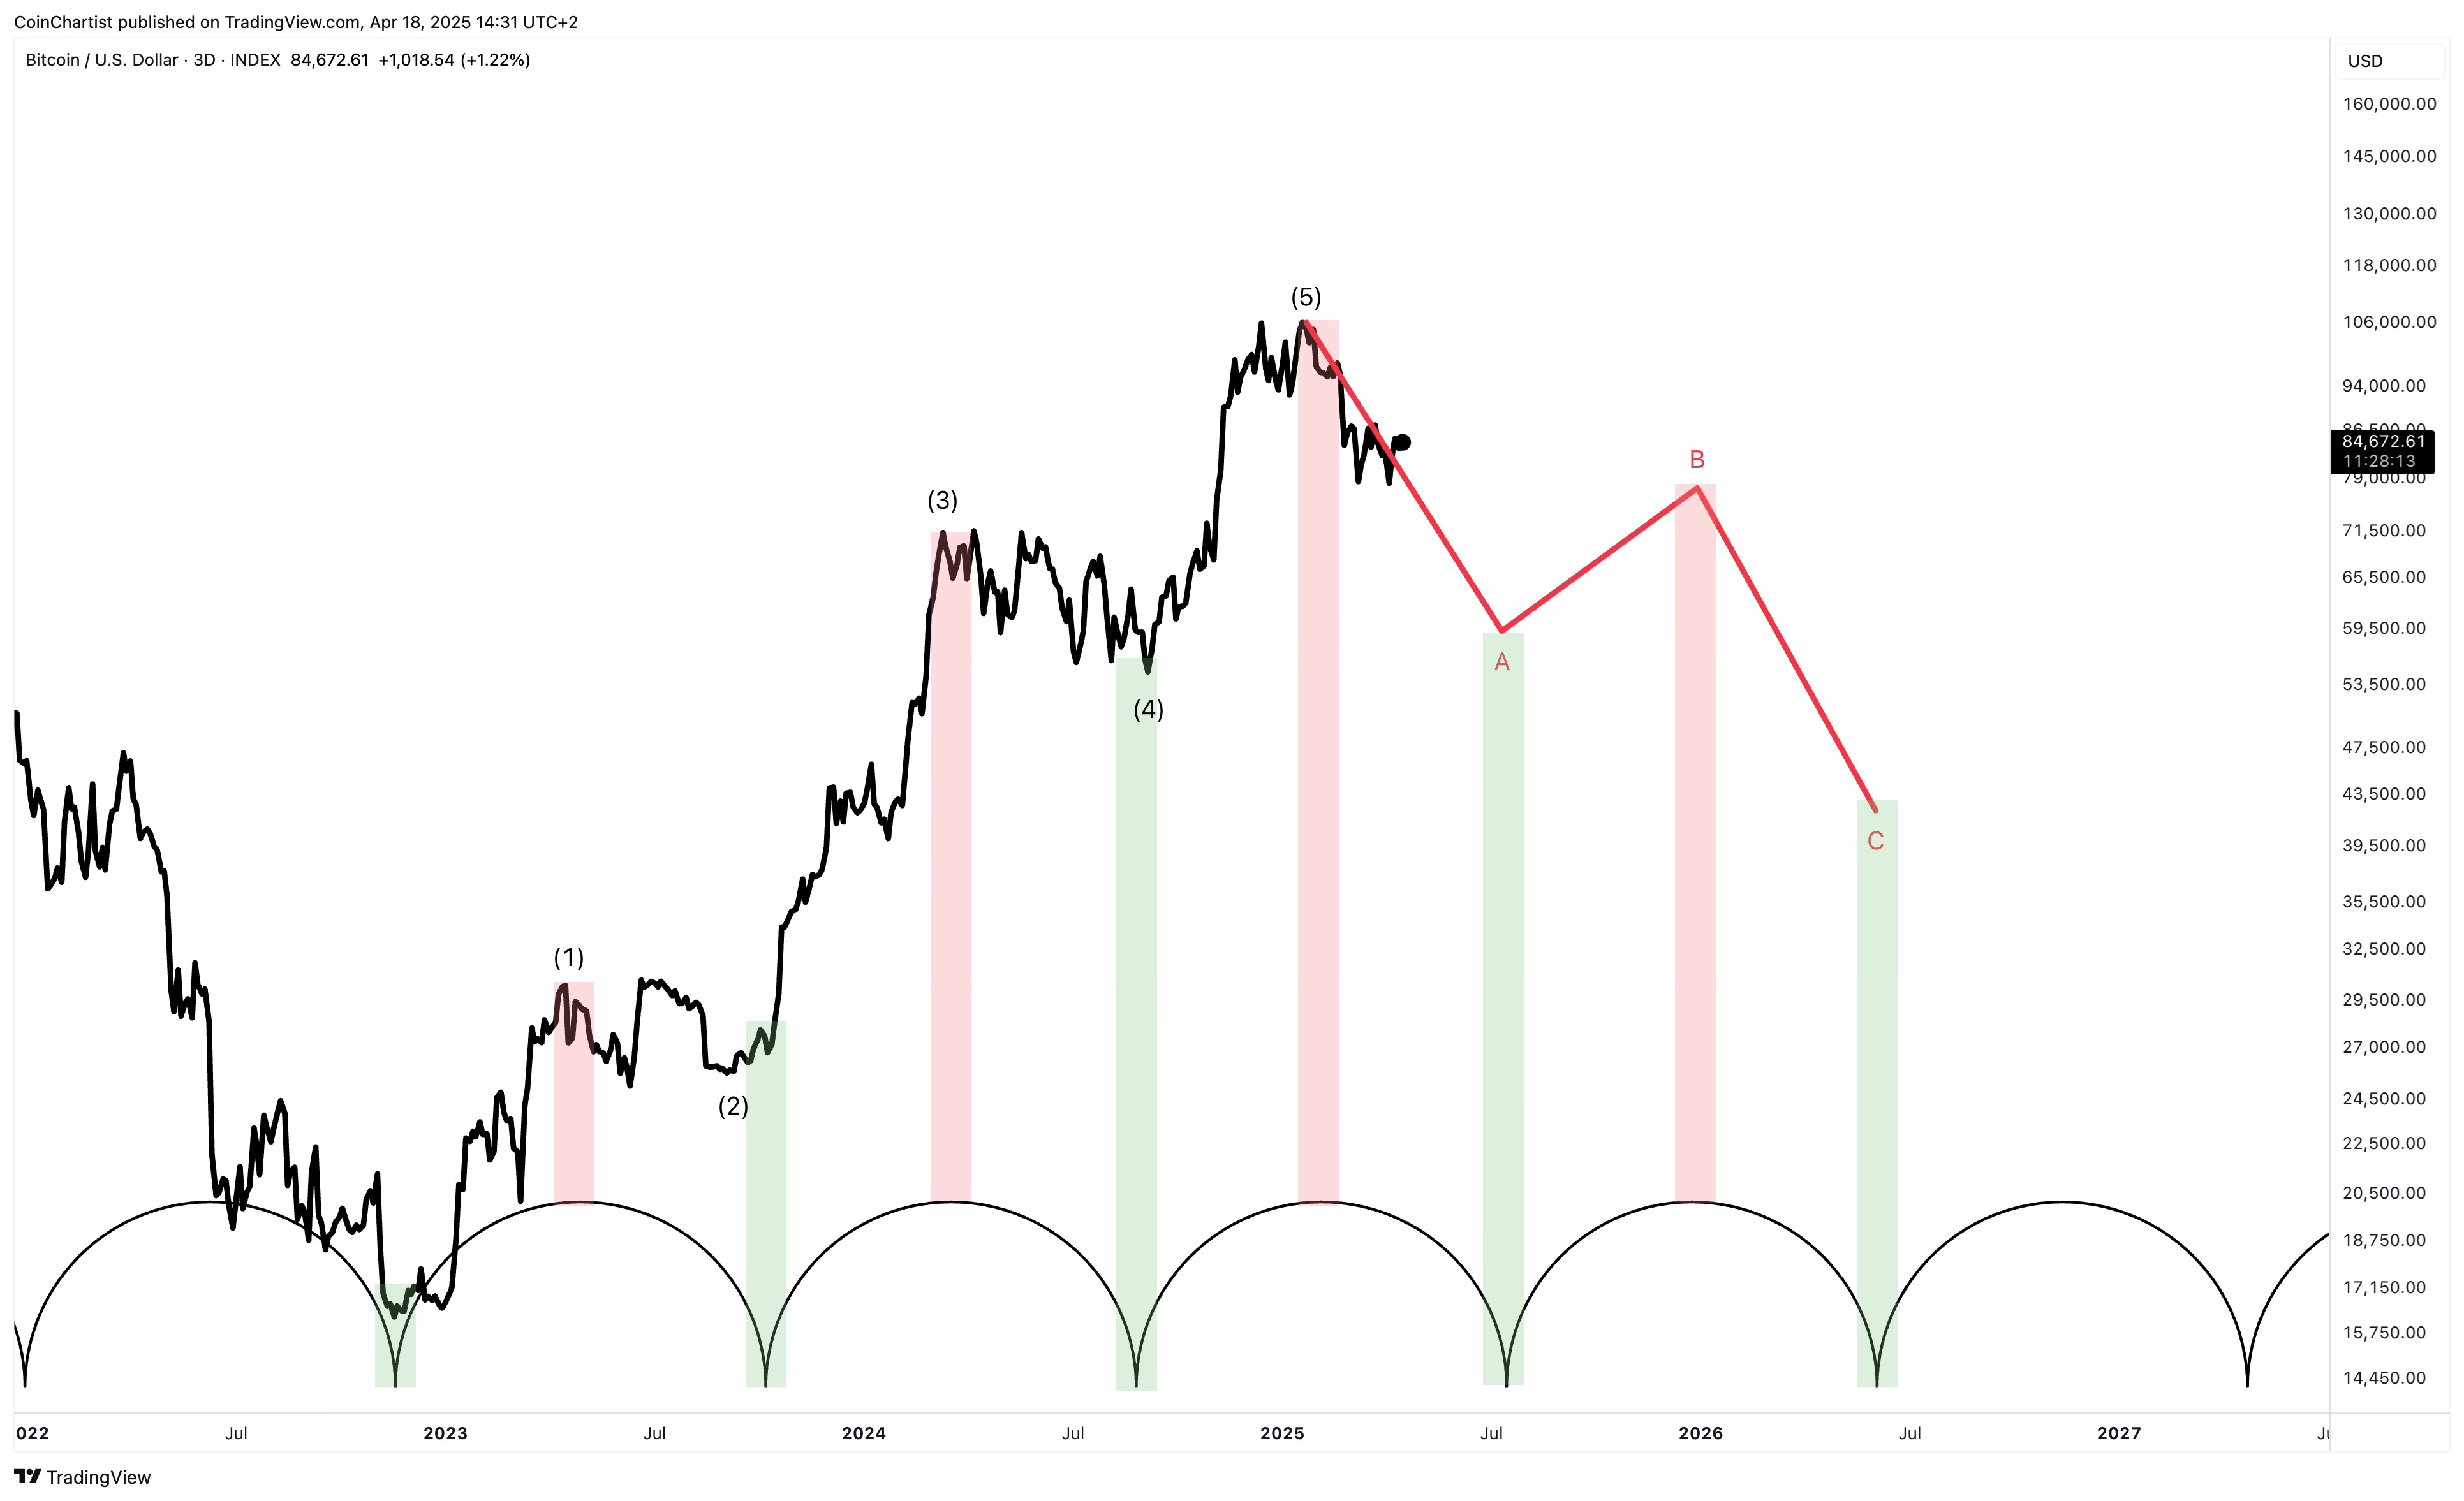
Removing the diagram, and adding in Time Cycles, we can see that the cyclical crests and troughs line up well with peaks and bottoms in Bitcoin during this intermediate trend.
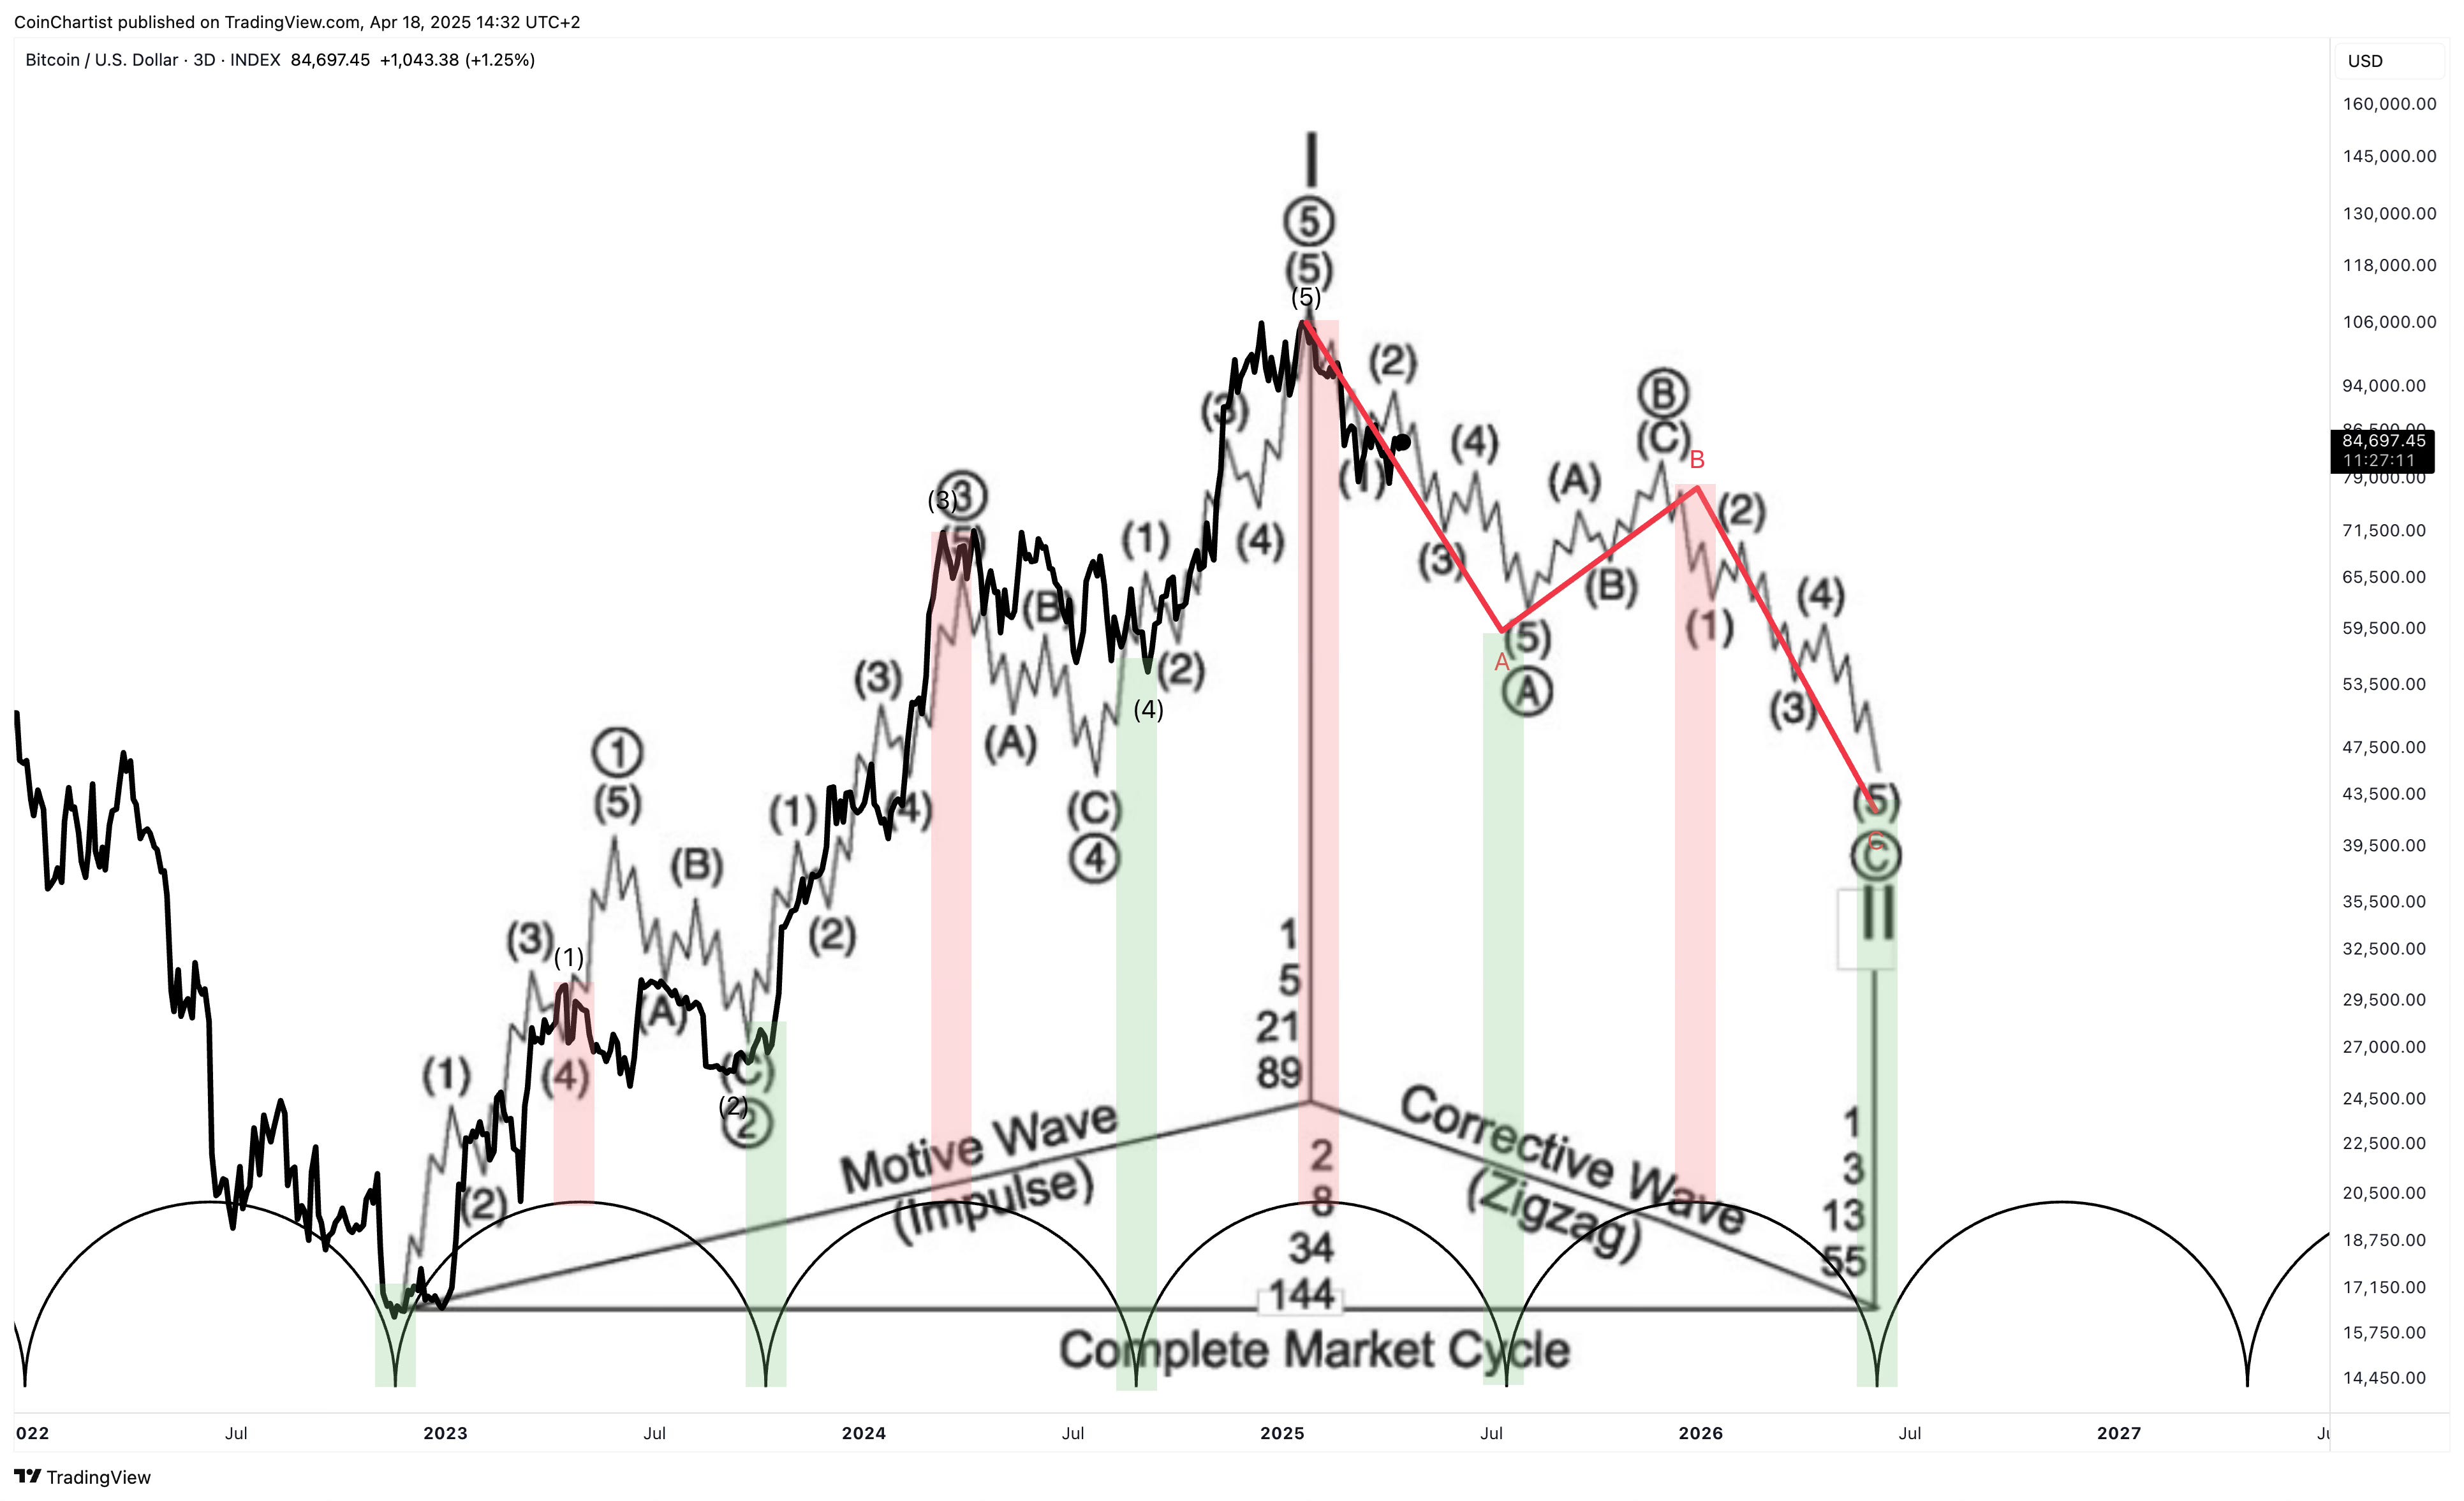
Adding the diagram back over the cyclical chart and the ebb and flow of the corrective waves appear to line up perfectly with the cyclical crests and troughs.
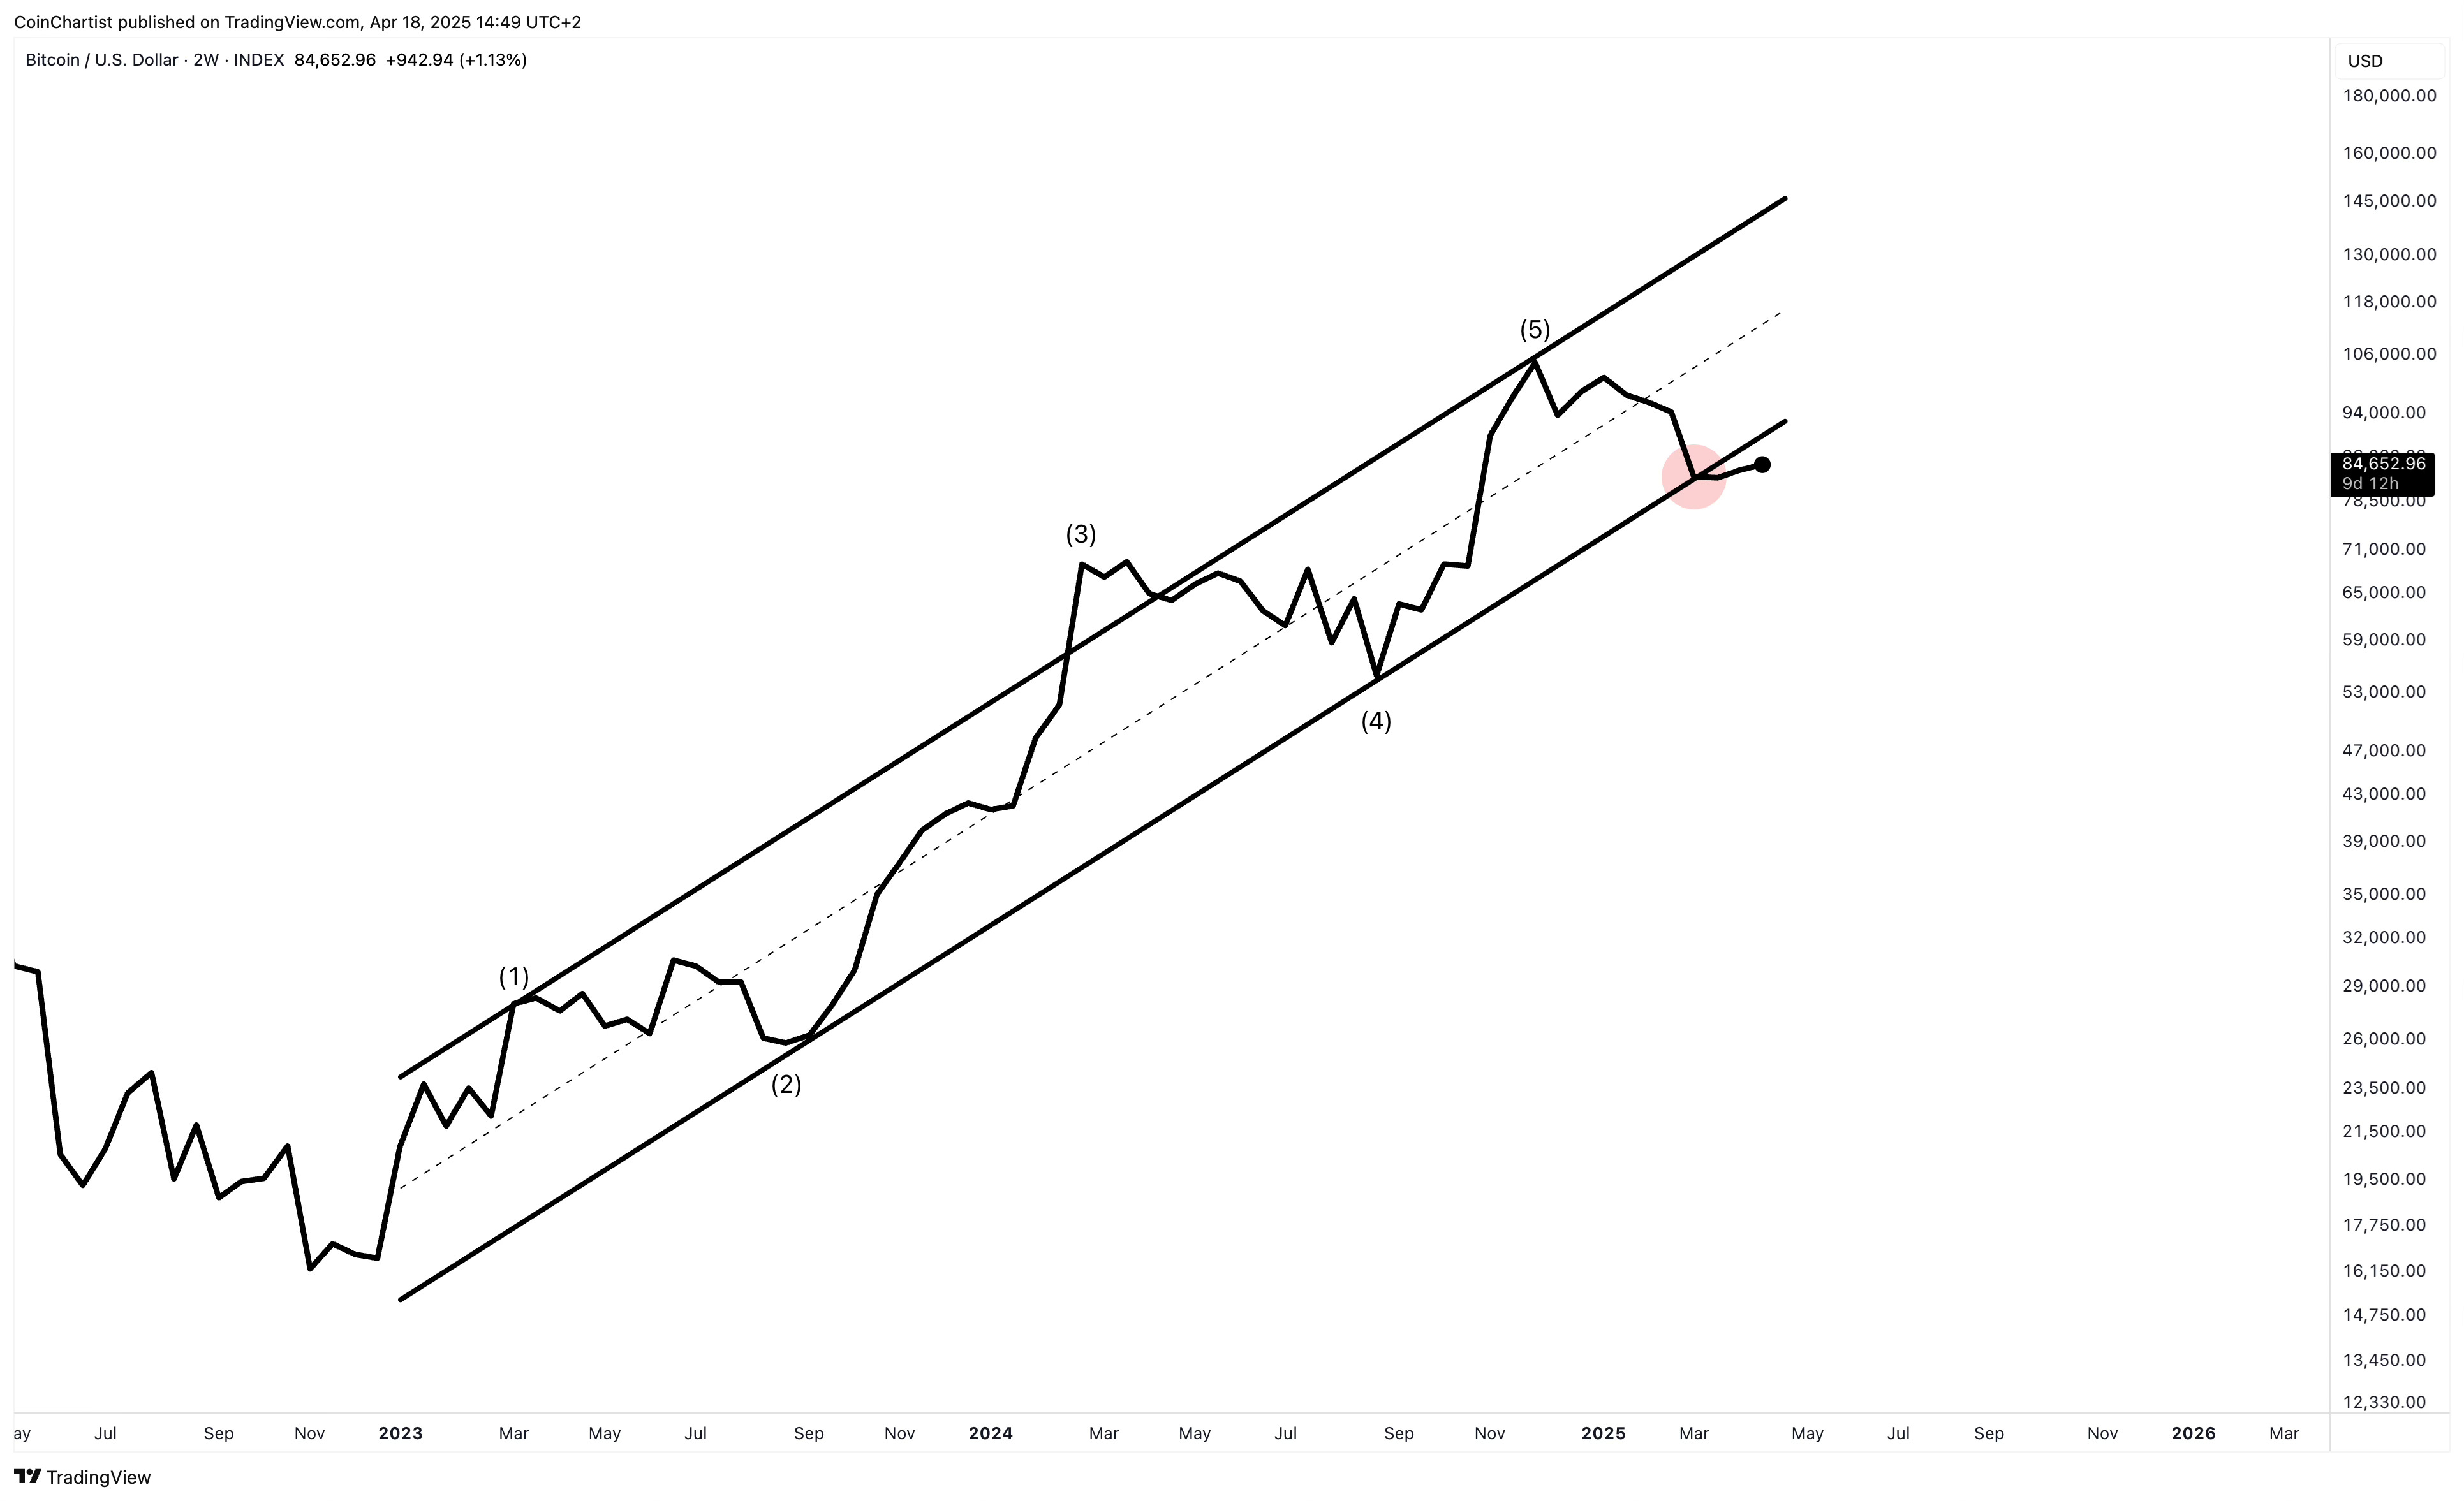
Channeling is a technique in Elliott Wave Principle used for forecasting where wave 5 might terminate. There are a variety of ways to draw these channels. The above scenario has wave 3 overshooting the channel, followed by wave 4 bottoming at the channel’s lower boundary and wave 5 topping out at the channel’s upper boundary. Now Bitcoin is starting to fall out of this uptrend channel.
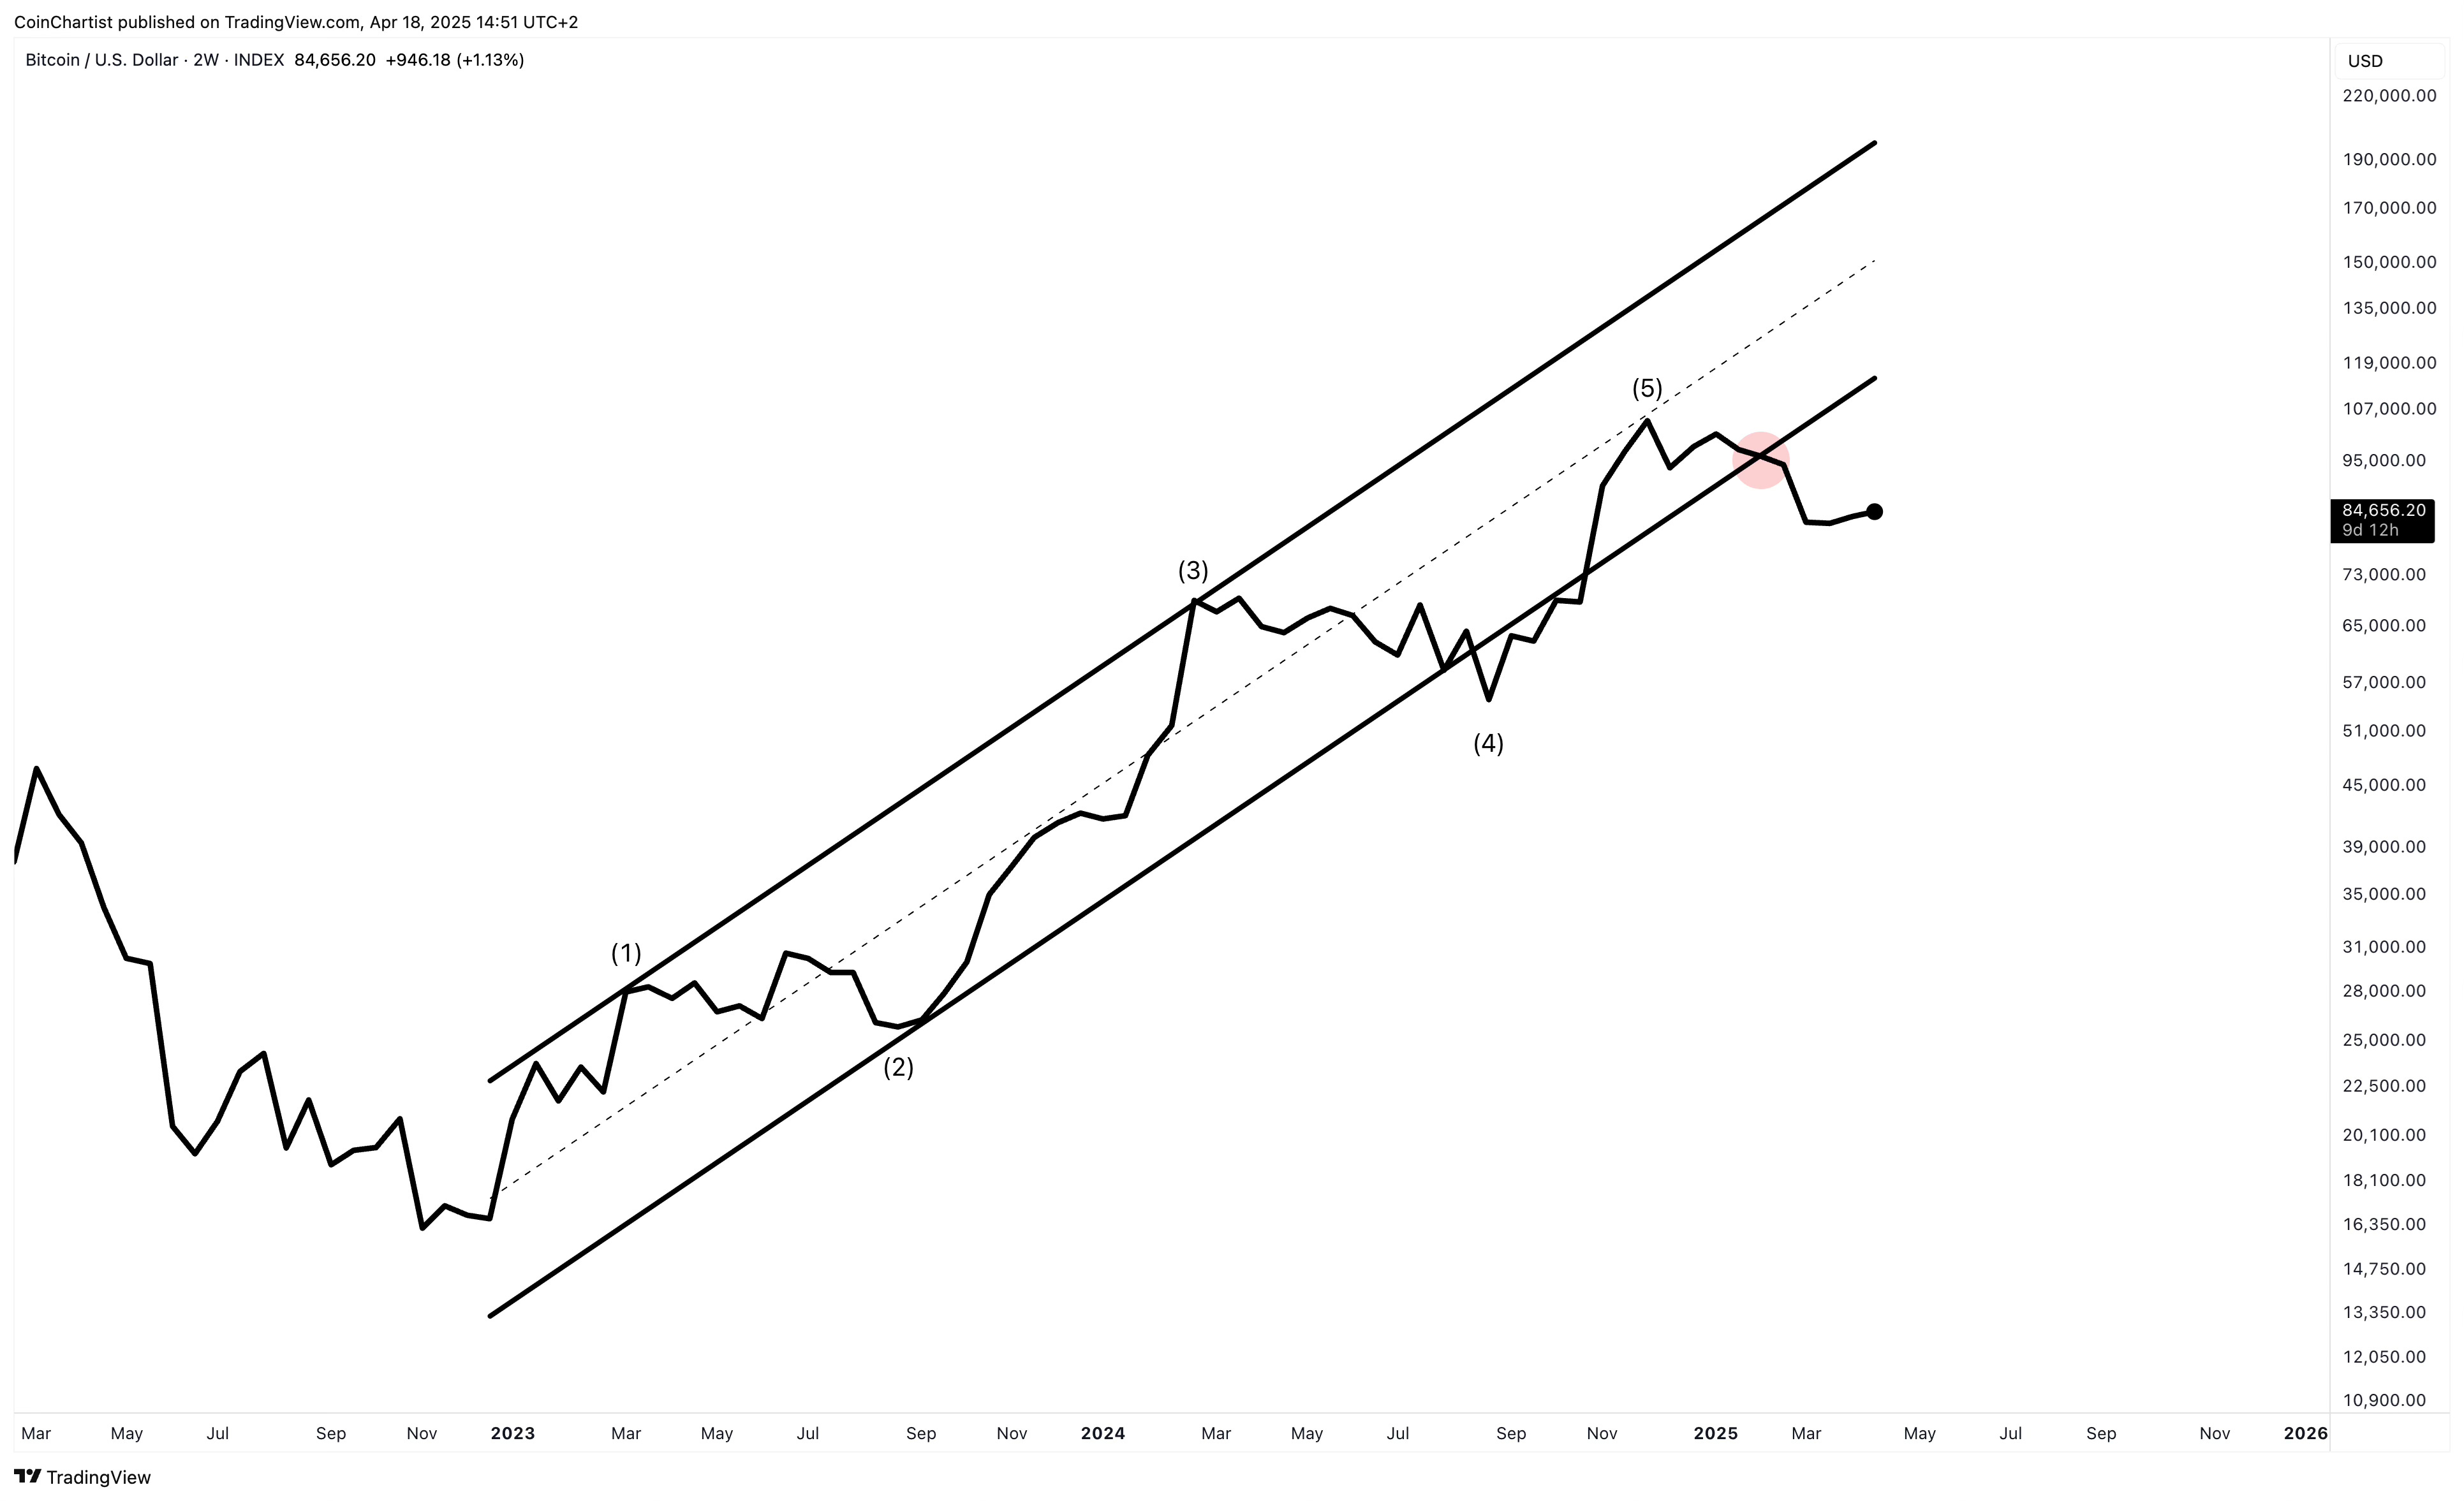
In this different version of channeling, we had wave 4 overshooting the lower boundary, followed by wave 5 undershooting the upper trend line. I am showing this because at one point, I preferred drawing the channel this way. However, this is an even more bearish picture, as the uptrend channel was lost sooner, possibly making the downtrend more advanced than many realize.
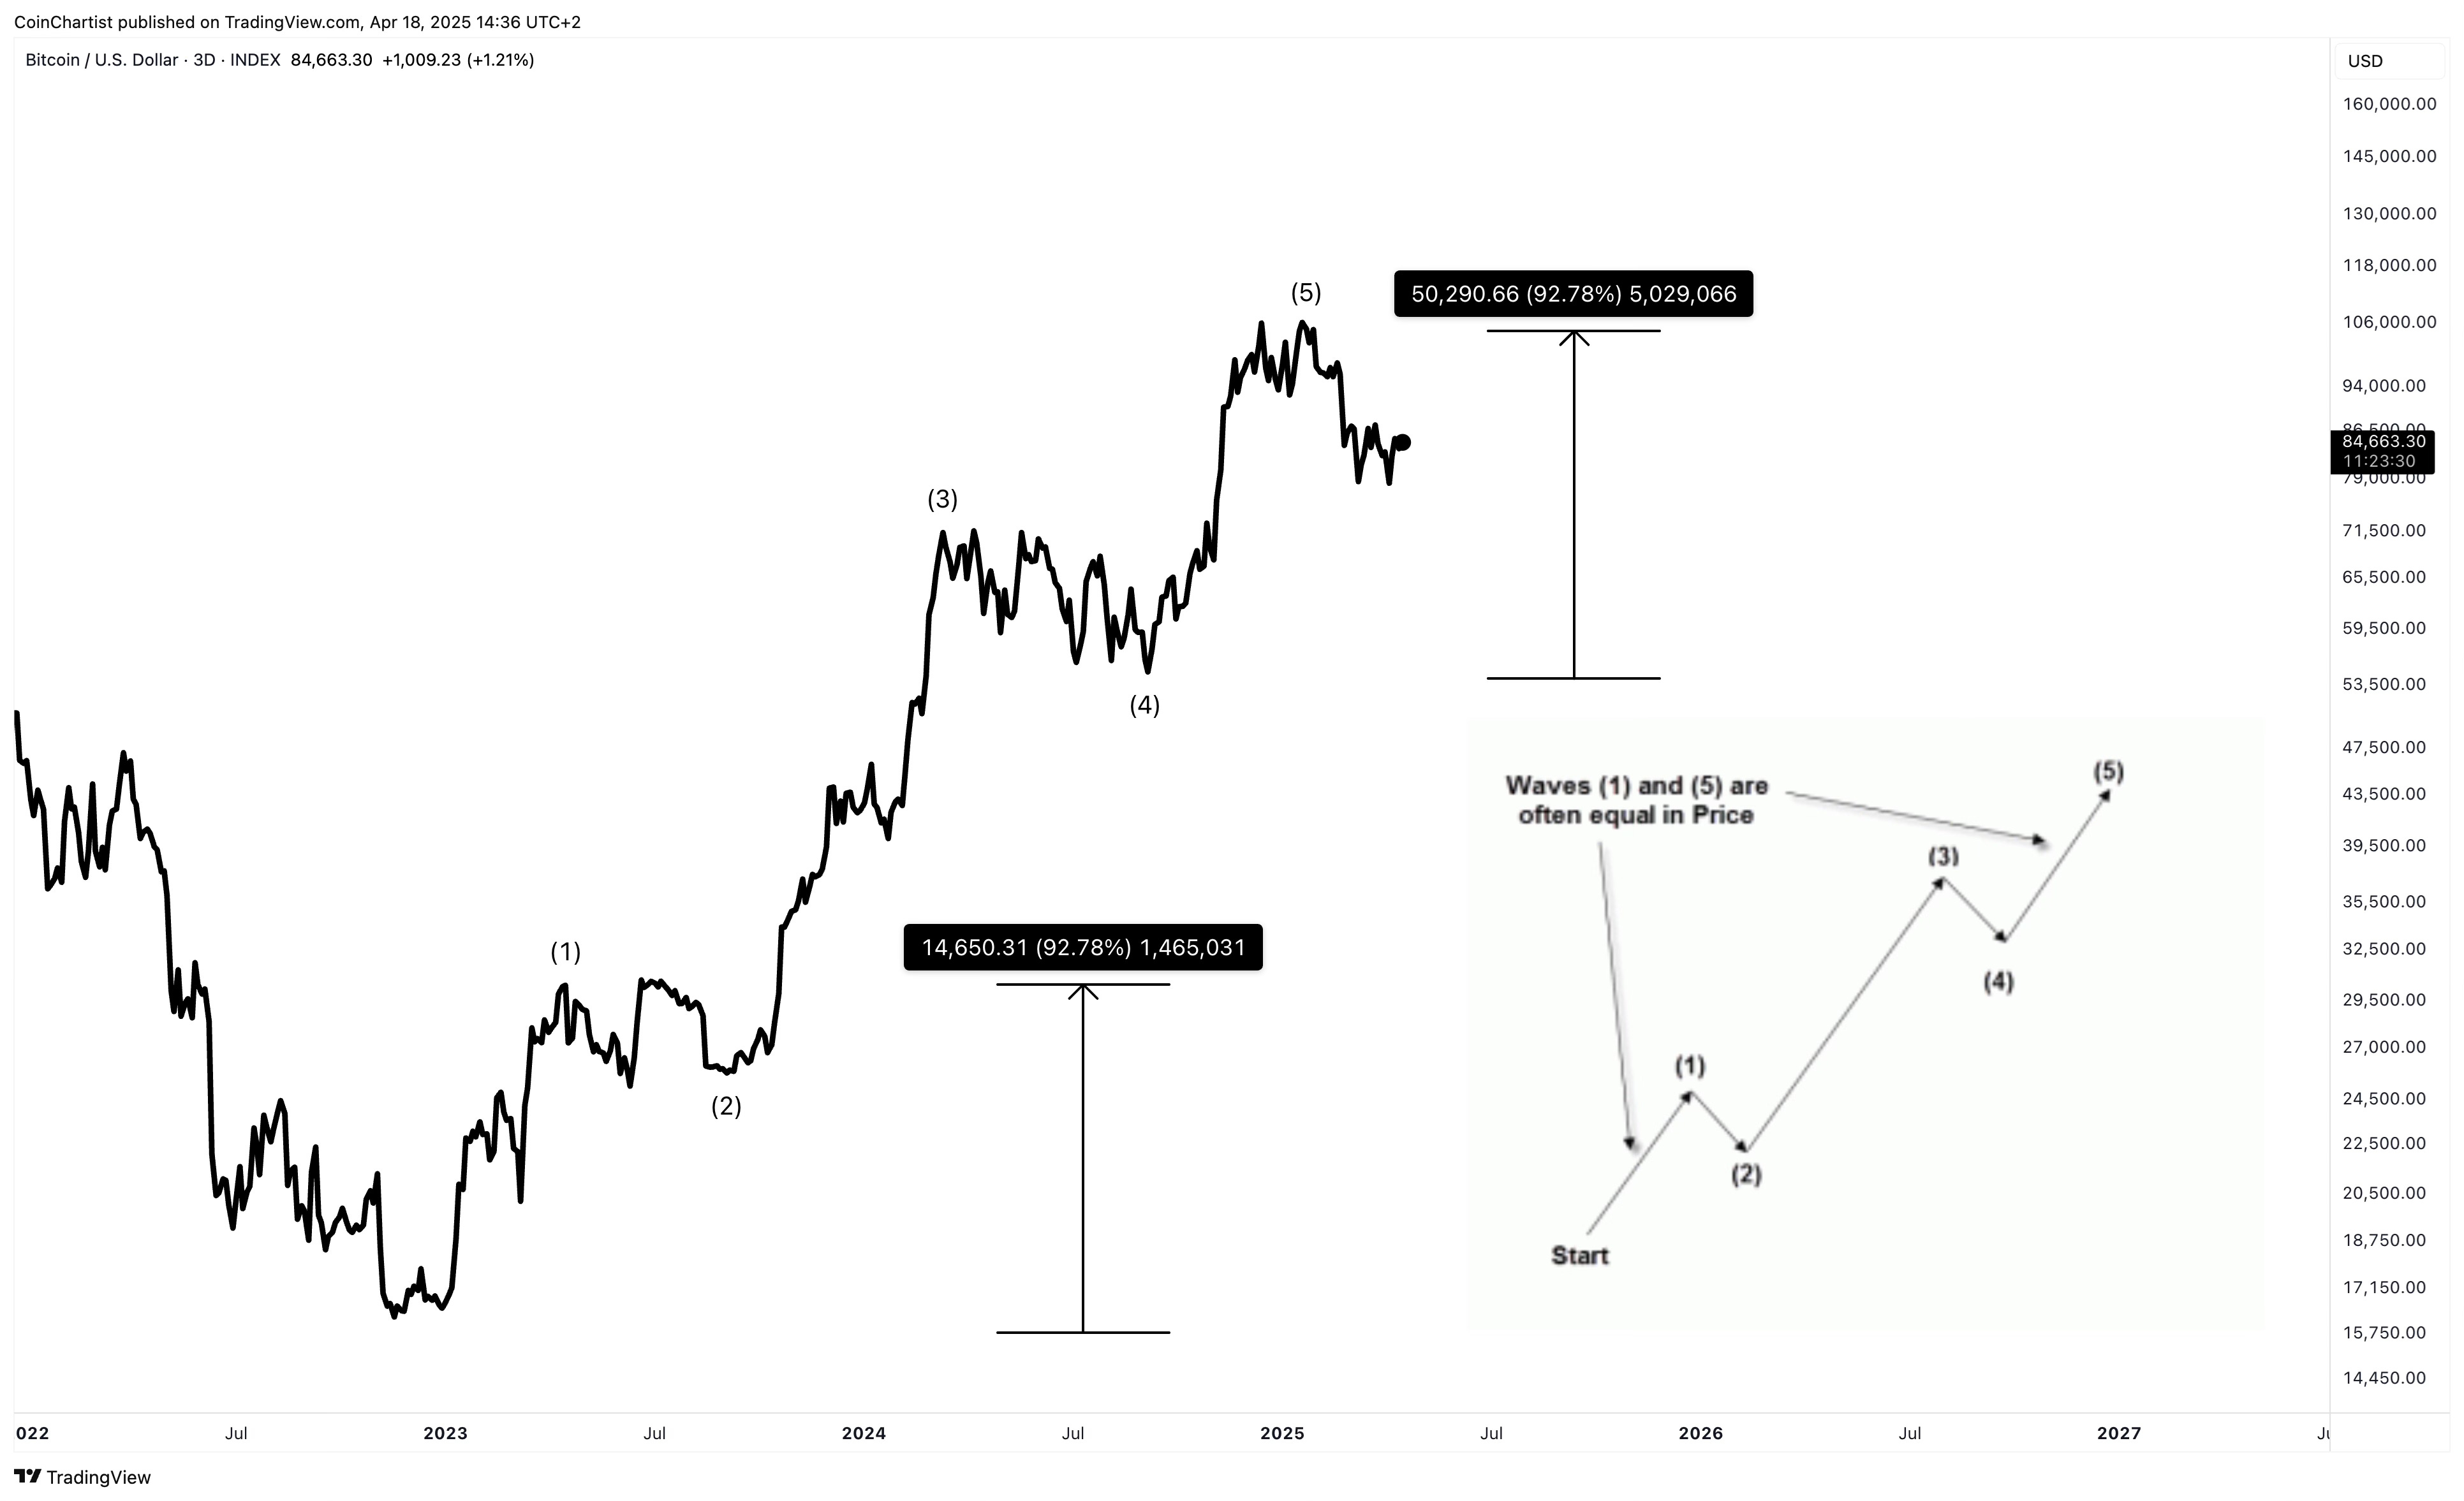
Another method to project Bitcoin’s peak is simply matching the magnitude of wave 1 and wave 5. Wave 3 shows clear extension, with its elongated structure. Neither wave 1 nor wave 5 show such elongation. This is normal behavior, as it is rare to get two extended waves. This makes wave 1 and 5 matching in magnitude far more likely than wave 3 and wave 5. But that would also mean that Bitcoin’s primary degree wave 5 and intermediate wave 5 is over, and a bear market has started.
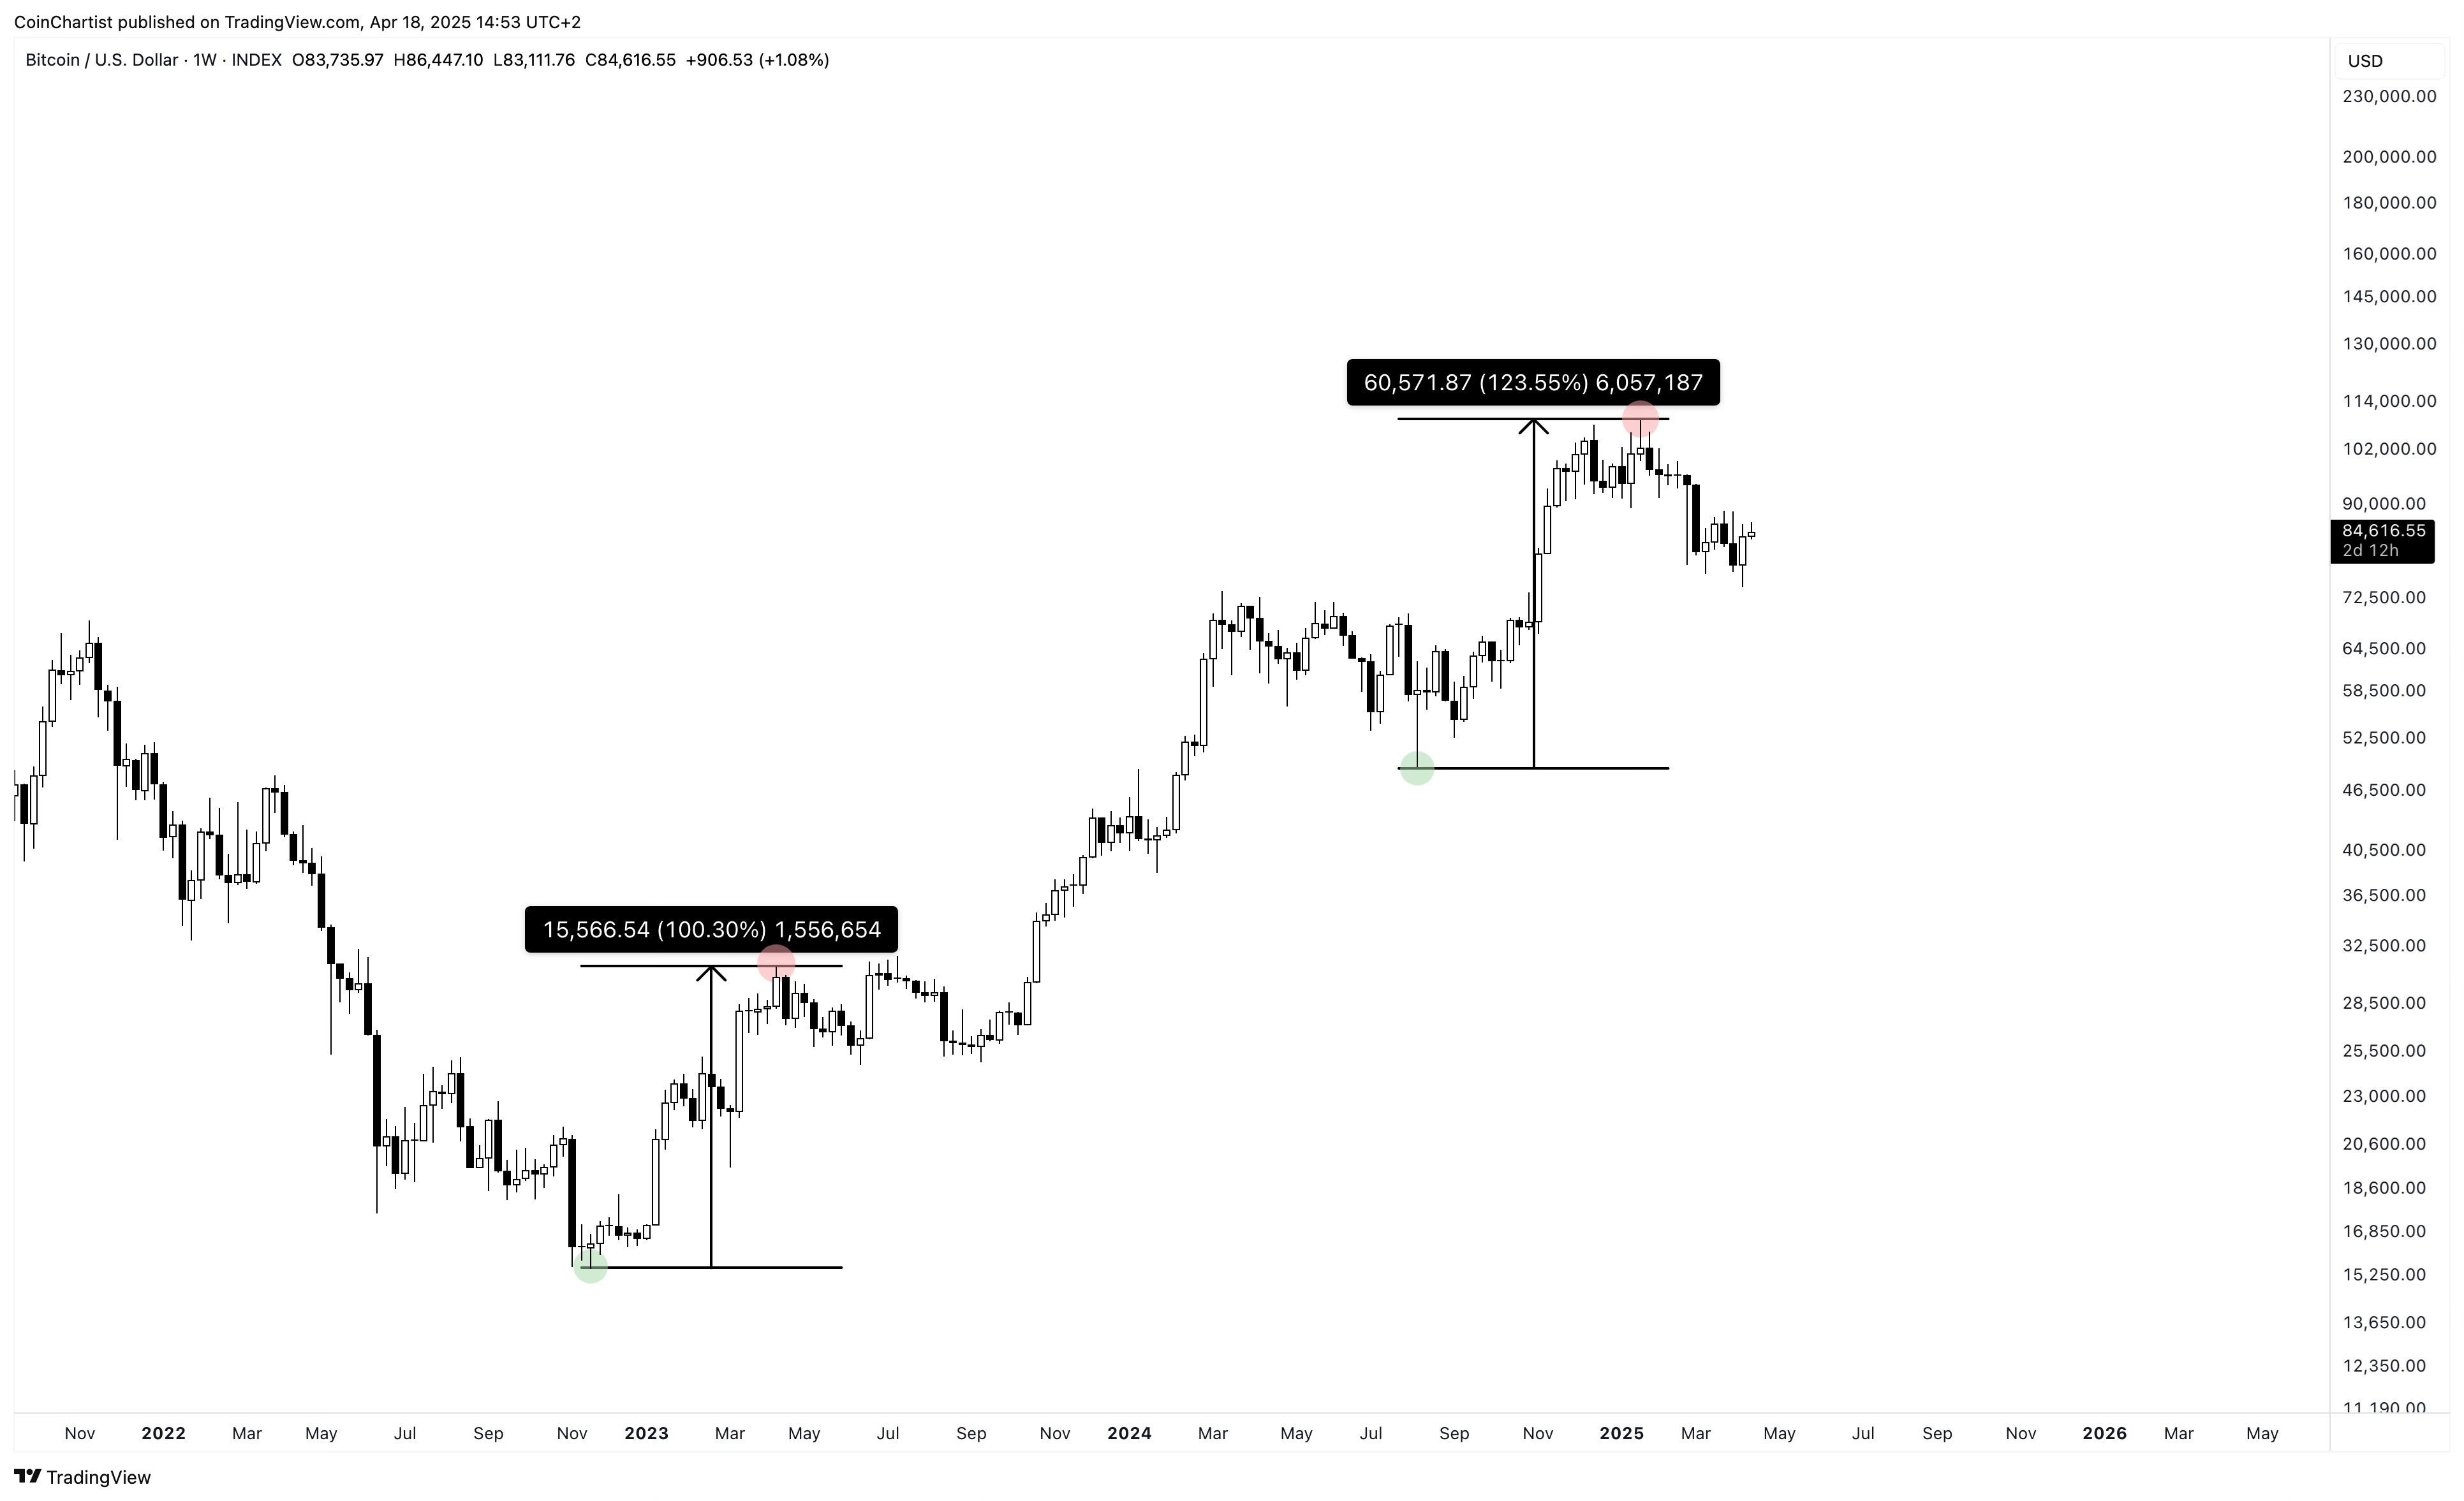
Not only do waves 1 and 5 match in magnitude, when measured wick to wick, the full price movement of wave 5 is 123.6%. While wave 1 was 100% growth. This represents a Fibonacci relationship between wave 1 and wave 5, which is yet another guideline per Elliott Wave Principle.
Extending the Bitcoin bull market
While the requirements for the bull run to have ended are satisfied per the last section, there is still some hope left for one more all-time high. But I think the chance of an extended fifth wave scenario remains overall low. In fact, due to the latest fractal I’ve discovered, I’m now giving more credence to a subwave 4 scenario with one more bullish move up remaining over the extended fifth wave scenario.
Keep reading with a 7-day free trial
Subscribe to CoinChartist to keep reading this post and get 7 days of free access to the full post archives.