

The Bear Is Here
Bitcoin is in a bear market. But how far along is it? And what happens to altcoins?

Disclaimer: The information provided in this Substack newsletter is for general informational purposes only and should not be considered as financial advice. Investing involves risk, and past performance is not indicative of future results. Please conduct your own research or consult a financial advisor before making any investment decisions. The newsletter disclaims any liability for losses or damages arising from the use of this information.
The Bear Is Here overview:
Bitcoin’s uptrend is starting to show signs of weakness — here are the key levels to watch
The Bollinger Bands nailed the timing and direction of this latest move
What else are the Bollinger Bands telling us? Check out the analysis and education
One barometer of the business cycle shows us why this time was different for crypto
More Bitcoin bear market signals suggest we’re already in the midst – it isn’t just starting as many suspect
Finally, I share some updated Elliott Wave counts that could help us understand what’s to come in the months and years ahead
Bitcoin is trading below $100,000 for the first time in 150 days. Its return below the most important rounded psychological resistance level imaginable is notable. This could genuinely have been the last time we’ve seen Bitcoin trade above $100,000 for a long time – perhaps years. For anyone who didn’t sell their BTC above $100,000, a painful reality could be around the corner. Even worse, if Bitcoin doesn’t keep pushing higher, what happens to altcoins? These are very real situations that could be unfolding at this very moment. While it isn’t wise to completely rule out more upside, as Bitcoin has proven resilient again and again, negative macroeconomics conditions, bull market momentum turning over, and record outflows from institutions are synchronizing to create intense sell pressure. These conditions are causing Bitcoin’s bull run to show some cracks. It isn’t yet completely over, but technicals are starting to exhibit bear market signatures, as this issue will cover. I realize this is not what most want to hear, but it is critical that you accept the market you’re given, and adjust your strategy accordingly.
Bitcoin Uptrend is in Serious Trouble
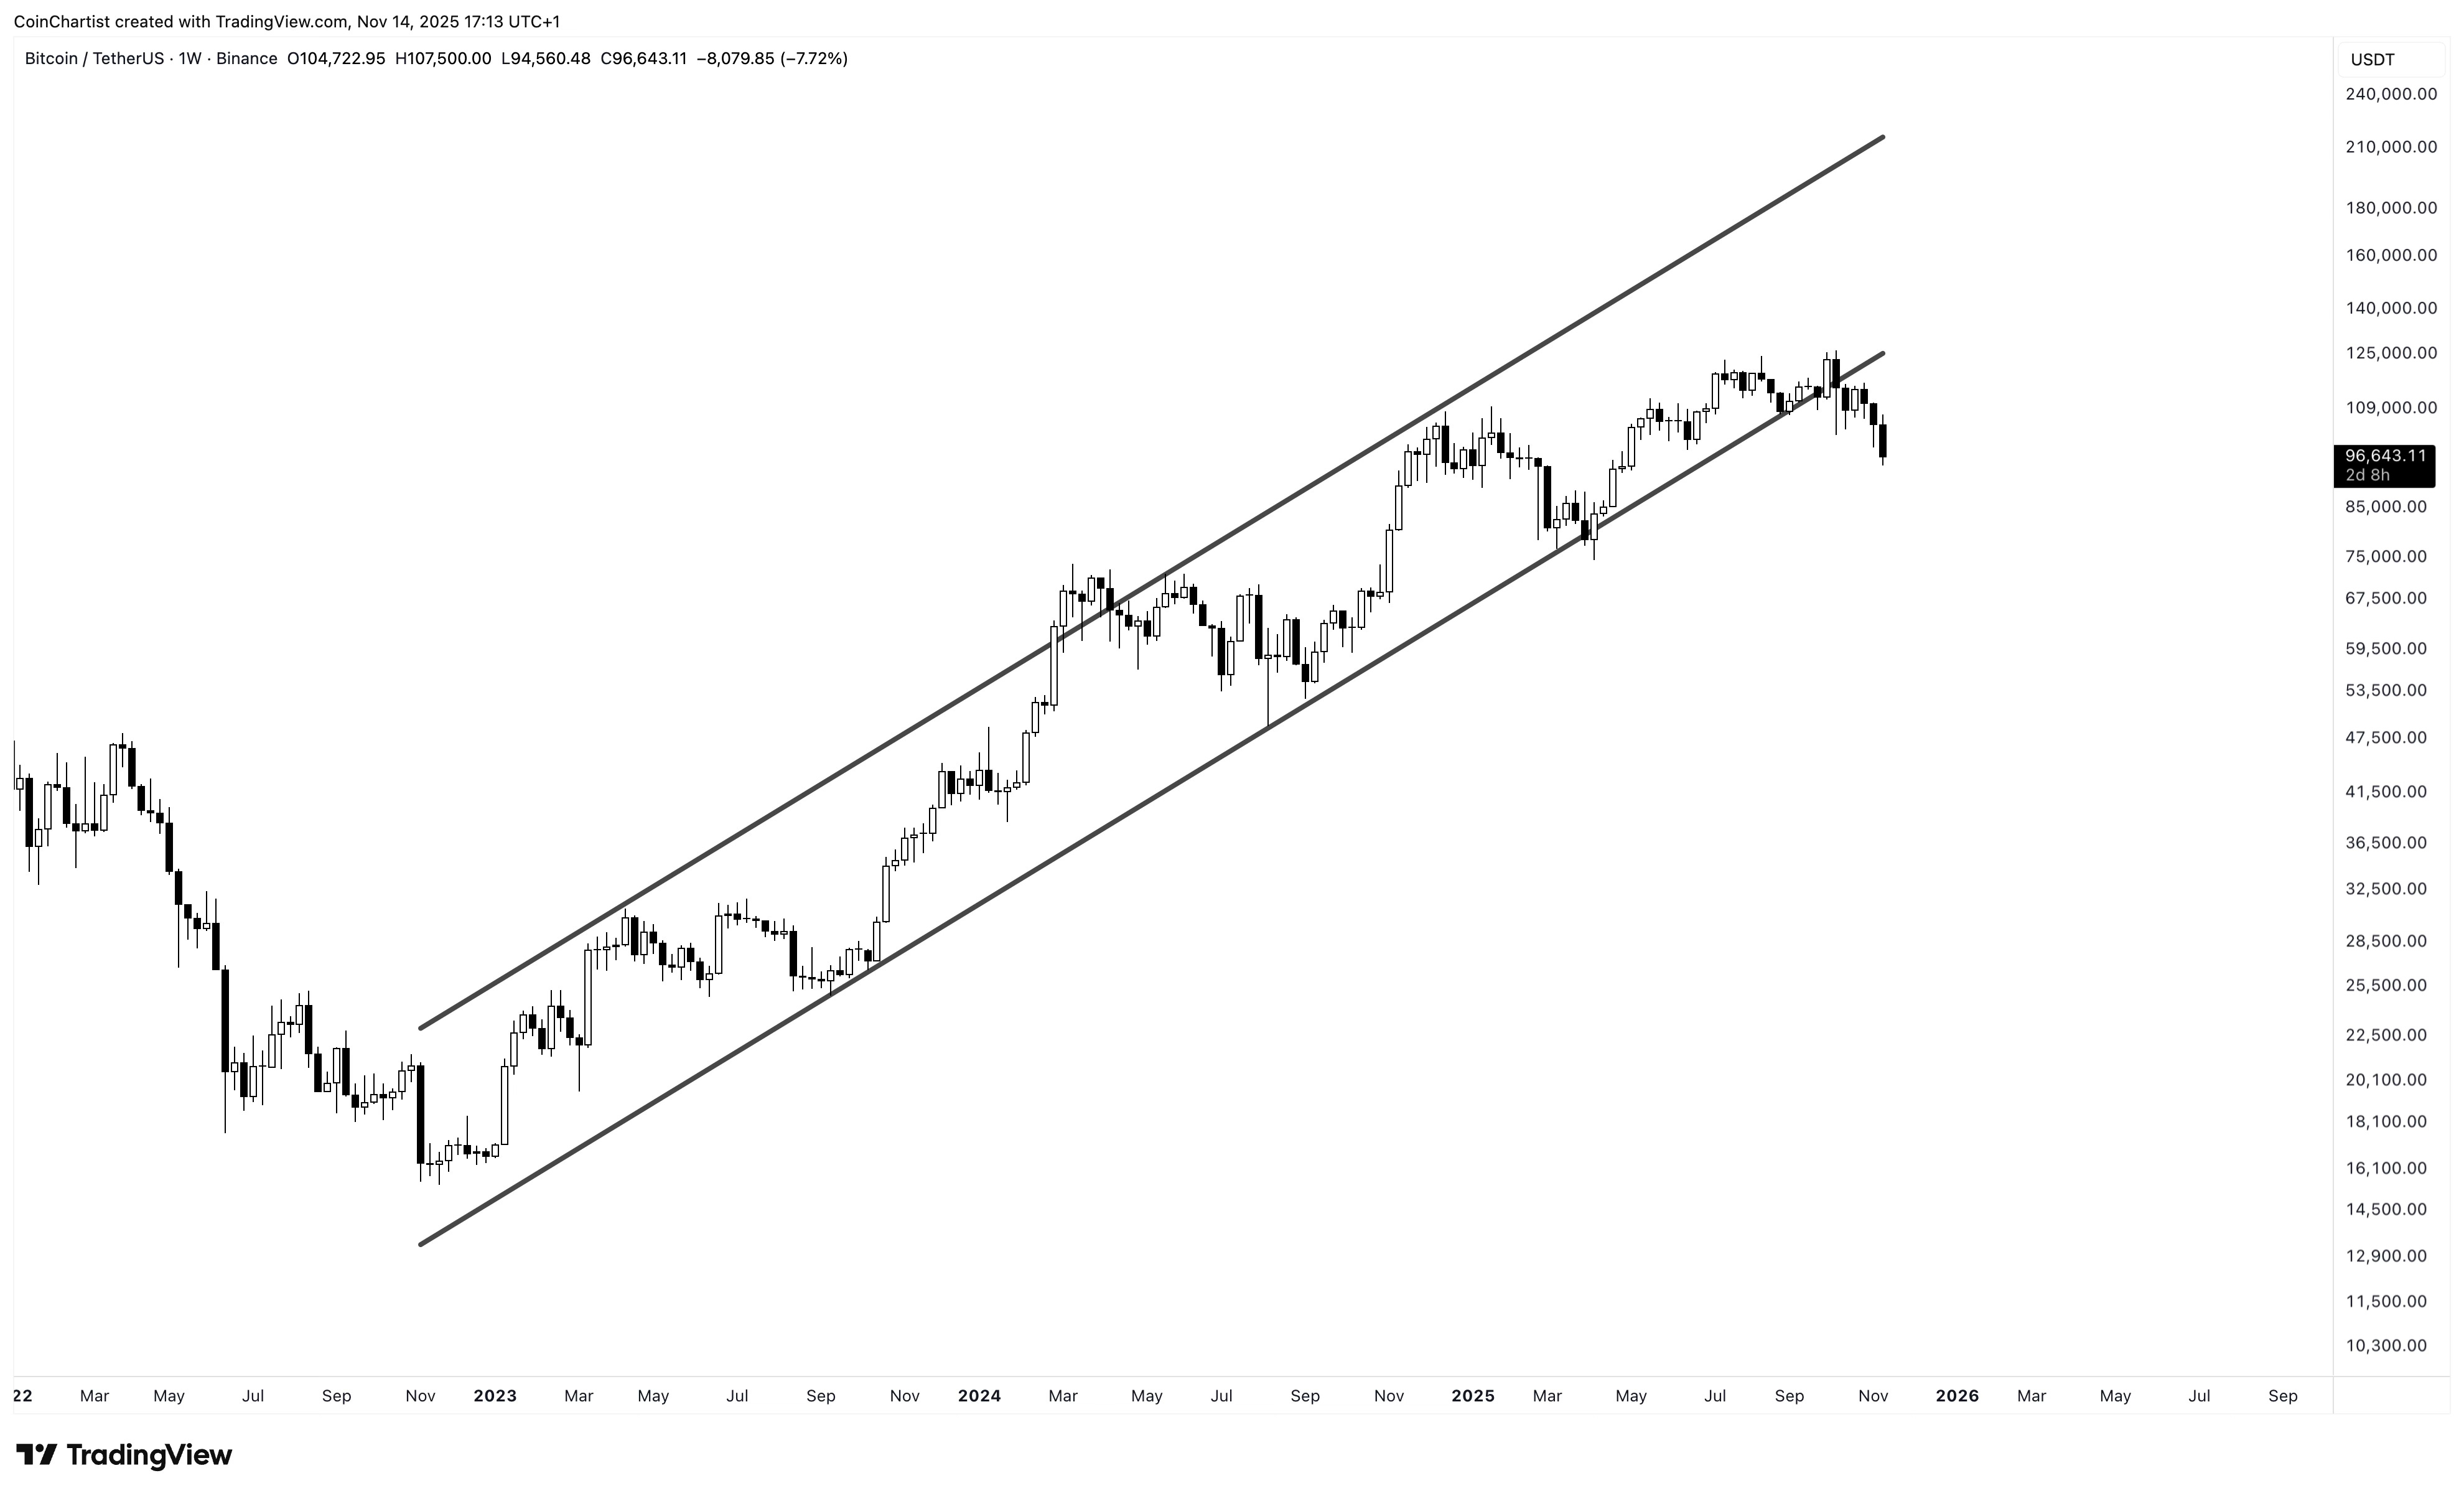
All throughout the bull market, I referred to this ongoing uptrend as the “Wall of Worry.” There’s an old adage in investing that suggests that bull markets climb a wall of worry, and bear markets slide down a slope of hope. During Bitcoin’s bull market, the news cycle was mostly bearish. The news cycle began to turn bullish after the ETF went live and has been nothing but positive since. Yet, Bitcoin is now falling out of the Wall of Worry uptrend channel. Another old adage in investing says that bulls take the stairs, while bears take the elevator. Beware, because this references how fast price moves down after an uptrend has ended.
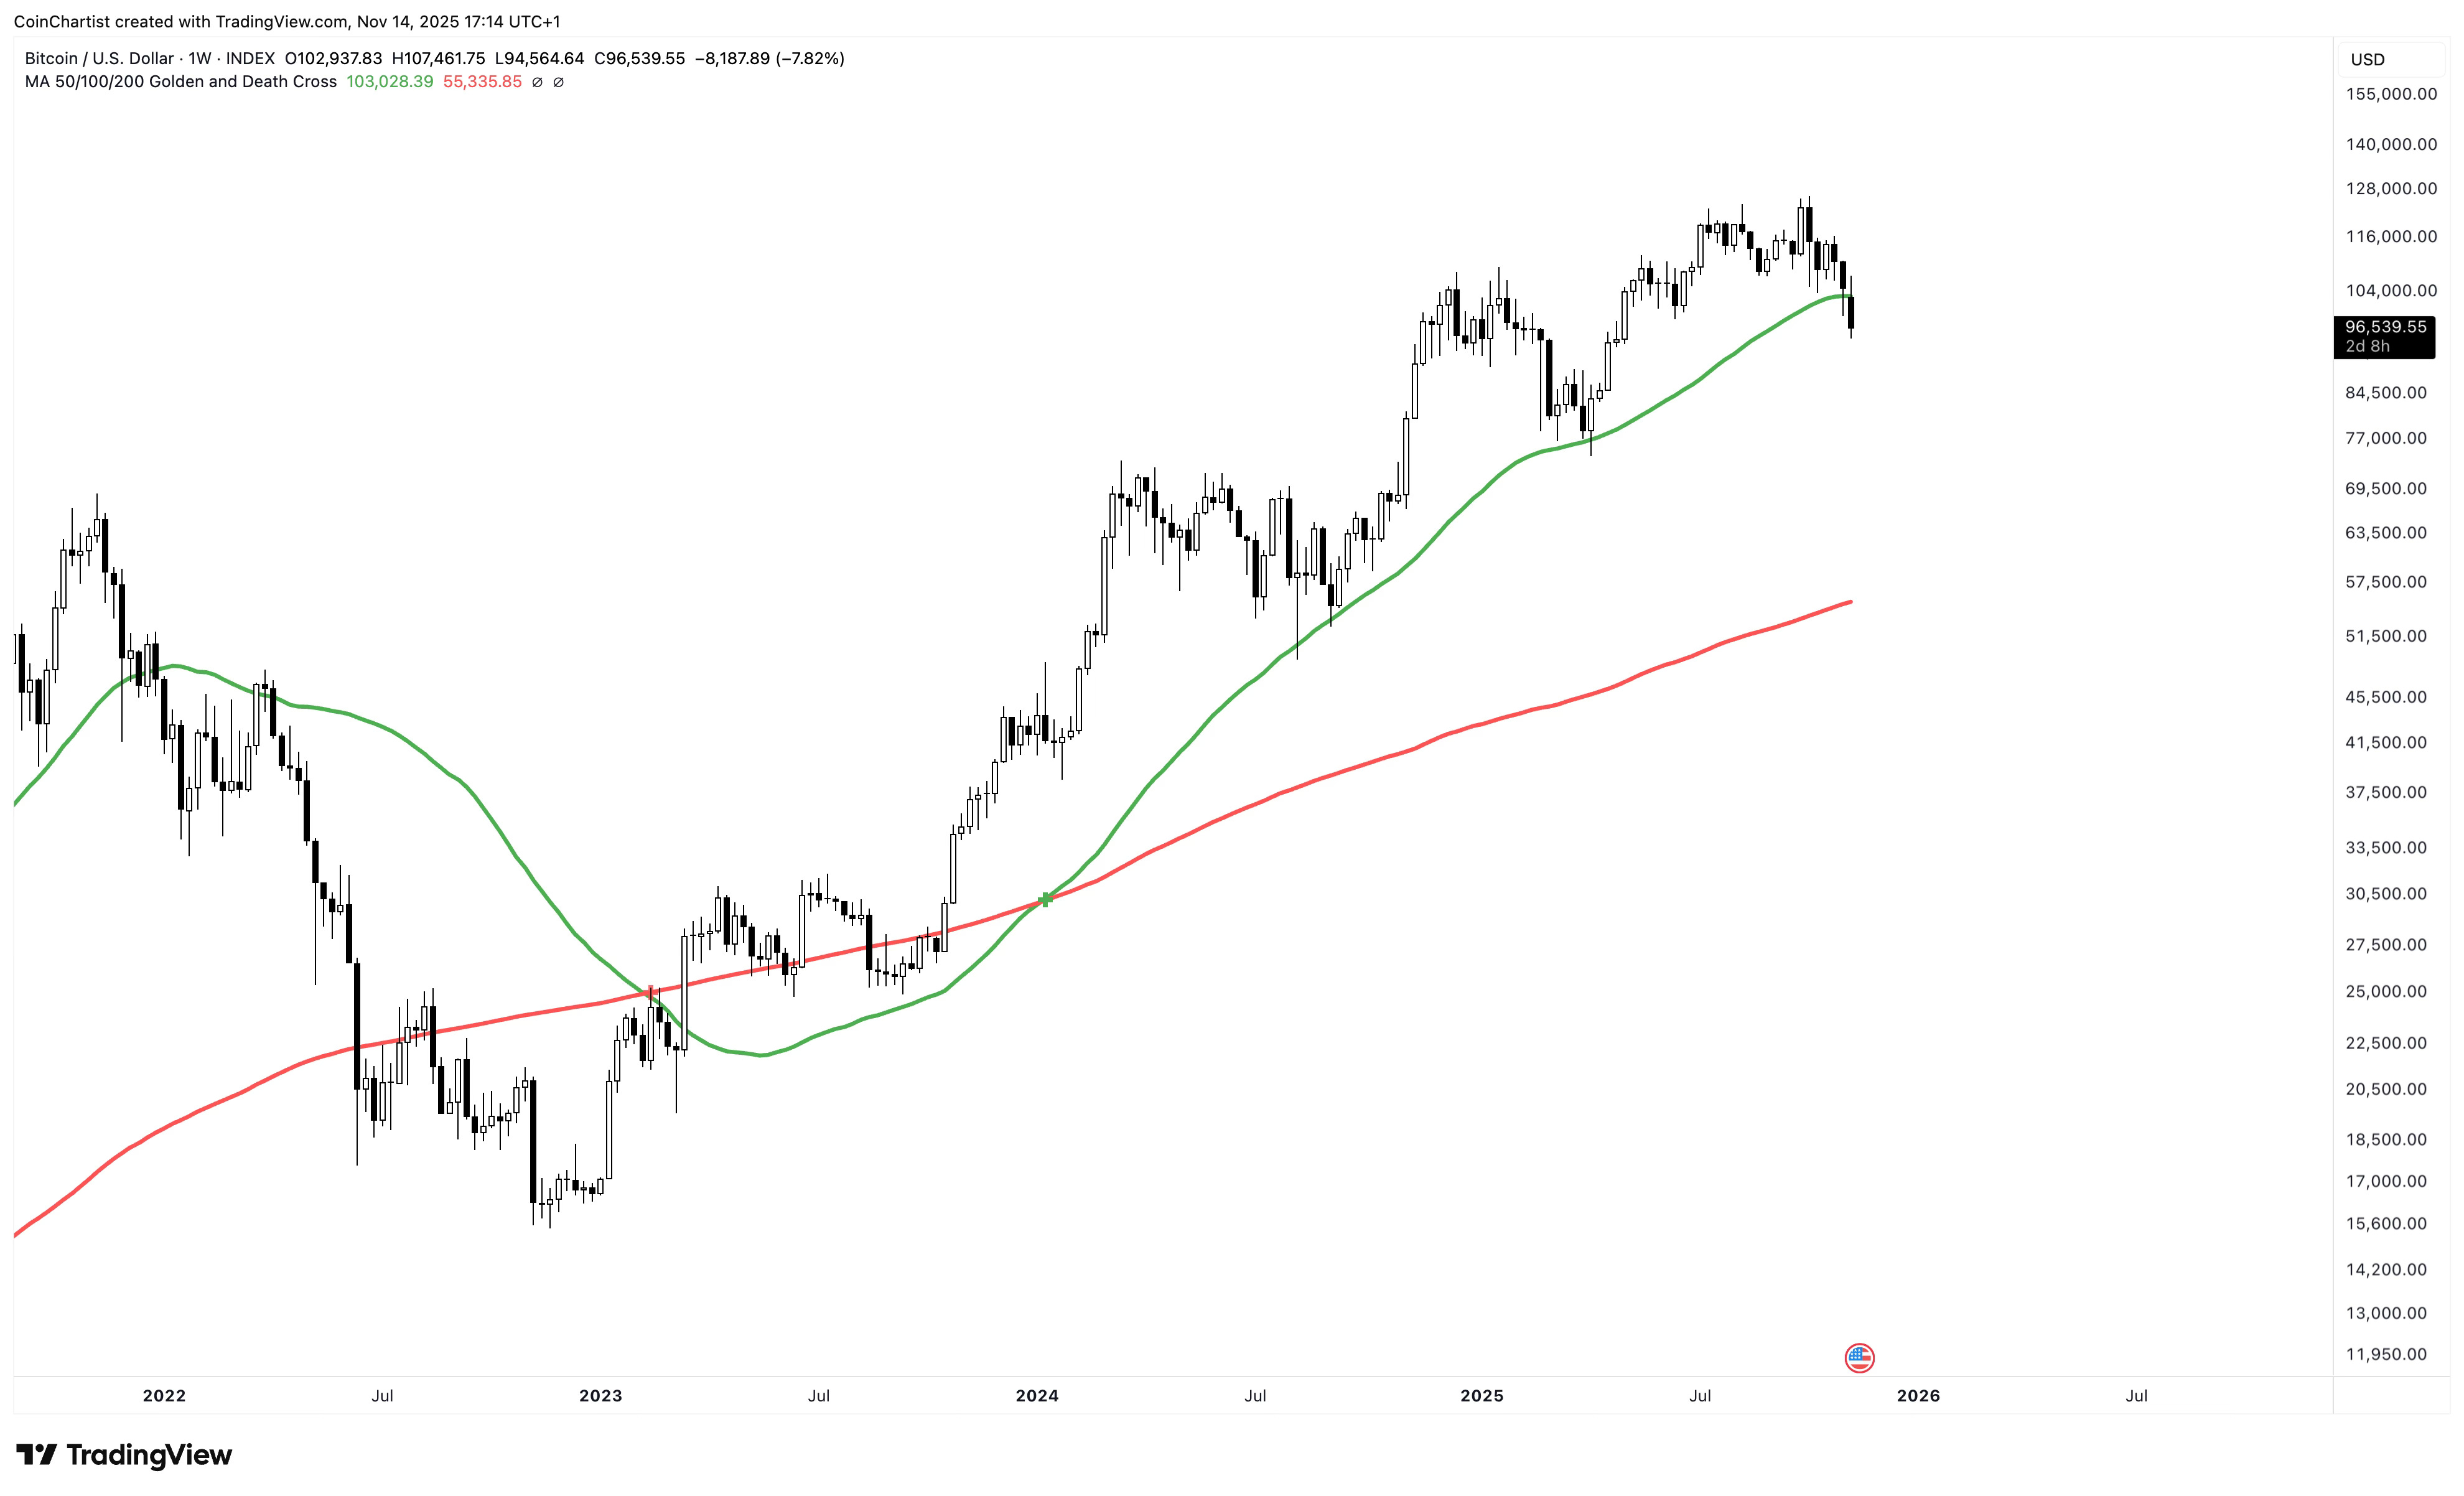
Bitcoin is a few thousand dollars below the 50-week Moving Average. Many analysts, traders, etc. are viewing this as the de-facto line in the sand between a bull and bear market in BTC. There’s still a chance bulls push price above the span by Sunday night, otherwise the candlestick will close below it for the first time since the bull market started in early 2023.
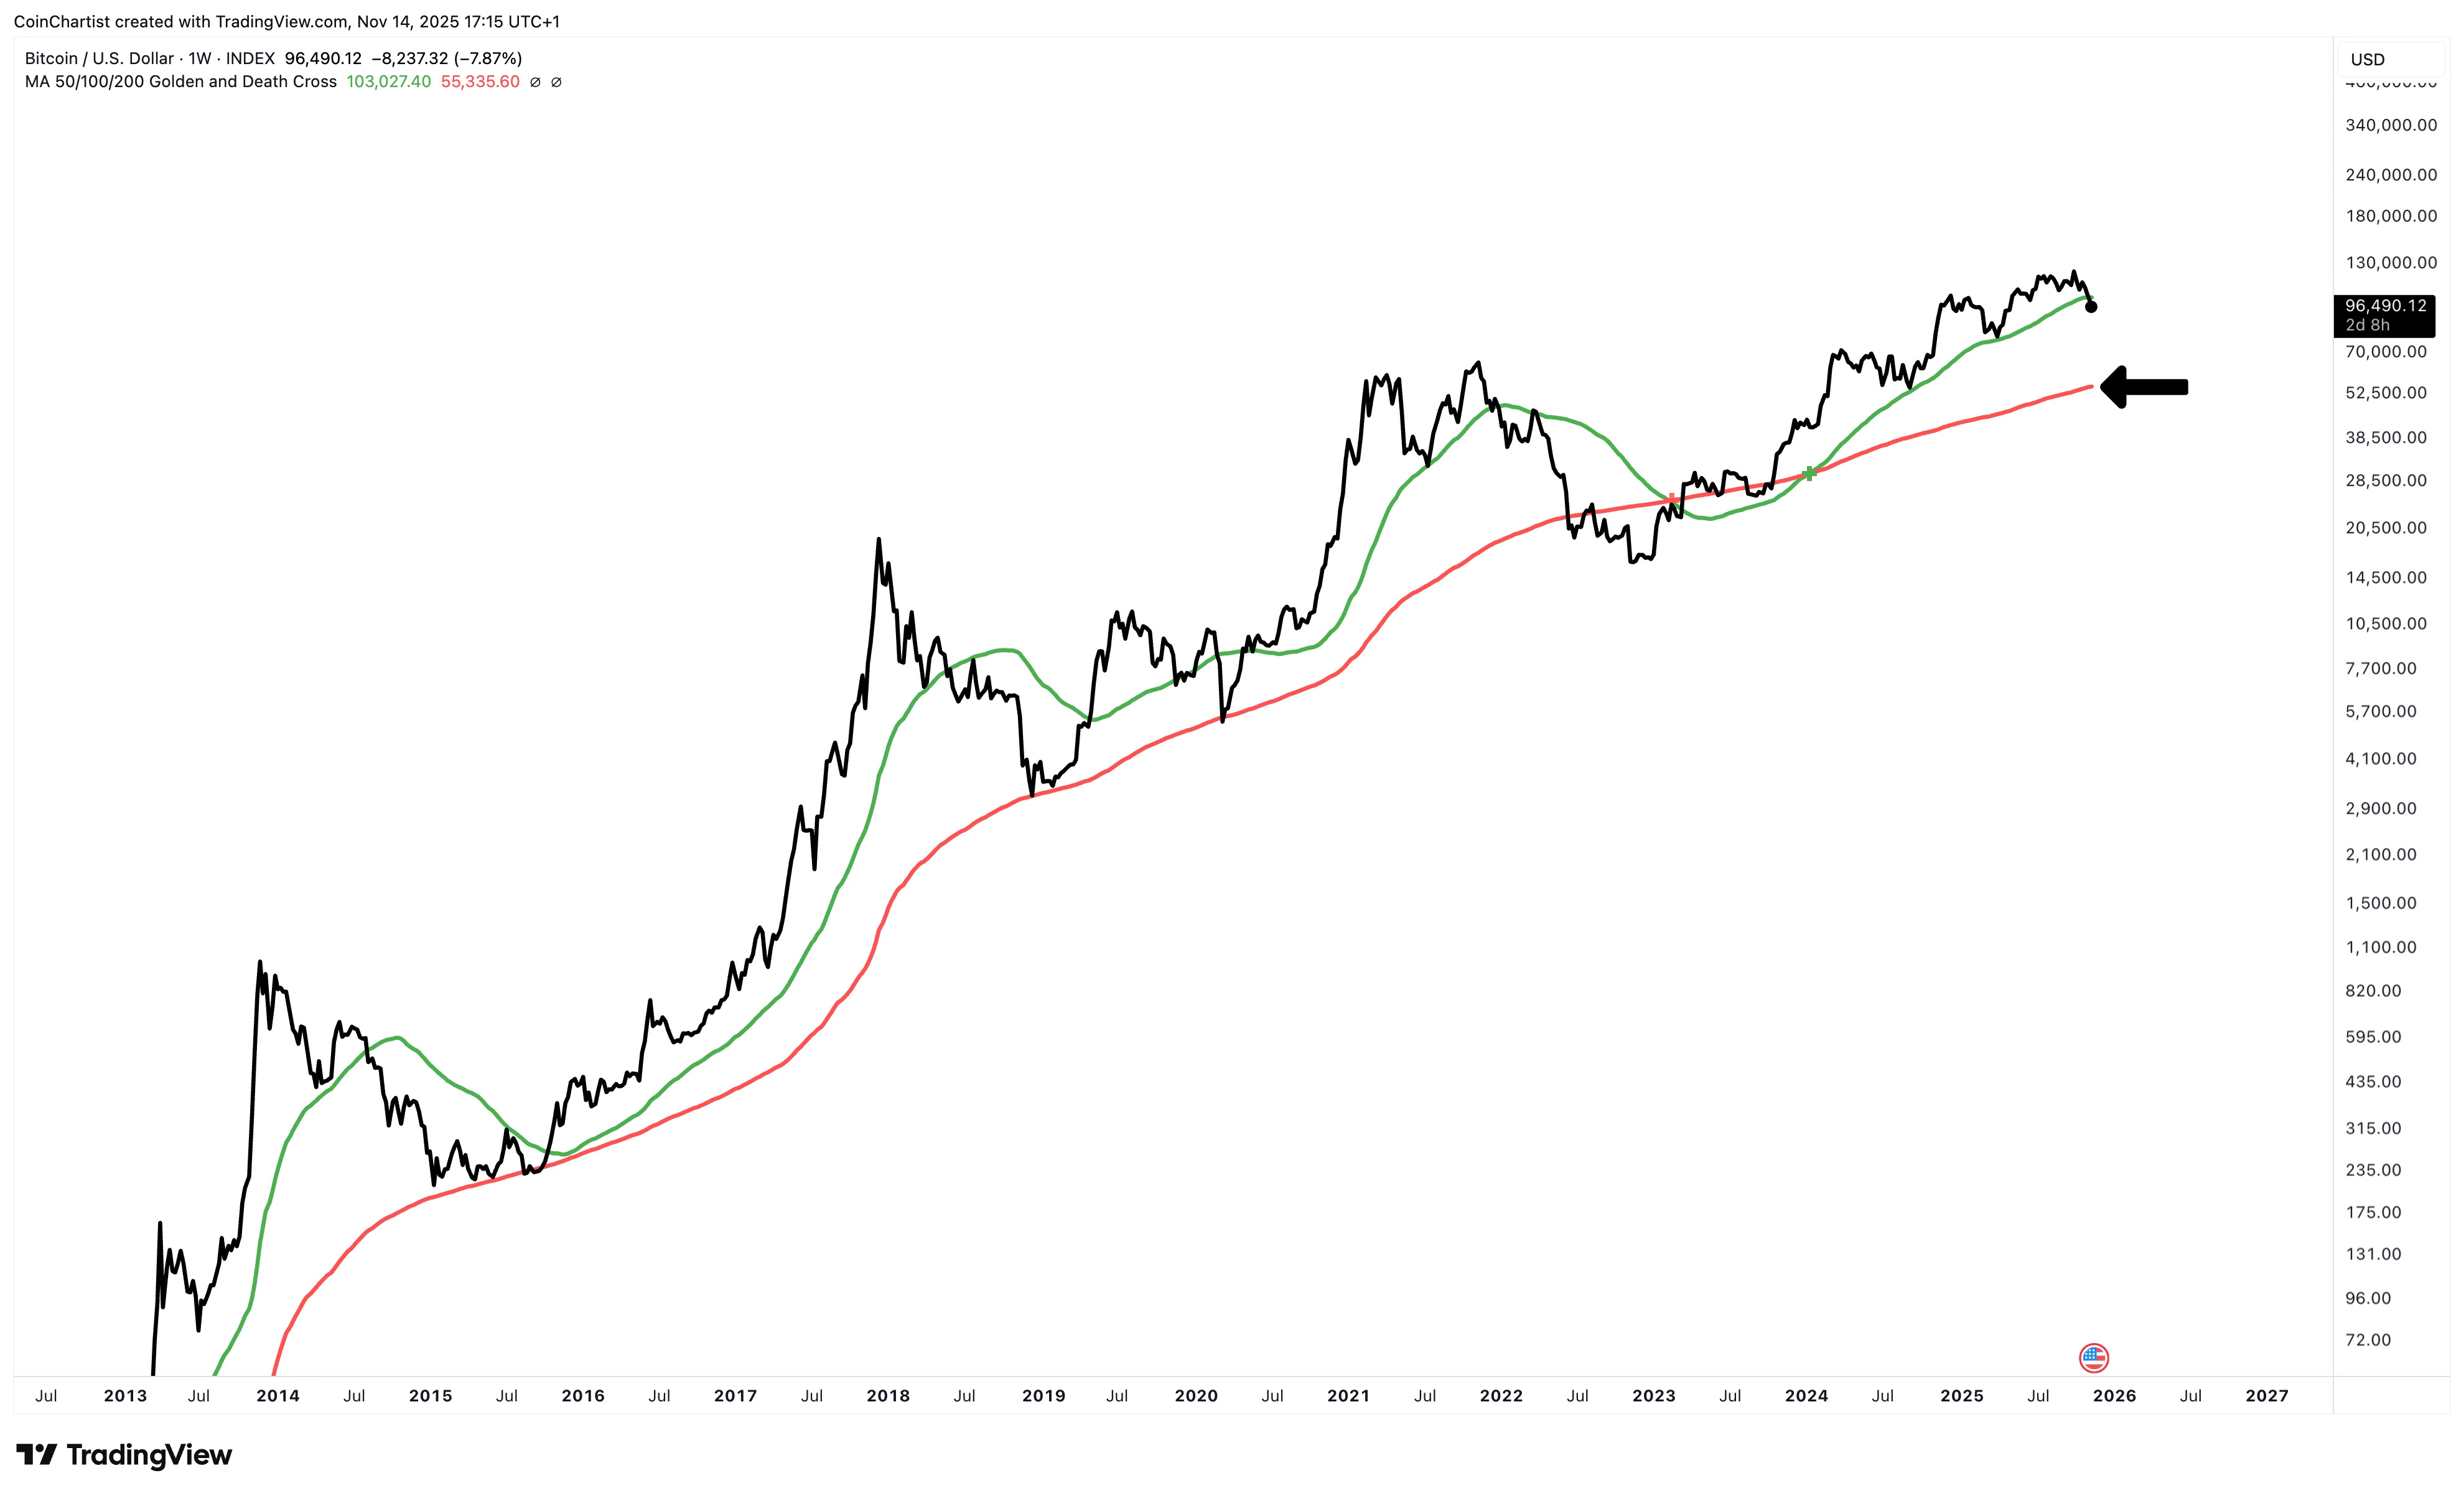
Each time the 50-week Moving Average was lost historically, Bitcoin price then fell to the 200-week Moving Average. If the same pattern continues, Bitcoin could see as low as $55,000 per coin. Note that BTCUSD bottomed at the 200-week MA several times. However, during the last bear market it traded below it for the first time ever. As such, price could once again trade below it, so don’t bank on it being a bottom again.
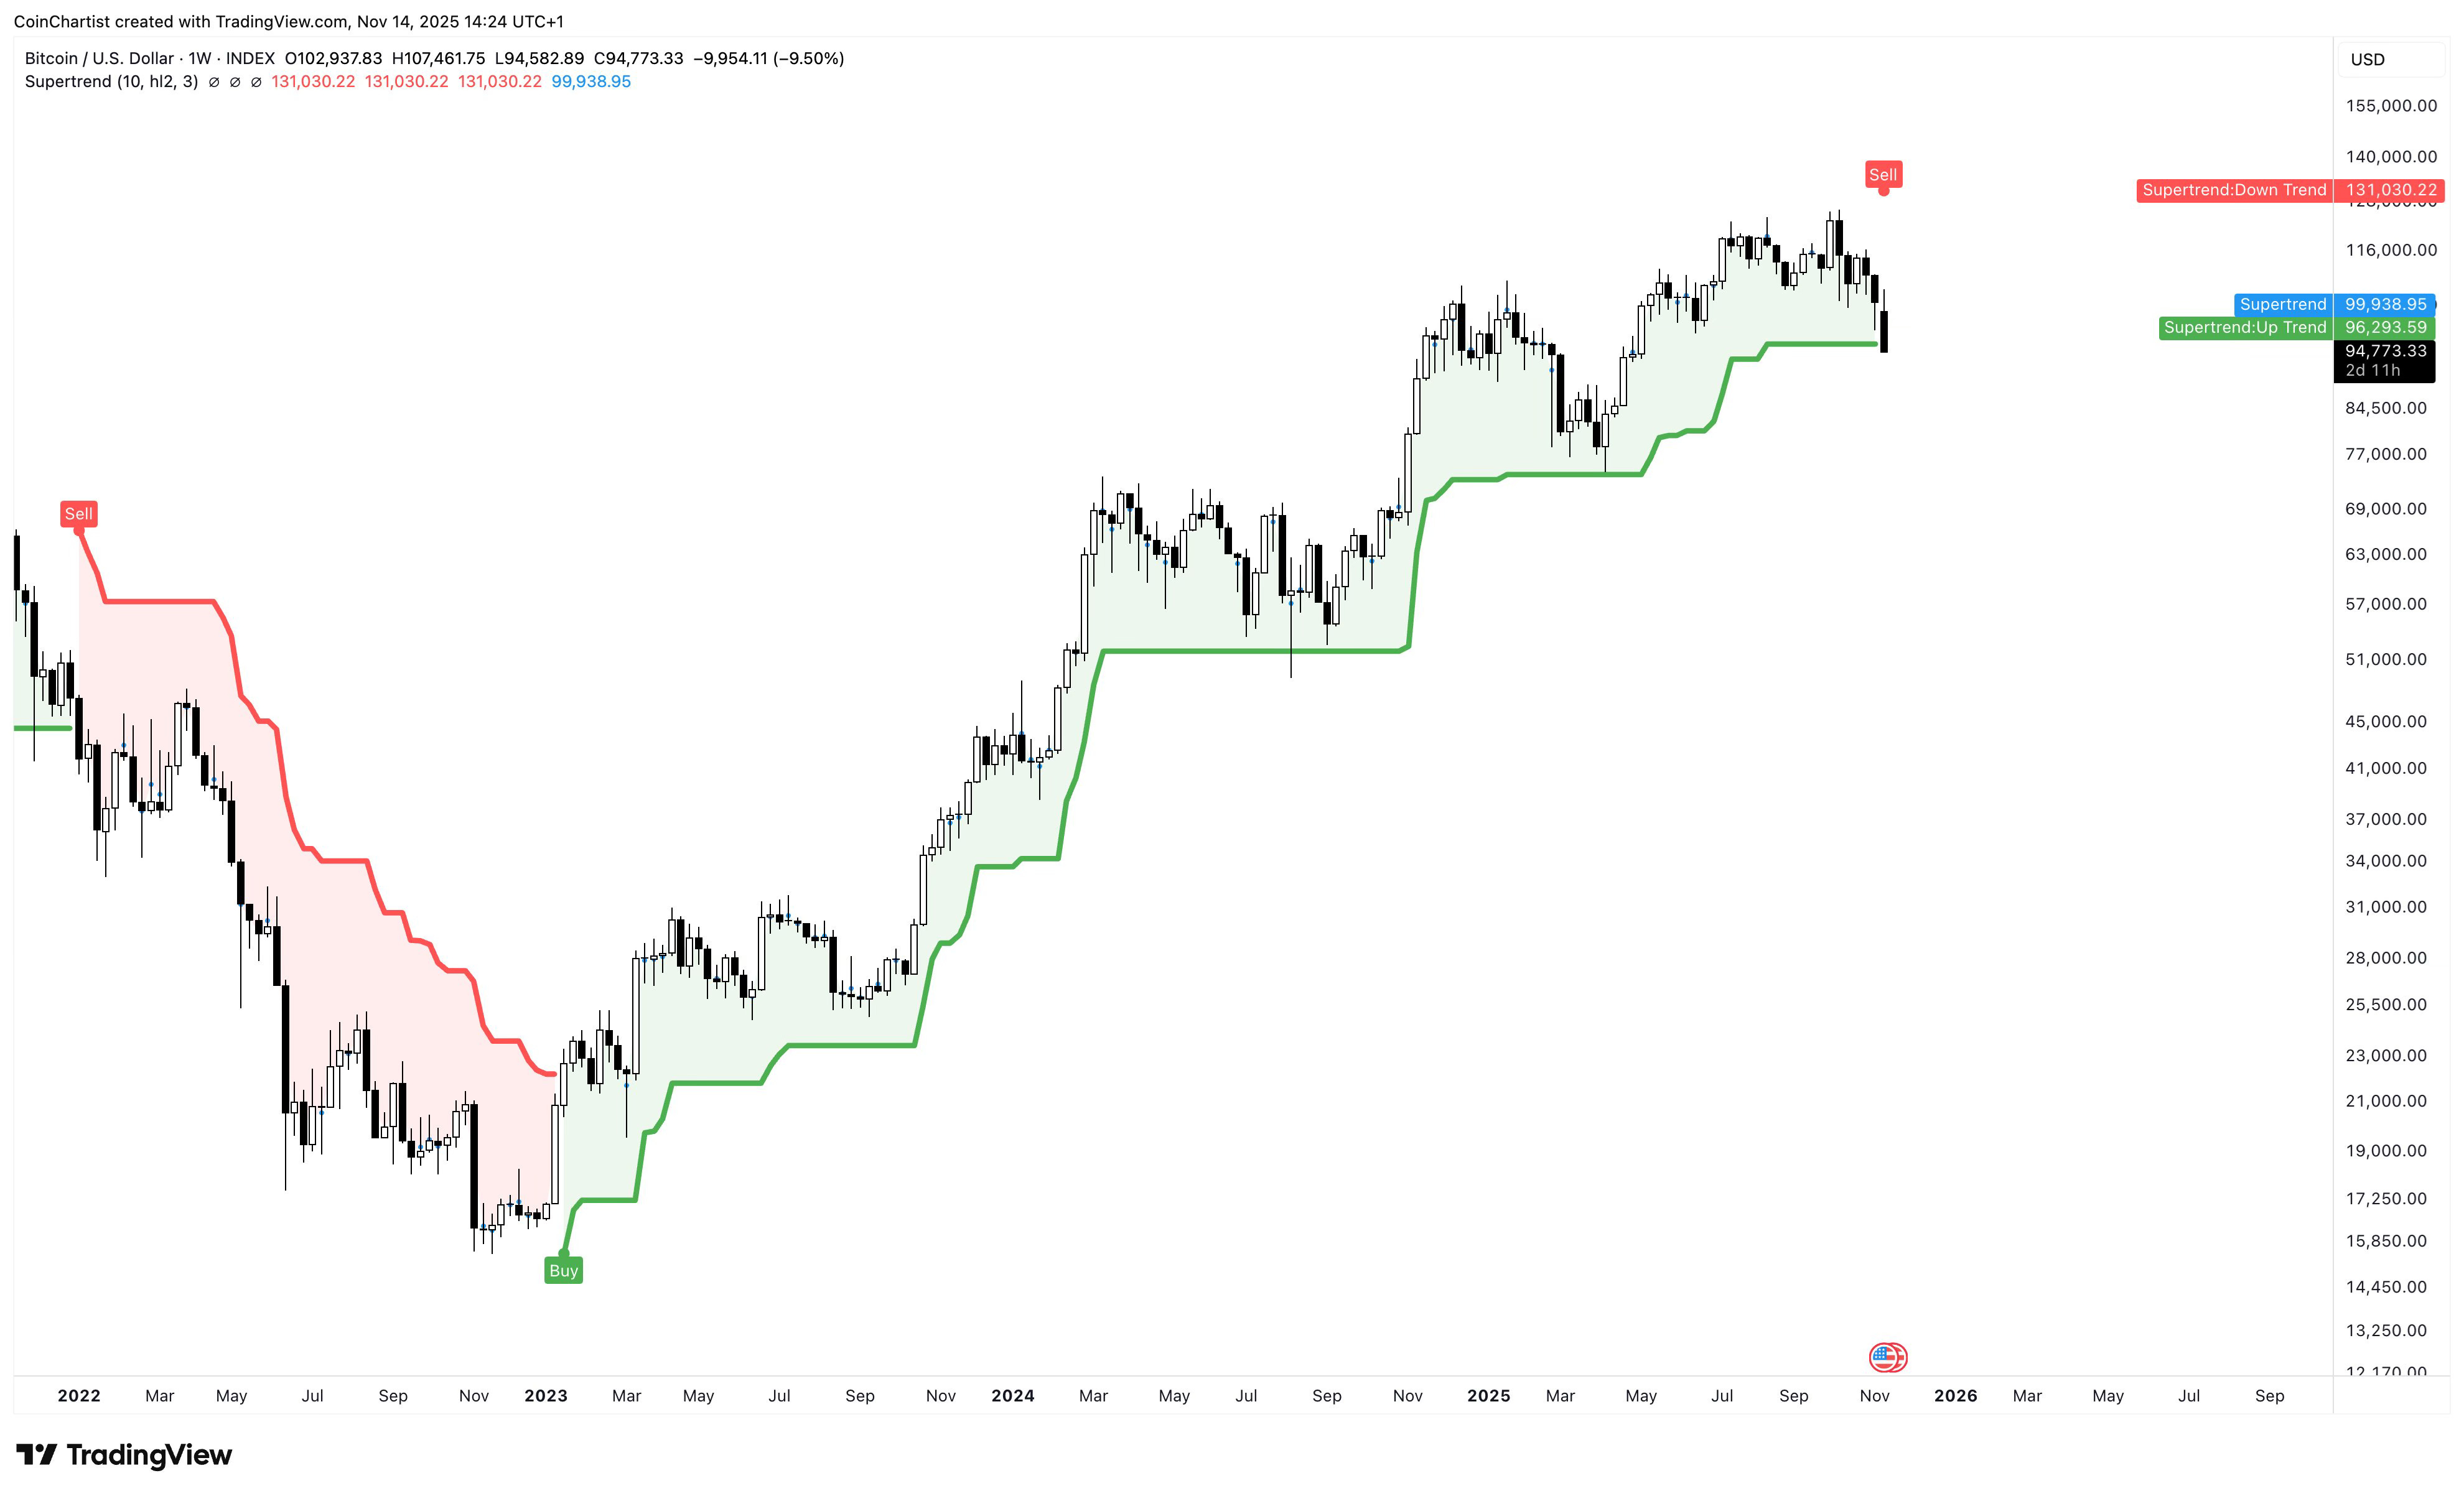
Bitcoin is flirting with a sell signal on the weekly SuperTrend. A weekly close below $96,265 is necessary for this signal to confirm. The signal has been a buy since early 2023. Prior to that it was a sell signal the entire 2022 bear market. Losing the SuperTrend on a closing basis is a clear sign that the trend is changing.
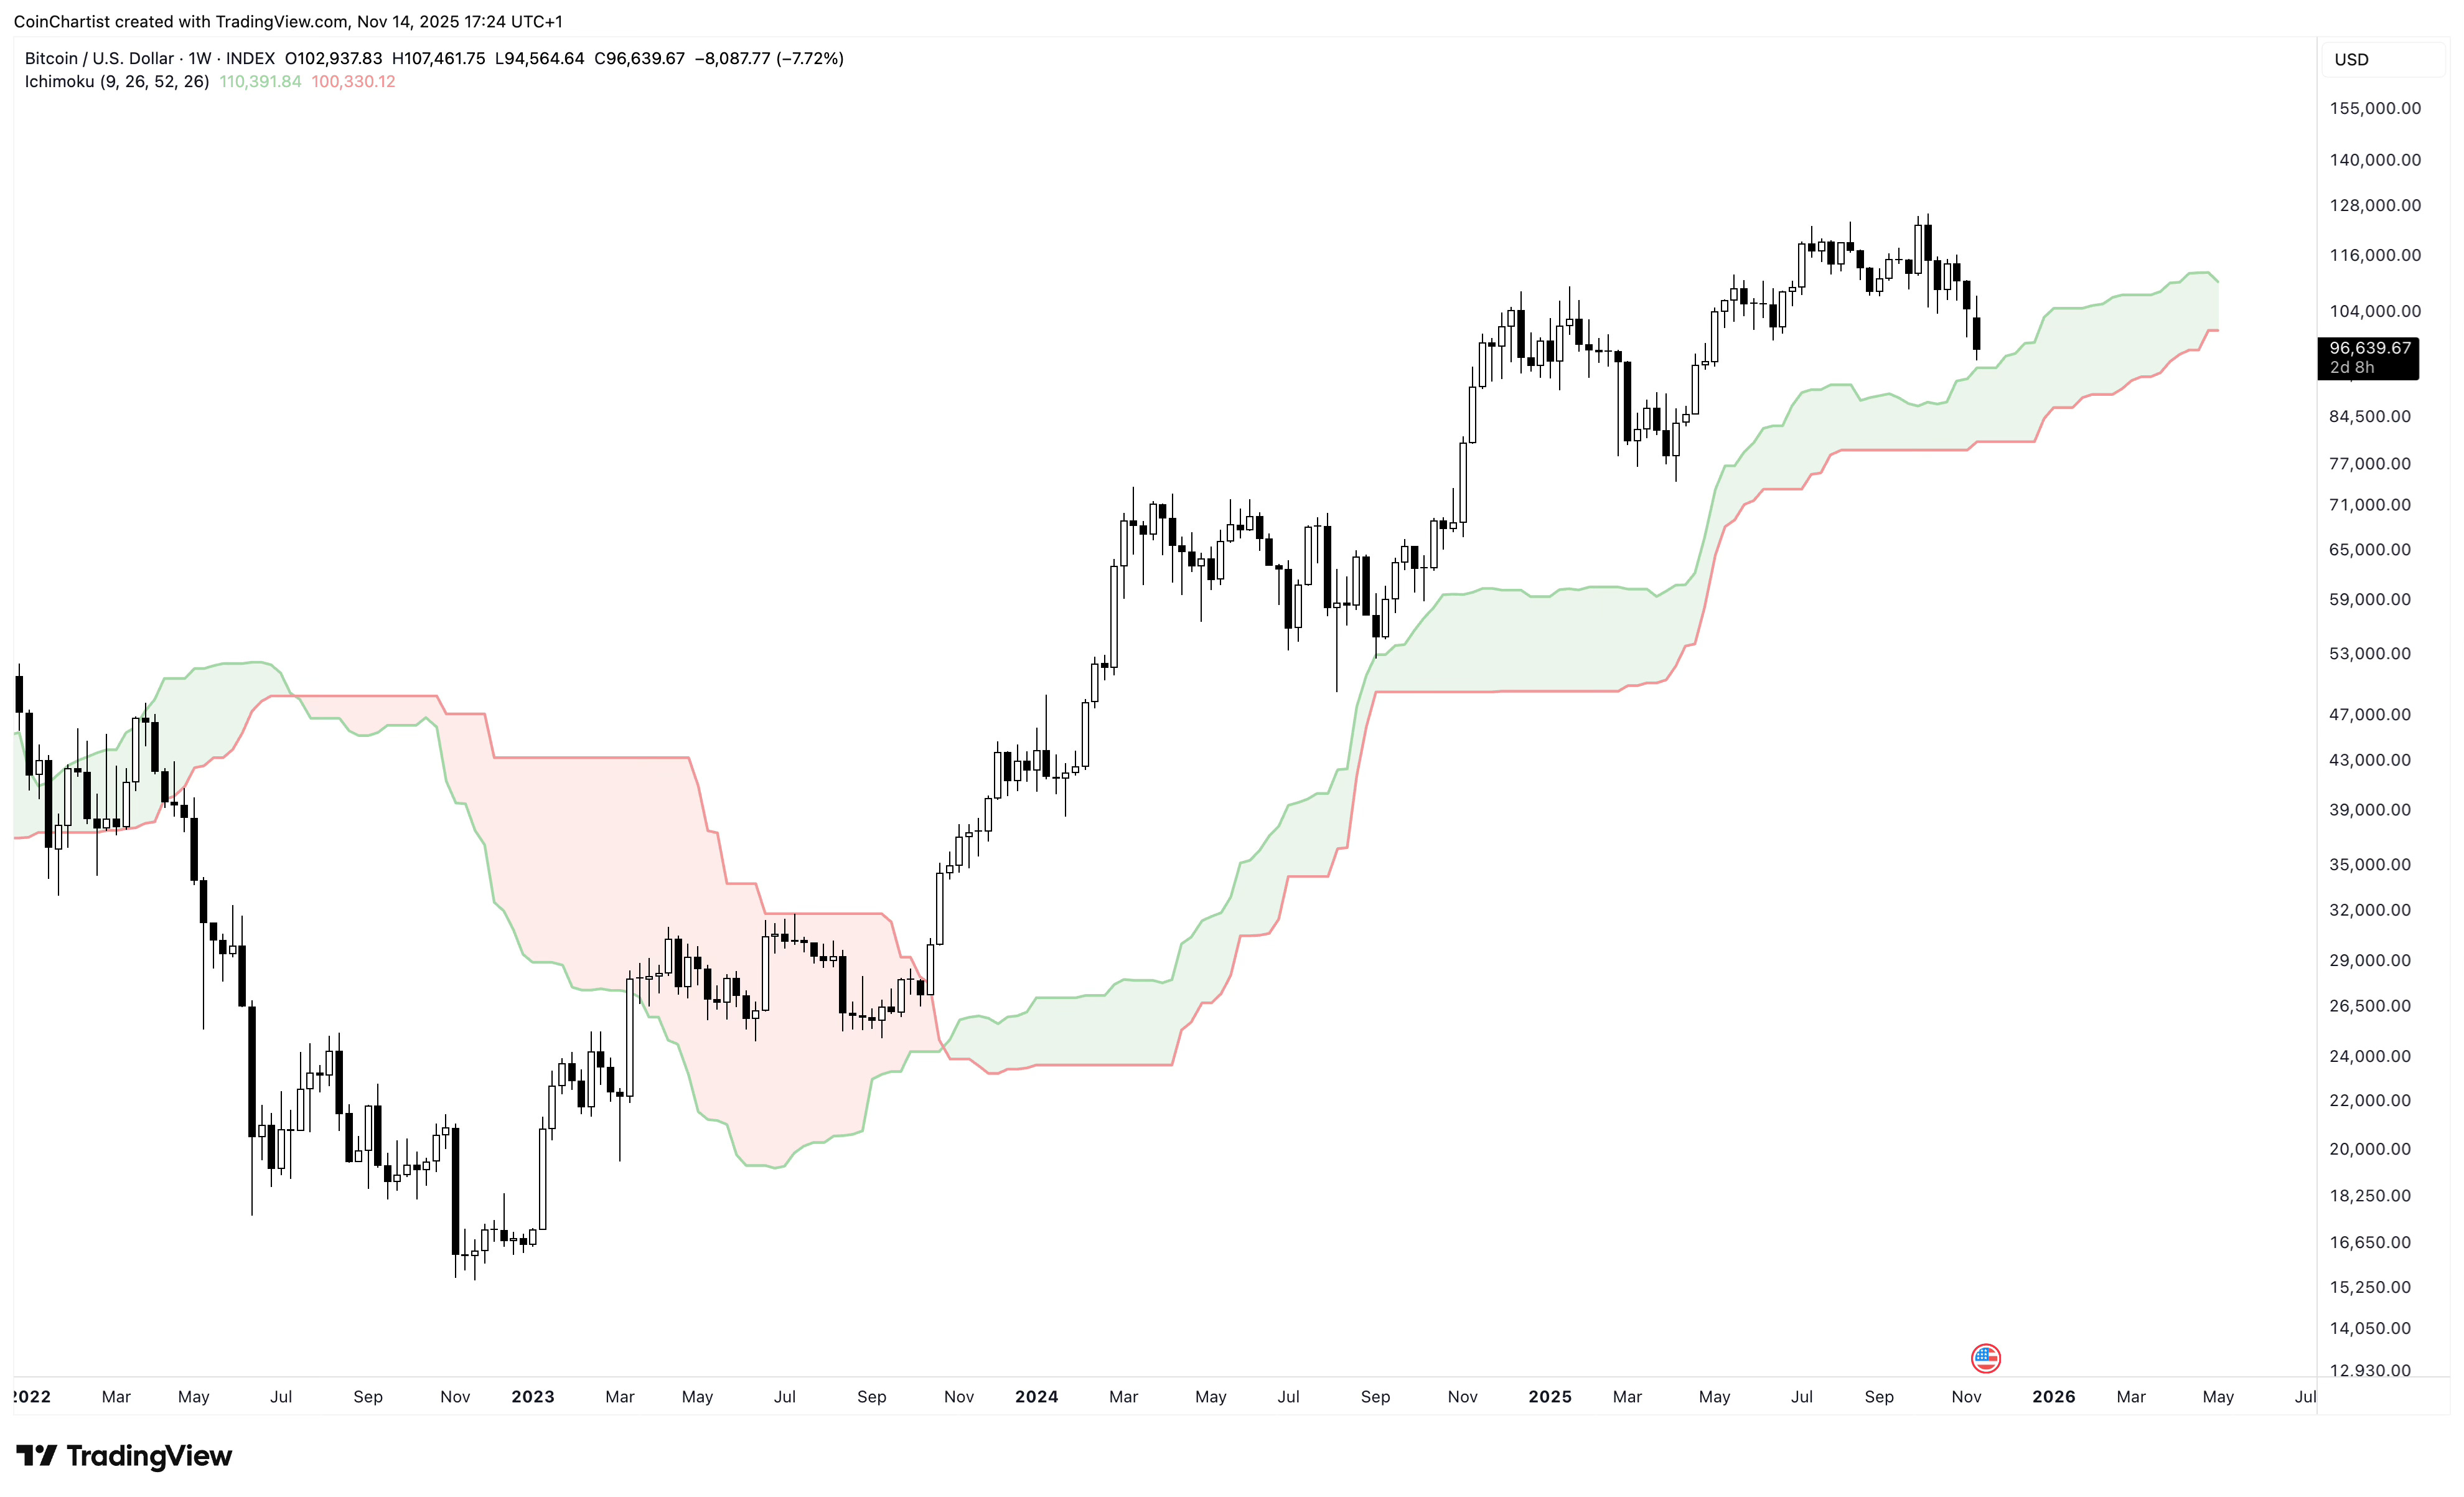
Bitcoin still has the Ichimoku cloud to the downside to potentially act as support. Falling below the Ichimoku cloud on the weekly timeframe typically starts the more dangerous phase of a bear market.
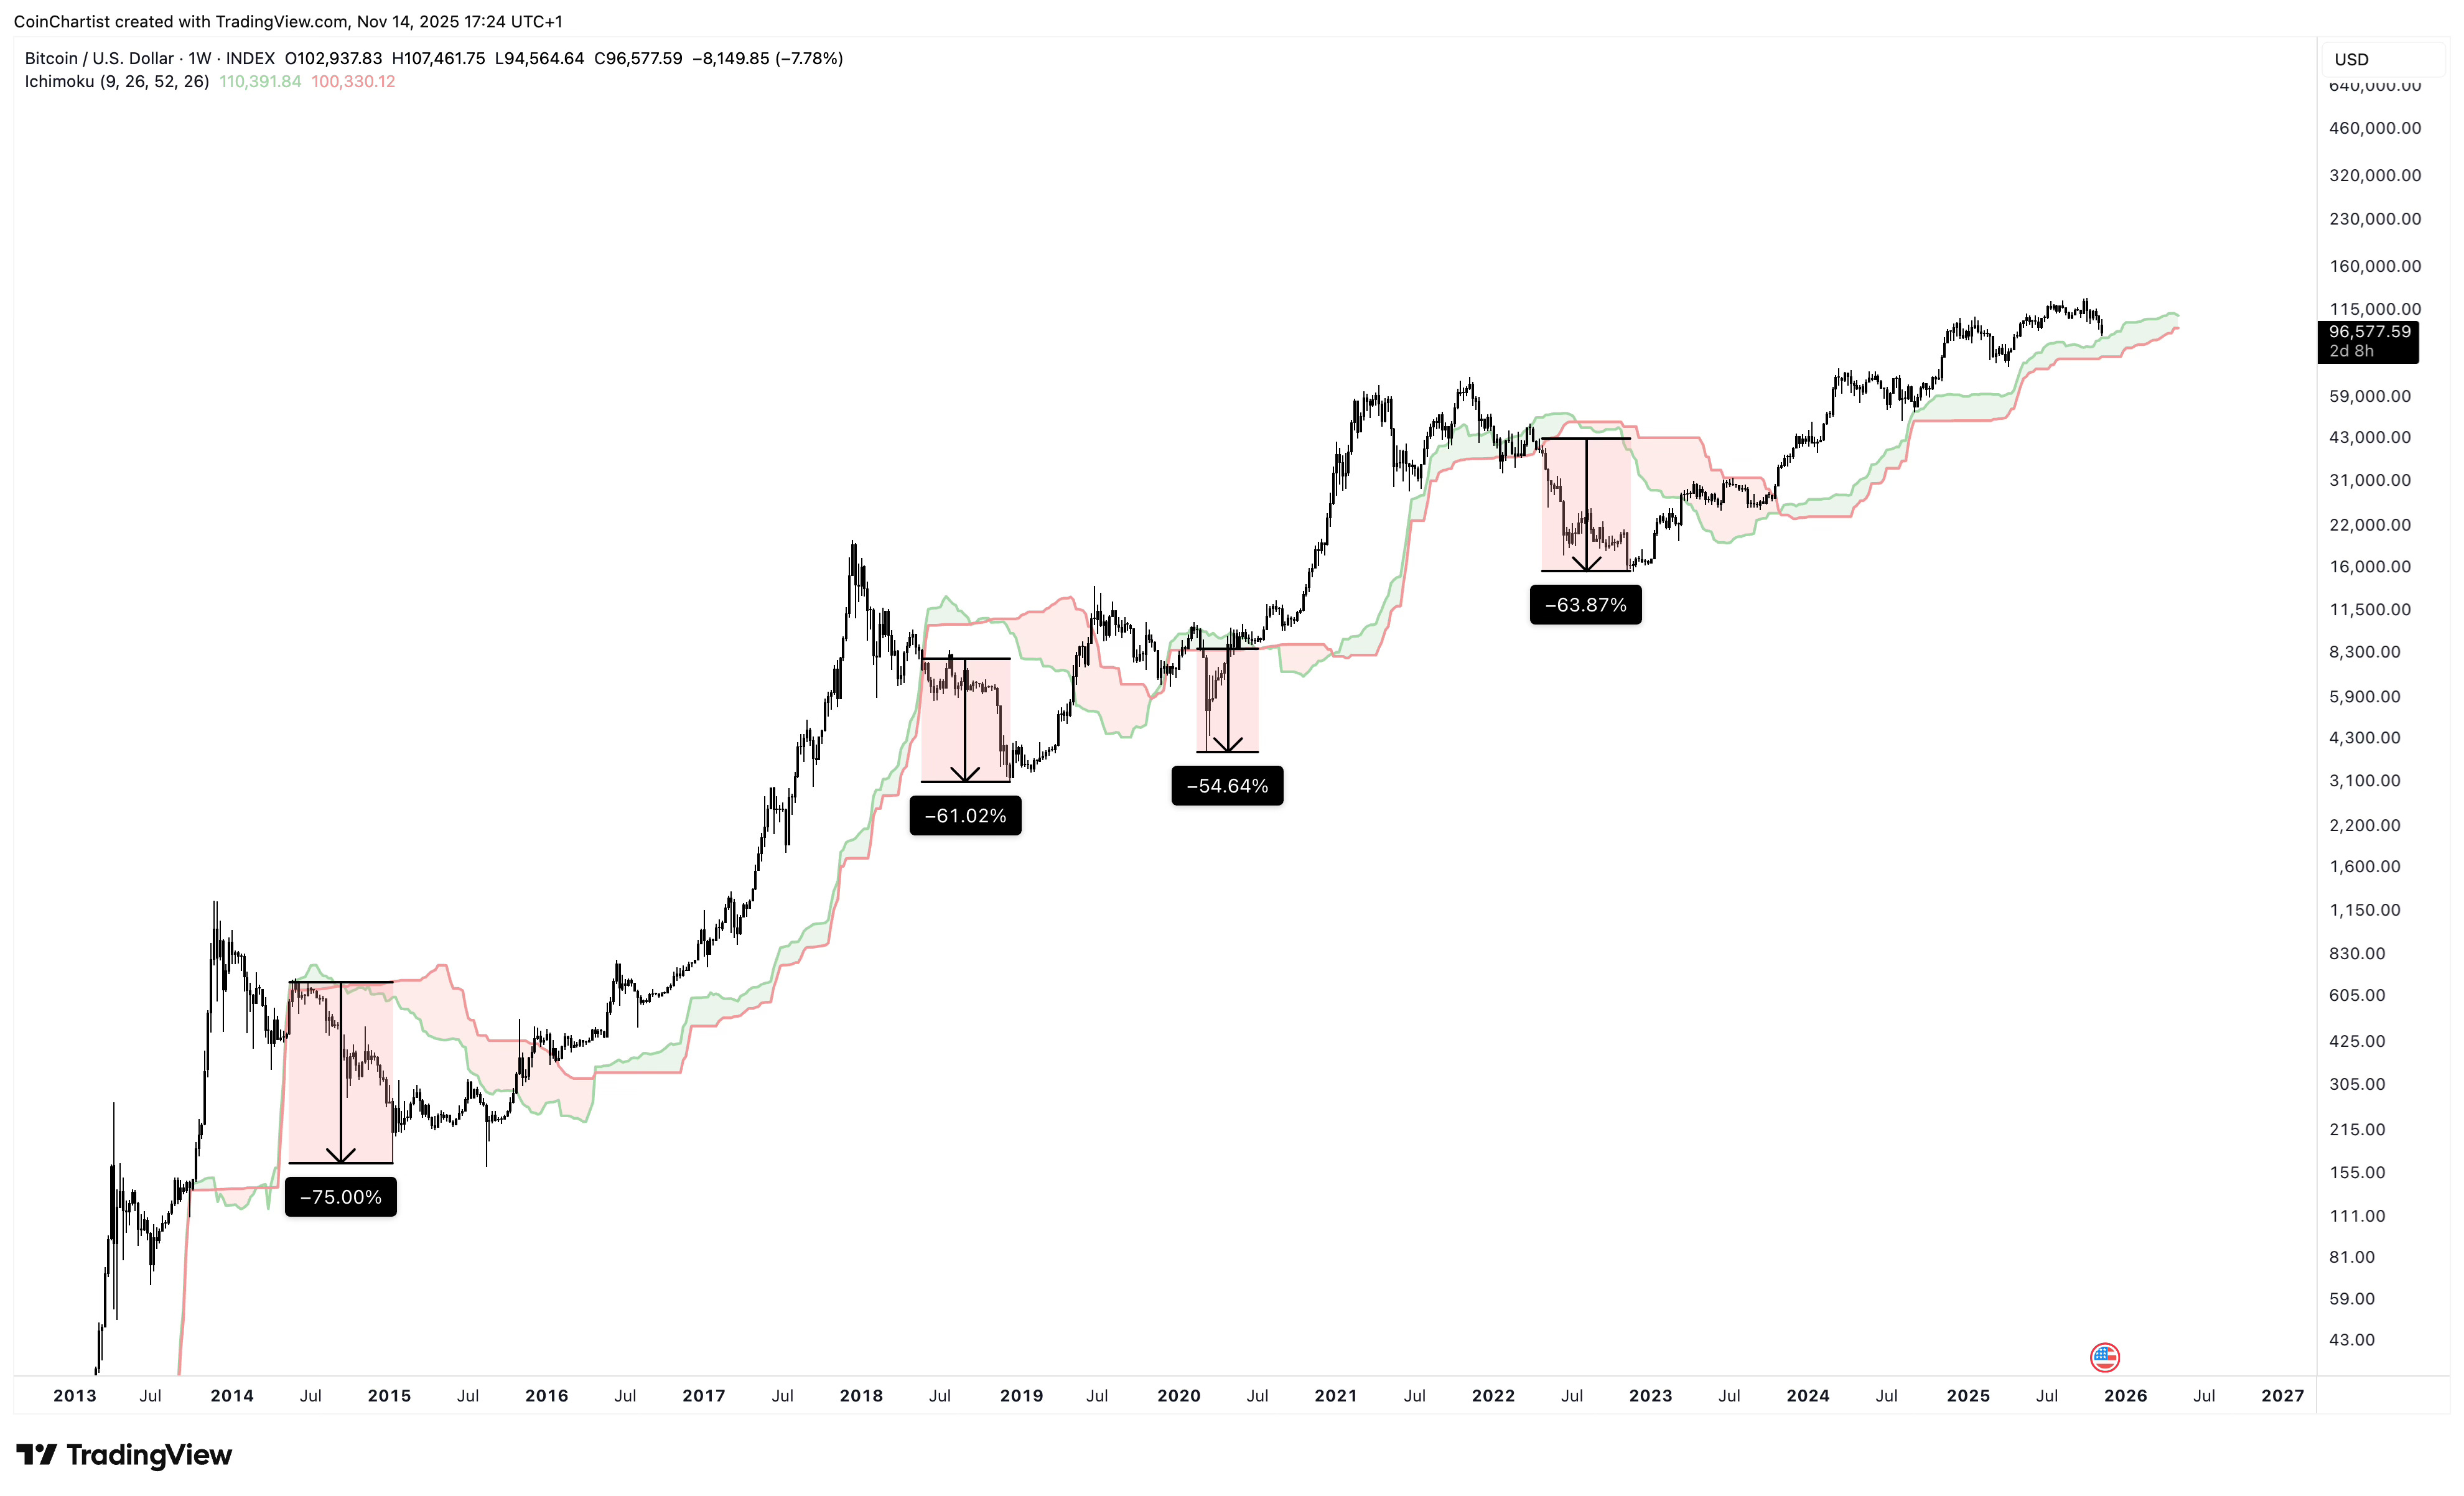
Here are the examples of the more dangerous phase of the bear market. After falling out of the cloud, Bitcoin has dropped on average 63% before finding a bear market bottom. A 63% drop from right below the Ichimoku cloud would take BTCUSD to $29,000. Ouch.
Bollinger Bands Nail Trade Timing & Direction
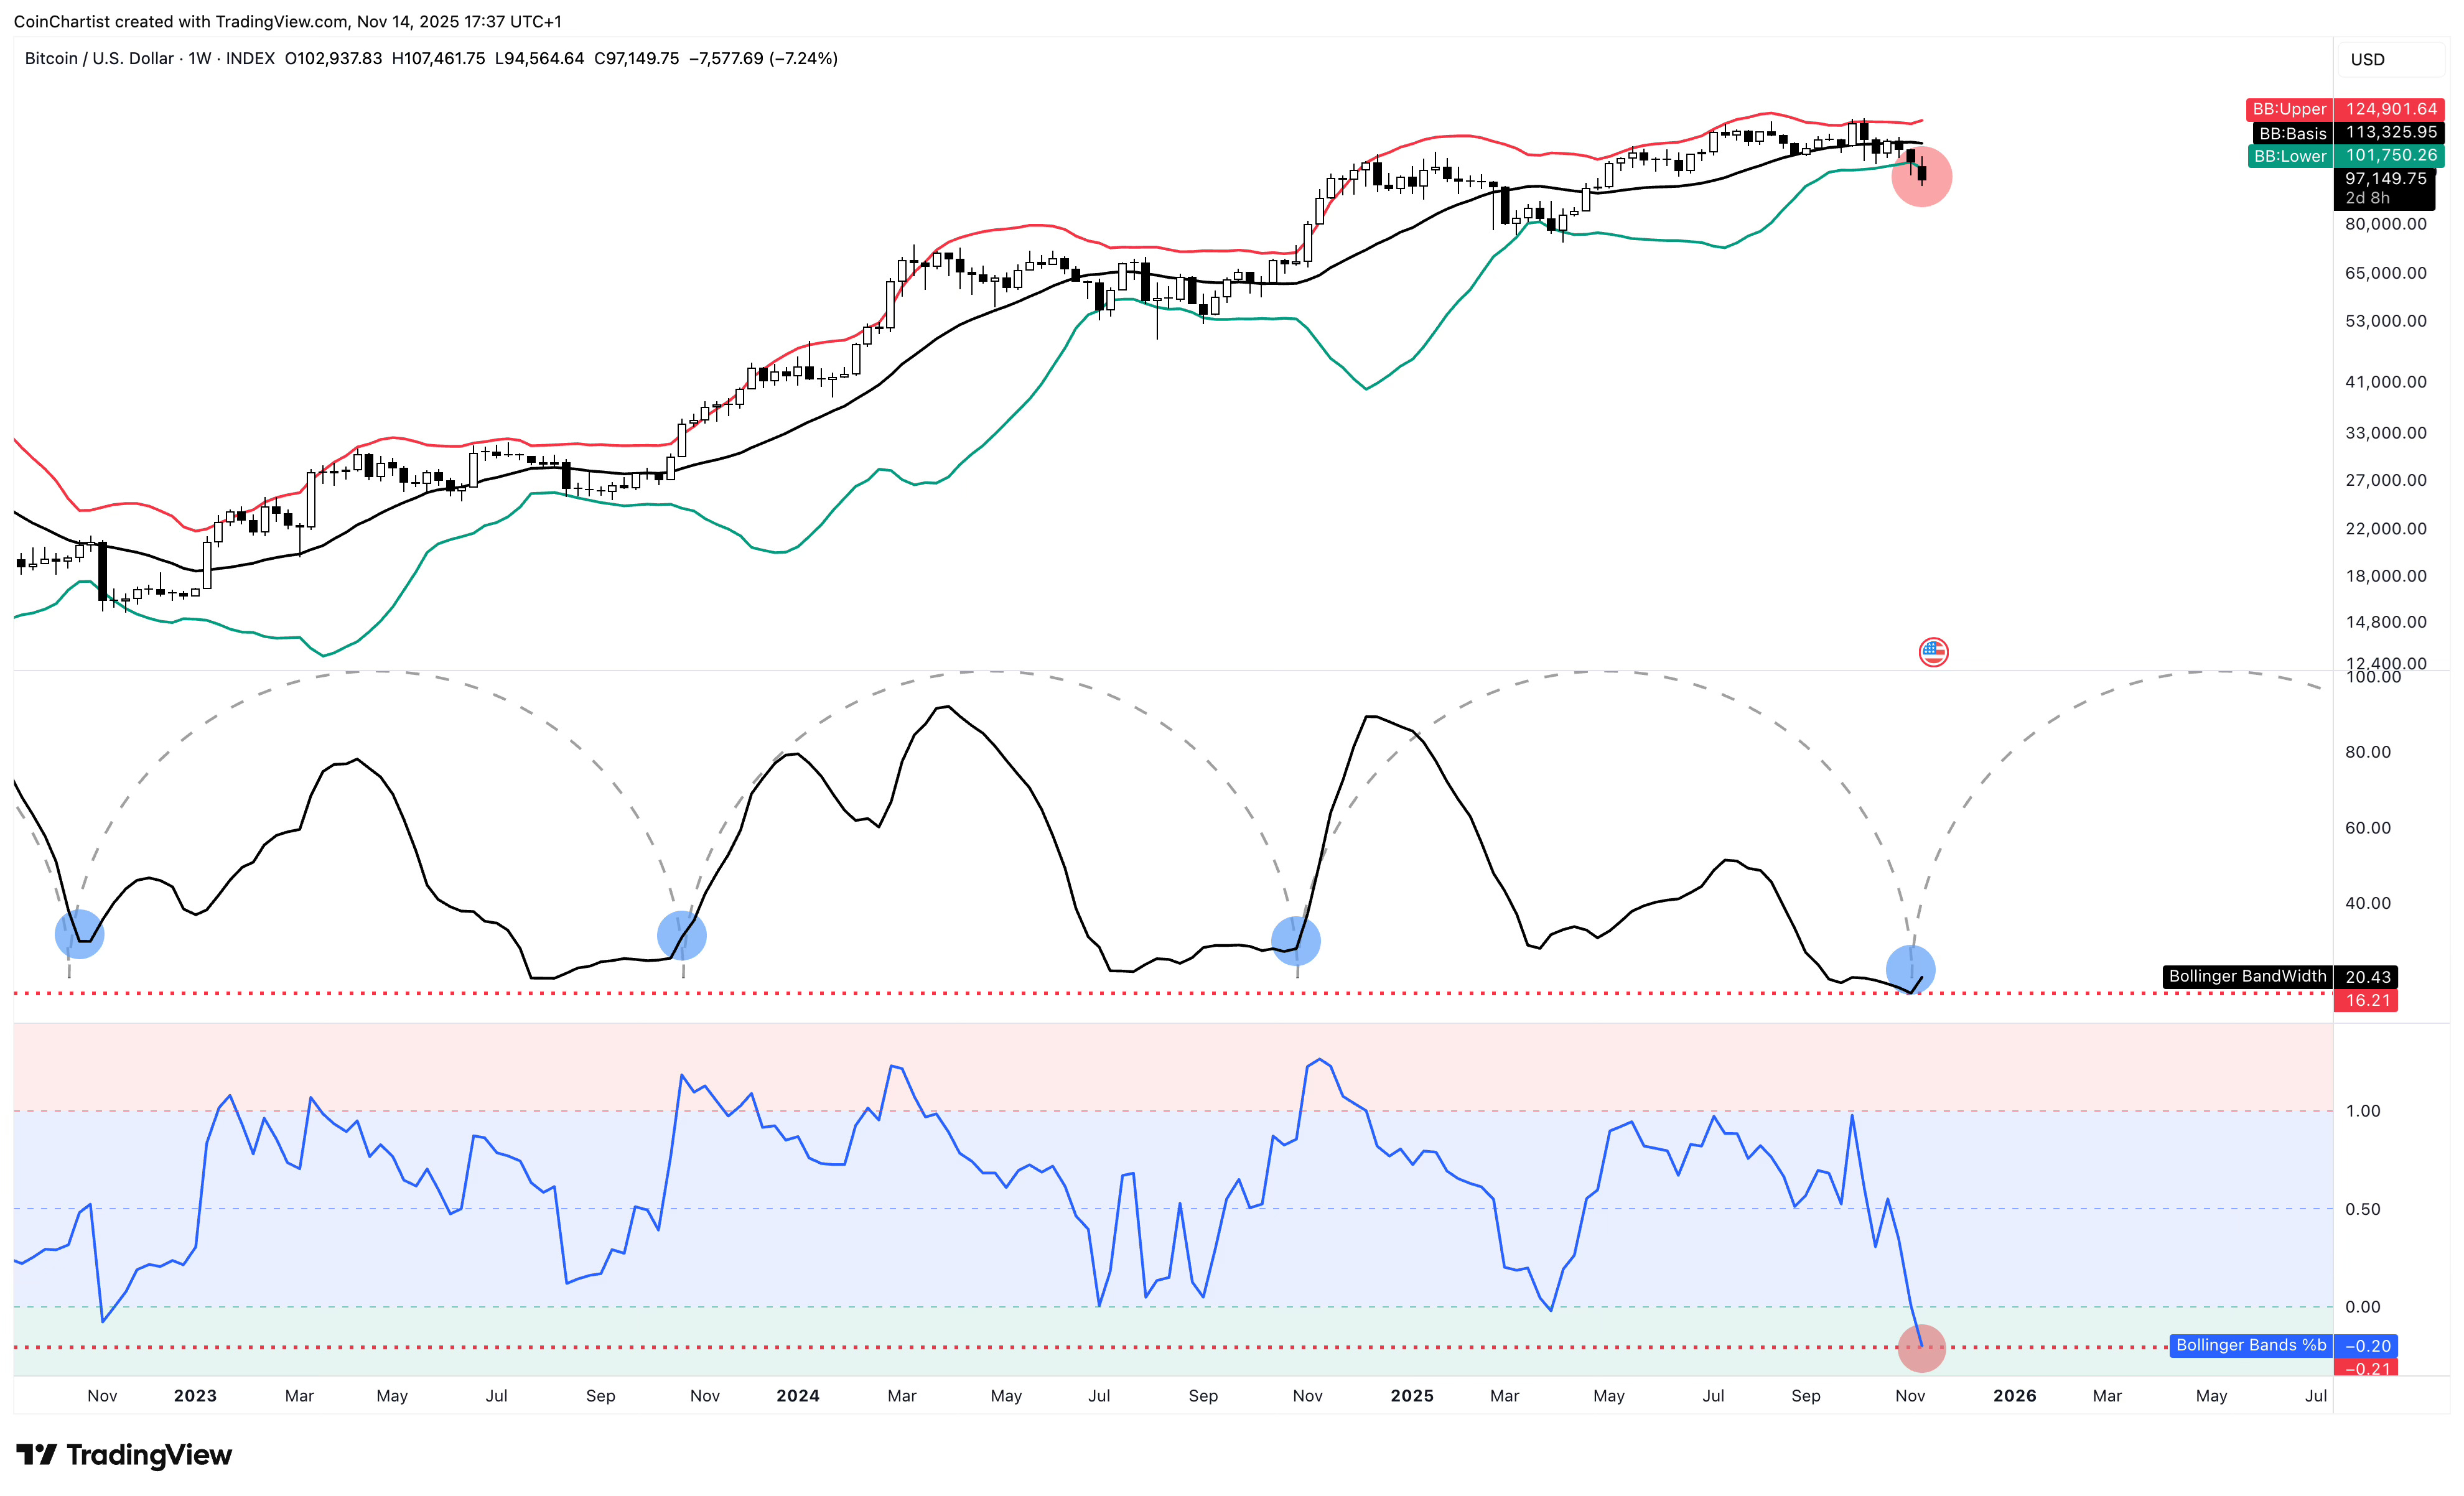
In my opinion, no technical indicator was more useful to predict the outcome of this consolidation phase than the weekly Bollinger Bands. The Bollinger Bands themselves provided the visualization that volatility was diminishing. The middle indicator is Bollinger BandWidth, which shows the lowest reading in Bitcoin history. This alone said a big move was coming. The lowest indicator is the %B tool, which shows where price is relative to the Bollinger Band basis. Above the basis gives a slight bullish bias, and below it the slight bias is bearish. Currently, it is showing that BTC is the furthest below the lower Bollinger Band since the bull run started.
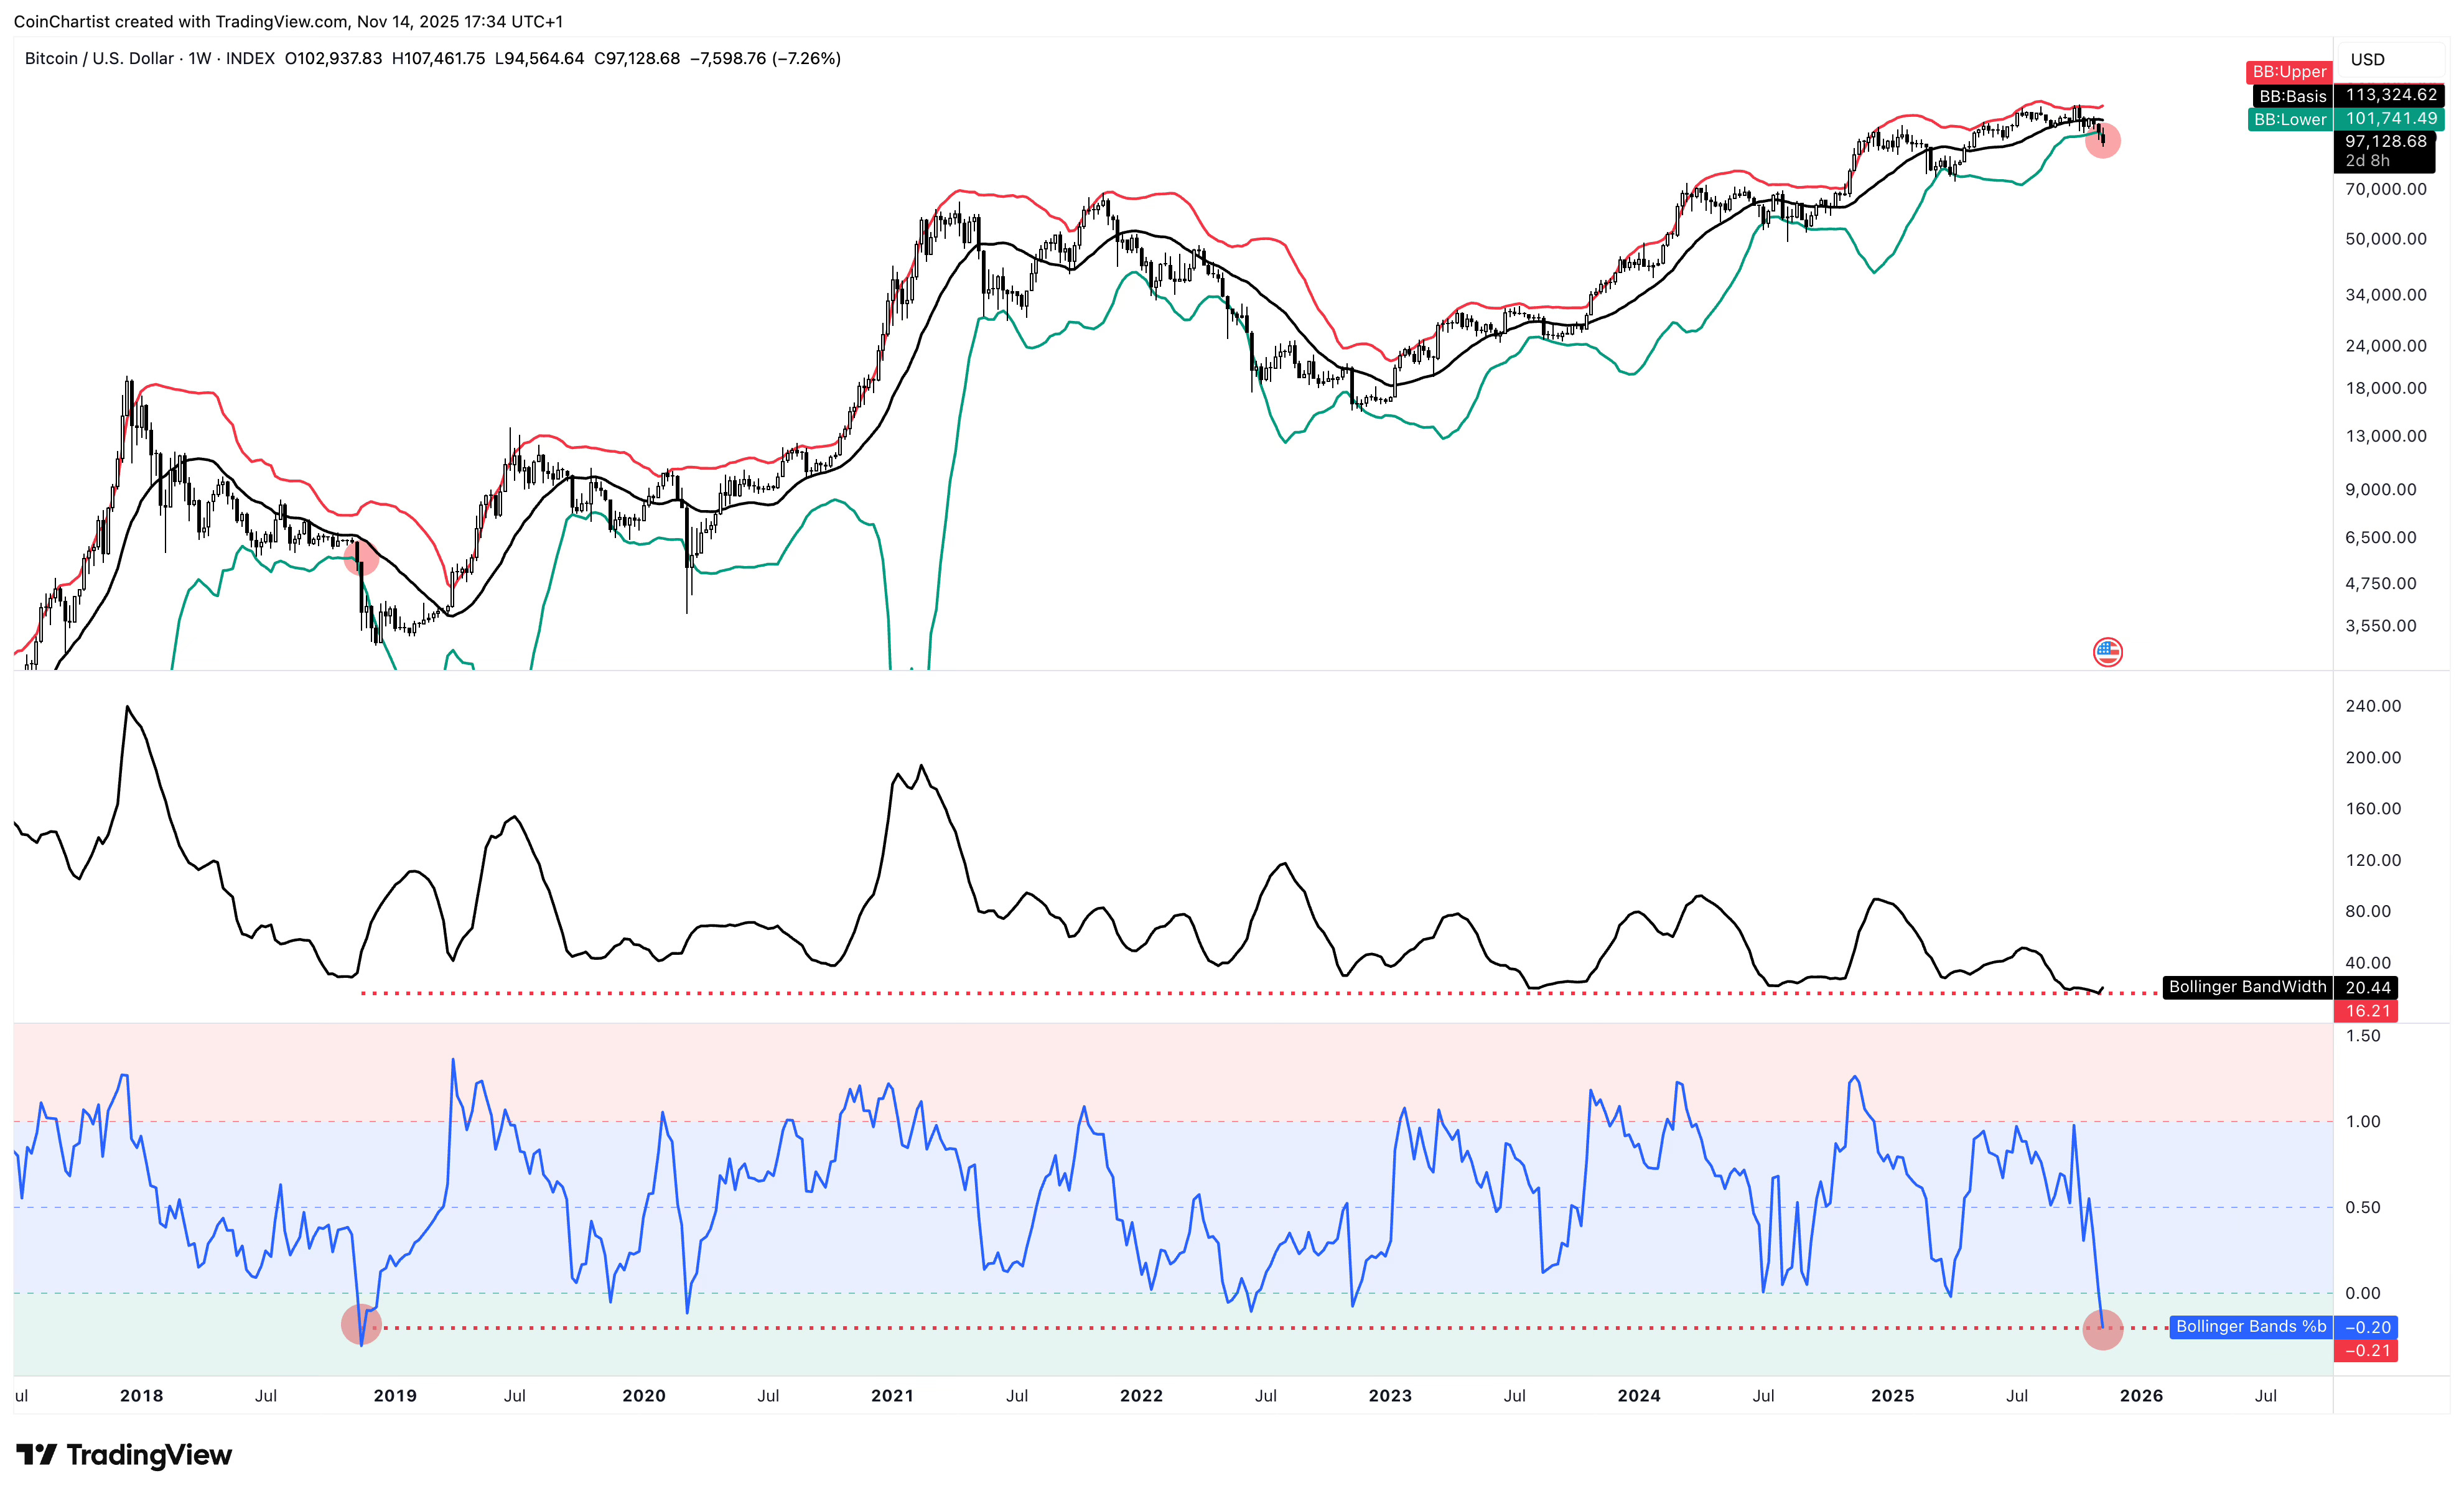
In fact, we are the lowest below the lower Bollinger Band since November 2018, when Bitcoin fell through its previous price floor of $6,000. BTCUSD dropped over 45% in 31 days. If we get a similarly explosive move, prices could get reduced rapidly, just like back then. It is worth noting that BandWidth is much tighter than it was back in 2018, so this move has the potential to be even more devastating.
