

Time’s Up
Is the four-year-cycle coming to an end, or is it changing? Find out what’s driving the unique cycle dynamics.

Disclaimer: The information provided in this Substack newsletter is for general informational purposes only and should not be considered as financial advice. Investing involves risk, and past performance is not indicative of future results. Please conduct your own research or consult a financial advisor before making any investment decisions. The newsletter disclaims any liability for losses or damages arising from the use of this information.
Time’s Up overview:
Bitcoin is still in an uptrend — here are the key levels that must hold
The four-year-cycle timing is up. Is the bull market really over?
What top signals have fired? When might the bear market bottom? And at what level should I buy? These questions are answered.
It’s not the halving, it’s the business cycle. Find out what’s different about this business cycle.
The Dollar is hinting at a comeback. Is this why crypto is turning bearish?
Finally, the hope altcoin holders need to see — why altcoin performance is still possible
Today marks the end of October — a month so positive for Bitcoin historically it’s been affectionately dubbed “Up-tober”. This month was definitely not the outcome most were anticipating. Instead we got a record-breaking washout that’s absolutely crushed sentiment across the crypto market.
This month also is an important date according to Bitcoin’s famed four-year-cycle. Each of the past two cycles lasted approximately 1064 days from bear market bottom to bull market peak. If cycles remain equal, the current cycle would be ending. This has split sentiment into those that believe the cycles are lengthening and those that agree it’s time to throw in the towel on Bitcoin.
Worse yet, altcoin holders who missed out on Bitcoin’s bull run are starting to buy into the idea there may not be another altcoin season like we’ve seen in past. Stocks continue to soar, and precious metals have been rallying for all of 2025. The idea of capital rotation into riskier assets like altcoins is beginning to fade.
Simply put: it’s bad out there currently in crypto. And it could get a lot worse if Bitcoin enters a bear market it is due for. However, all of this capitulation and revulsion tends to occur at market bottoms right before it reverses back into a bull run. This issue examines these key themes and explores the various macro conditions that might be behind why this cycle was so vastly different than the rest.
The trend is your friend… until it isn’t
Bitcoin is in an uptrend, as defined as a series of higher highs and higher lows. Only a lower low and lower high confirms a trend change.
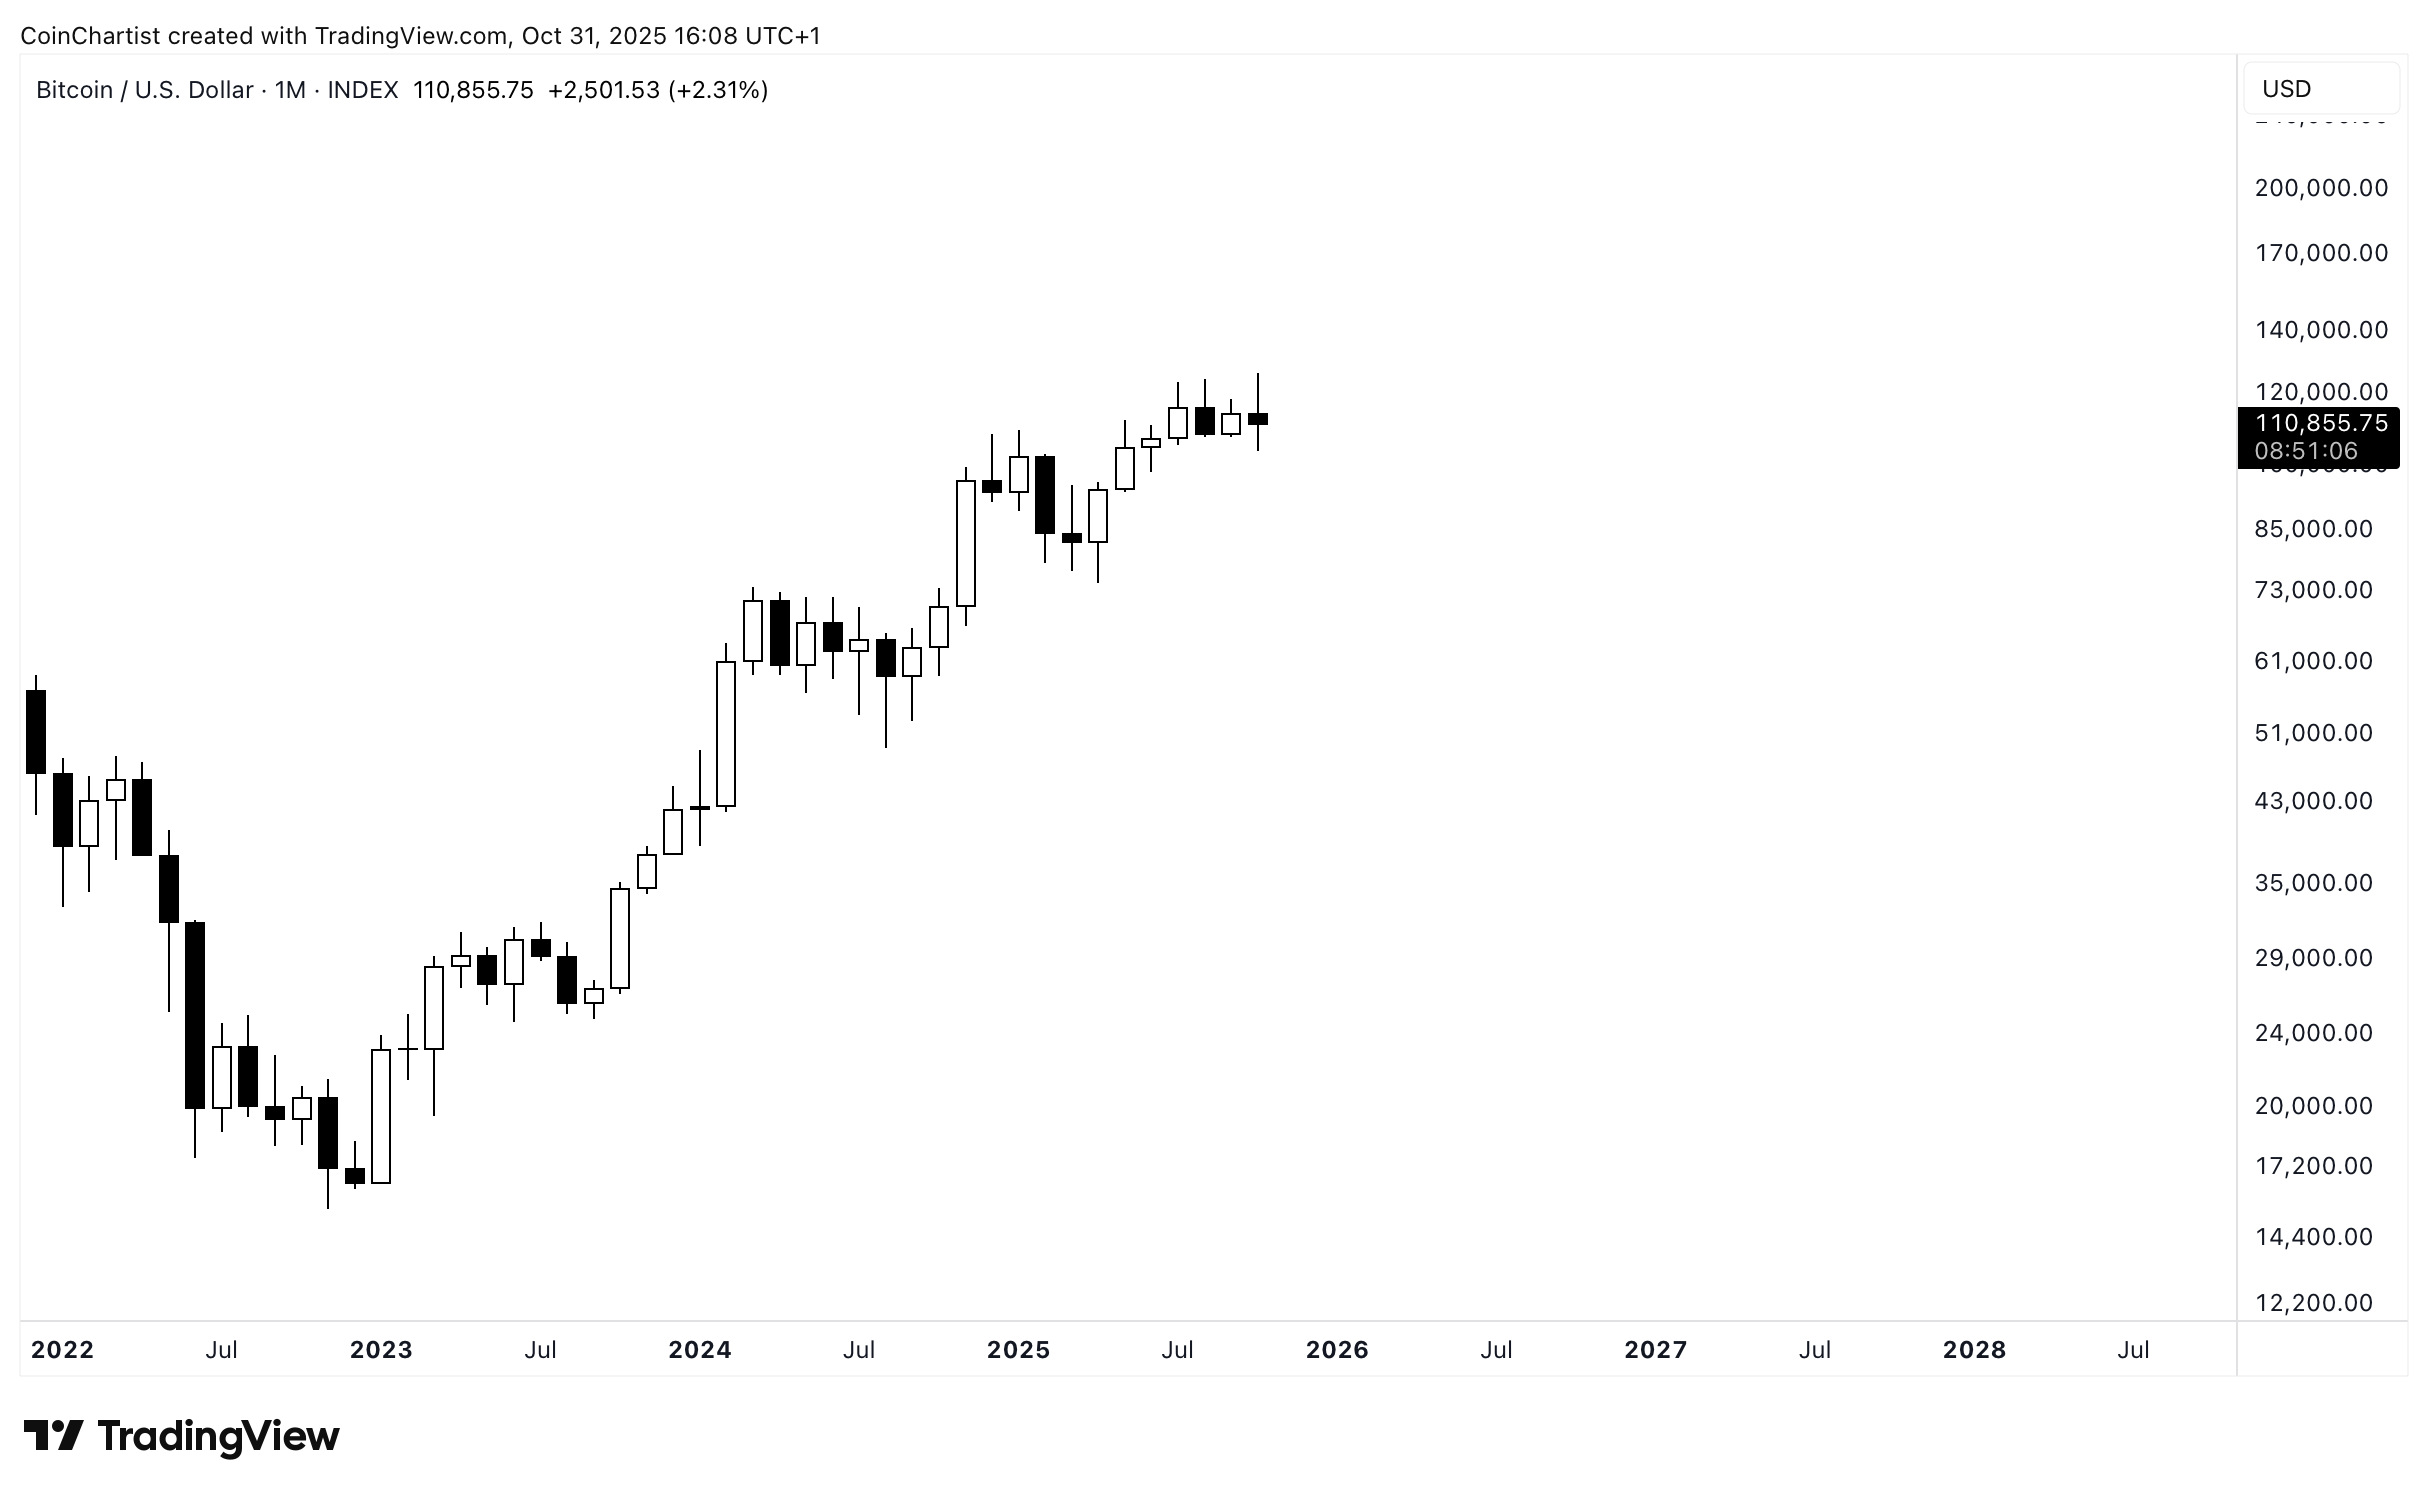
There is an old stock market adage that applies to any asset: the trend is your friend. It implies that the best performance comes from going with the trend and staying with it until it ends. What you see above is a clear uptrend on the monthly scale. October’s candlestick is a Doji, representing a pause in a trend due to indecision. It is at these stopping points where a trend can reverse.
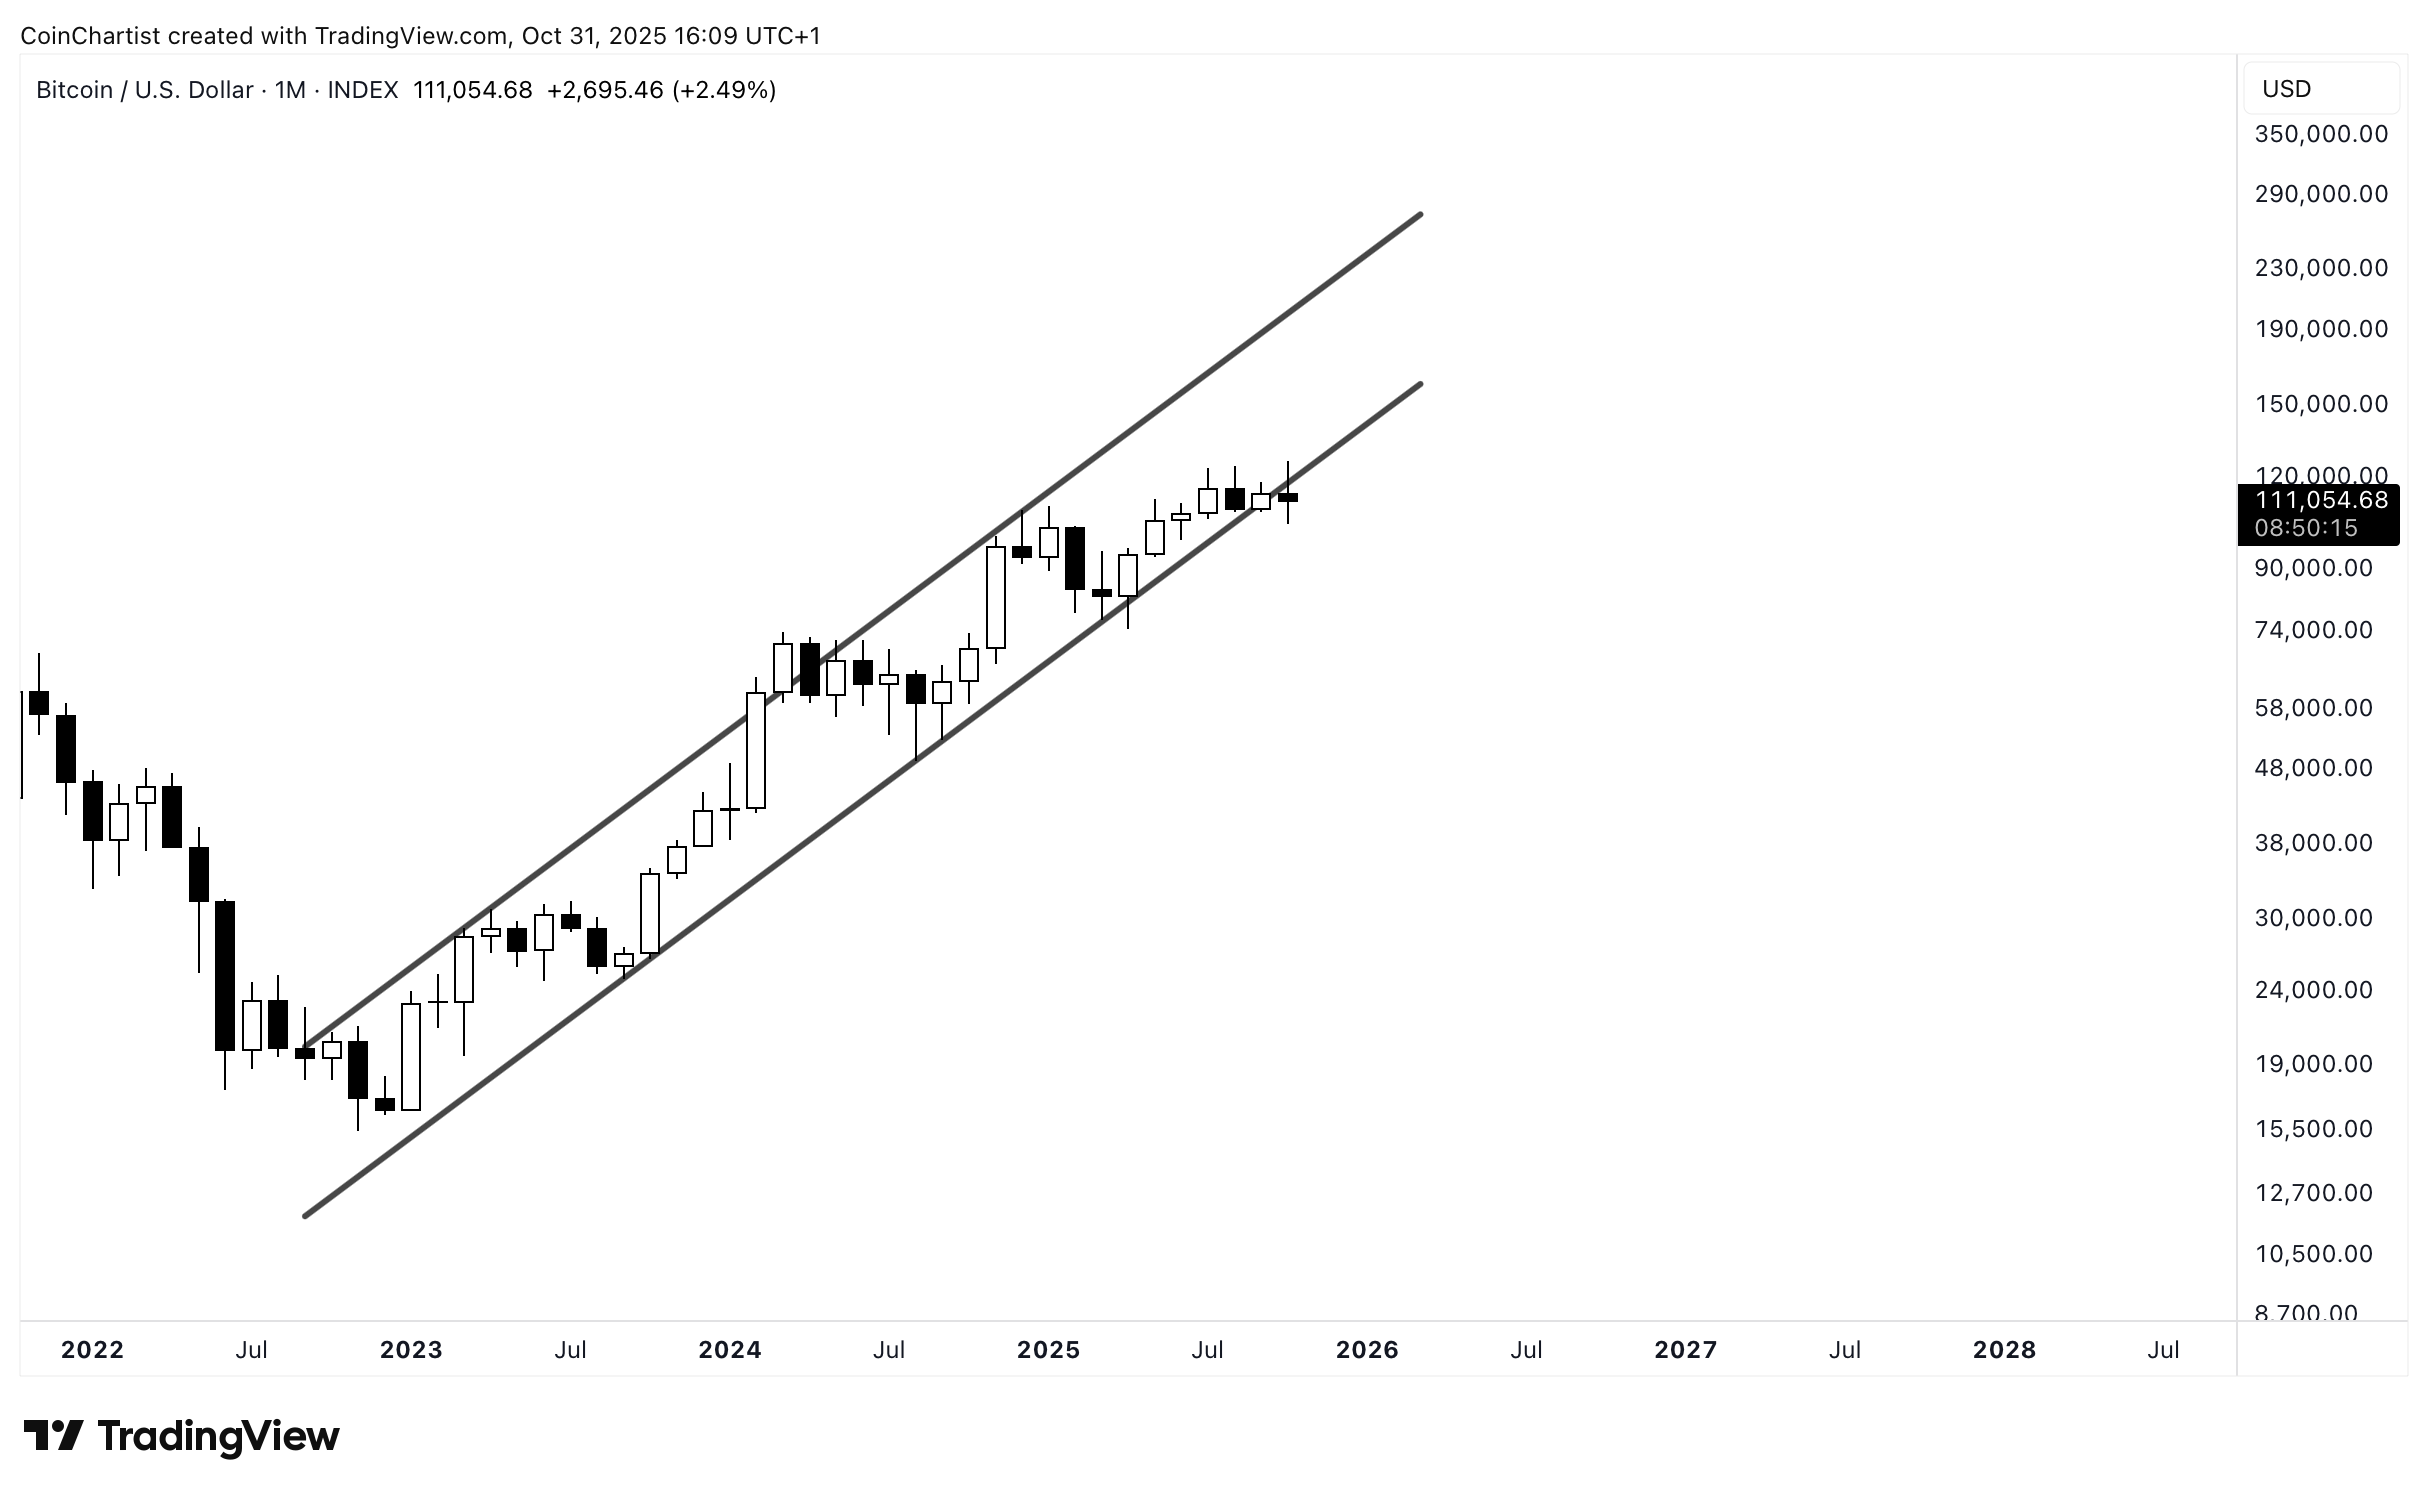
This monthly candlestick appears to have fallen outside of the “Wall of Worry” uptrend channel I’ve been charting for over two years now. A confirmed close outside of it is an initial warning sign something is wrong. If price can recover into the channel in November, the uptrend would be back on.
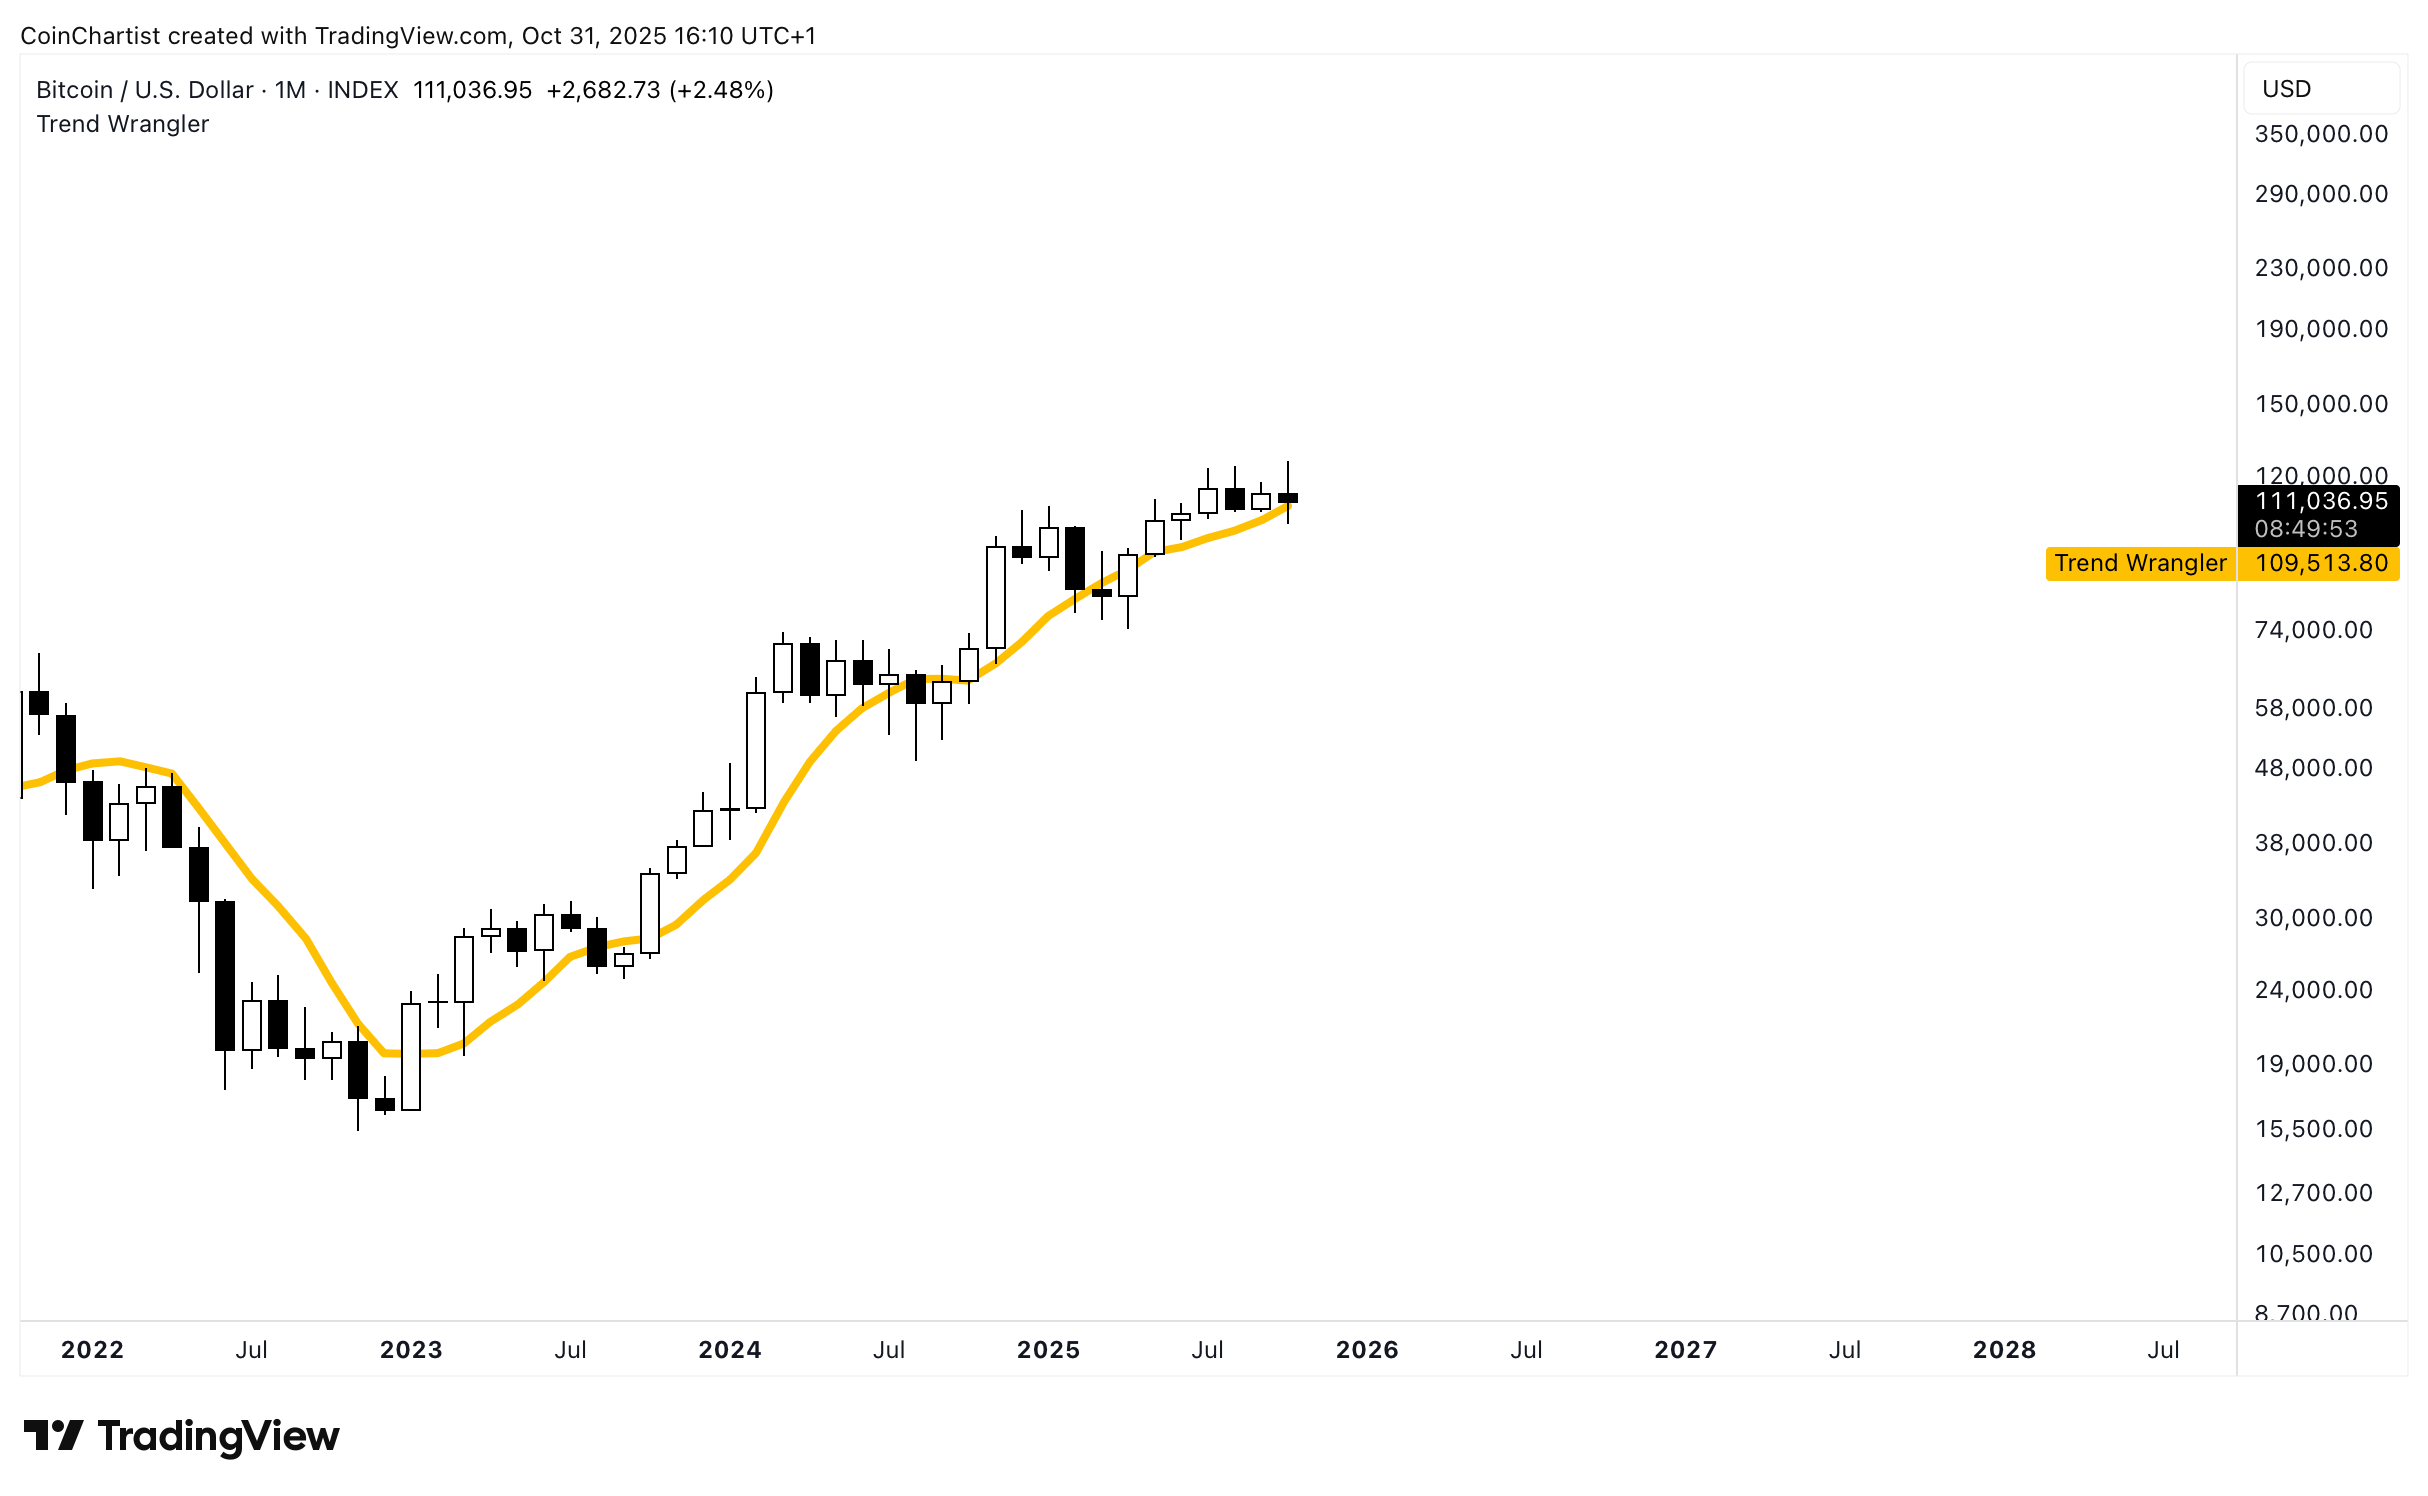
The Trend Wrangler Moving Average is still supporting Bitcoin’s uptrend. A close below gives price action a bearish bias. If the span begins rolling over, it’s like nail in the coffin.
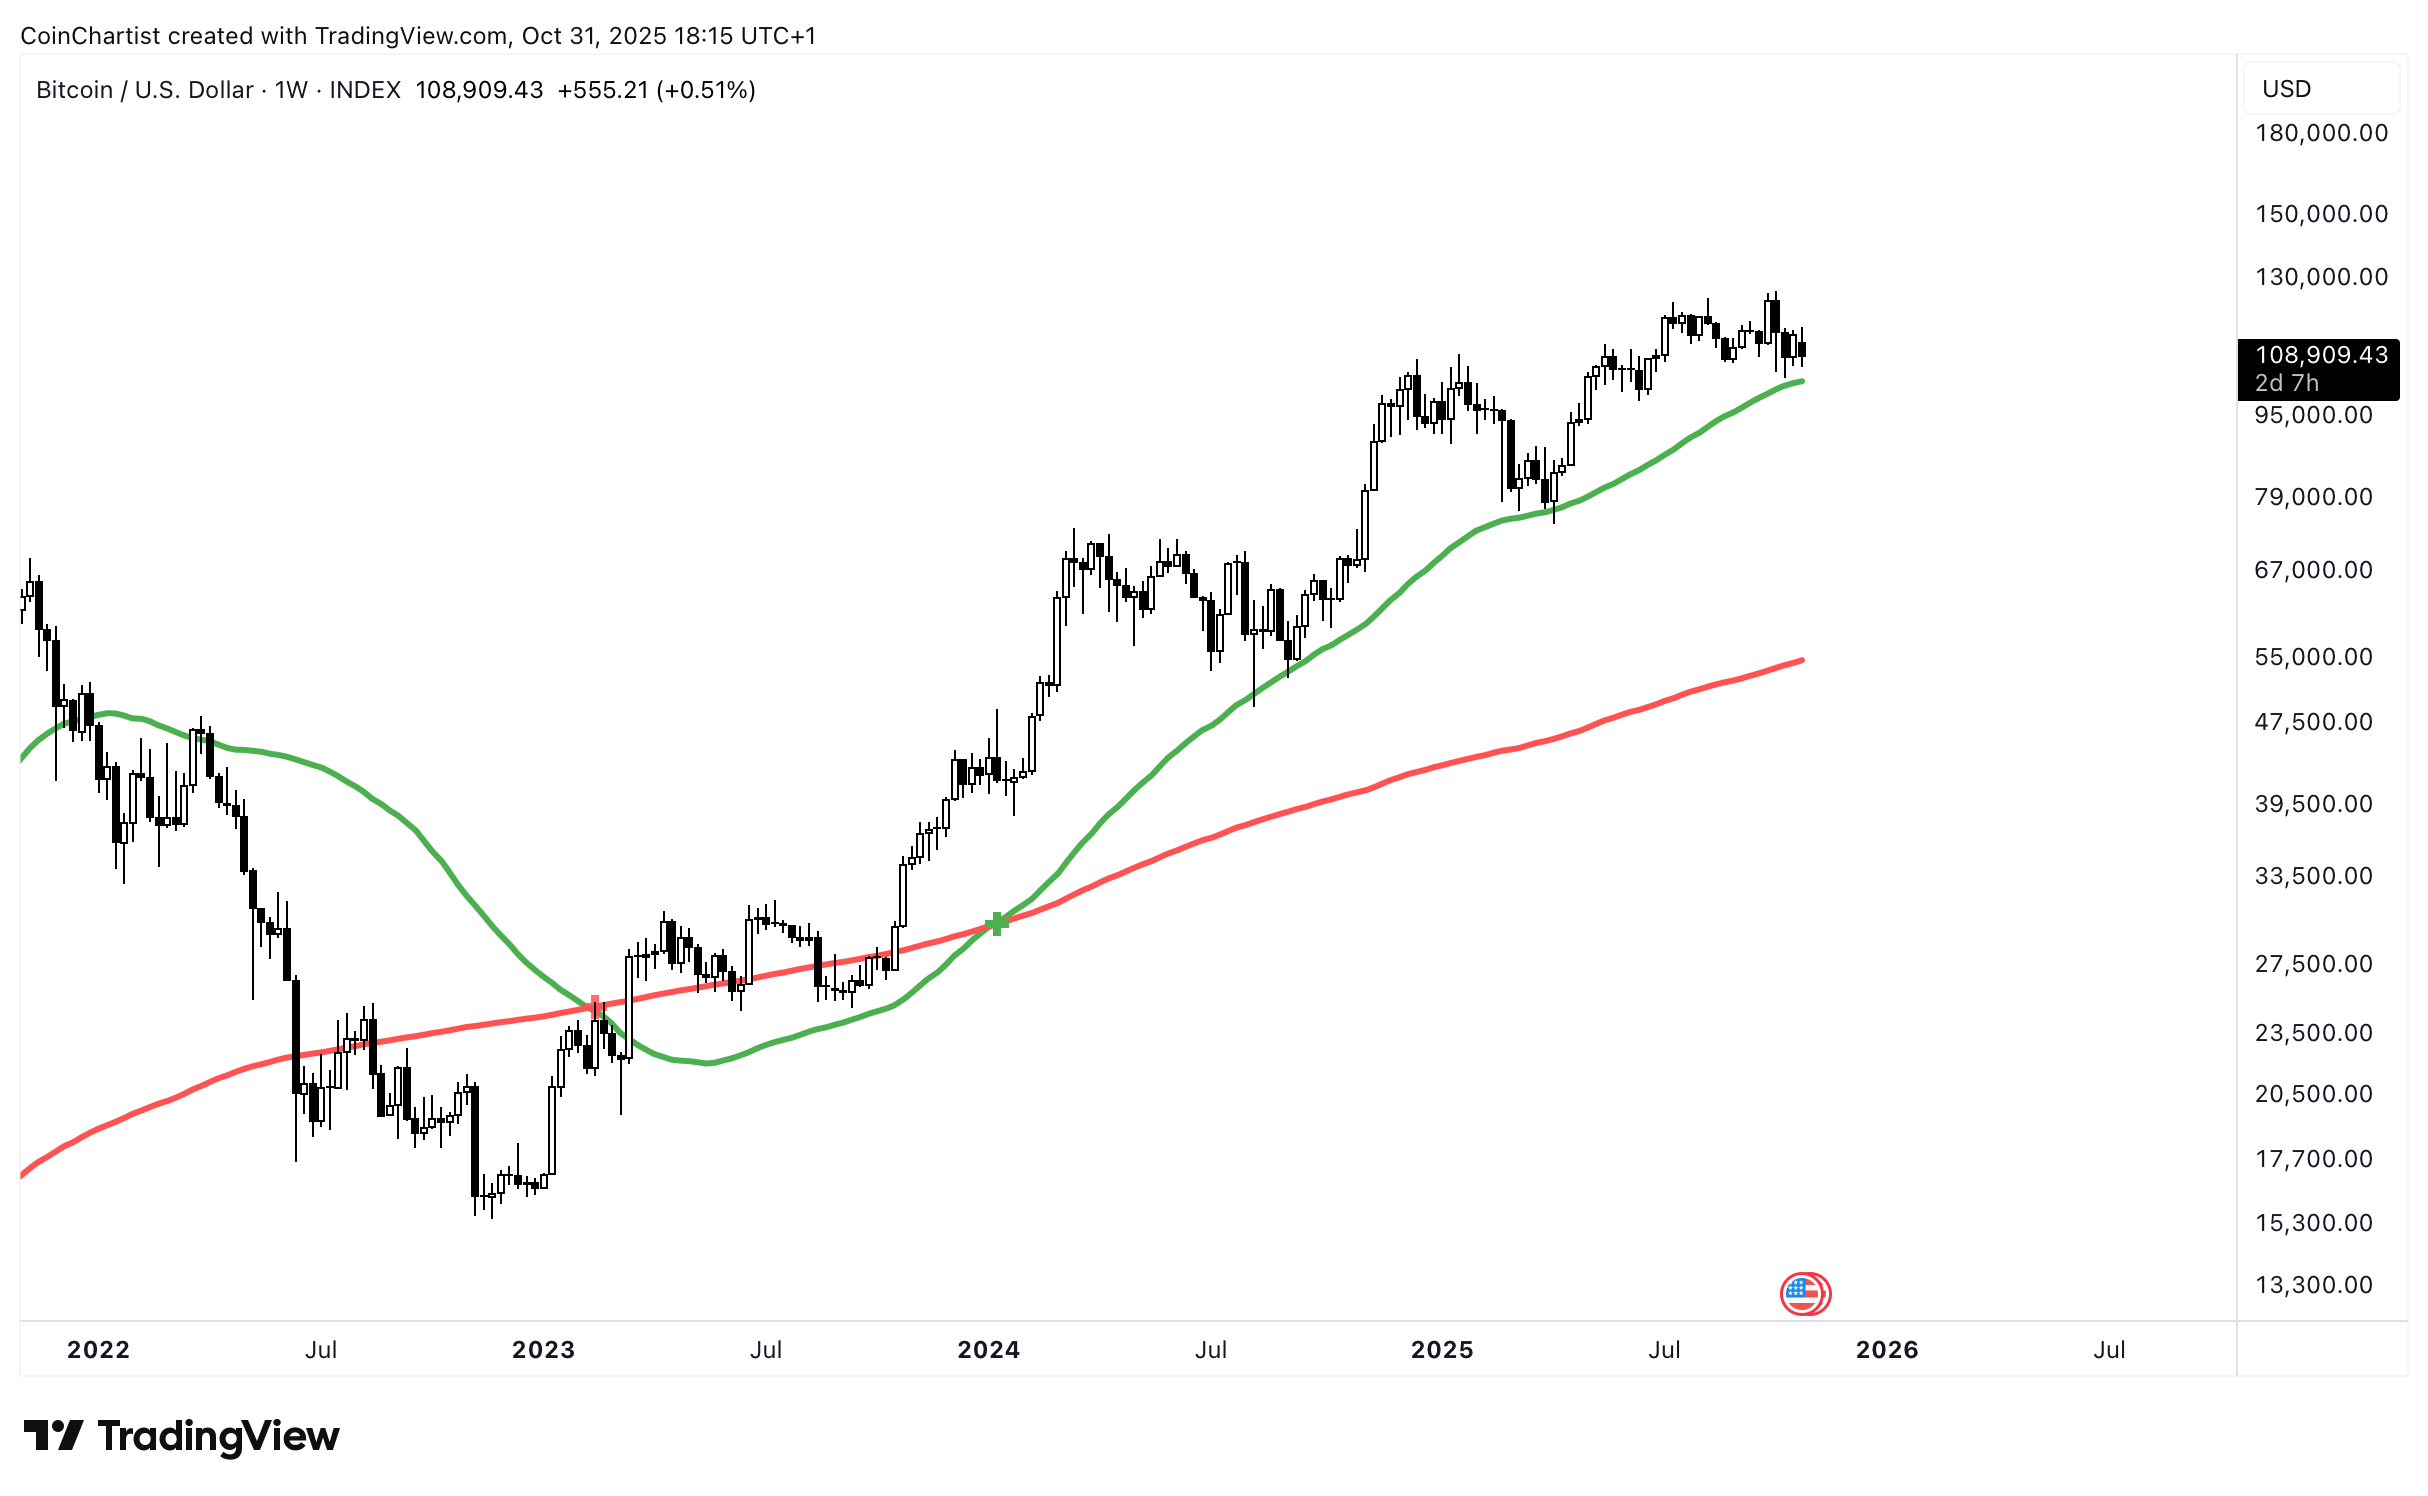
Another important Moving Average is the 50-week Simple Moving Average, which has supported Bitcoin’s uptrend for several years now. Losing it suggests a bear market has started. The 200-week MA would be a logical target if the 50 is lost.
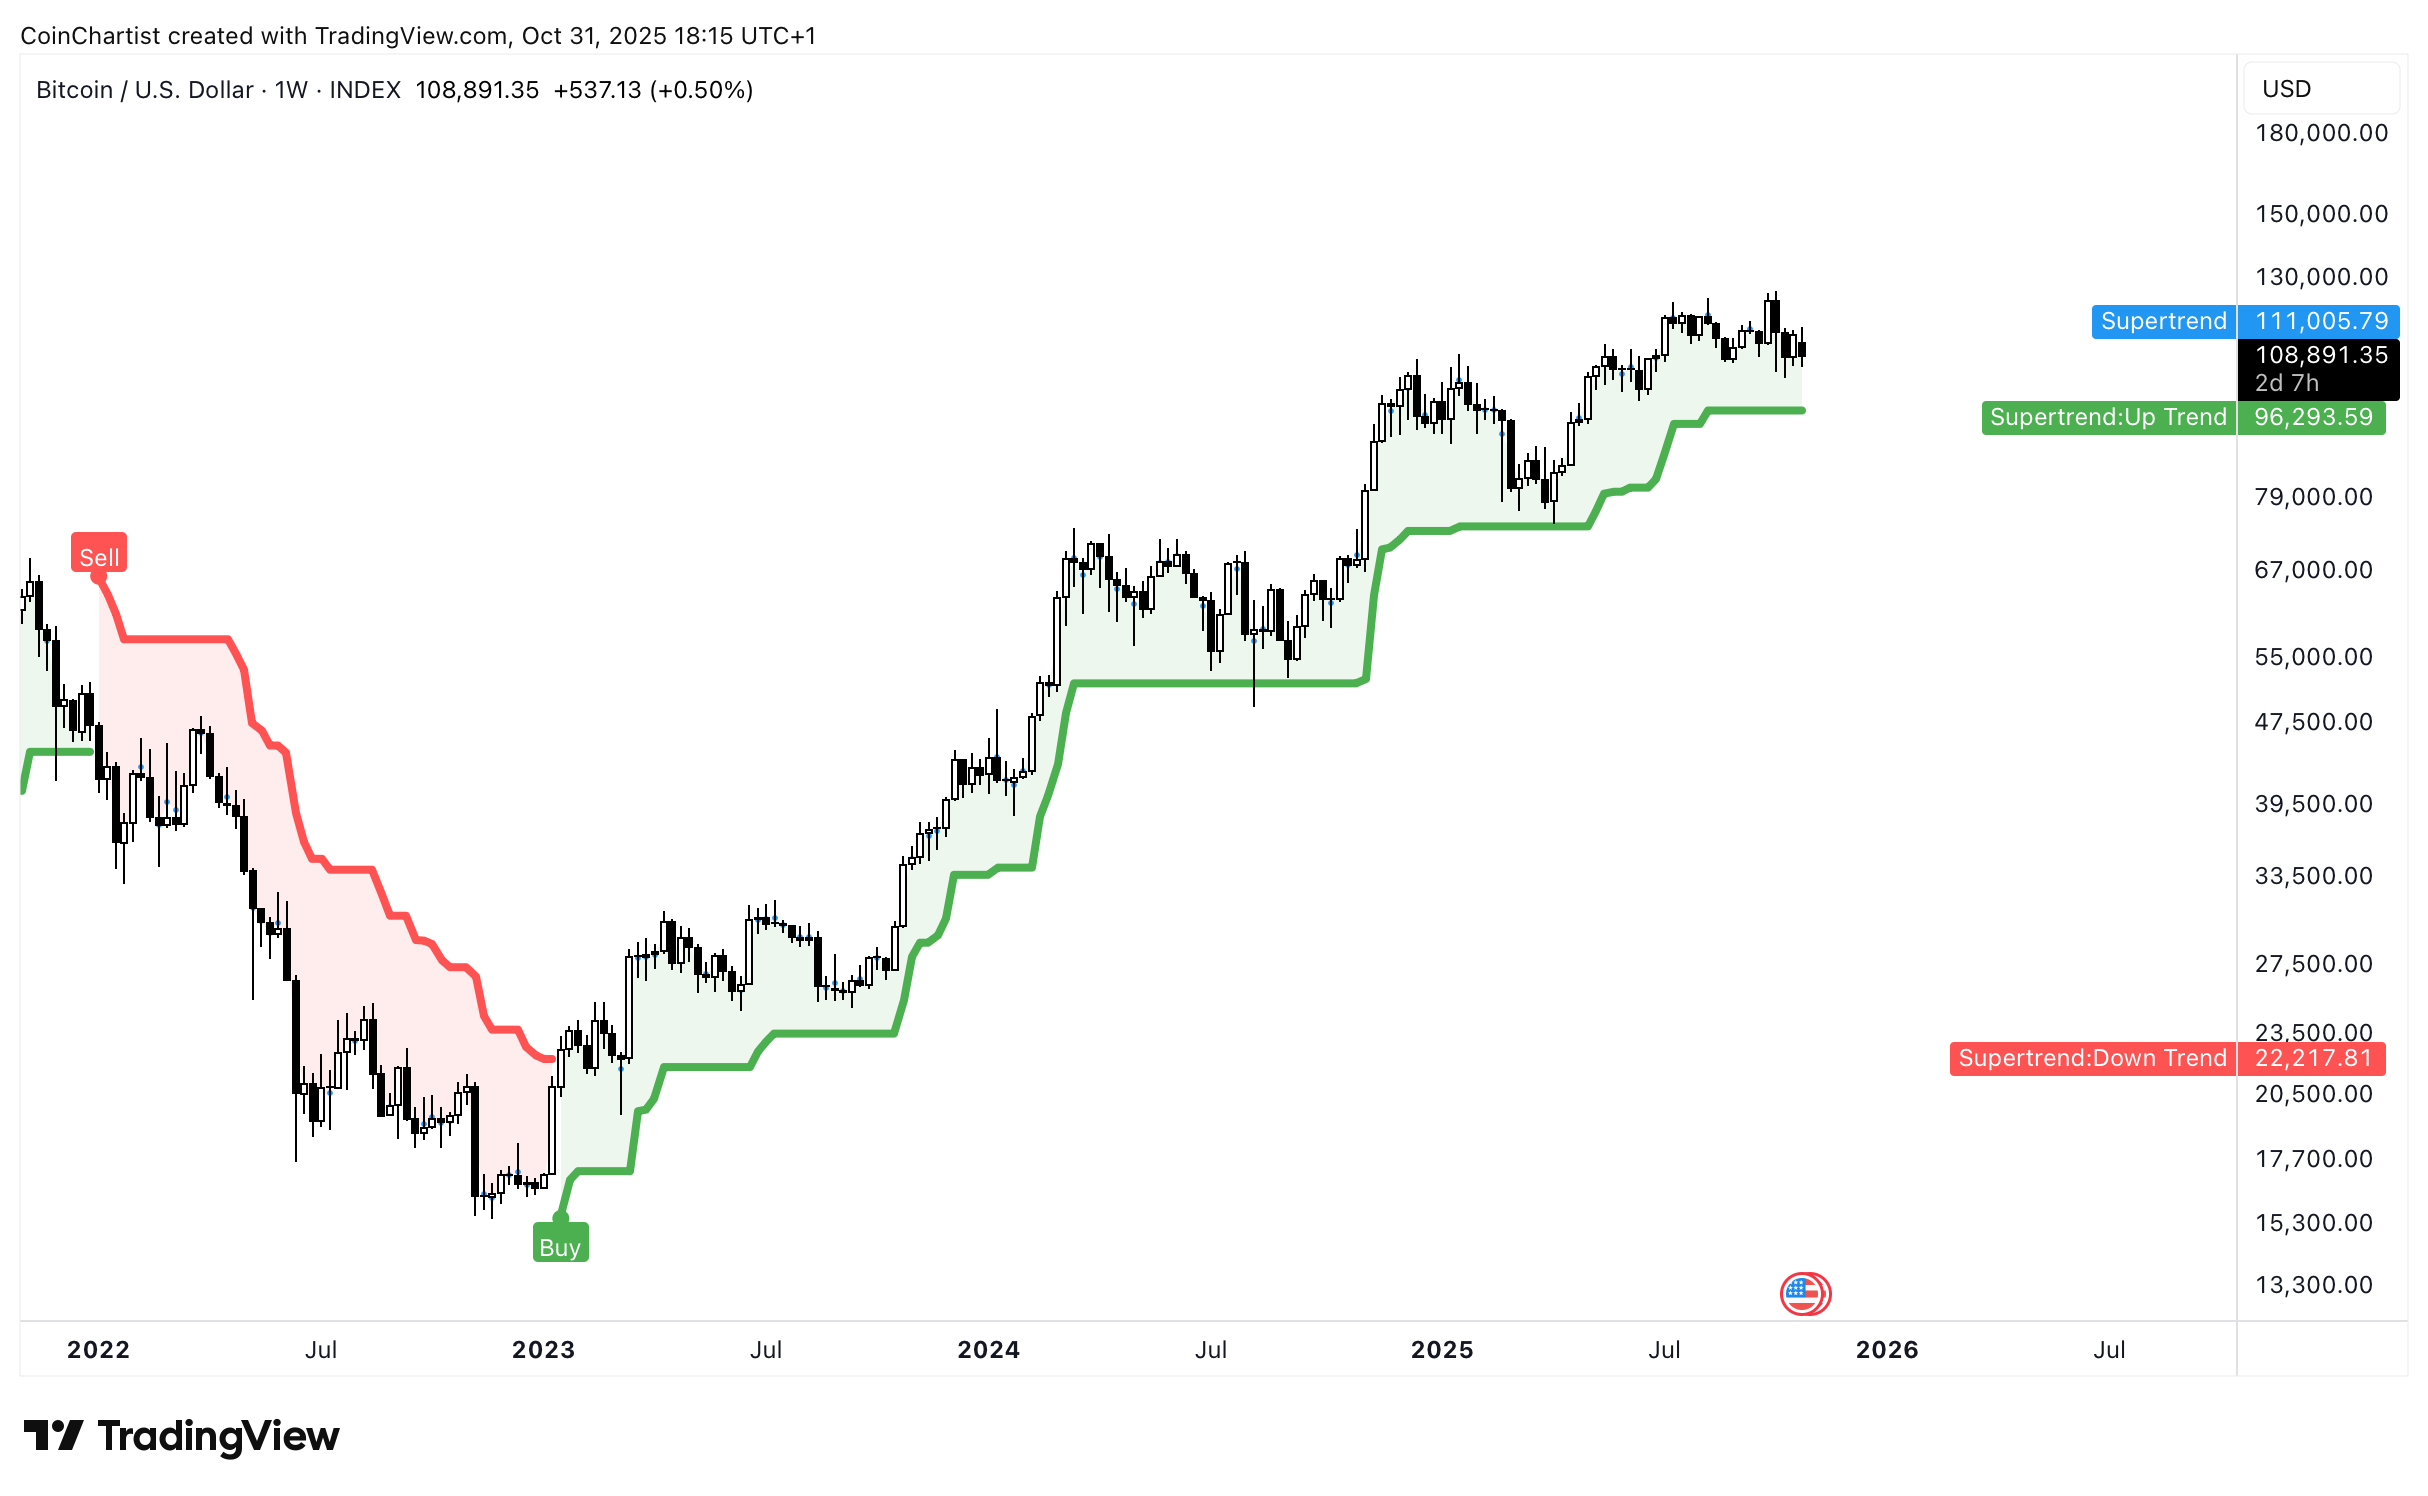
The weekly SuperTrend is still in an active buy signal. Dynamic SuperTrend support is at $96,200. A close below the line will trigger the first sell signal since the second 2021 peak in BTCUSD. Bitcoin fell by 75% in the year following.
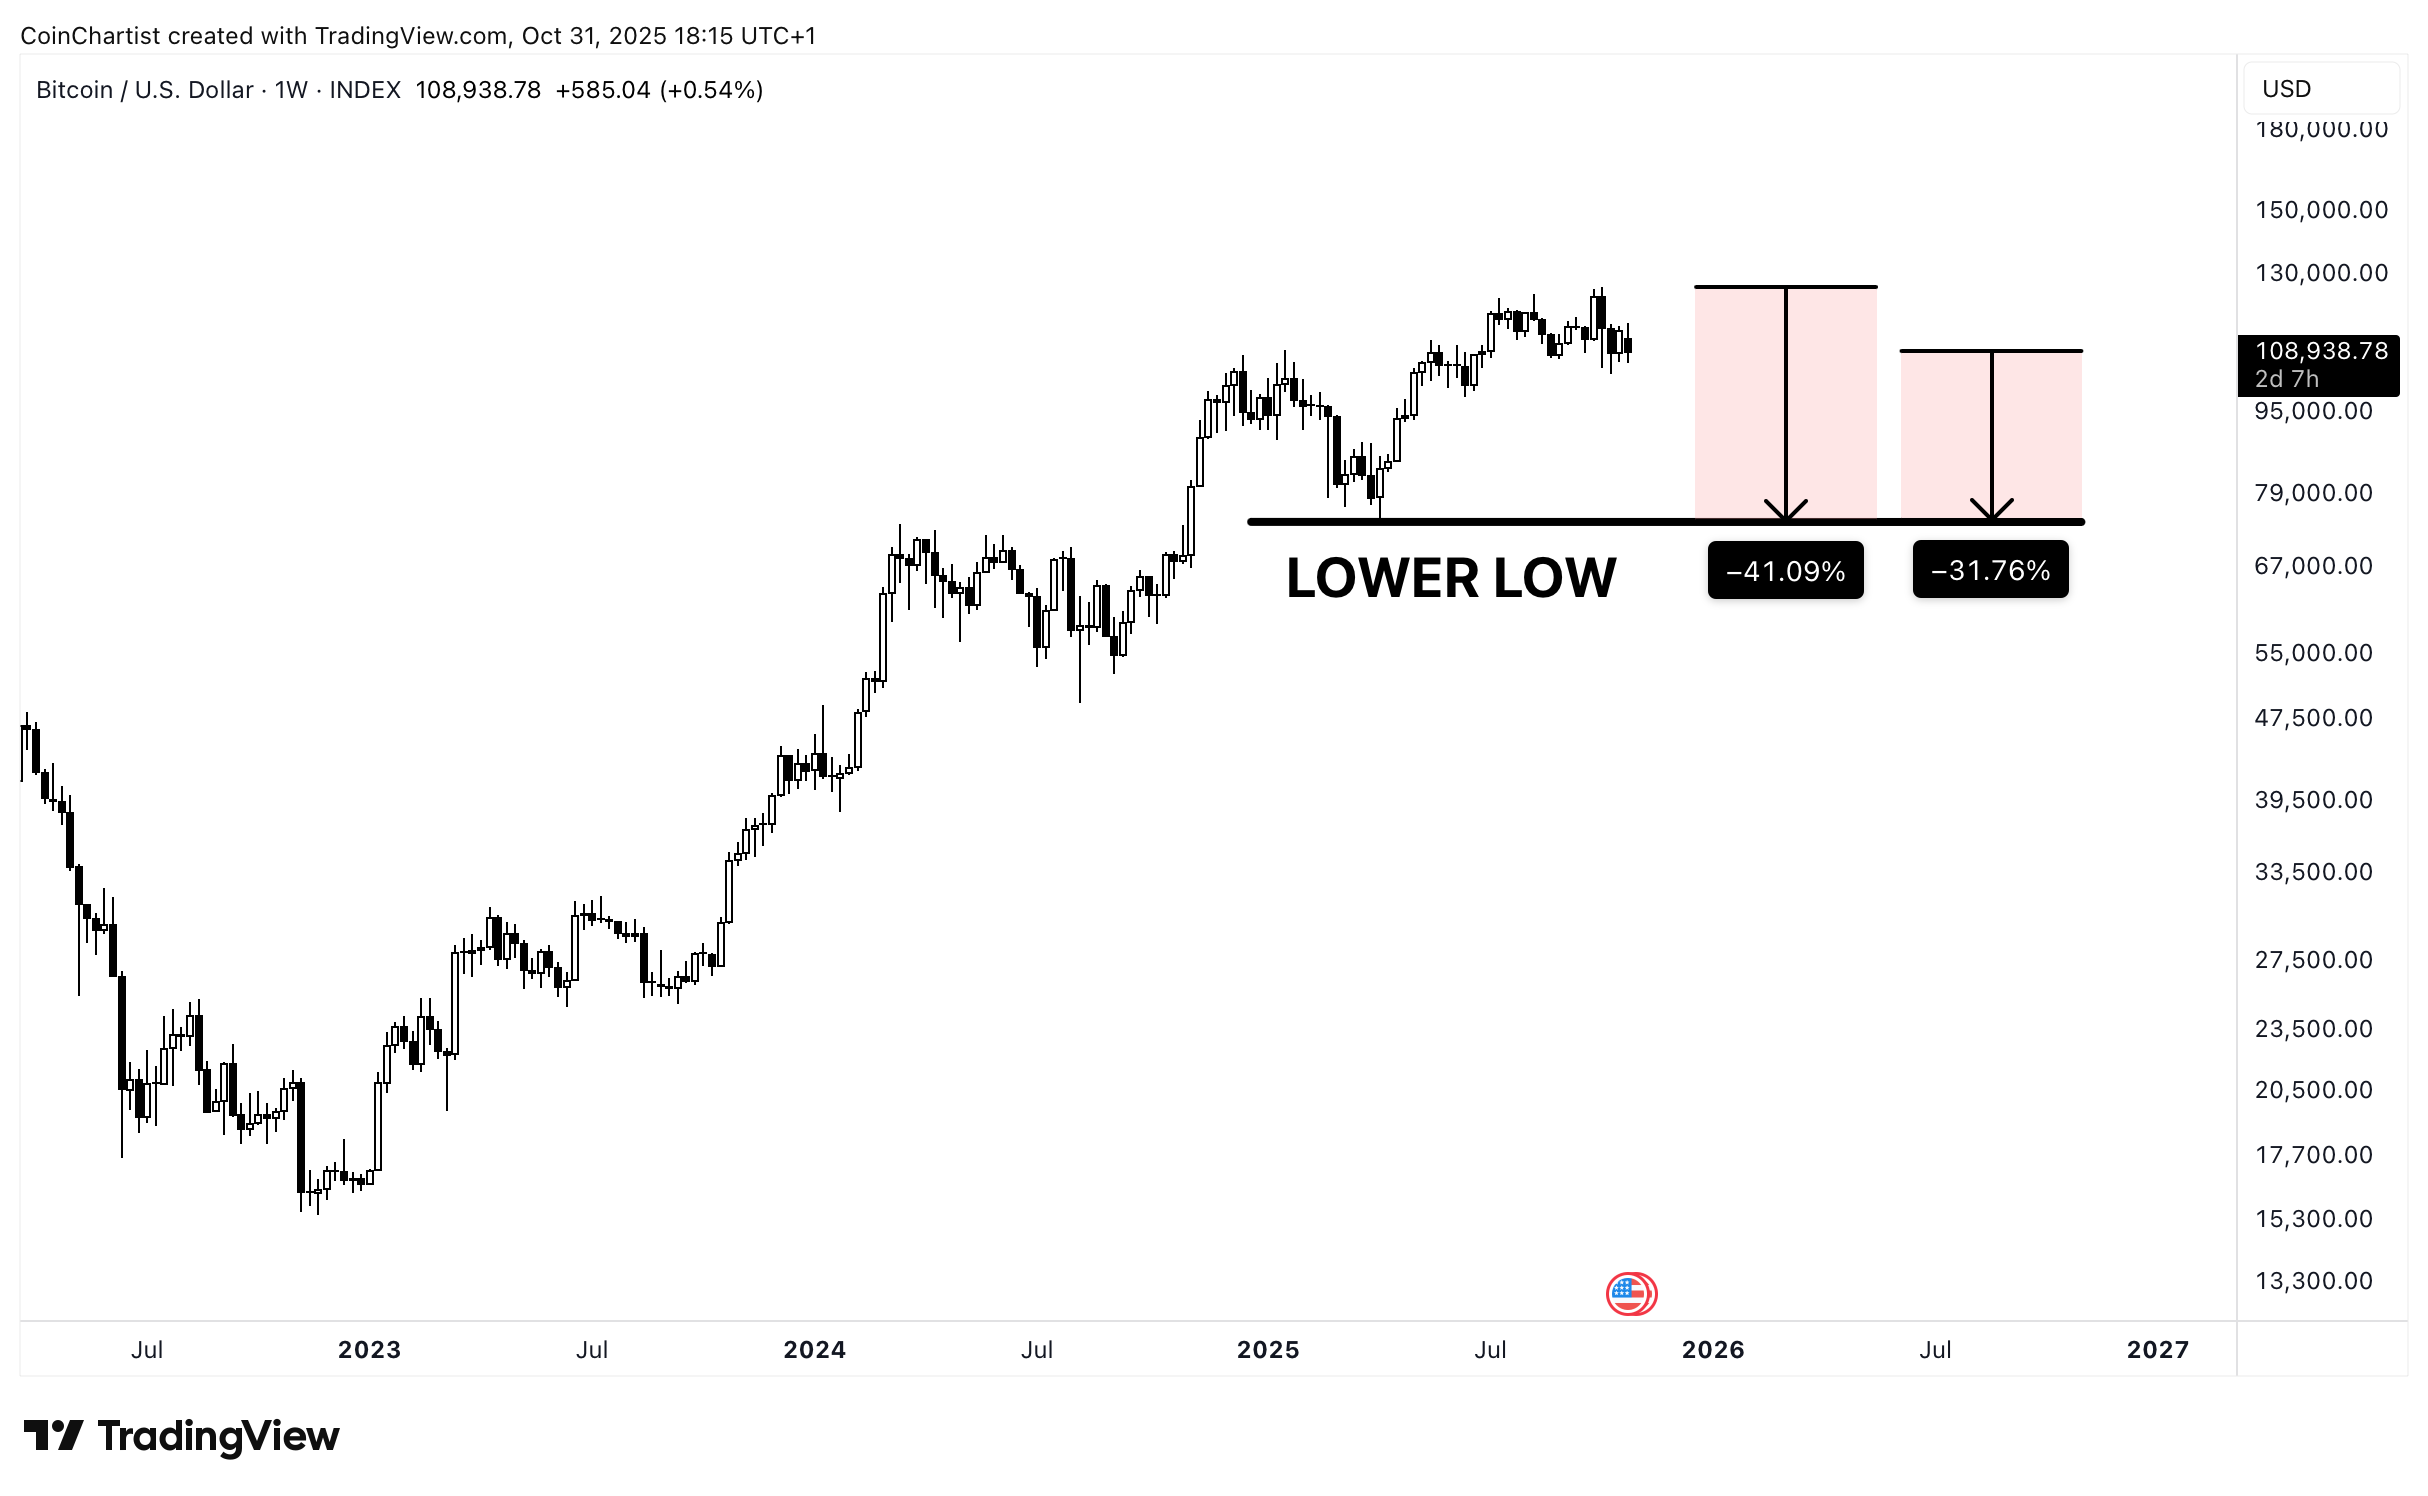
Bitcoin making a lower low is the true sign that market structure is changing. However, a lower low means over a 40% drop from all-time highs and over a 30% drop from current levels. And that’s just to get back to the most recent low. Below there and Bitcoin could see a 50-70% decline in total. This is why it is important you consider taking profit if another level is lost, like the weekly SuperTrend for example. Otherwise it is easy to get caught in a significant drawdown.
Time’s up for the 4-year cycle
There’s debate across the crypto market if the four-year-cycle is running out of time, broken, or simply changing based on the business cycle. Which is it?
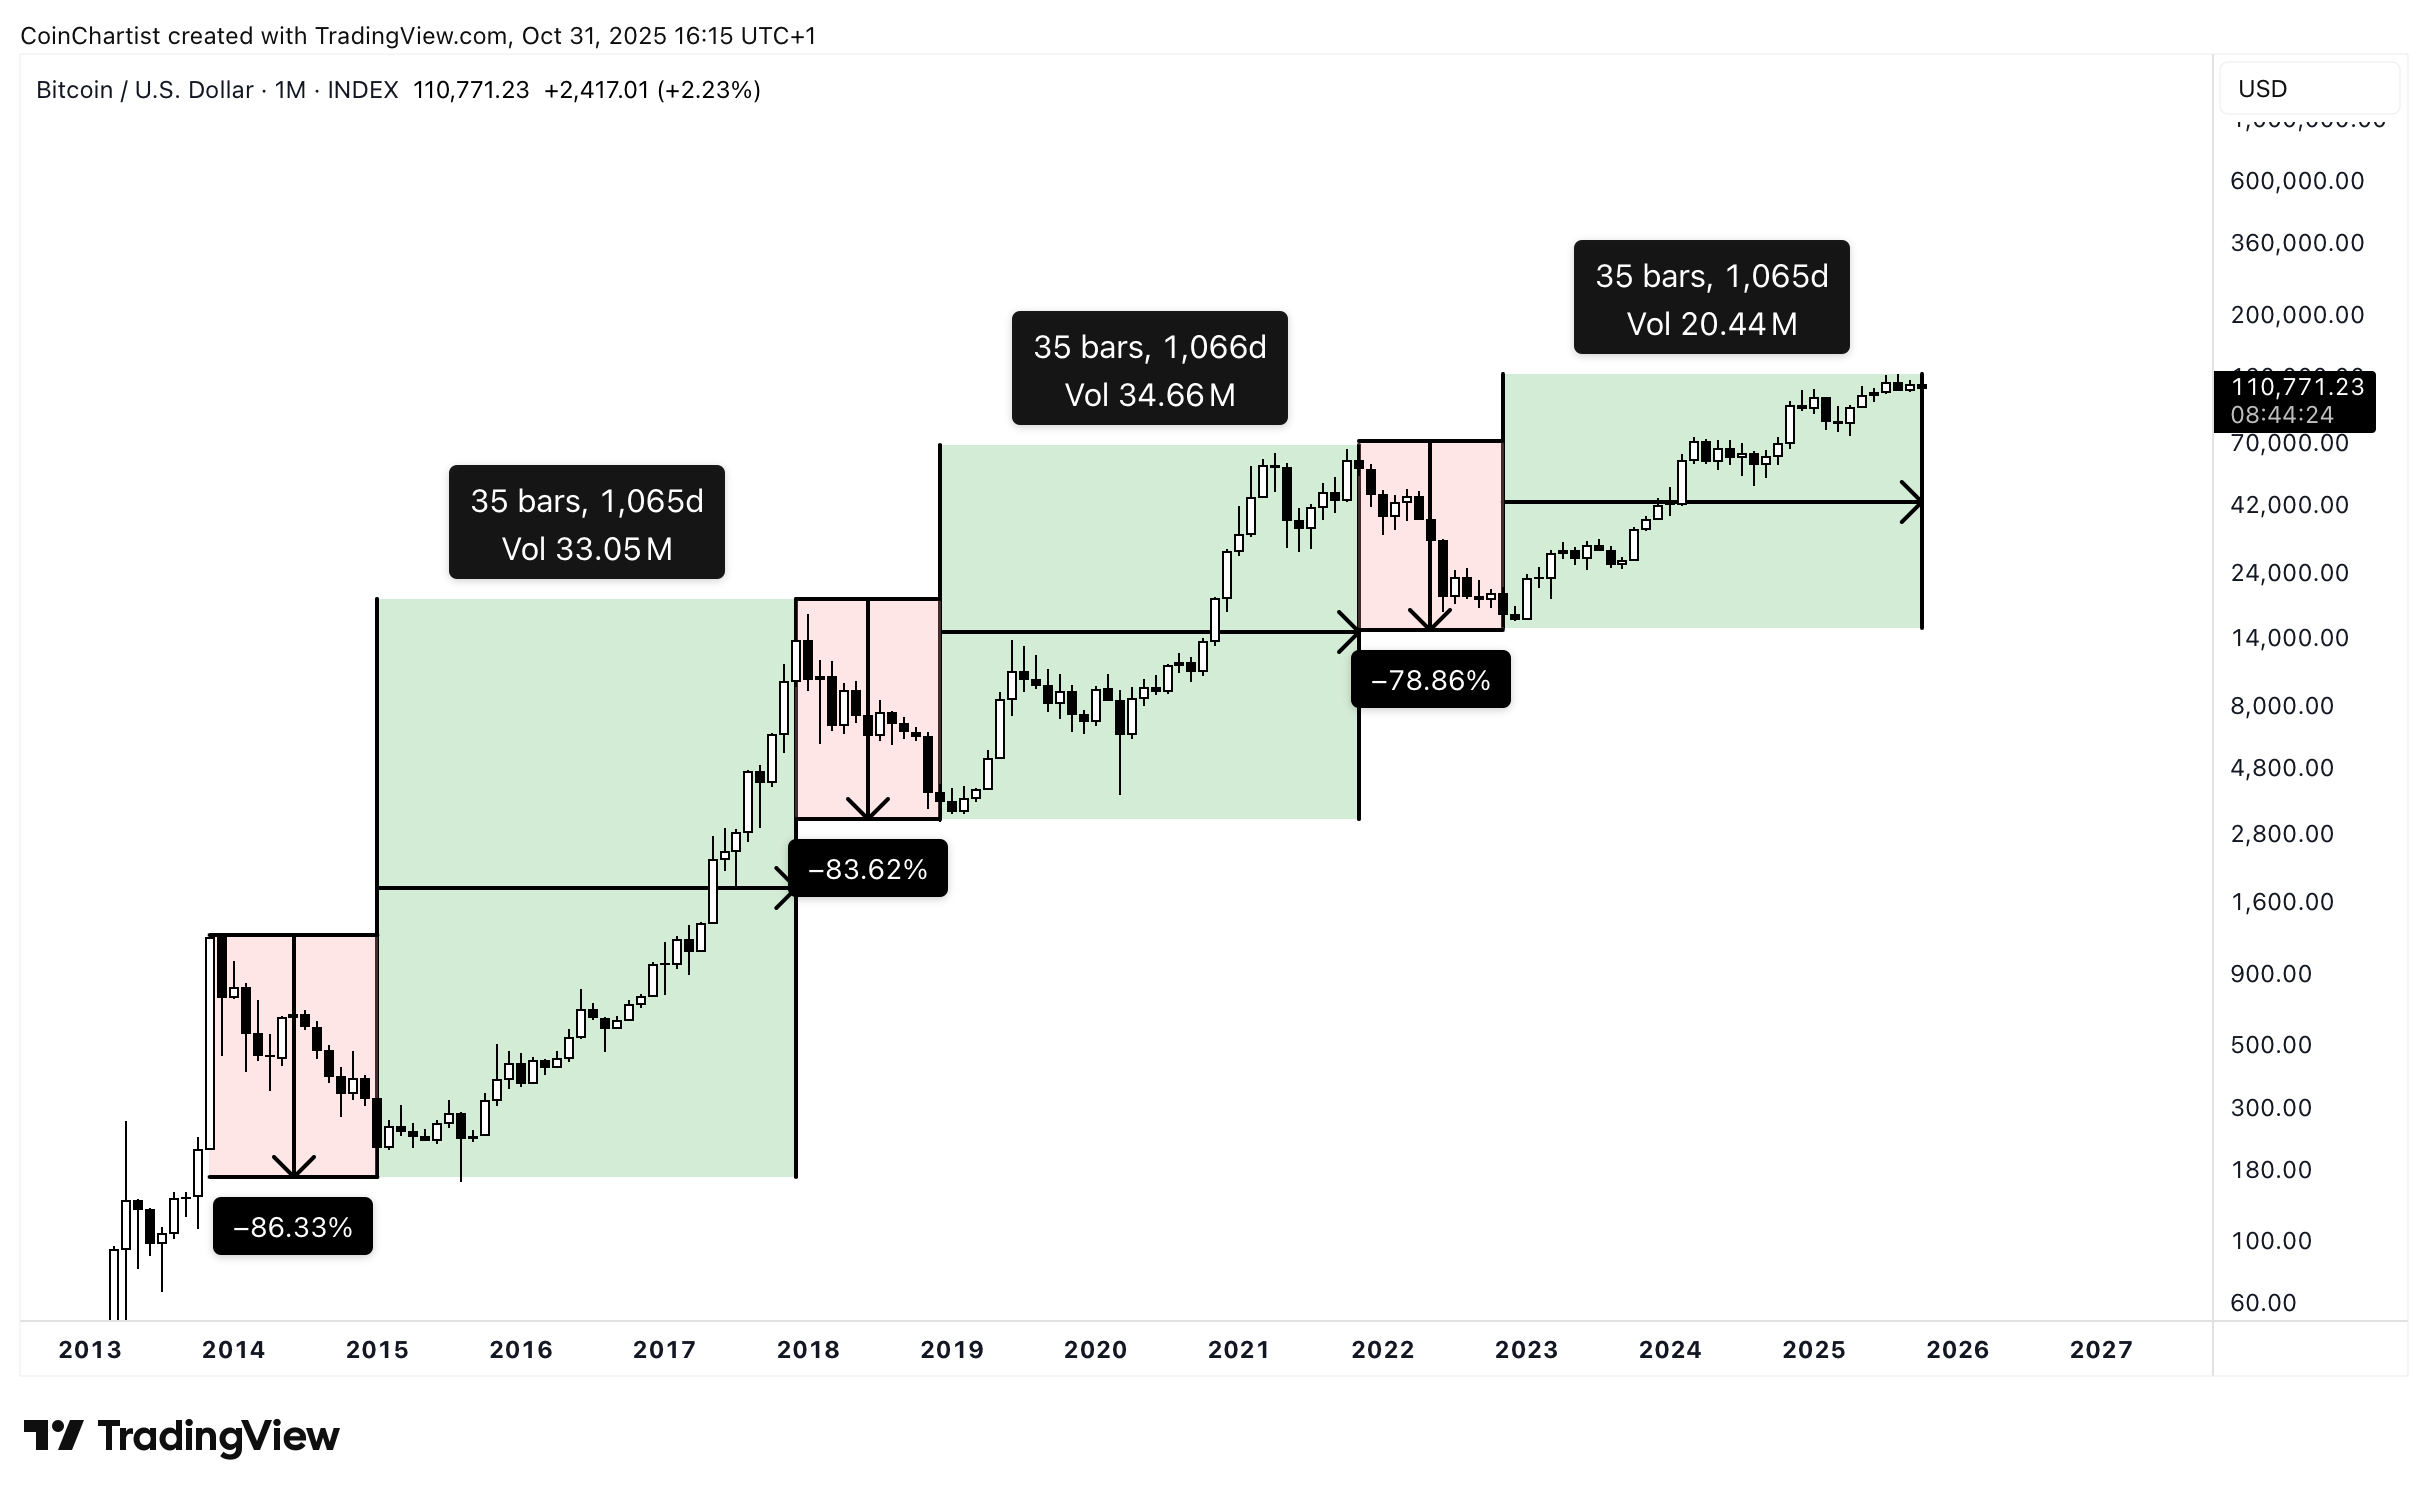
When measured from The exact bottom to exact peak high, each cycle has lasted roughly 1064 days.
2014 to 2017 and 2018 to 2021’s cycles both reached that length of time before reversing back into a bear market.
Note: Behind the paywall reveals levels to buy Bitcoin near a bear market bottom, the cyclically projected timing of the next bear market bottom, and much more. There’s also macro charts on interest rates, the effect of quantitative tightening, the business cycle, and the Fed’s reverse repo facility. Finally, I share some altcoin charts that keep hope alive amidst the increasingly bearish backdrop.
