


Topping On Tariff Fear
I am not ready to call a top in Bitcoin and crypto, but this issue explores extremely bearish alternatives.
Disclaimer: The information provided in this Substack newsletter is for general informational purposes only and should not be considered as financial advice. Investing involves risk, and past performance is not indicative of future results. Please conduct your own research or consult a financial advisor before making any investment decisions. The newsletter disclaims any liability for losses or damages arising from the use of this information.
Topping On Tariff Fear overview:
Examining why potential US tariffs have spooked financial markets
Was Inauguration Day the top? It stands as the current ATH in Bitcoin
Bitcoin’s fabled fifth wave could already be over, according to at least one Wave count
Banking on a blow-off top? Why markets are currently lacking the momentum
An altcoin
seasonapocalypse could be upon usCrypto markets are at the mercy of the Dollar. Both bullish and bearish scenarios explored
As you read this issue, please do not come to the conclusion I have turned bearish and ditched all previous bullish analysis. Until past bullish analysis is invalidated, there’s plenty of hope and a high probability that we’ll continue to see new highs in Bitcoin. But based on some recent tariff-driven macro turmoil and the ETHBTC chart, it is worth preparing some bearish alternative scenarios.
The recent changes in market structure were very subtle. Bitcoin broke out of consolidation and reached over $100,000, appearing to lift overall crypto market sentiment. Trump’s win and pro-crypto stance started to invigorate altcoins in December, but there was no follow through in January. What little momentum that was brewing, has already started to wane.
Last week, the Trump administration announced a 25% tariff on imports coming from Mexico and Canada. These are more substantial tariffs than anticipated, and when the market is expecting one thing and something else happens, we get price shock conditions. When price shocks occur, just about everything flees for safety into the Dollar. In crypto, there’s a flight to USD, stablecoins, and Bitcoin. As a result, the DXY, BTC.D, and USDT.D spiked higher.
Trump has since backed off as demands were met, but the fear of potential tariff-related policy change could be putting a damper on risk appetite, and here’s why. Tariffs make imported goods more expensive for US consumers, reducing demand. Lower demand makes foreign currencies weak. A weak Canadian dollar or Mexican peso means a stronger US dollar. Because all risk assets like Bitcoin are priced in USD against the dollar, a strong dollar can be destructive.
Tariffs can also lead to or escalate trade wars, stifle economic growth, cause inflation, and much worse. For example, historically higher tariffs are largely credited with worsening the Great Depression in the 1930s. These forward-looking fears, if left unchecked, could cause risk appetite to dry up and the crypto market to topple over once again – before we’ve ever really seen a proper altcoin season or enough euphoria for a blow-off top.
Altcoin season, a blow-off top, and overheated technical indicators from past cycles might not happen this time around, just because they have done so in the past. This is reality. You’ve surely read the warning: past performance doesn’t guarantee future results. We could theoretically reach a market top without much euphoria, without a blow-off top, and without an altcoin season ever happening due to decreasing market breadth (participation).
February is the make it or break it month. If we decline again in February, these technicals teetering bearish could worsen. Altcoins are already so low, more downside could be crushing. It is imperative that February ends bullish and undoes some of these potentially bearish signals.
Without further ado, here is our look at a bearish alternative.
Was Inauguration Day the top?
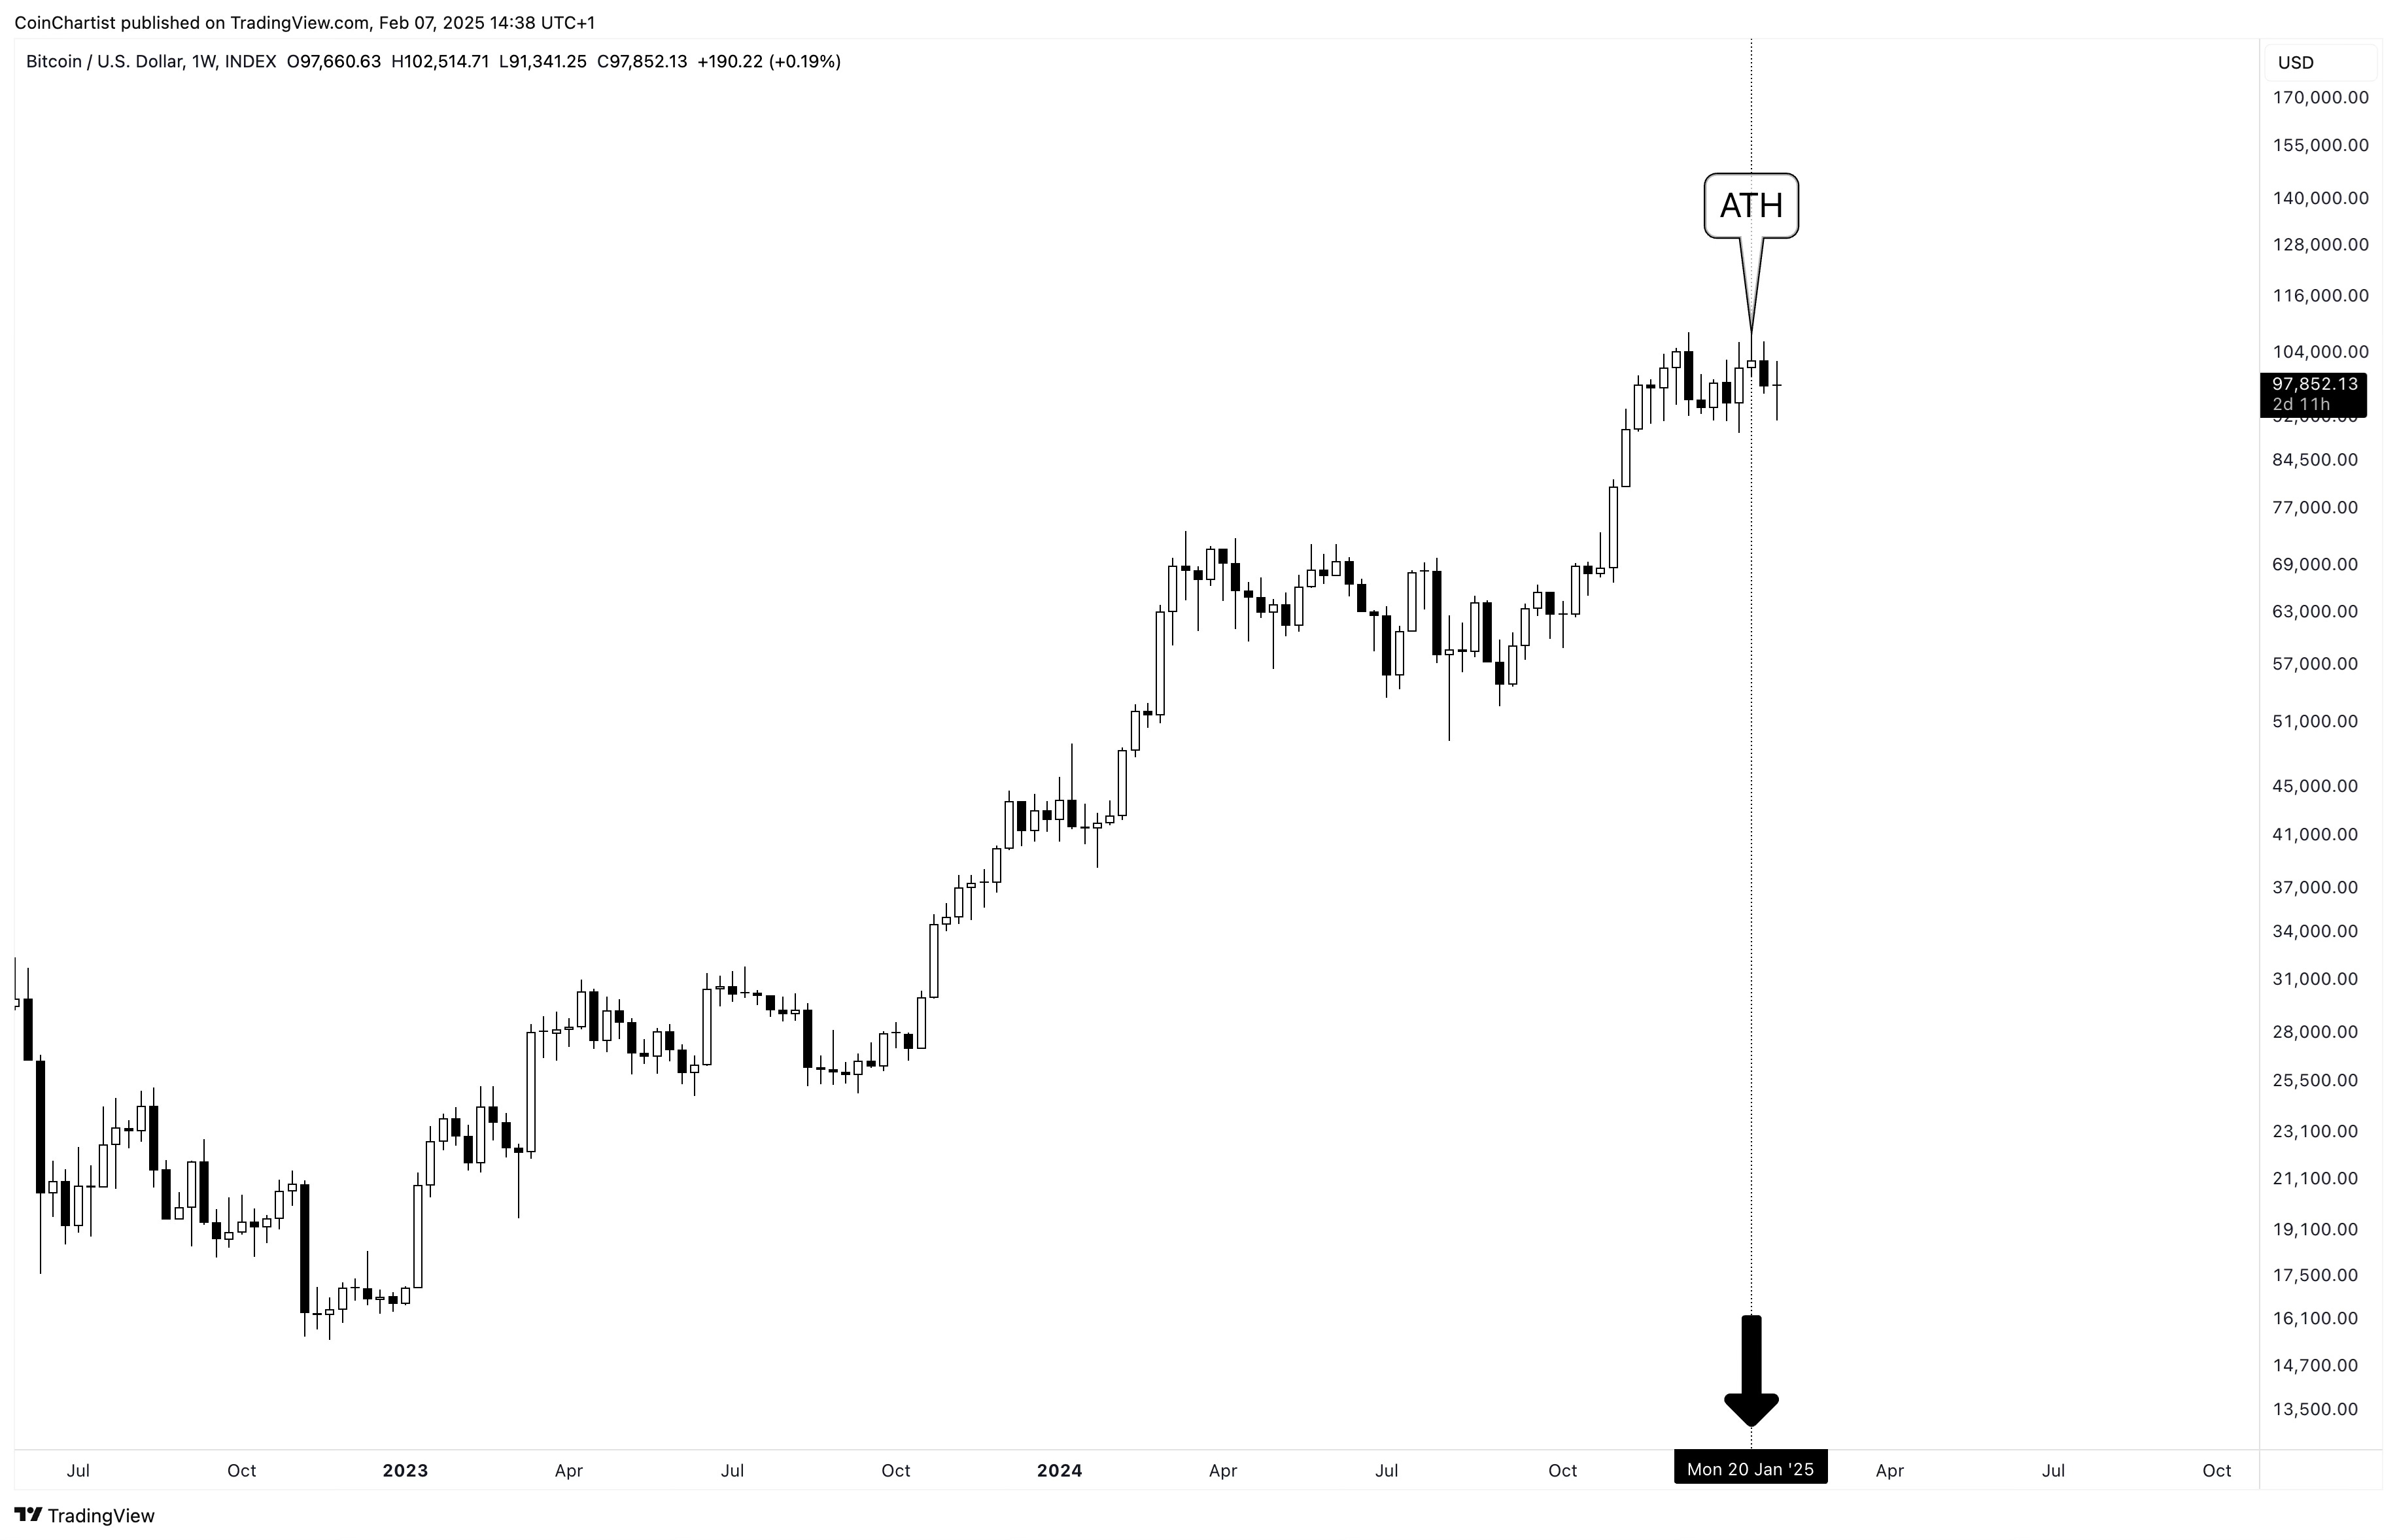
Right after Trump winning the election, Bitcoin exploded higher causing a short burst of euphoria. The euphoria was nothing compared to past cyclical peaks, but you can’t argue some euphoria was brewing over the thought of a strategic Bitcoin reserve and other pro-crypto policies. Typically, cycles come to a peak coinciding with an event that calls for a “new paradigm” to begin. I had assumed there would be enough euphoria over the BTC reserves to create this new paradigm mentality in the crowd, but it never quite took hold to the degree I expected. Price also didn’t reach as high as I wanted to see by the January 20th date. Monthly technical indicators like the RSI also didn’t come close to what we usually see around a top. Realizing this, I backed off the Inauguration Day being our cyclical peak. And yet, if you look at the chart and the date, our current ATH is on or around January 20. So then… did Bitcoin top at this precisely called timing? While I still don’t think Bitcoin has topped, some parameters have been satisfied in terms of time cycles and wave counts, as we’ll explore next.
Even the largest waves come crashing down
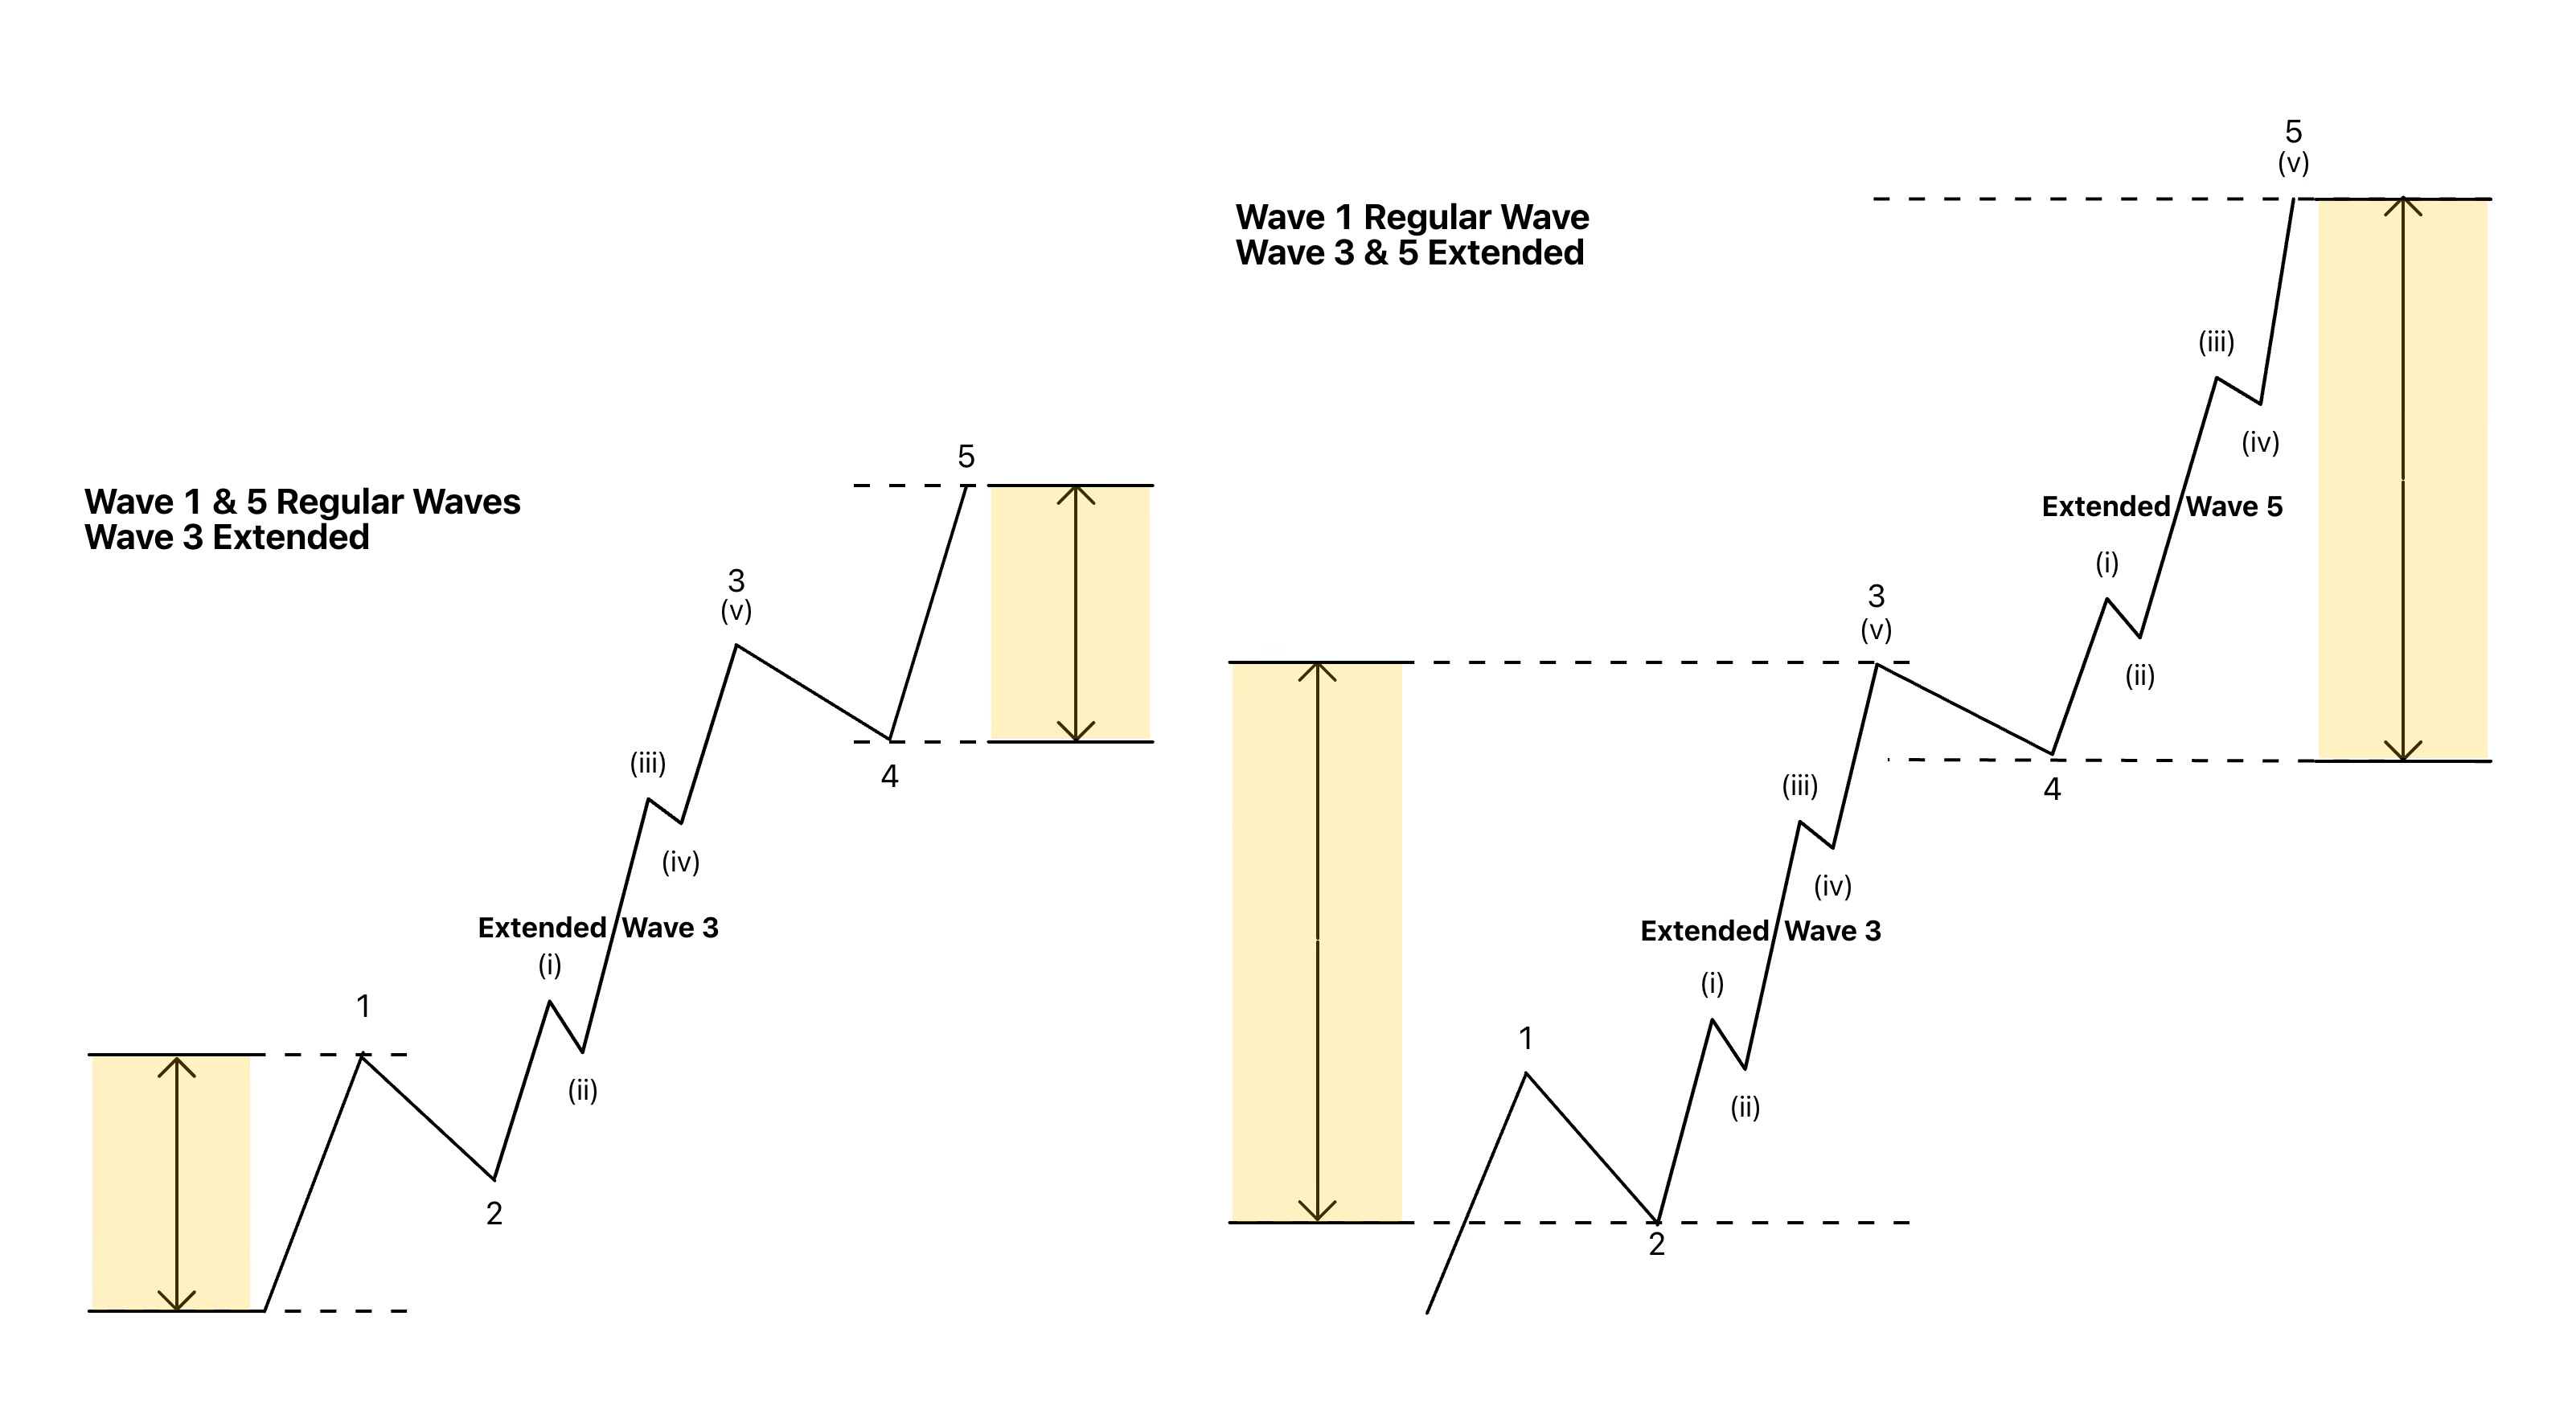
Closely examine and compare the left diagram with the right diagram. On the left, you have a standard Elliott Wave motive wave (bull market) with 5 waves up. Wave 3 is extended, while Waves 1 and 5 are not. According to Elliott Wave Principle, two out of the three upward waves will match in magnitude. Wave 1 was a normal impulse, while Wave 3 was an extended impulse. On the right, however, we have the same motive wave (bull market), but with Wave 3 and 5 matching with extension.
In this example, Wave 1 and Wave 5 match in magnitude. Each Wave will have seen Bitcoin rise 100% in value. Wave 5 will have slightly exceeded Wave 1’s distance on a percentage basis if measured to the exact ATH wick. In this example, there’s a real possibility that Bitcoin has topped out.
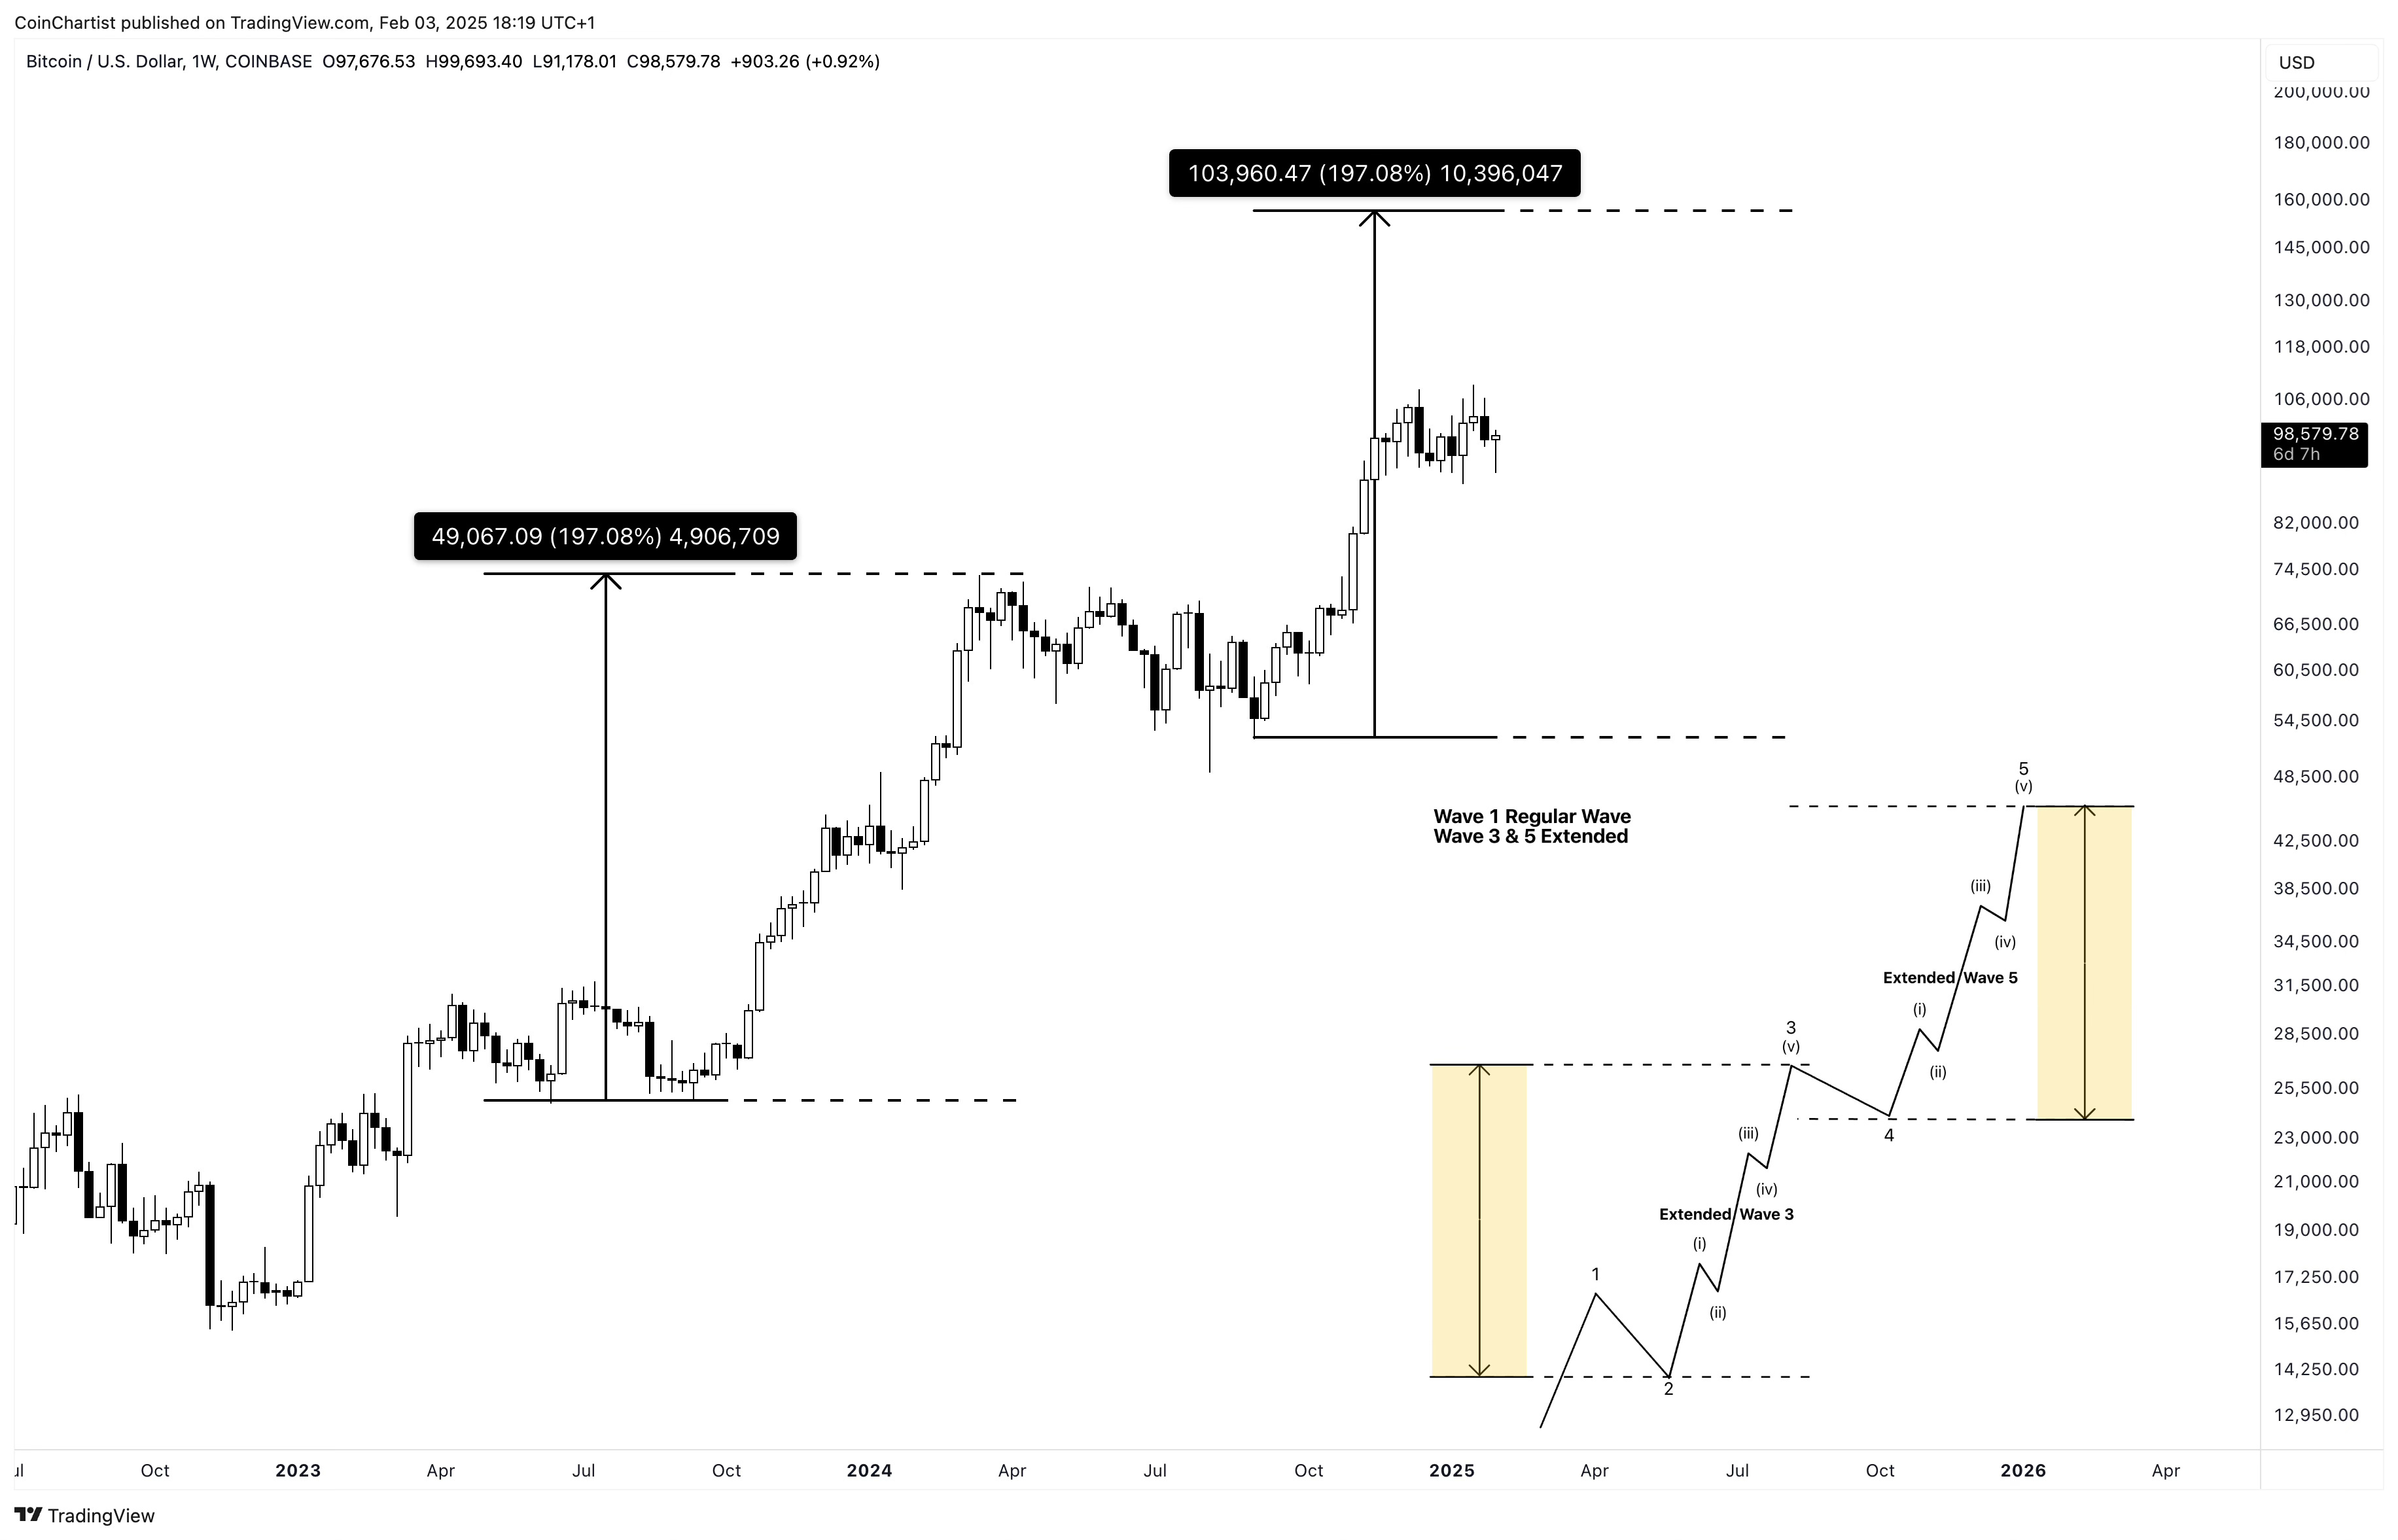
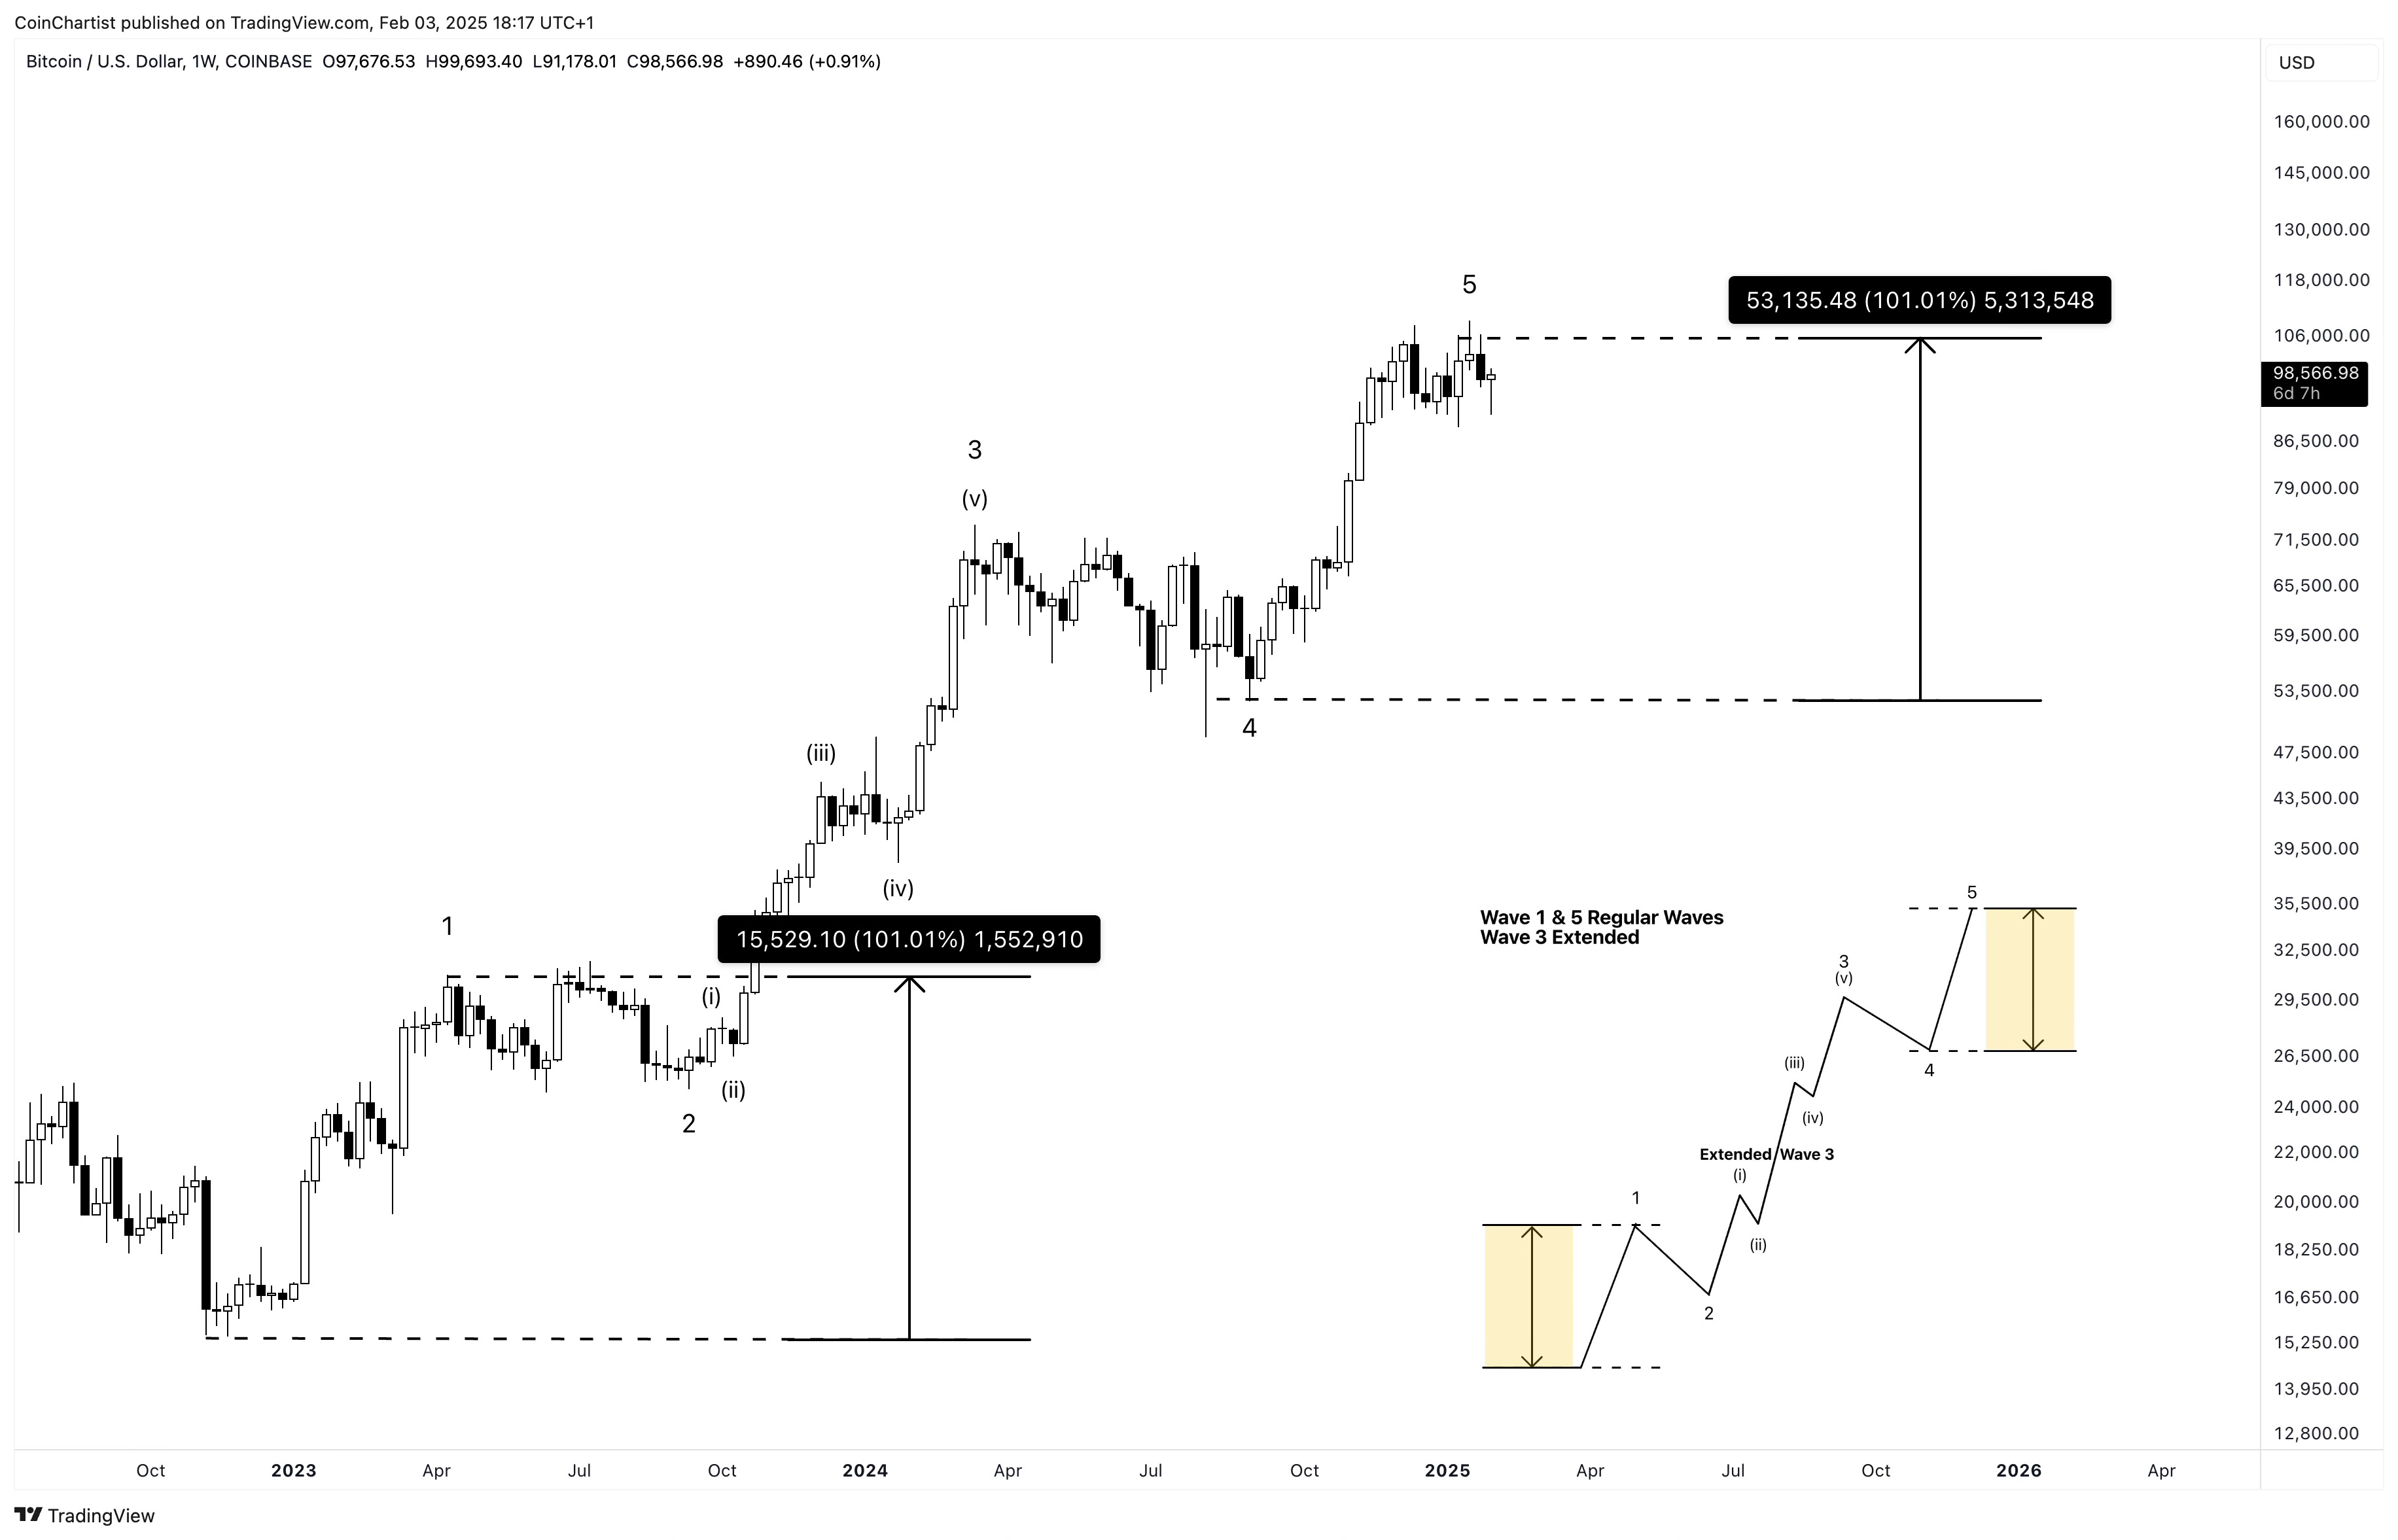
What we are instead hoping for or potentially anticipating, is an extended Wave 5 that matches or exceeds the magnitude of Wave 3 instead of Wave 1. Remember, at least two of the upward Waves will match. Two extended Waves are rare, but not impossible, especially when Wave 3 isn’t all that extended as we’ve seen in past Bitcoin cycles. If Wave 3 is very extended, Wave 5 tends to match Wave 1 to balance out the market. If this example is accurate, Bitcoin is only in Subwave iv of v of Wave 5.
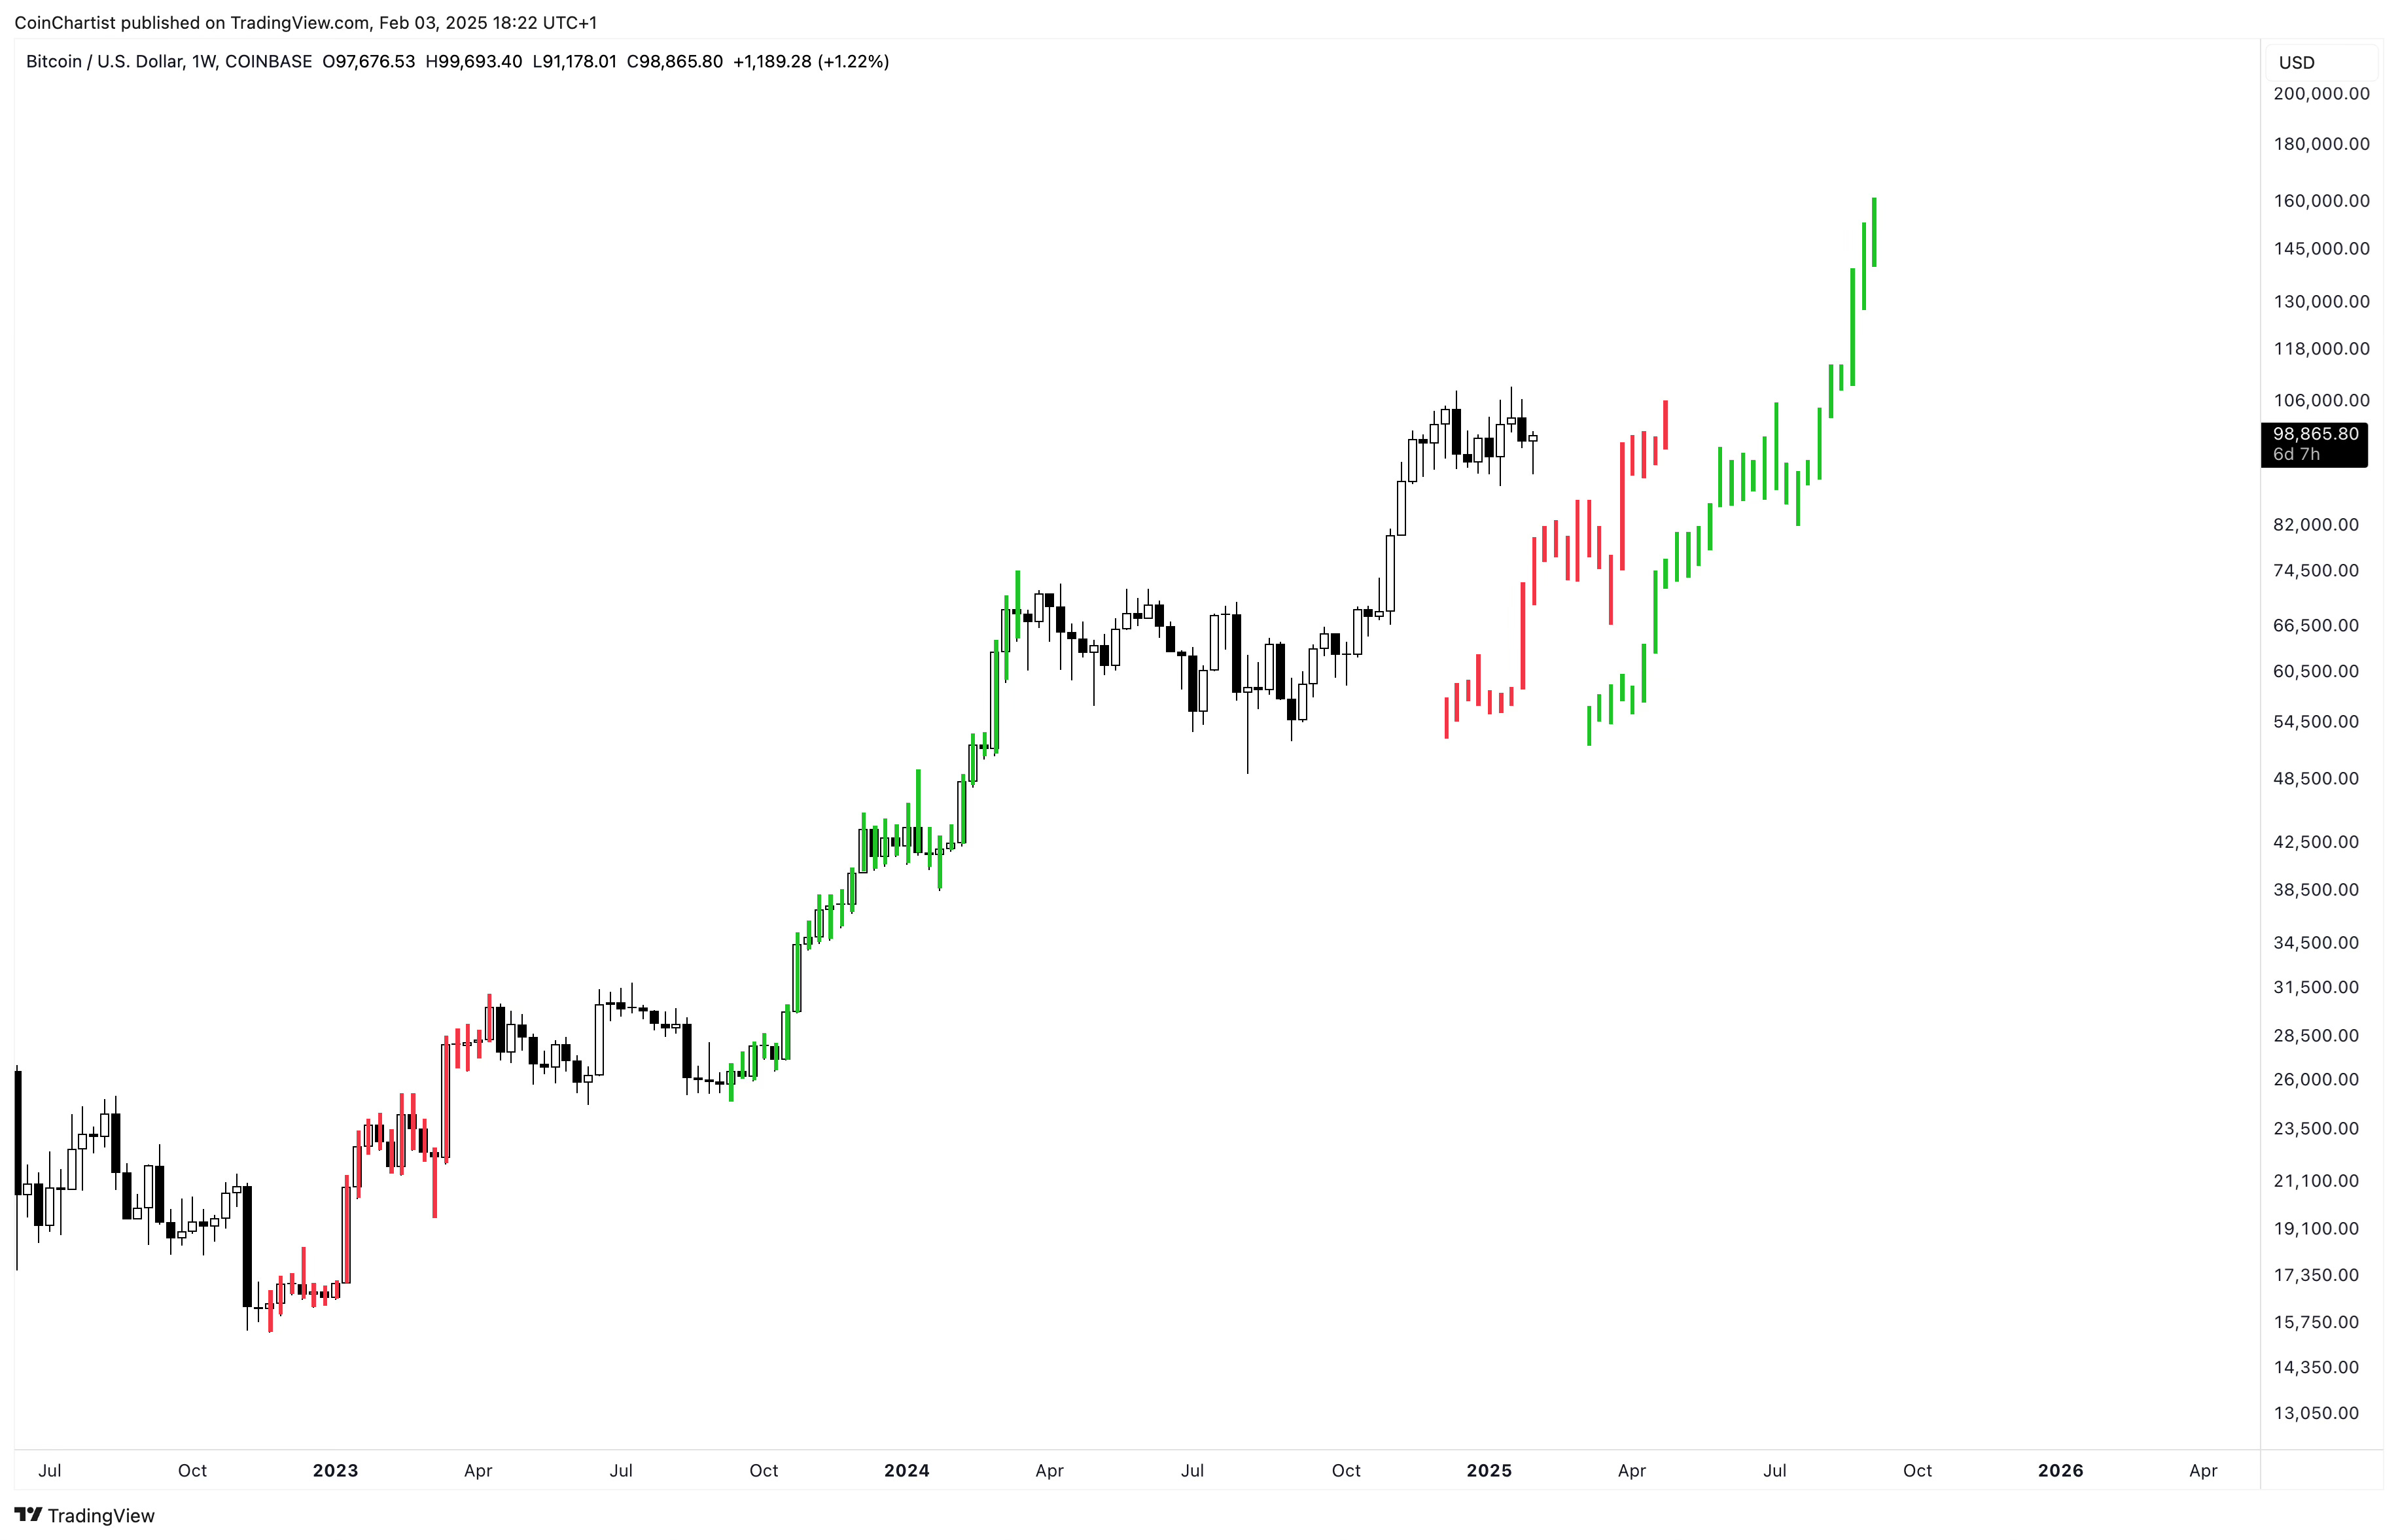
Here, I’ve taken two different bars pattern drawings and overlaid them next to Bitcoin’s price action currently. We can see the red bars pattern from Wave 1 is almost exactly the same height as Wave 5. If Wave 3 is extended, we are once again in sub-wave iv consolidation, building up for the final move up. Both scenarios are very possible.
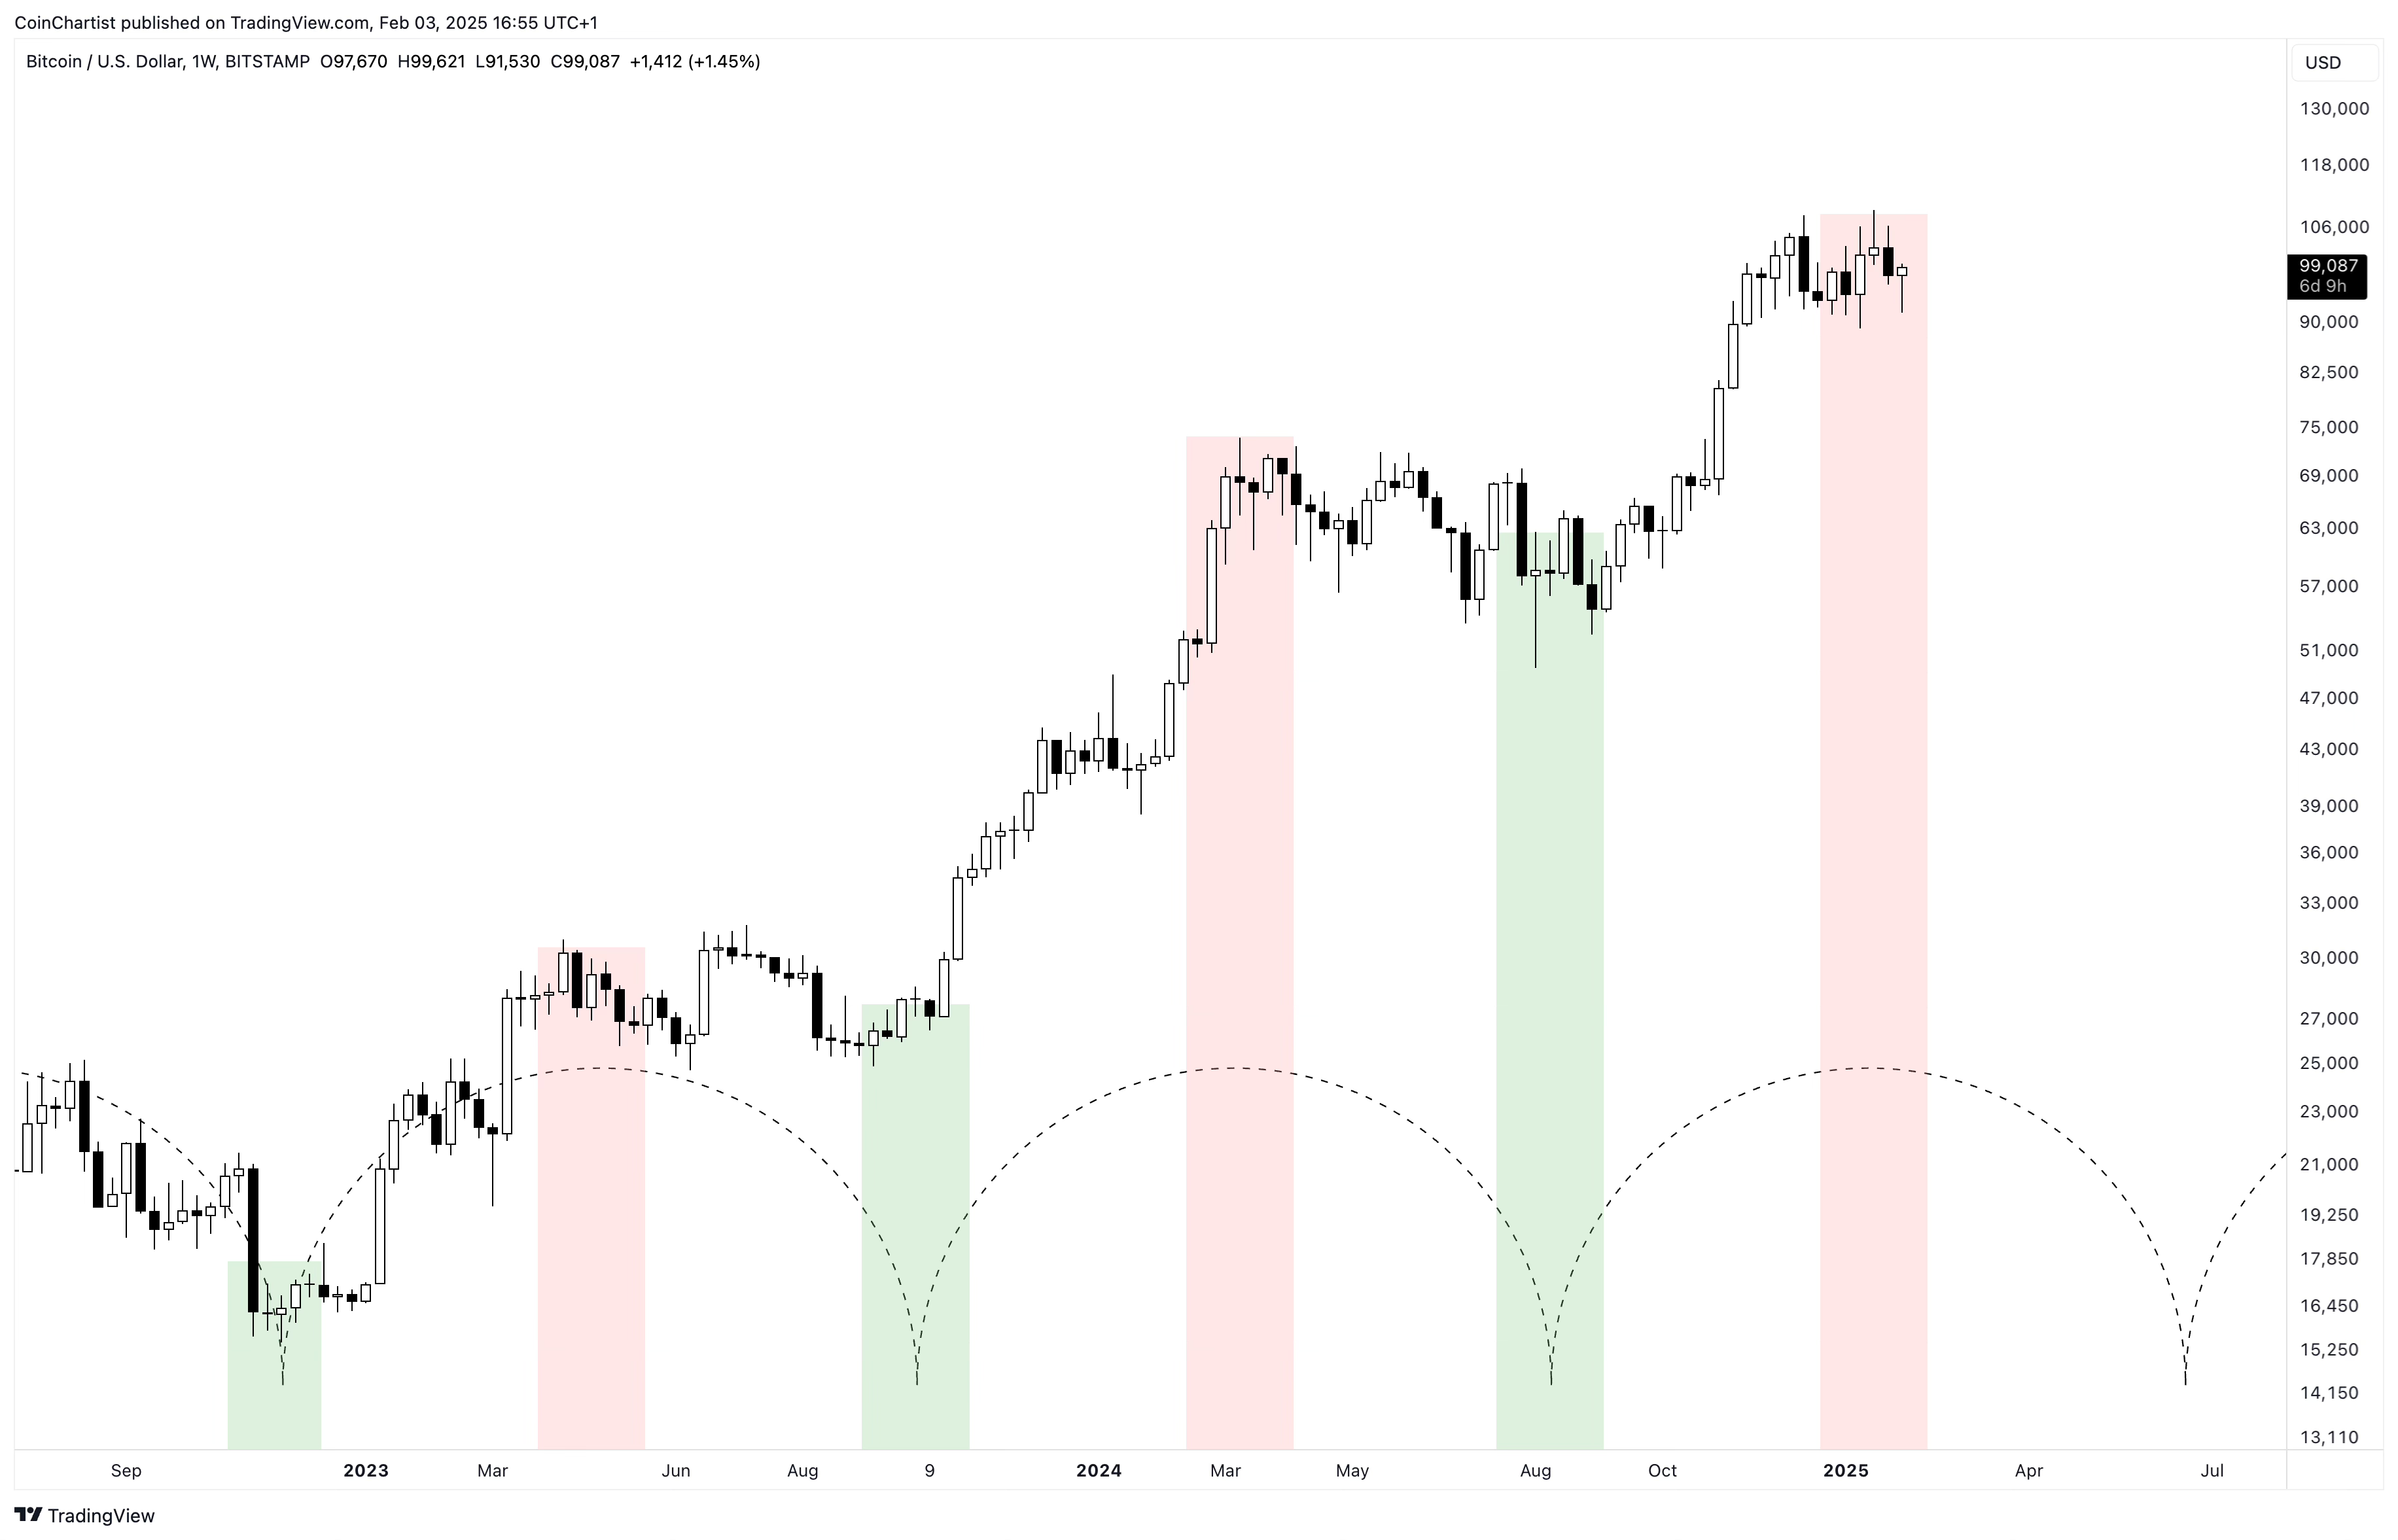
I didn’t just come up with the Inauguration Day out of thin air. The narrative made sense, yes, but I also saw time-related reasons for reaching a top around that time. The tops of Wave 1 and 3 both were made in the red zone, right where Bitcoin is right now. Bottoms were put in during the green zones of the time cycles.
Keep reading with a 7-day free trial
Subscribe to CoinChartist (VIP) to keep reading this post and get 7 days of free access to the full post archives.