


Treasury Trend
Bitcoin treasury companies are growing by the day and buying up all the BTC. How is this fundamental shift affecting technicals? And what about altcoins?

Disclaimer: The information provided in this Substack newsletter is for general informational purposes only and should not be considered as financial advice. Investing involves risk, and past performance is not indicative of future results. Please conduct your own research or consult a financial advisor before making any investment decisions. The newsletter disclaims any liability for losses or damages arising from the use of this information.
Treasury Trend overview:
Bitcoin treasuries are buying up all the available BTC. Here’s what this could mean
An updated, all-new Elliott Wave count that could explain why Bitcoin price is stuck, despite treasuries actively buying
A detailed assessment into the relative strength of BTCUSD, BTC.D, ETHUSD, XRPUSD, ETHBTC, and altcoins (TOTAL3)
Updated Bitcoin weekly technicals show bulls building strength. Will we finally see a strong breakout into a sustained uptrend?
Gold could be topping out. Why this could lead to a risk-on environment
COIN shares make a higher high since last issue. Now all eyes are on all-time highs and a move into price discovery
The S&P 500 makes a new all-time high. Is this yet another risk-on signal?
Bitcoin’s unbreakable “forever” resistance line remains unbroken. Don’t miss it
Everyone agrees: This cycle in crypto is very different than what we’ve seen in the past. Bitcoin has made a slow, unstoppable ascent, while in the past it made a parabolic advance. Altcoins have done nothing but disappoint and decline the entire time.
Even this late into the cycle, alts remain stagnant, and rather than collapse into a bear market, Bitcoin is holding strong above $100,000 per coin. So we can all agree, this cycle is very different. But why? And what’s happening now with Bitcoin moving sideways above $100,000?
To start, we’ve had an environment where monetary conditions have been contracting. What little capital and liquidity has been available, has gone mostly into Bitcoin. Bitcoin’s strength in an environment with limited liquidity has sucked the market cap right out of altcoins.
This could change suddenly, but the reality is that altcoins might continue to struggle in this environment. The environment could also change, and then it might support altcoin appreciation – but not quite yet.
Now, Bitcoin is above $100,000 and has spent months above the key level. Yet for whatever reason, it hasn’t turned bearish, nor has it really taken off the way it should have.
This dynamic is a result of older BTC holders selling while treasury-focused entities accumulate the available supply.
Considering how this fundamental trend is strengthening, it could help to explain why technicals suggest more sideways and could turn back up and cause Bitcoin to finally go parabolic.
Don’t forget, you can also find me on Slice by clicking below:
Treasury Takeover
The Bitcoin treasury trend is hitting a boiling point. Ultimately, I think this trend unwinding ends up causing an extended bear market in Bitcoin, but for now, it appears to be truly just getting under way.
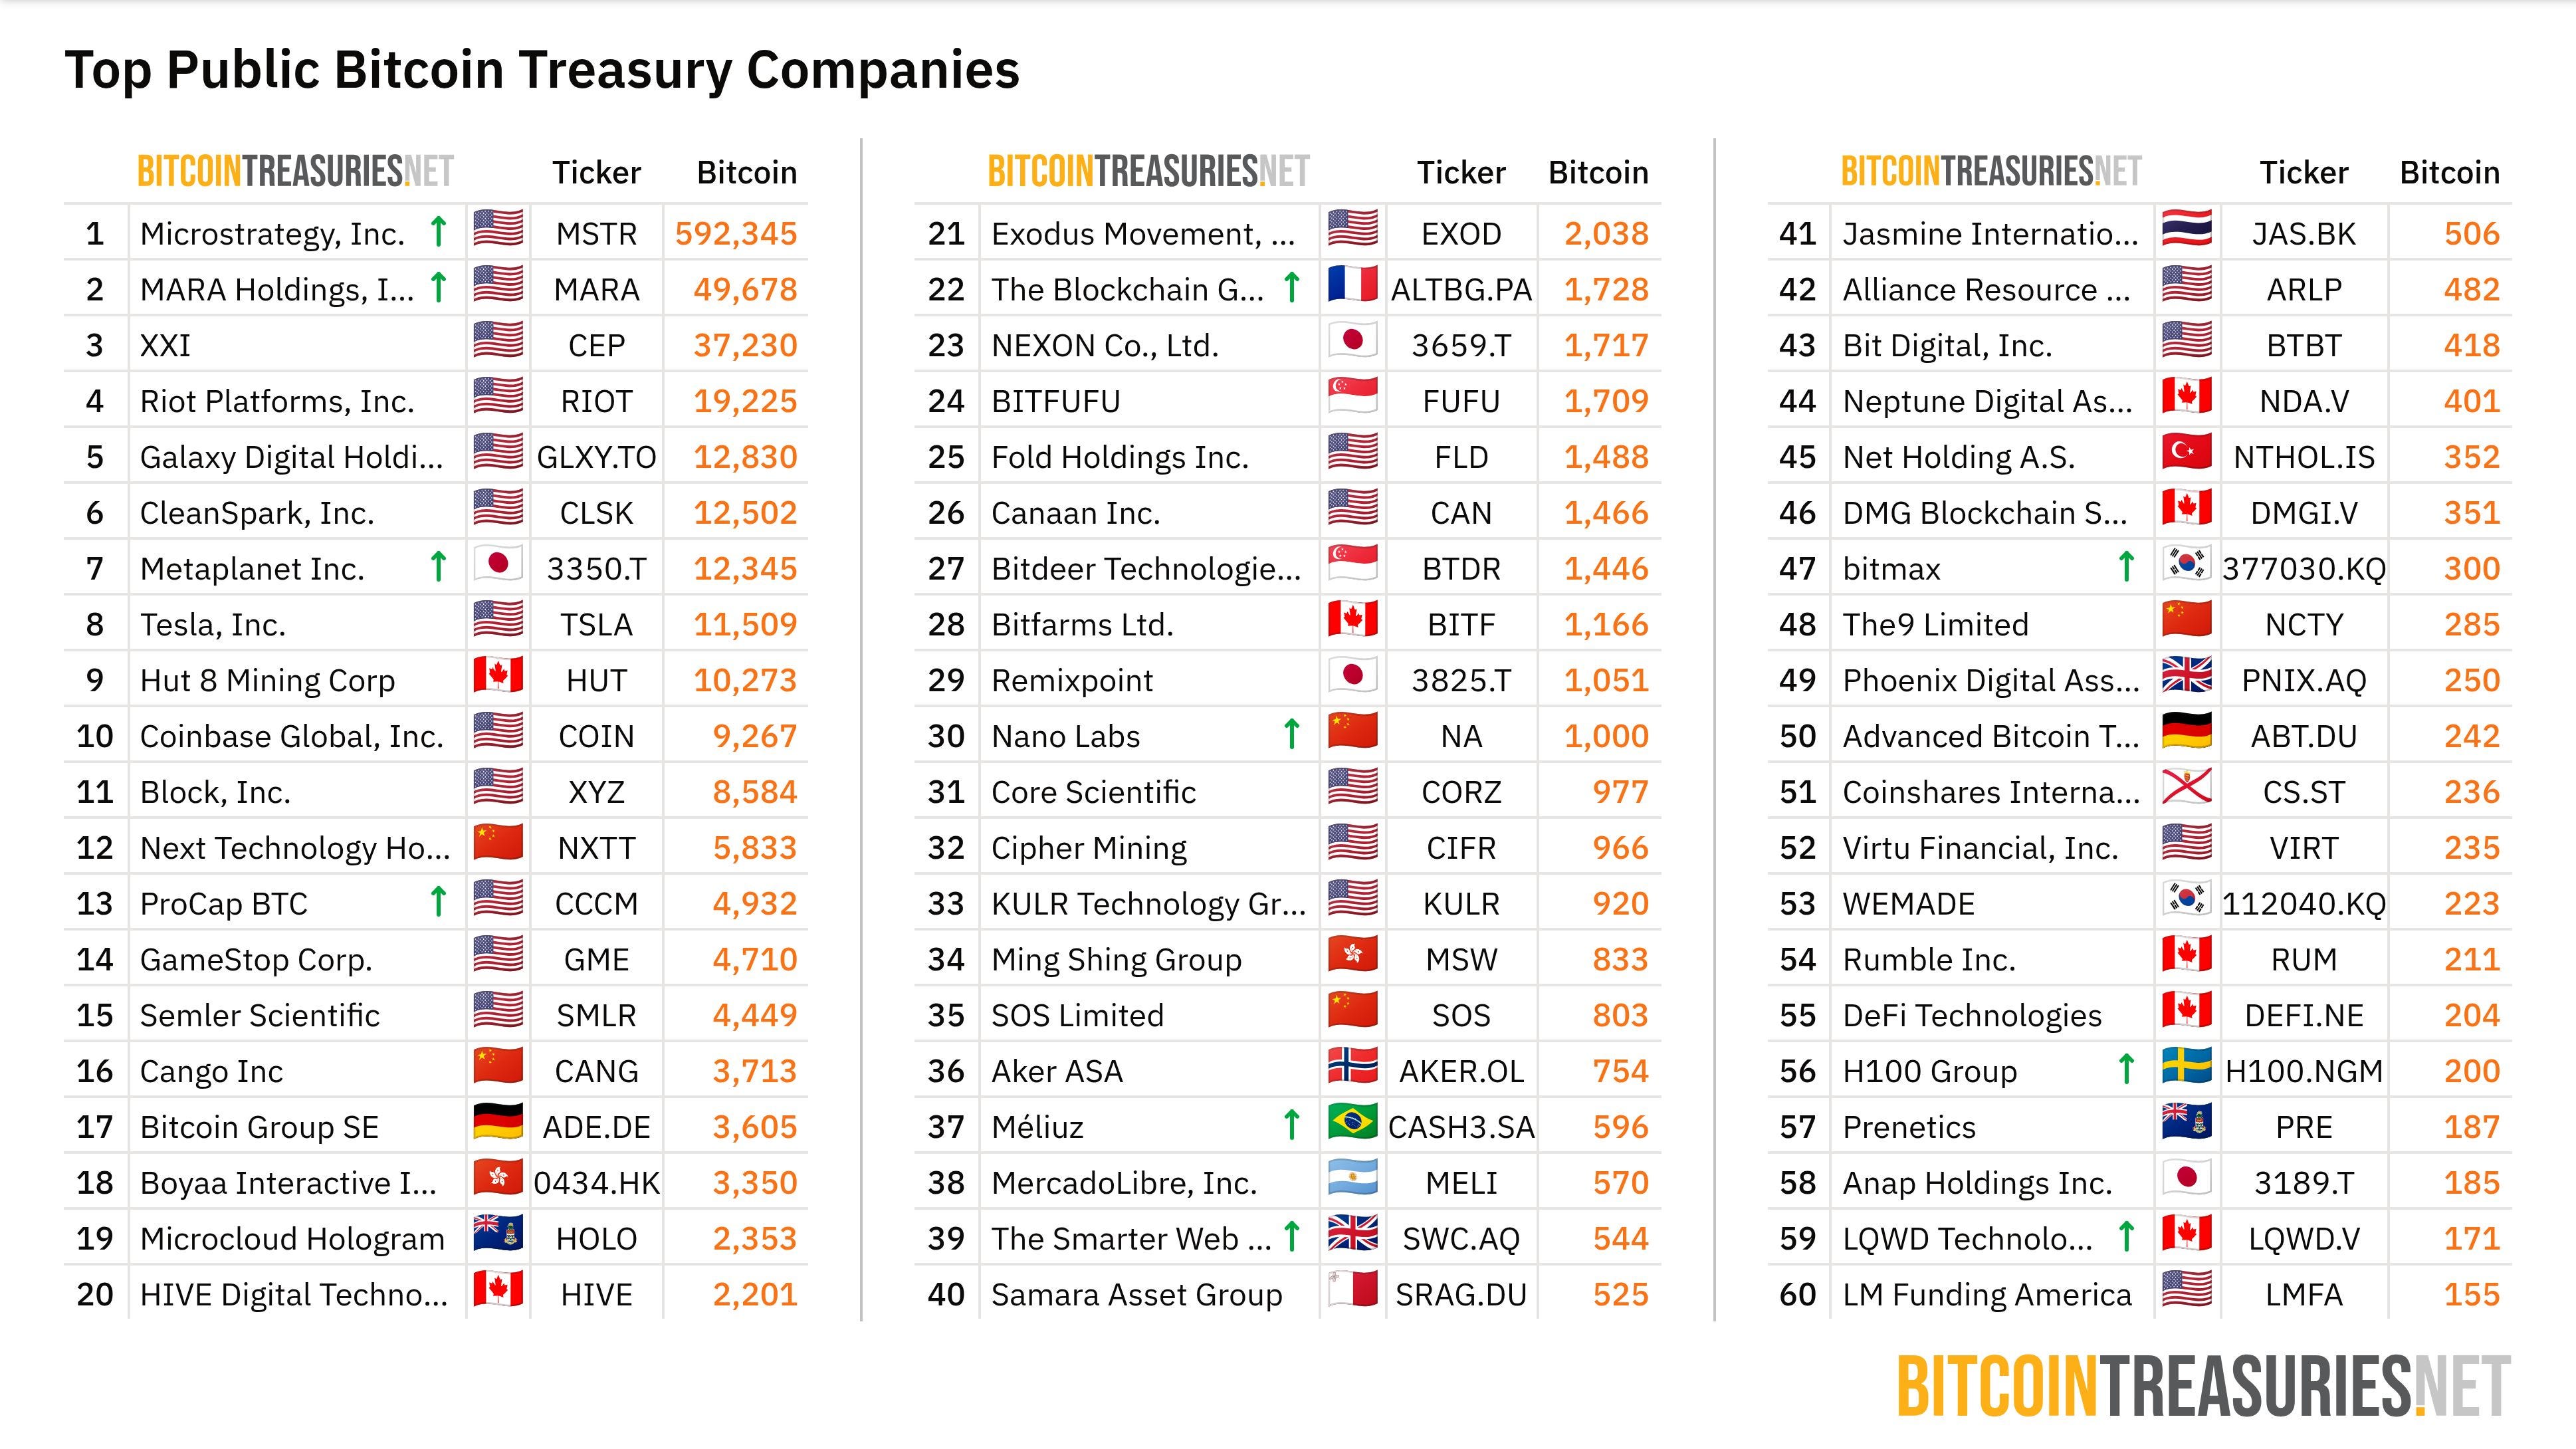
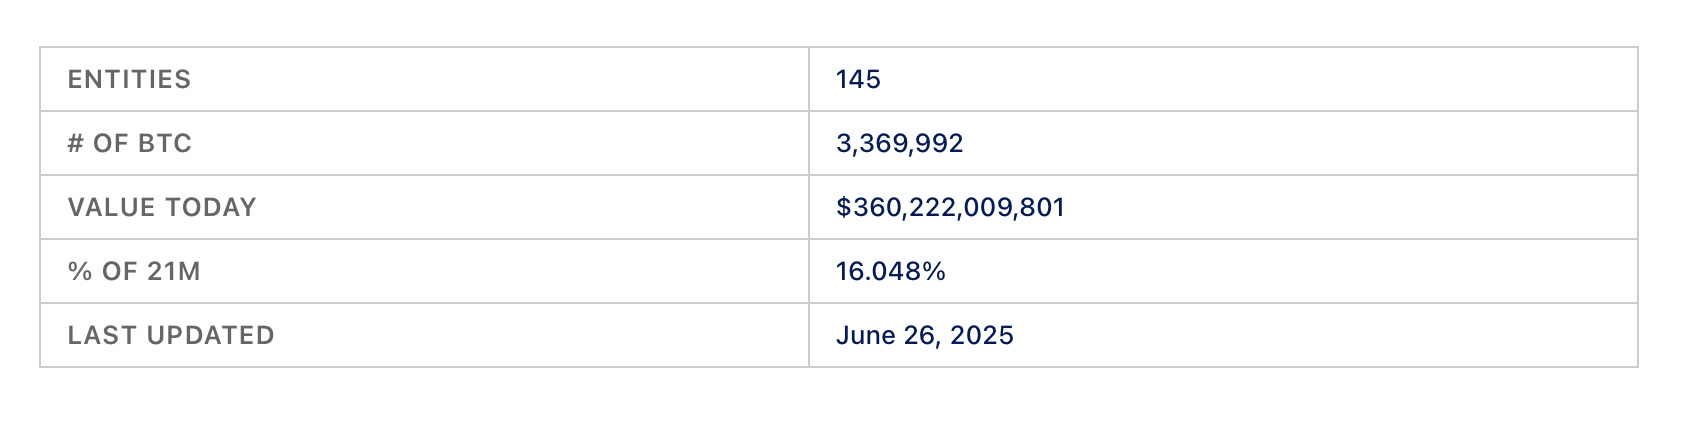
The list of Bitcoin treasuries are growing rapidly. These consist of companies adding BTC to their balance sheet, companies that solely are designed to buy and hold BTC, countries, and ETFs. Essentially, these are entities and not individuals.
As entities adding an asset to their balance sheets, they are much less likely to sell or make impulsive, irrational decisions the same way individuals investors might. The time horizon for holding this investment could be years, decades, or even forever. As individuals take profit on Bitcoin at $100,000, these entities are buying this supply. The selling is keeping Bitcoin from cruising into price discovery, but the buying is preventing a bear market despite technicals suggesting one was on the way.
A Wave of New Buyers
Currently, I am not sold on any Elliott Wave count on Bitcoin. However, the below version could very well explain a lot about where we are in a very different cycle driven by new dynamics.

After a five-wave count, a larger degree correction begins. Because we have completed five waves up, we could have satisfied a larger degree Wave ①. As such, we could be looking at a 1-2/1-2 setup, which could hint at a similar, shallow and sideways style correction at this larger degree. The larger red ellipse could play out like the smaller red ellipse. Another six months to a year of sideways would crush the spirits of individuals, while entities would enjoy the opportunity to keep buying at current levels.

This EW count would also explain why monthly momentum still looks like it could turn down. It may never turn down, and instead start to turn back up. This should lead to an even larger rally, but only after more time stuck in a sideways trading range. This sideways-like behavior means we don’t get a true bear market, but a larger degree sideways correction before the ongoing bull market continues. Altcoins perform the best during Wave 3s, so this could also explain why we haven’t seen broad-based altcoin season and even give us an idea of when it might eventually arrive.
Subtle Strengthening
Rather than wonder how strong an asset is, we can use tools like the Relative Strength Index to visualize strength. Strength readings are all over the map in crypto, so at the very least, don’t expect a broad, all-encompassing crypto rally where everything does well to happen very soon.

Bitcoin is on the cusp of confirming a monthly RSI reading of above 70. This signal will confirm in 3 days if Bitcoin can stay above $107,000. I’ve highlighted past price action where Bitcoin is above 70 on the RSI to demonstrate how important this signal is.

As I have stated repeatedly in past issues, we absolutely cannot expect an altcoin season while the monthly RSI is above 70 on BTC.D. Bitcoin Dominance shows a rising RSI, which more than likely means that Bitcoin is going to steal the show a while longer. Even a close back below 70 on the monthly RSI might not mean Bitcoin’s dominance is done. We could get a higher high on BTC.D but a lower high on the RSI to form a bearish divergence before we see an altcoin season – if we see one at all.

Even more evidence can be found in Ethereum. As the top altcoin, it tends to act as a barometer of the overall health of altcoins broadly. Ethereum is currently being rejected from 50 on the monthly RSI. Above 70 is considered overbought, but also very strong buying. Below 30 is considered oversold, but also shows very strong selling. 50 is a sort of trigger for switches to bearish or bullish. Each bear market bottom happened below 50, but when it was time to resume being bullish, Ether made it back above 50 on the RSI. This current failure to get above 50 on the RSI could be telling us we are still bearish in ETHUSD.

TOTAL3, which takes out Bitcoin and Ethereum, shows a little healthier chart than ETH, but nowhere as healthy as BTC. The RSI is pointed down currently after two failed attempts to get above 70 on the monthly RSI. If a lower low is made on the RSI, it could send the indicator below 50, which would put all altcoins in a similar dangerous position as Ethereum.

XRP is another top coin that was recently very bullish, but is starting to lose a little bit of its momentum. Another sharp move up is possible, so be ready for anything. A lower low on the RSI could send XRP to test below $2, while moving back above 70 likely causes the final thrust up to complete the short and sweet bull market in XRP. The last move up in 2017 didn’t happen until the RSI touched the RSI-based Moving Average. The monthly RSI is currently at 63.97, while the Moving Average is at 61.78. This isn’t too far away from one another, but it will either take a couple more months, or XRP must drop lower in price to bring the RSI down to the Moving Average level. At that point we could see the rally. Or once again, this time might just be different and things don’t pan out like 2017 at all.

Ethereum trading against BTC is showing hints at a possible recovery. However, it could take a while longer, and we’ll know more after this monthly close. The monthly RSI is at 30.28, so it is currently above oversold levels after falling below months prior. If the monthly RSI closes and confirms back below 30 before the month is over, it means it didn’t fully get back out of oversold conditions and is at risk of continued selloff. Even if the RSI makes it back above 30, there is always a scenario where price makes a lower low, but the RSI makes a higher low. This would be a bullish divergence, and a positive development. But it only comes after more pain for ETH holders.
Subscribe to view all remaining premium content, including:
Updated Bitcoin weekly technicals show bulls building strength. Will we finally see a strong breakout into a sustained uptrend?
Gold could be topping out. Why this could lead to a risk-on environment
COIN shares make a higher high since last issue. Now all eyes are on all-time highs and a move into price discovery
The S&P 500 makes a new all-time high. Is this yet another risk-on signal?
Bitcoin’s unbreakable “forever” resistance line remains unbroken. Don’t miss it
Keep reading with a 7-day free trial
Subscribe to CoinChartist to keep reading this post and get 7 days of free access to the full post archives.