

We're So Back?
Bitcoin revisits mid-$90Ks – is the bull run back on? Or is this a dead cat bounce?

Disclaimer: The information provided in this Substack newsletter is for general informational purposes only and should not be considered as financial advice. Investing involves risk, and past performance is not indicative of future results. Please conduct your own research or consult a financial advisor before making any investment decisions. The newsletter disclaims any liability for losses or damages arising from the use of this information.
We're So Back? overview:
Bitcoin breaks out from downtrend resistance – does this mean “we’re so back?”
New short-term Elliott Wave counts: new all-time high, new local lows both possible
Candlestick analysis: bulls give bears a wakeup call with a Morning Star pattern
A look at Bitcoin’s momentum moving into May
Comparing Bitcoin’s Relative Strength Index across a variety of timeframes
Updated analysis concludes: continue to avoid altcoins for now
At this current moment, Bitcoin put in a local top on Trump’s Inauguration Day. For now, we don’t yet know if this was the pico cyclical top, or just a short-term top that is eventually exceeded. The truth is, no one will know which scenario was correct until long in hindsight.
Bulls have started to show a recovery from local lows, but have yet to revisit all-time highs set earlier in 2025. The recovery has started to undo several high timeframe bearish signals that were crucial to a bear market materializing.
However, bulls aren’t out of the danger zone and need to close April at current levels and follow through in May to new all-time highs. If not, the bearish thesis stands and we should be anticipating a change in trend that’s more apparent in nature.
Because TA isn’t as clear as it has been in recent months, this issue will provide several bearish and bullish takes, to allow you to potentially anticipate the market – whichever way it decides to move.
Downtrend Breakout
Bitcoin has broken out from downtrend resistance drawn from the former all-time high. Does this mean we’re so back?
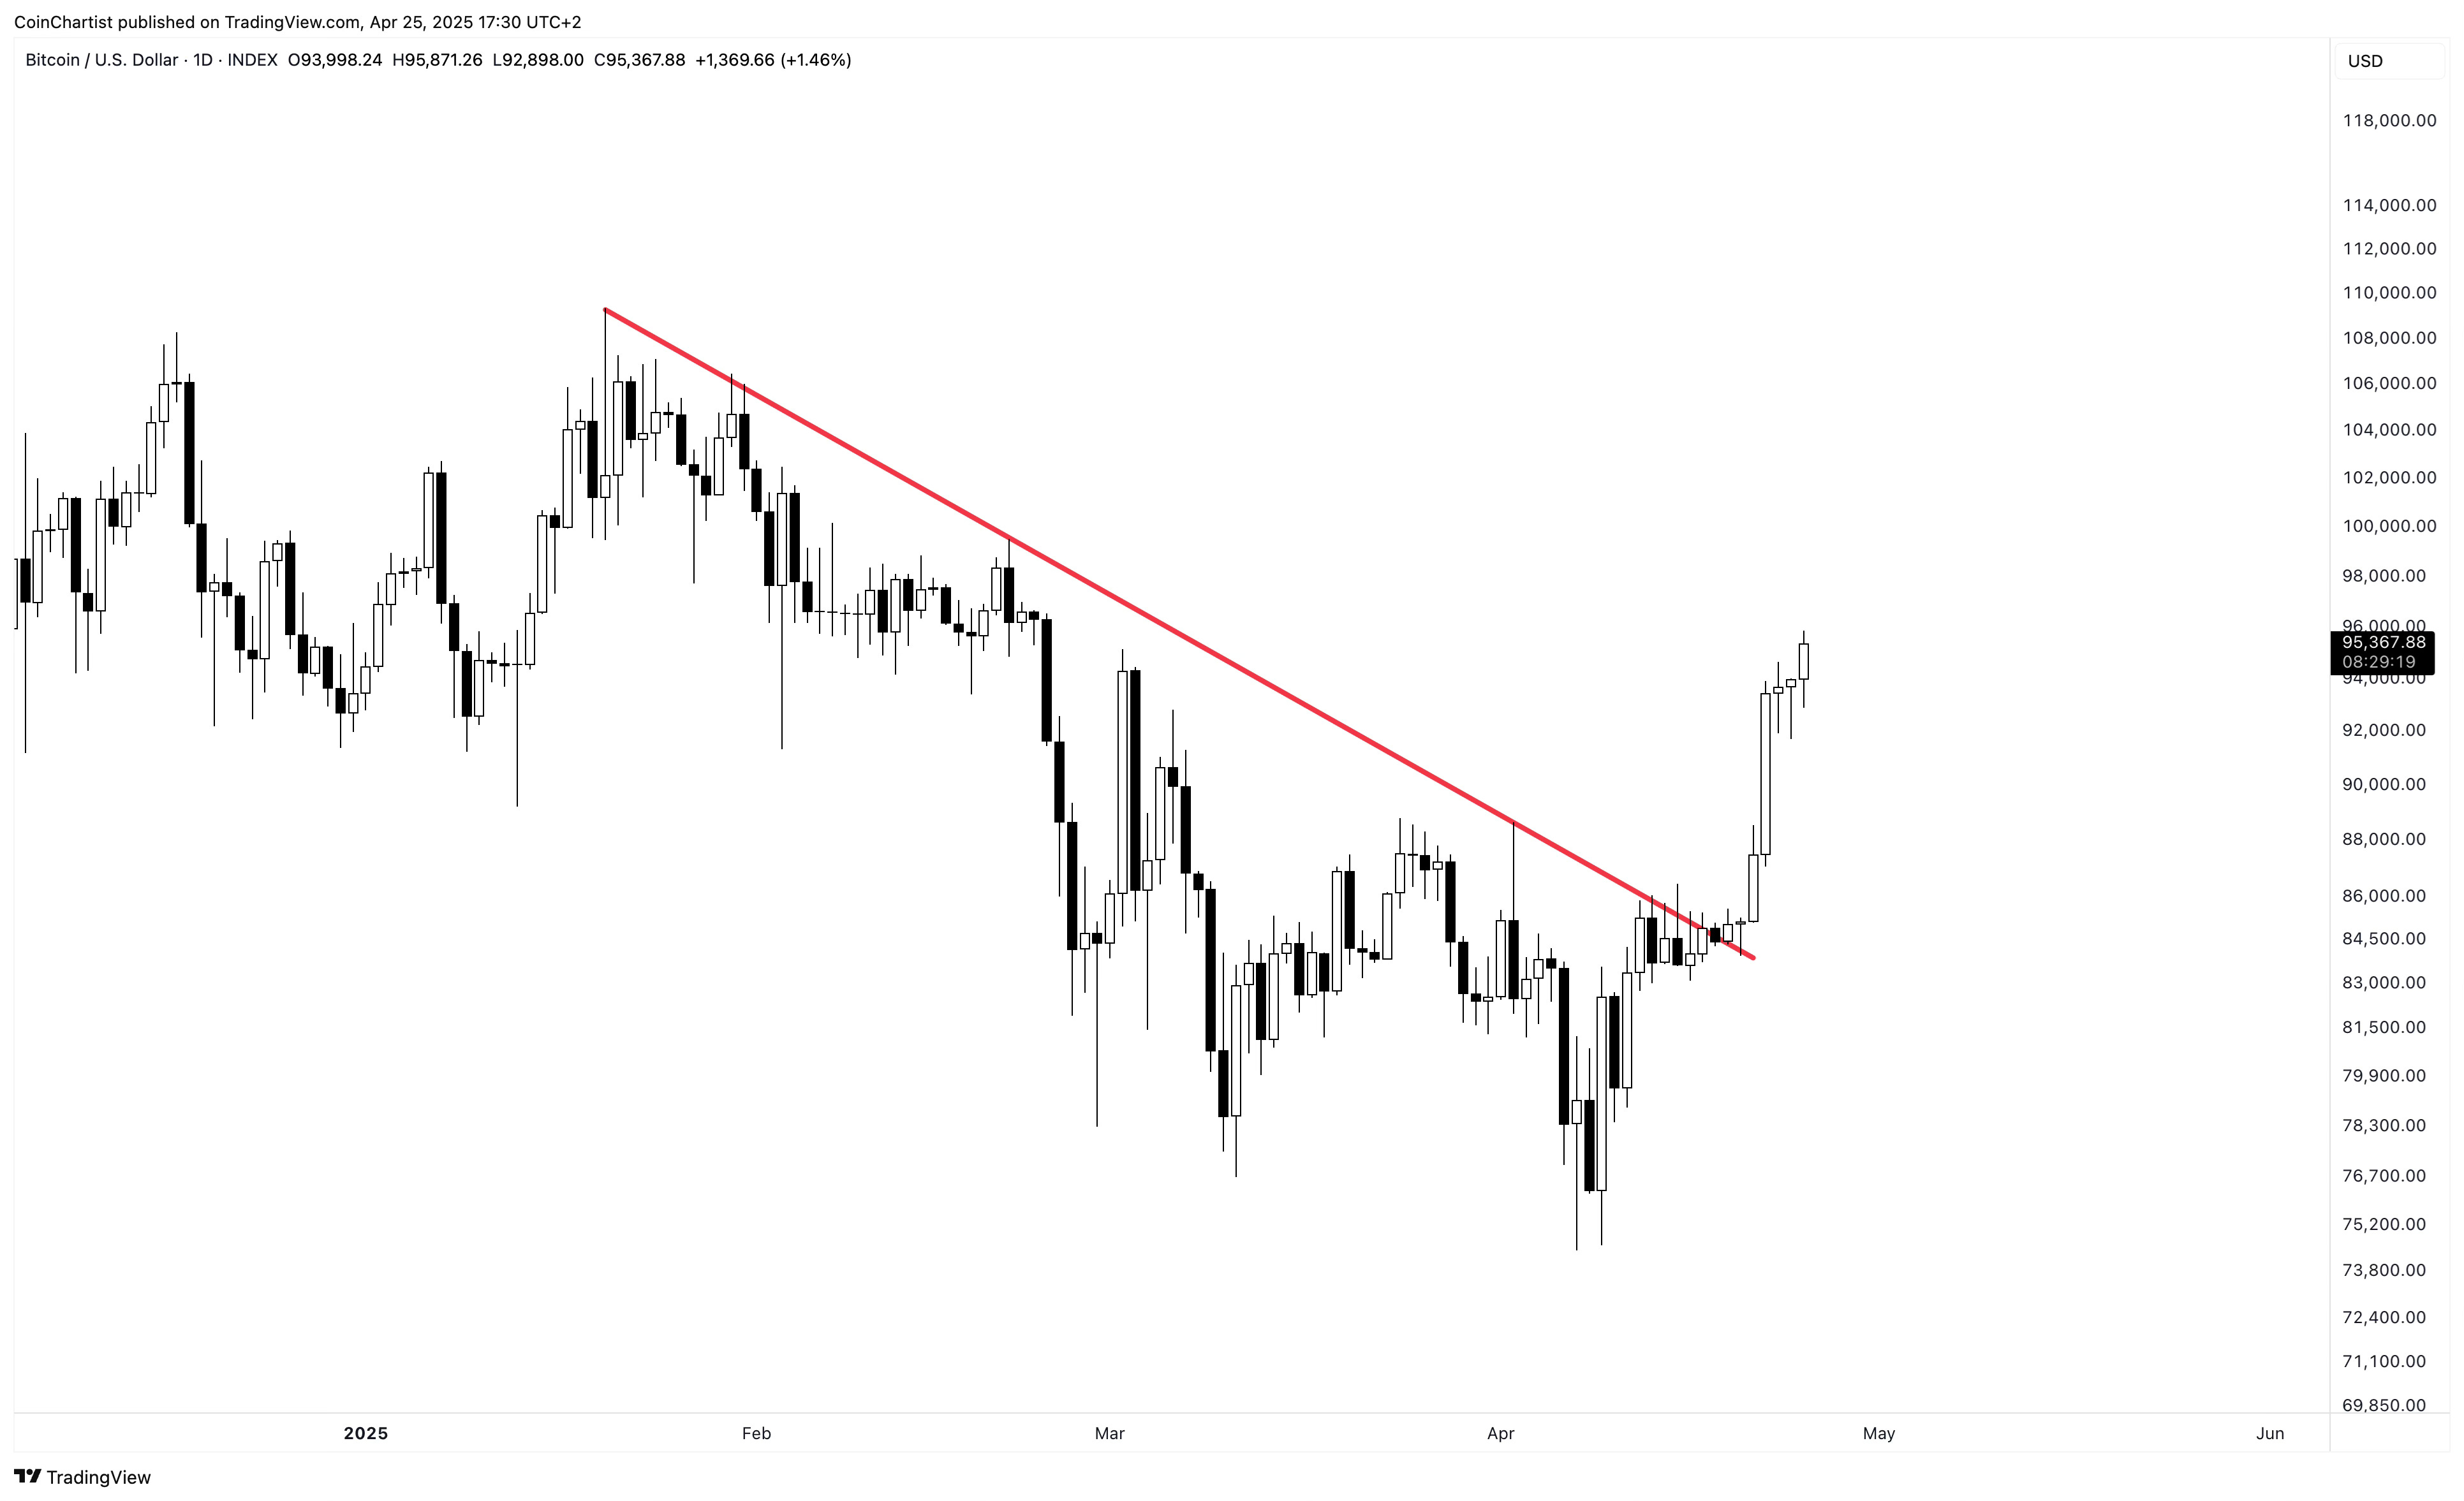
The breakout from downtrend resistance was enough to propel Bitcoin $15,000 higher in just a matter of a few days. This strength was impossible to ignore. Bullish analysts were quick to point this out as a sign Bitcoin was back on the upswing, and they were right. Unfortunately, diagonal trend lines aren’t always what they seem to be, and downtrend breakouts are often deceiving.
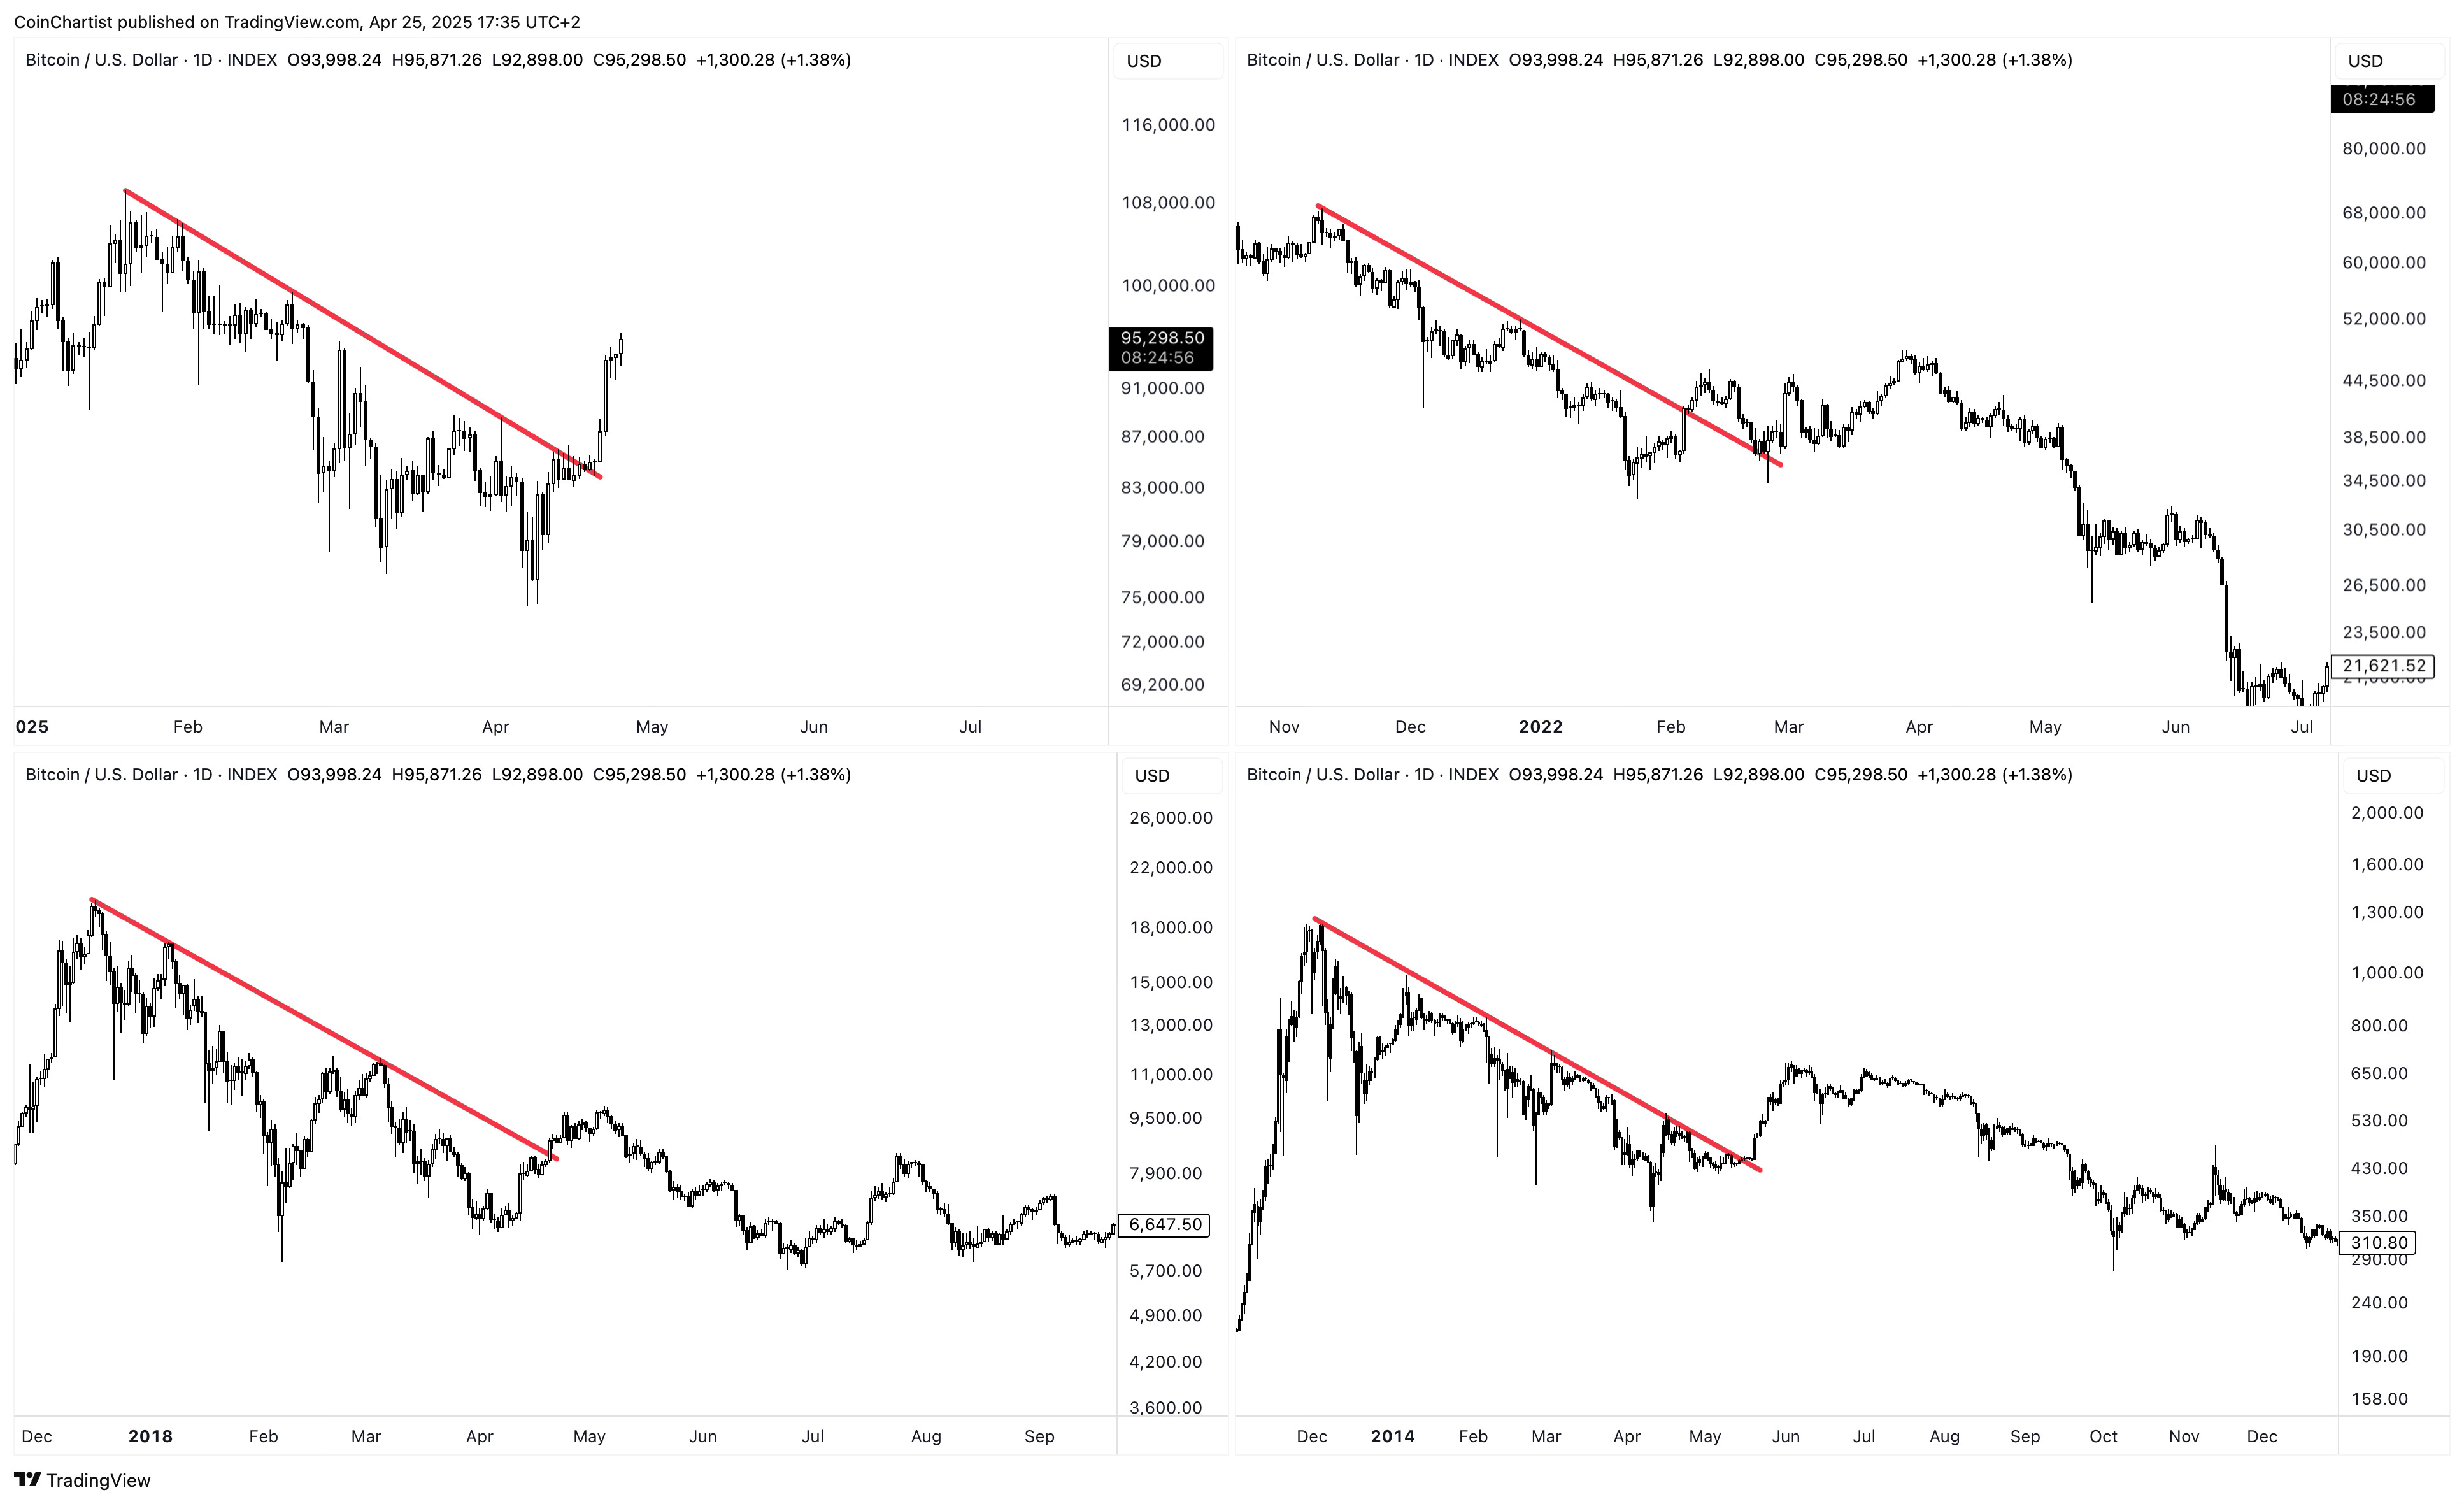
In fact, all bear markets provide a strong bounce that breaks through a downtrend resistance line, only to fall right back through it eventually – with a decline to dramatic new lows to follow.
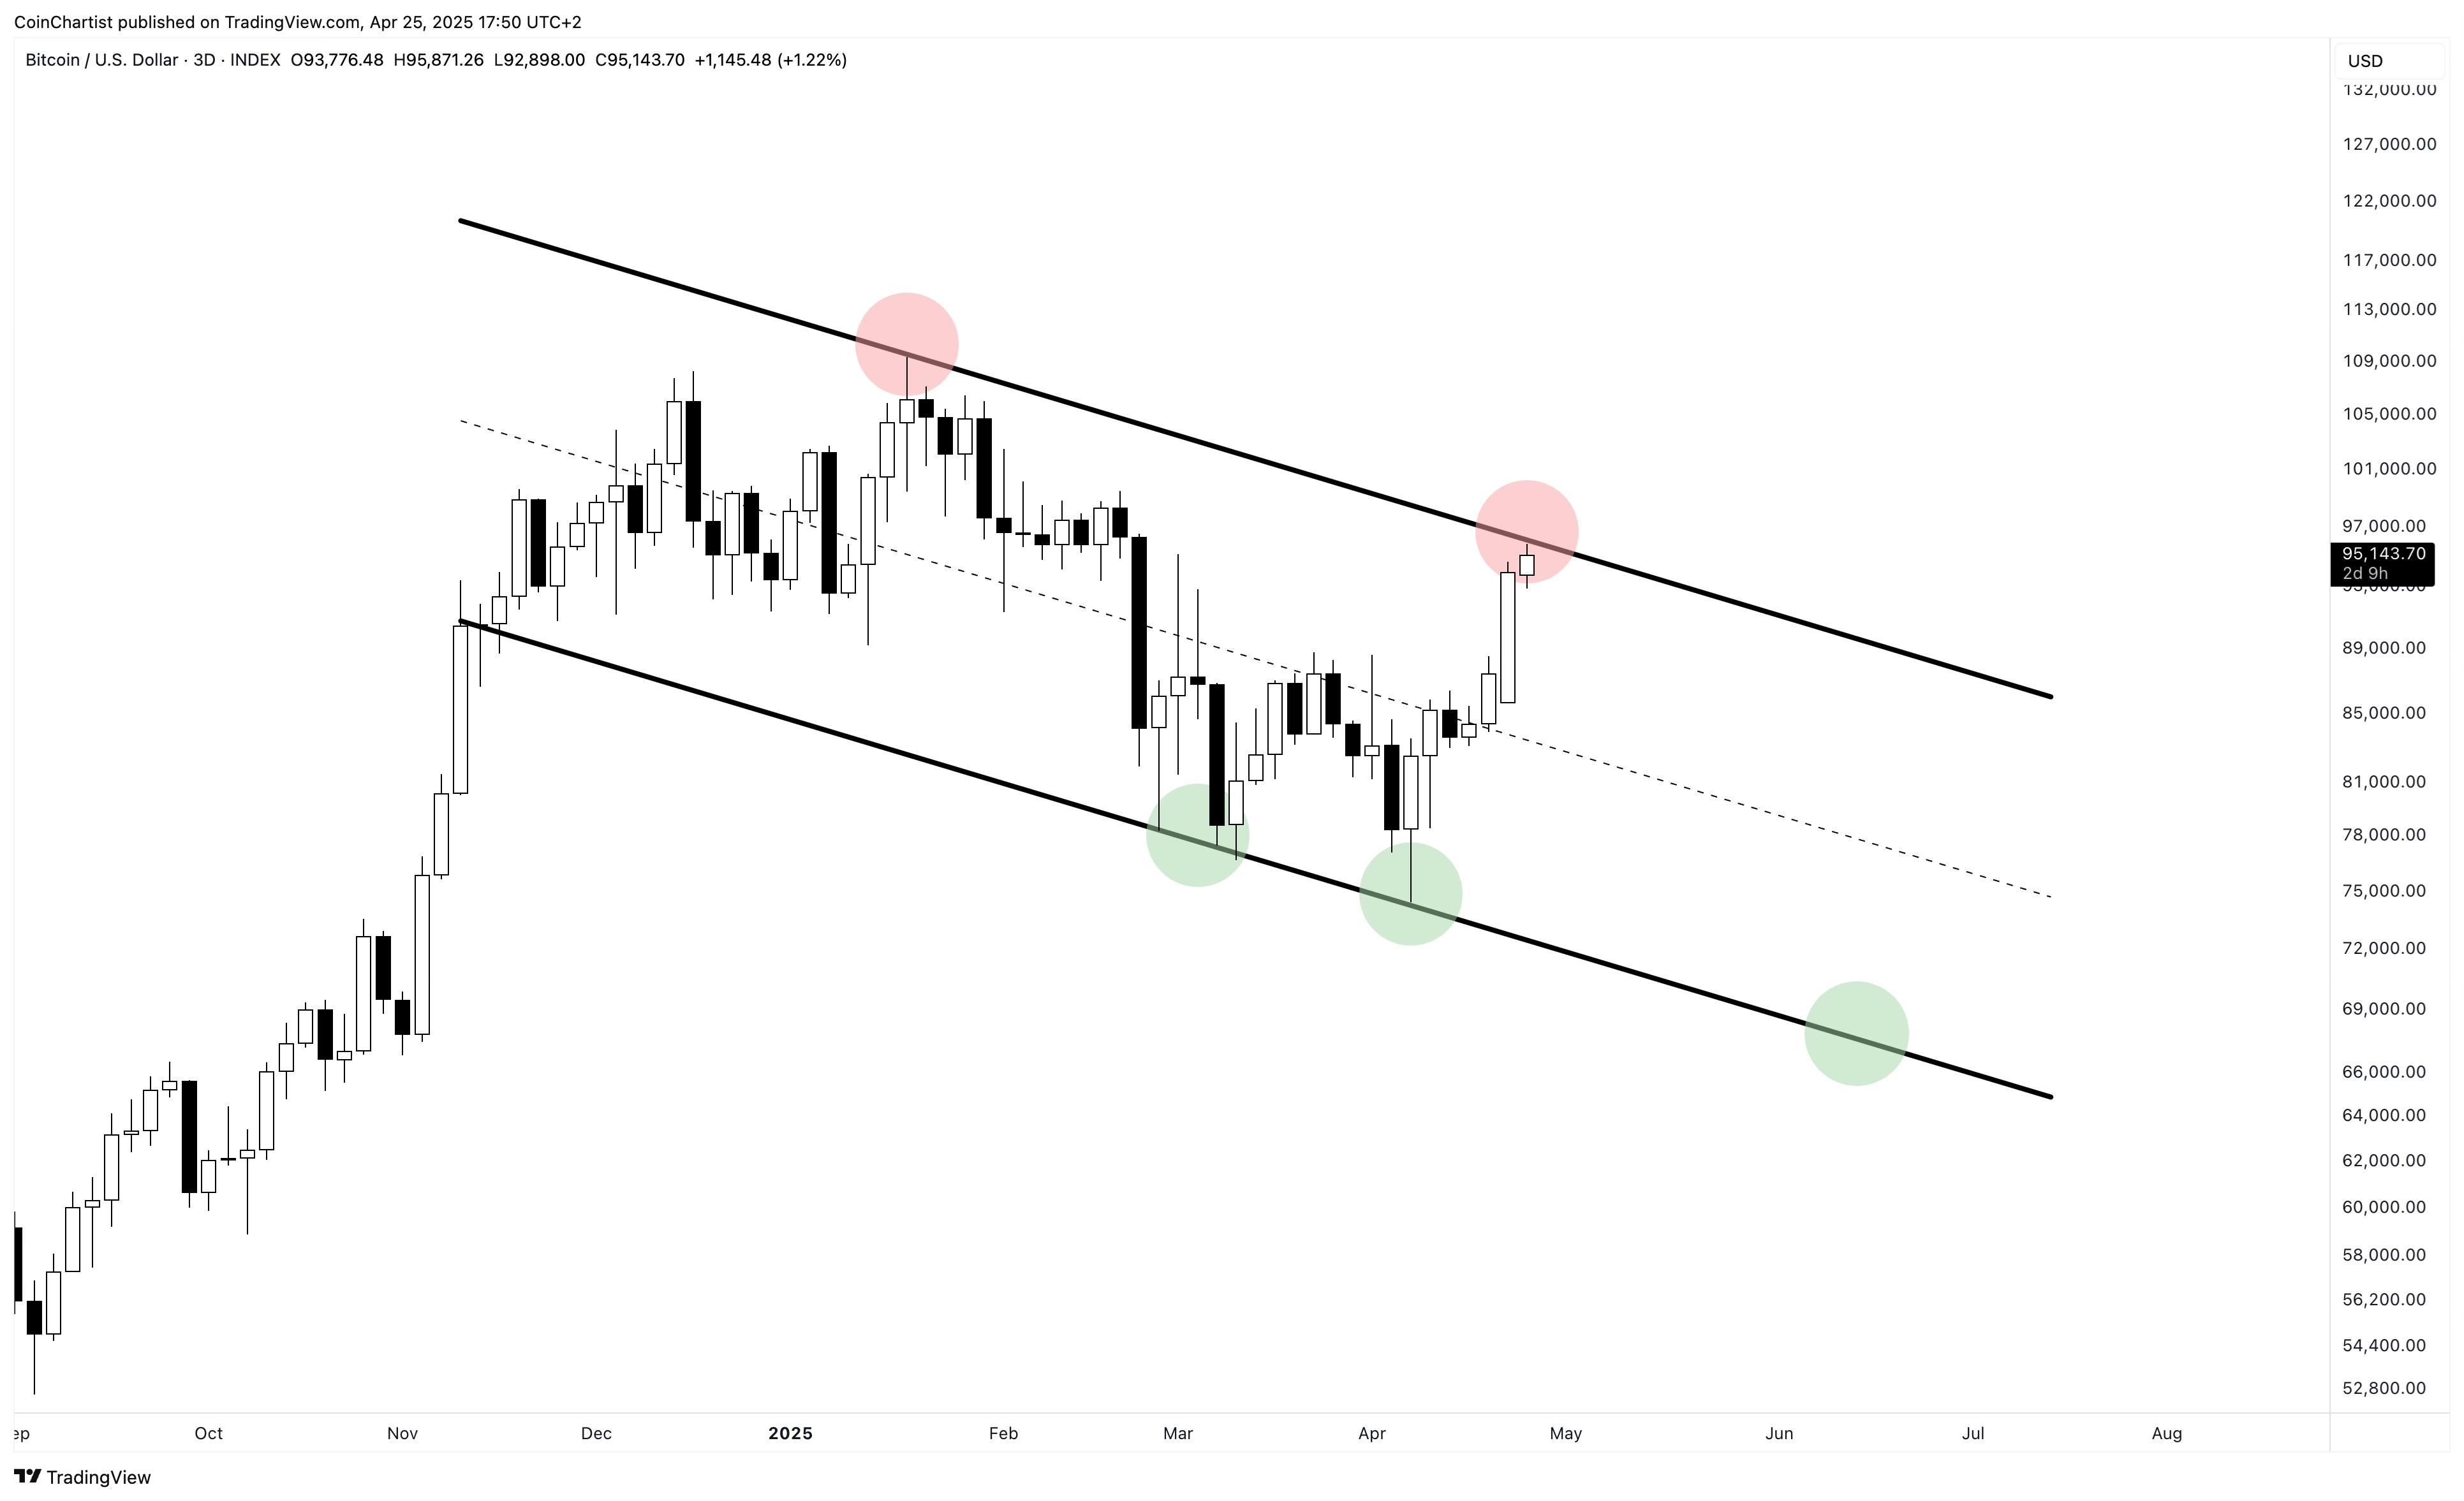
Failure at the current high could point to the second touch of the upper boundary of a downtrend channel that’s being established. With two touches on the lower boundary already, price could reject down for a third touch of the lower boundary.
Wave Hi To New Highs?
Bitcoin is back in the mid-$90Ks and appears to have strength on its side. The market has shaken off tariff fears and is melting back up, so it seems.
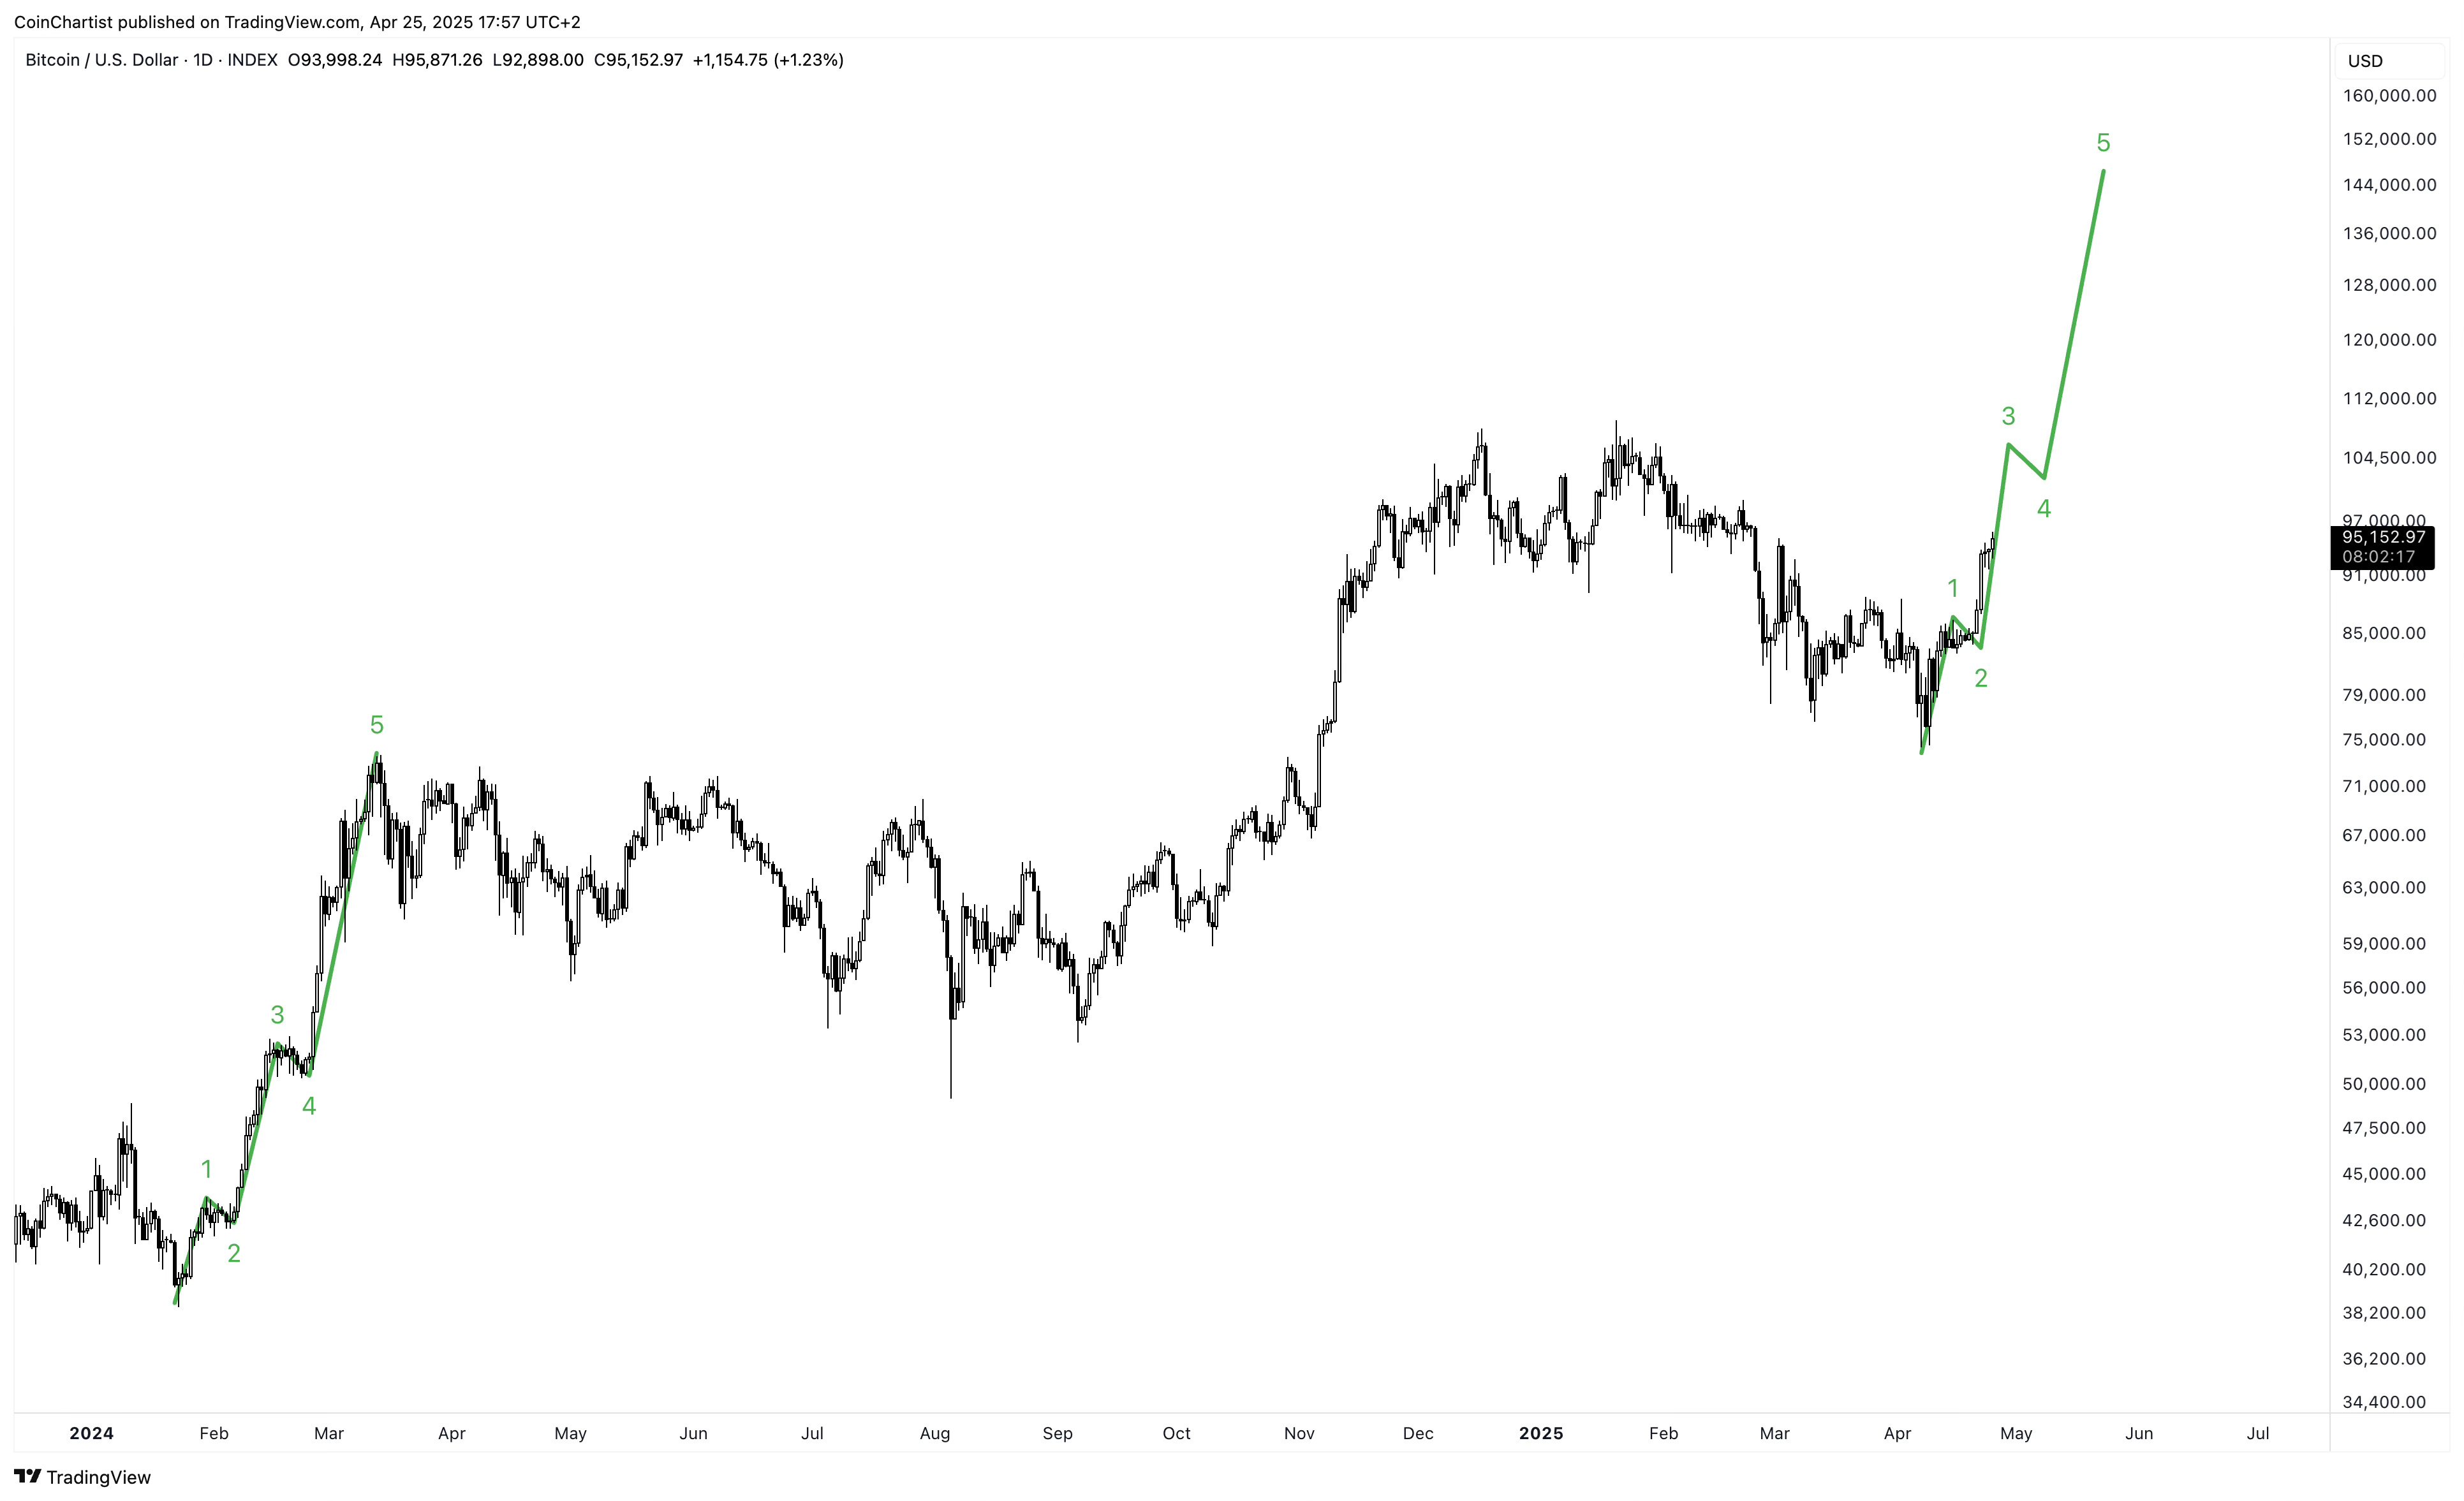
If this is the beginning of a bullish impulse, it should closely mimic the wave up from early 2024. That would put BTCUSD in the midst of its minor degree wave 3, which tends to be long and strong.
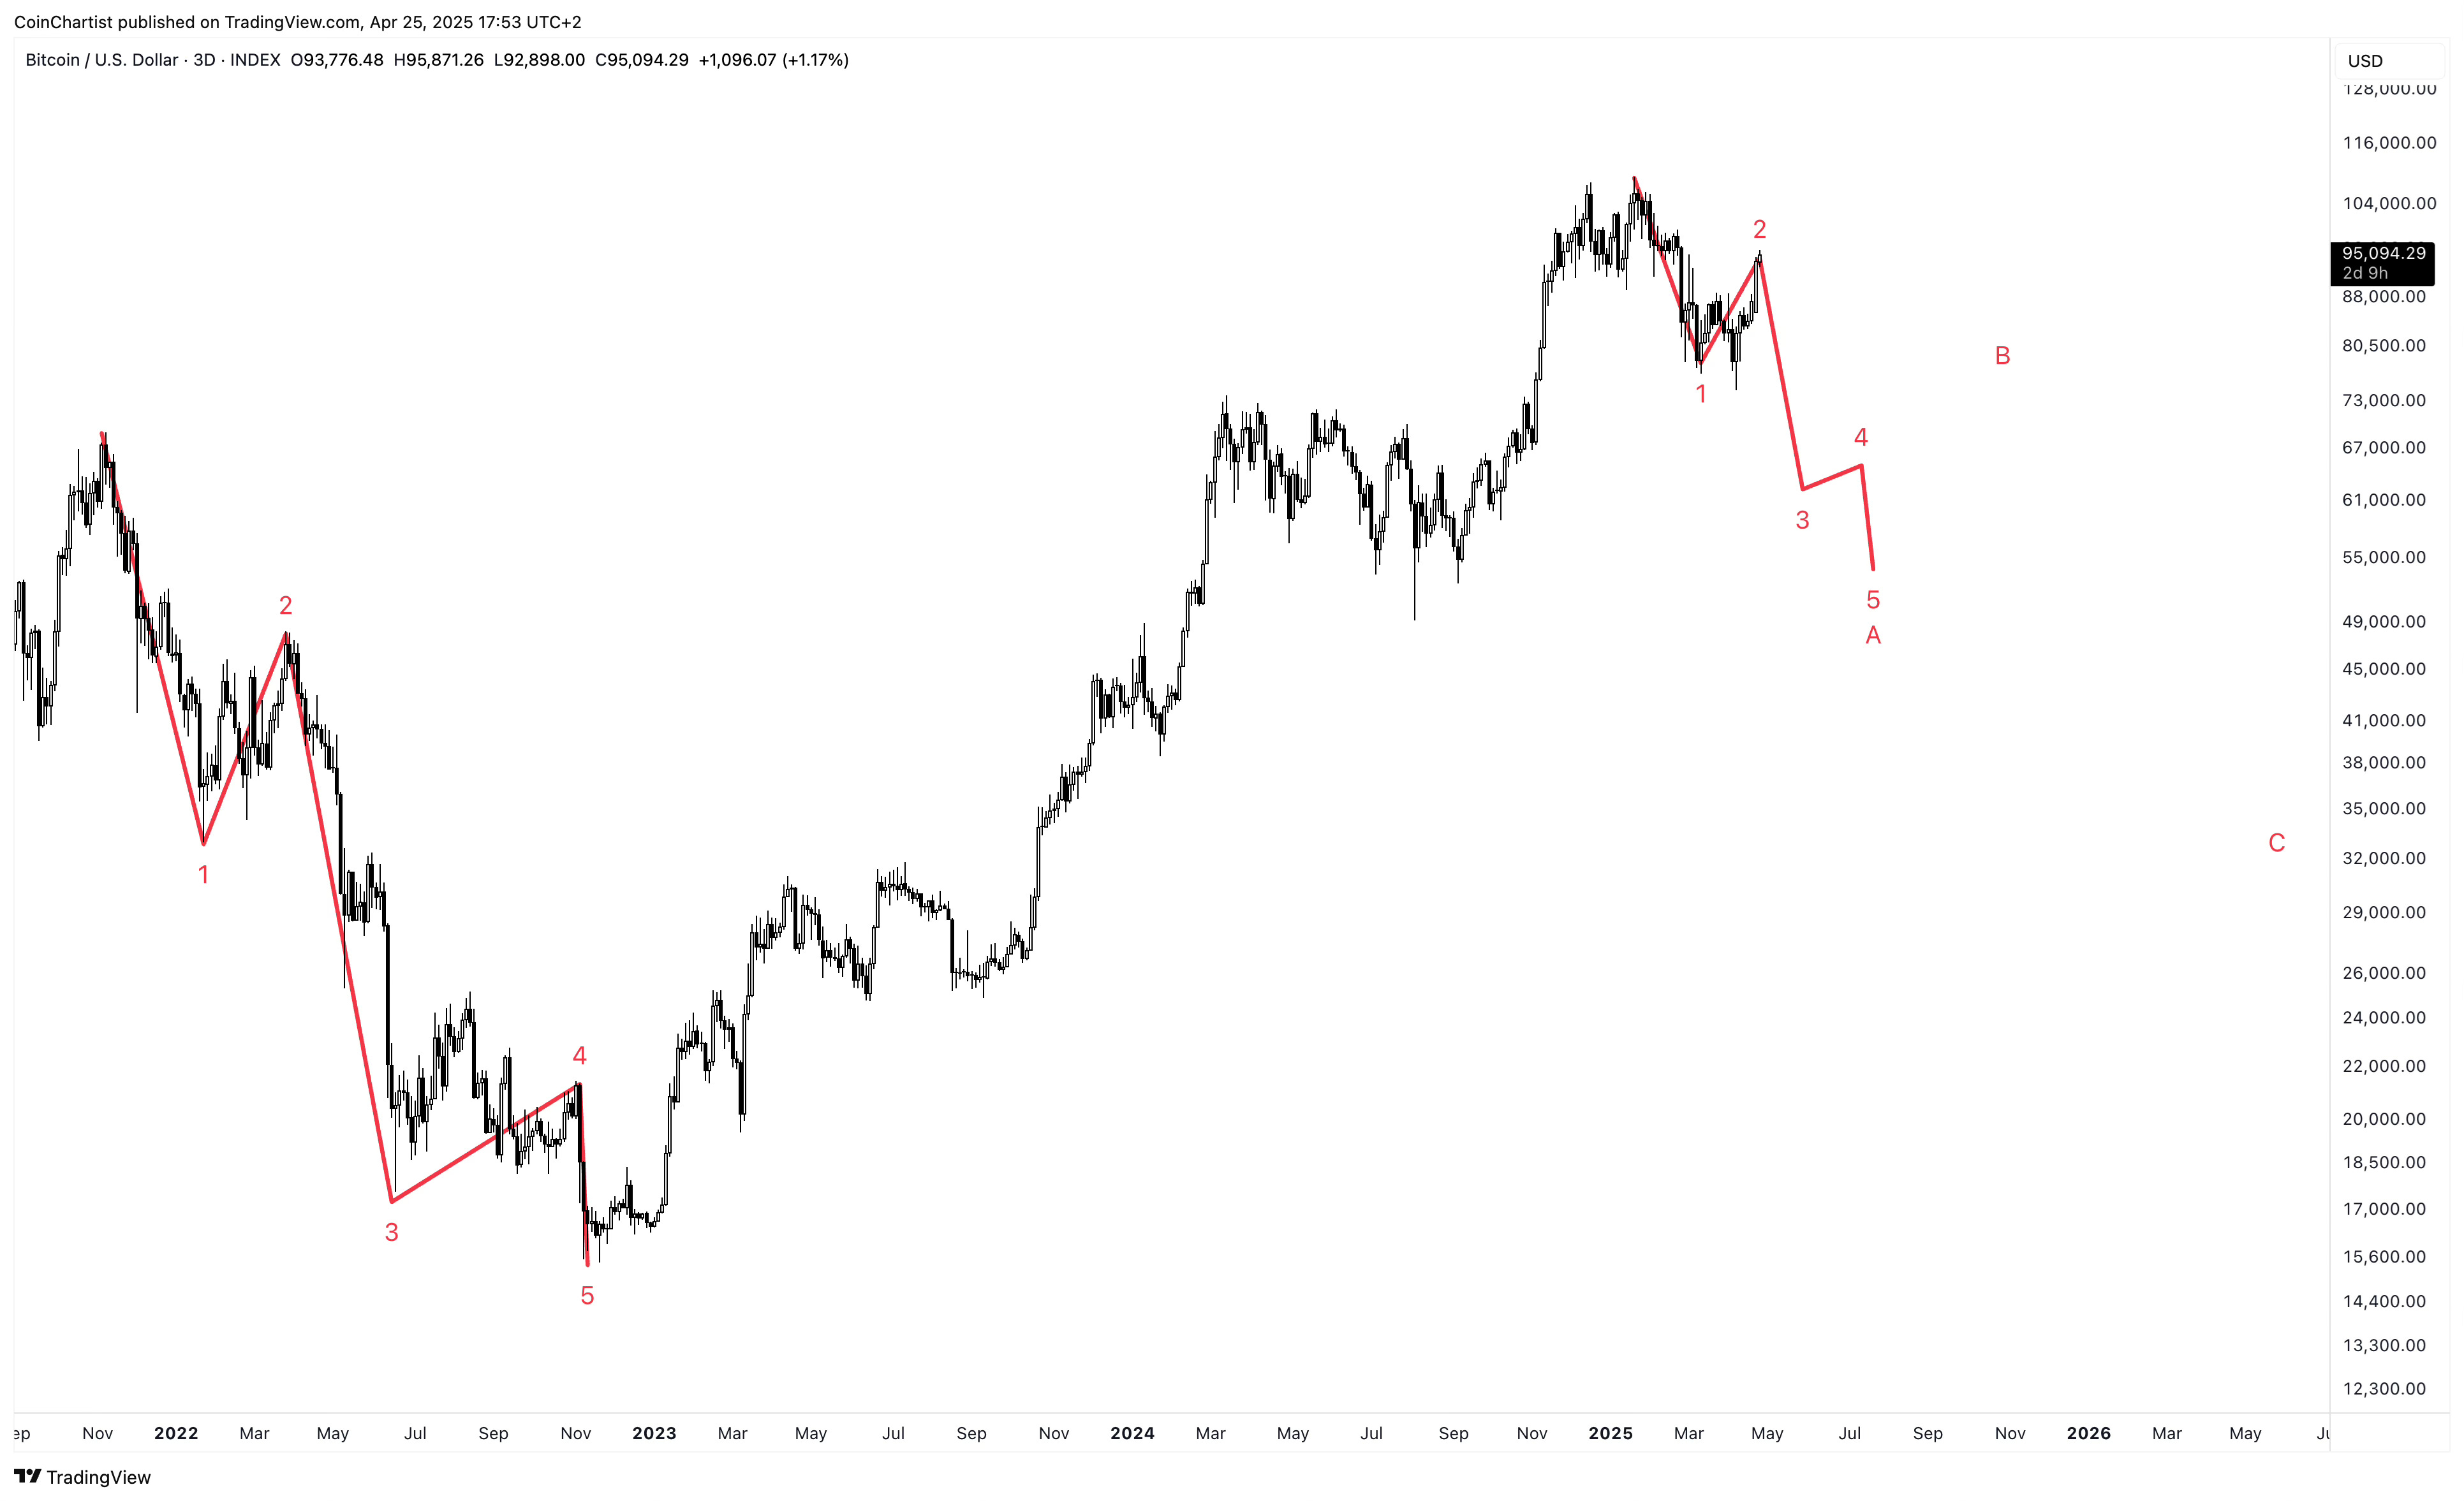
On the flip side, failure here in Bitcoin could mean it is starting a wave 3 impulse to the downside instead. This would be a violent impulse wave down towards mid-$50K levels.
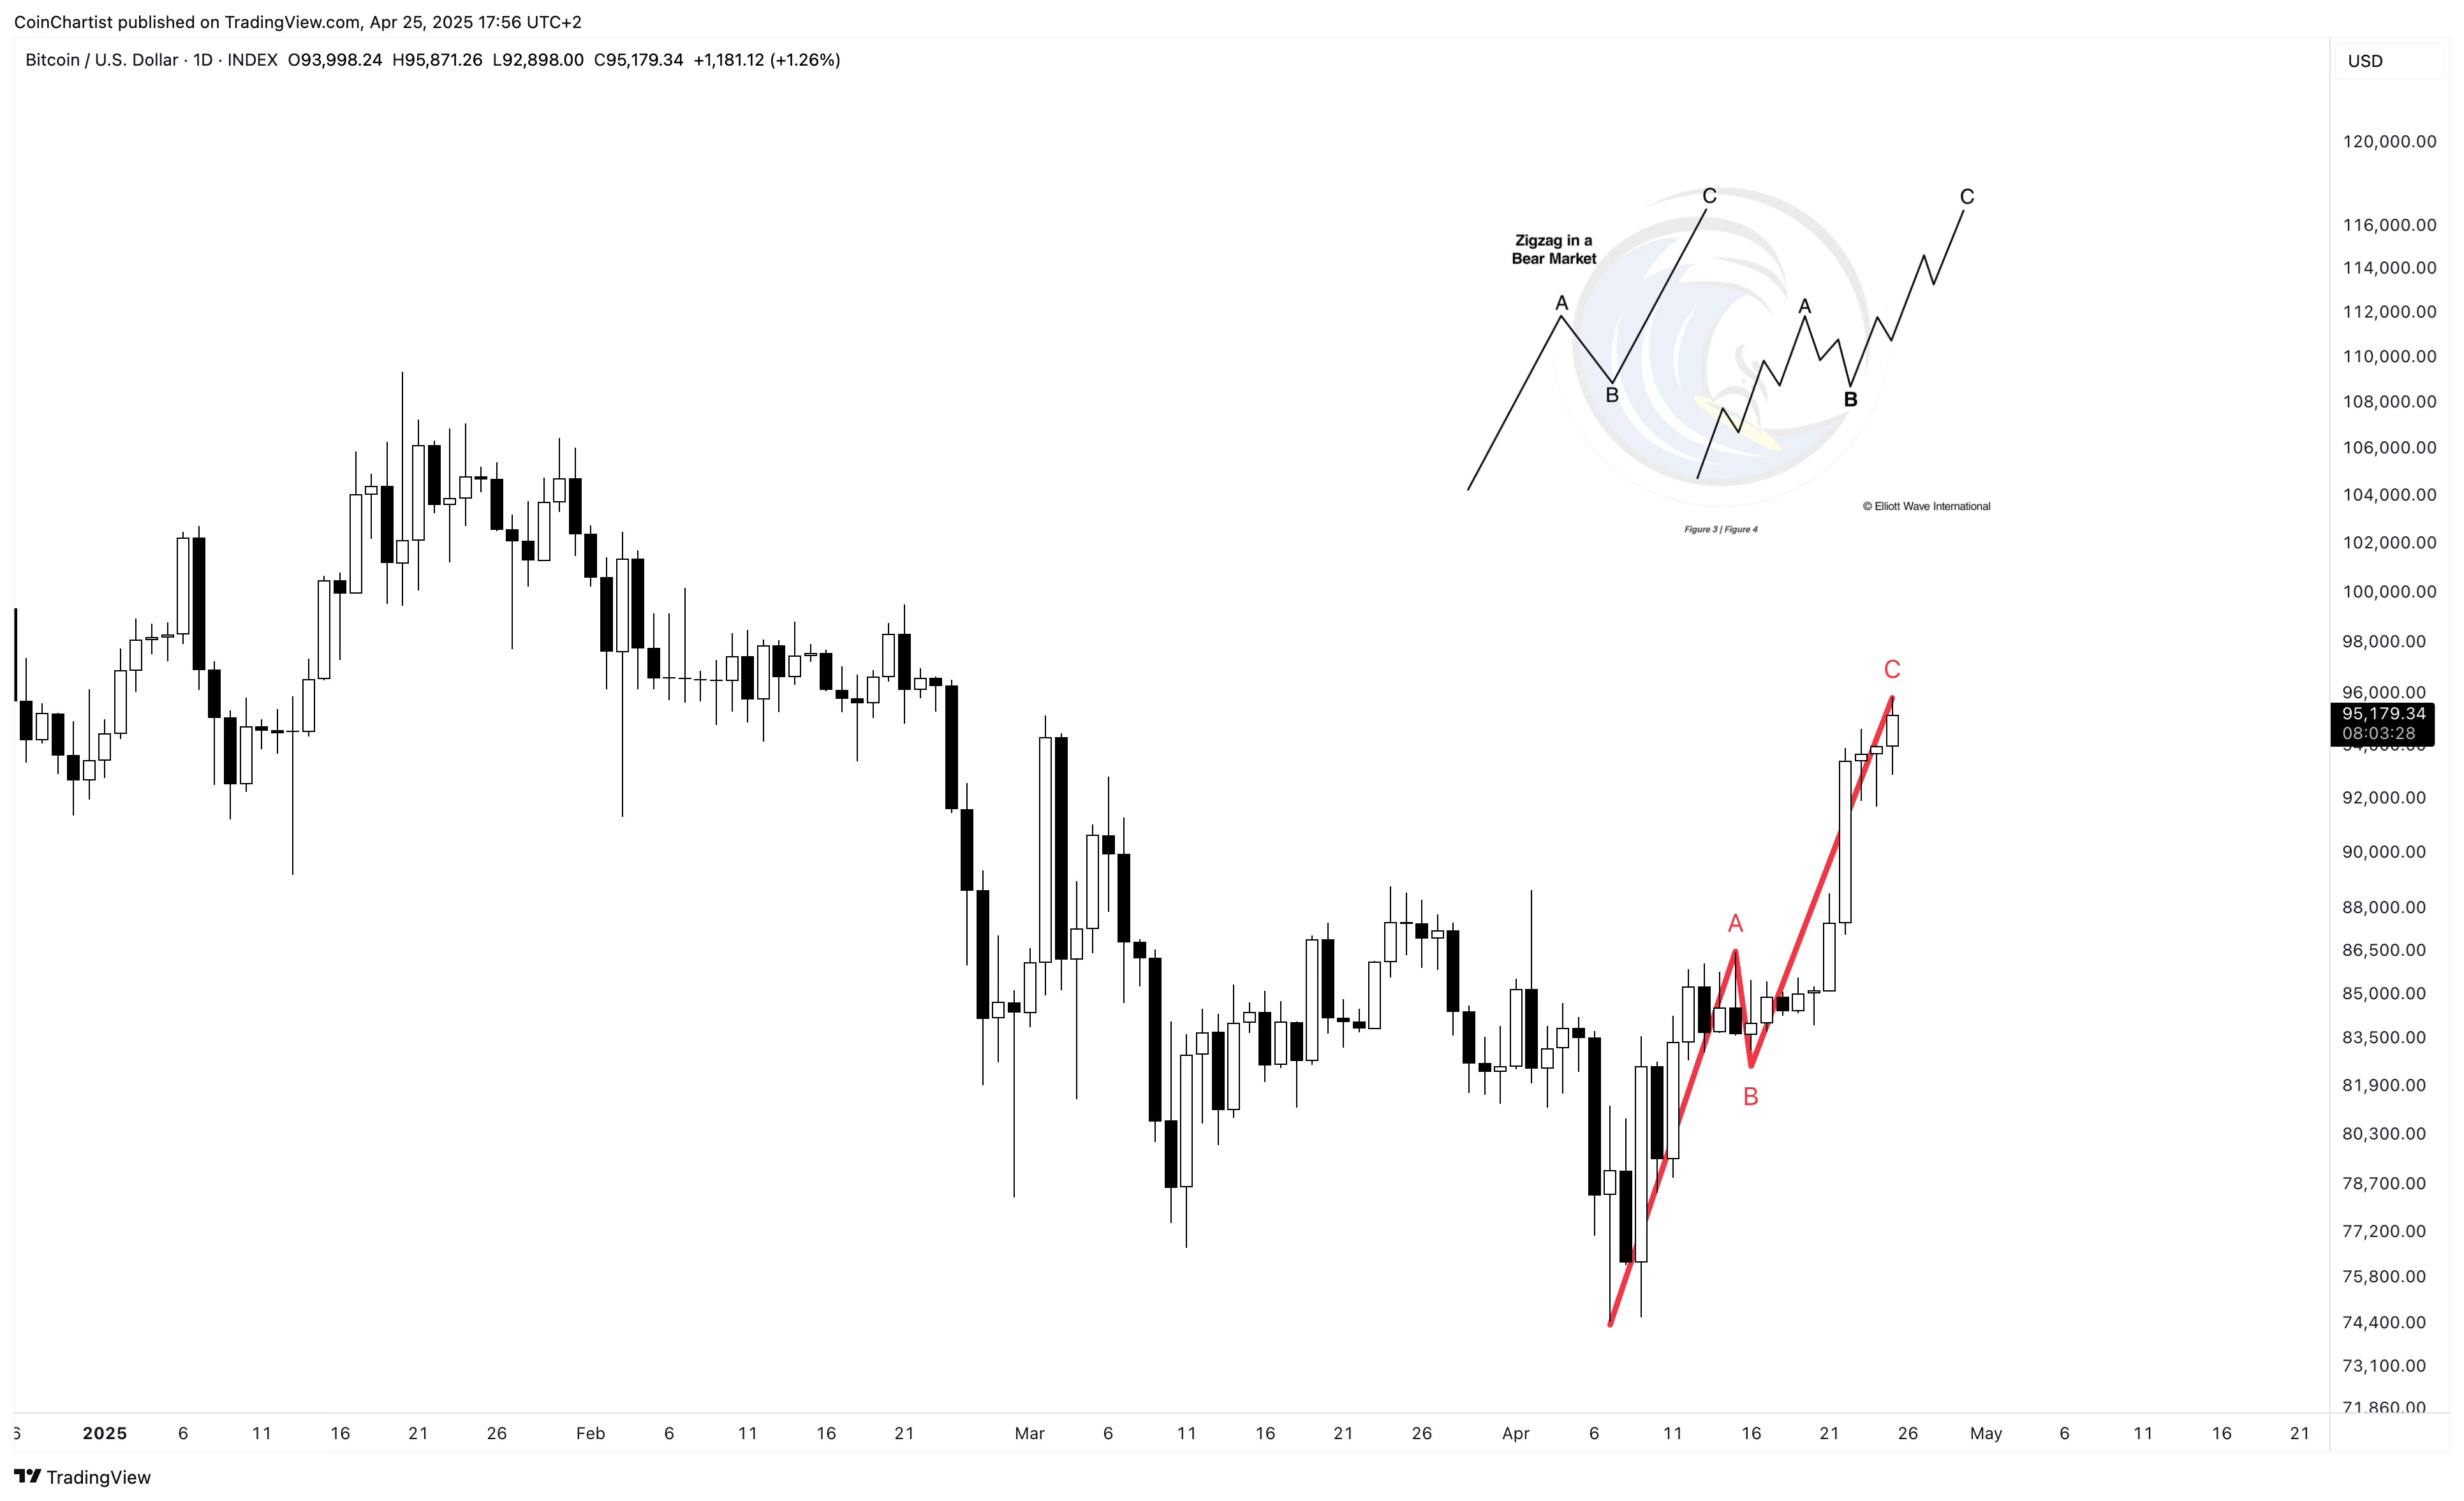
If BTCUSD isn’t working on a bullish five-wave impulse up, and instead is finishing a bearish wave 2, the correction could be taking the form of an ABC zig-zag, which is common for a wave 2.
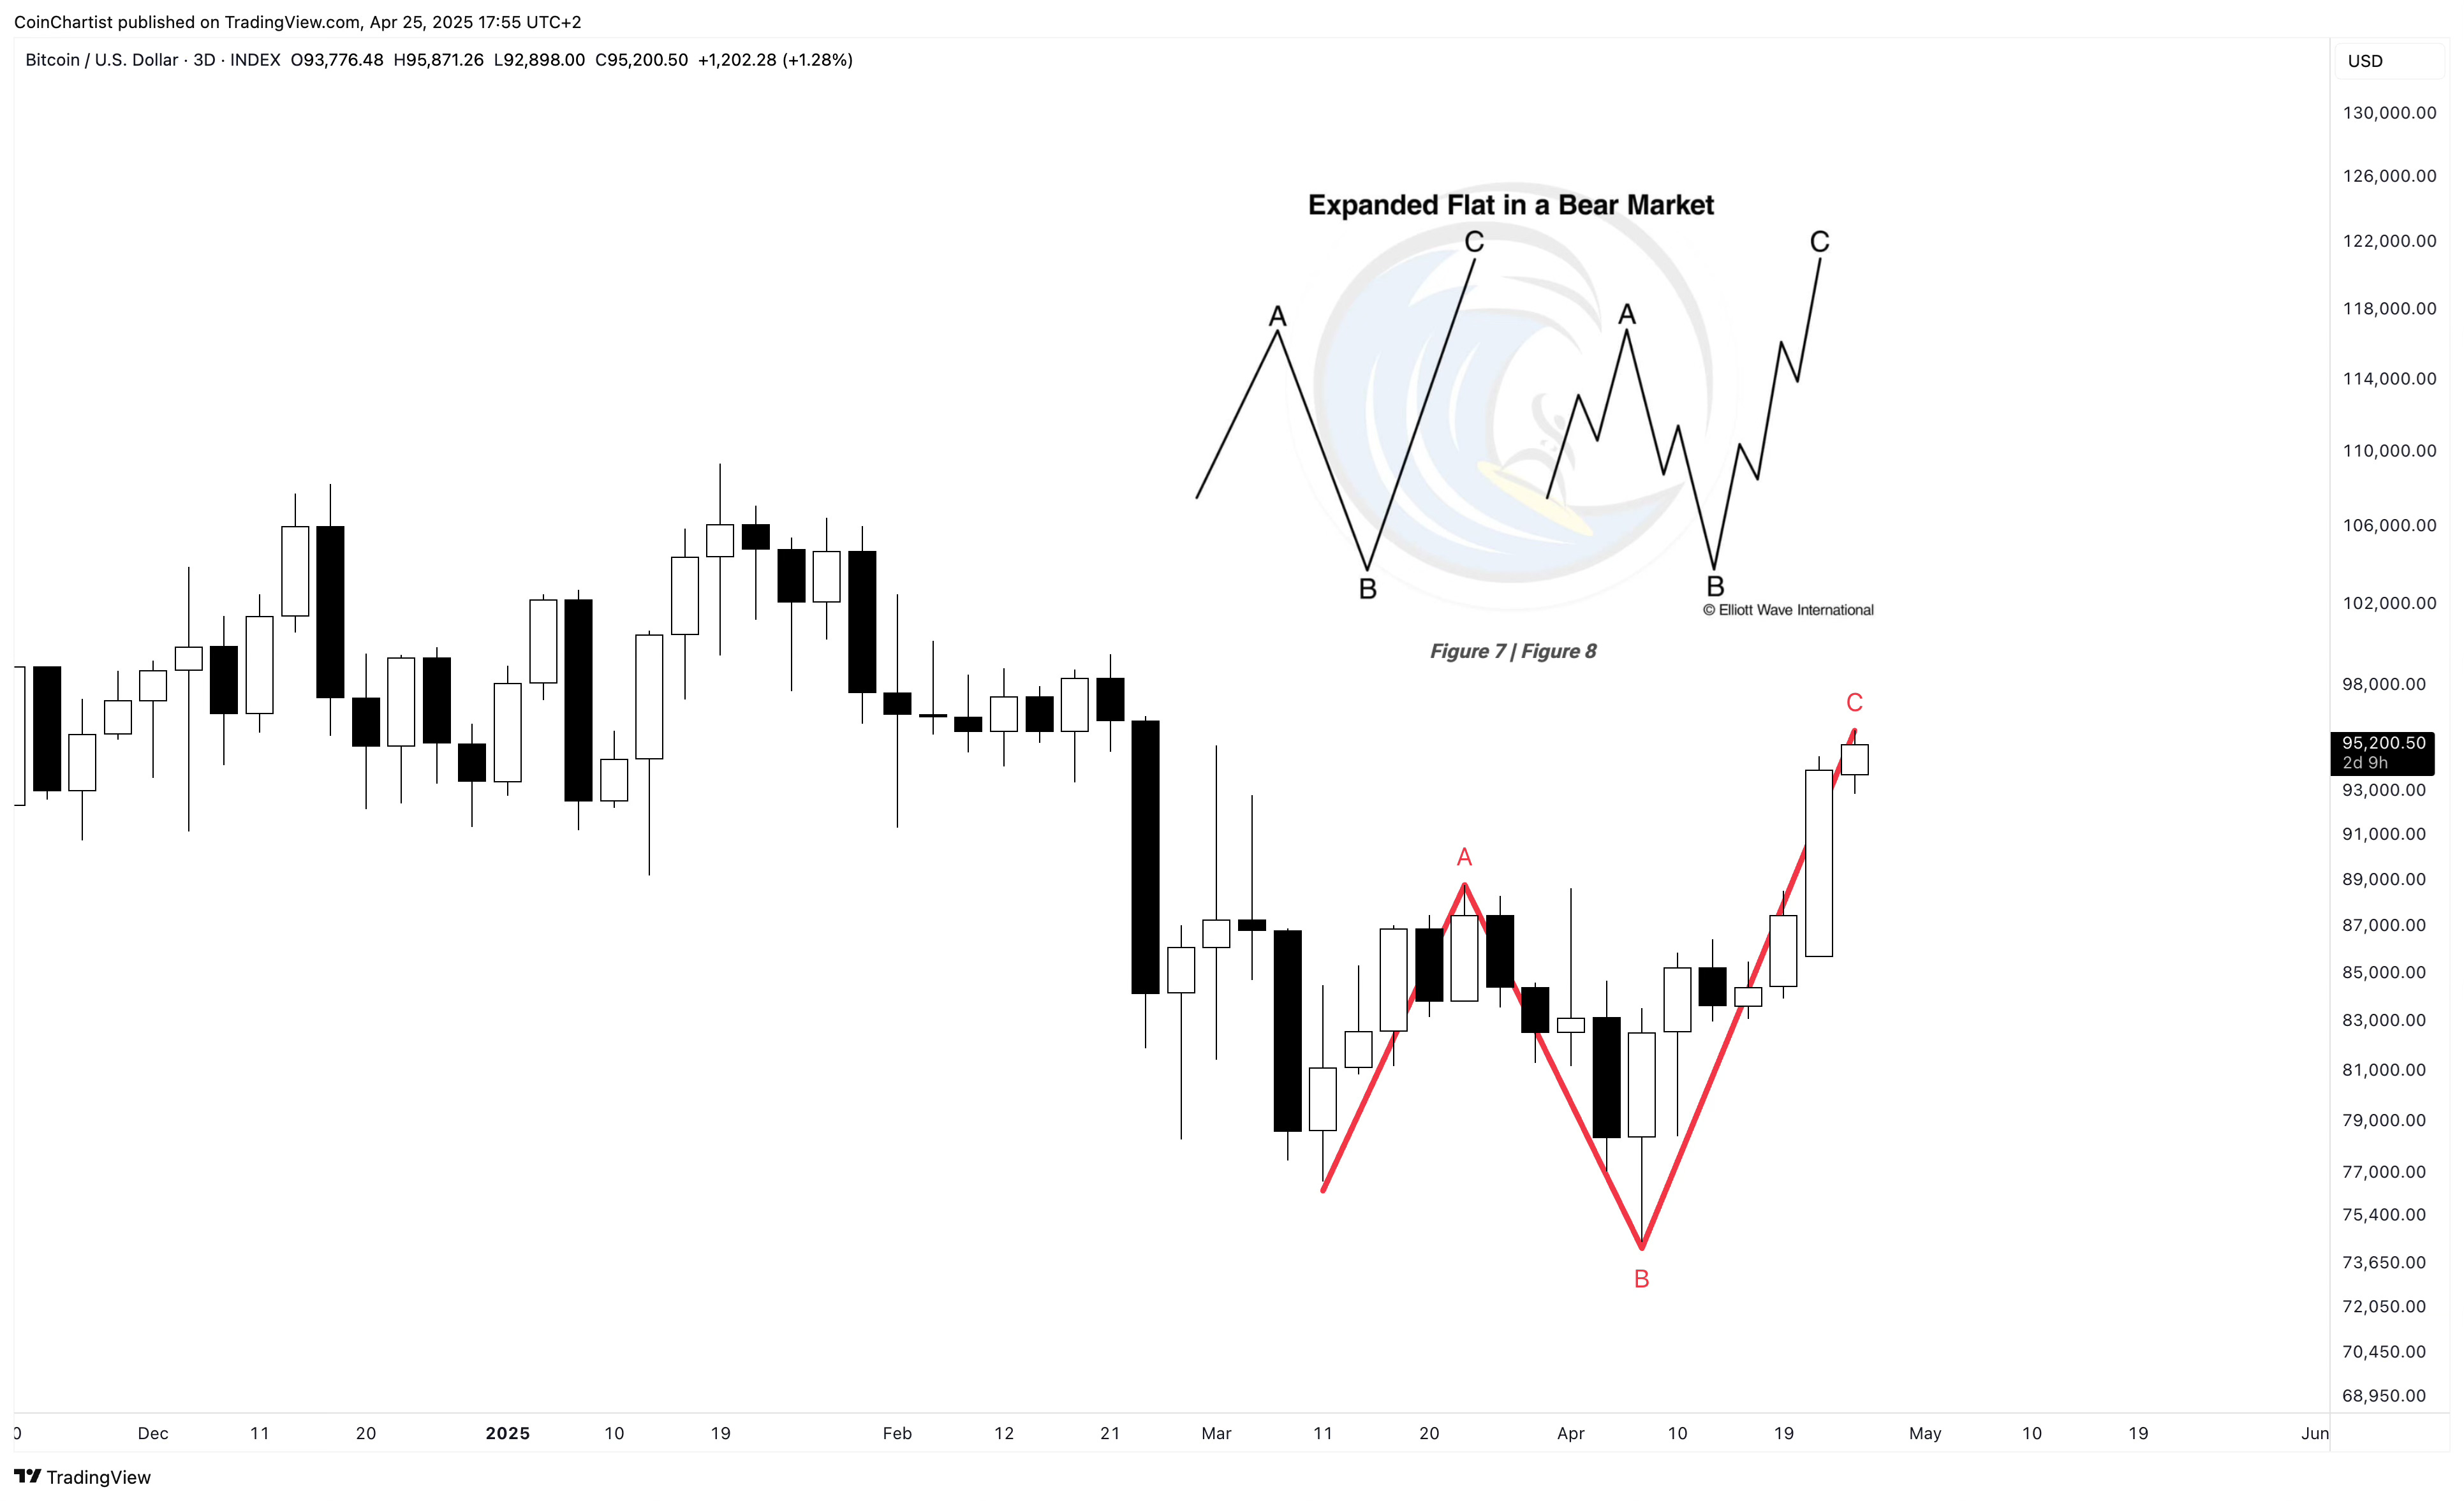
Less common for a wave 2, are flat corrections. However, this count could potentially fit, where Bitcoin just completed its C-wave in an expanded flat. Either way, the two corrective patterns suggest new lows if Bitcoin doesn’t stay impulsive and sub-divide into five waves up.
Good Morning, Bulls
Last issue, I pointed out that Bitcoin could still form a bullish Morning Star pattern and begin to turn the trend back to bullish.
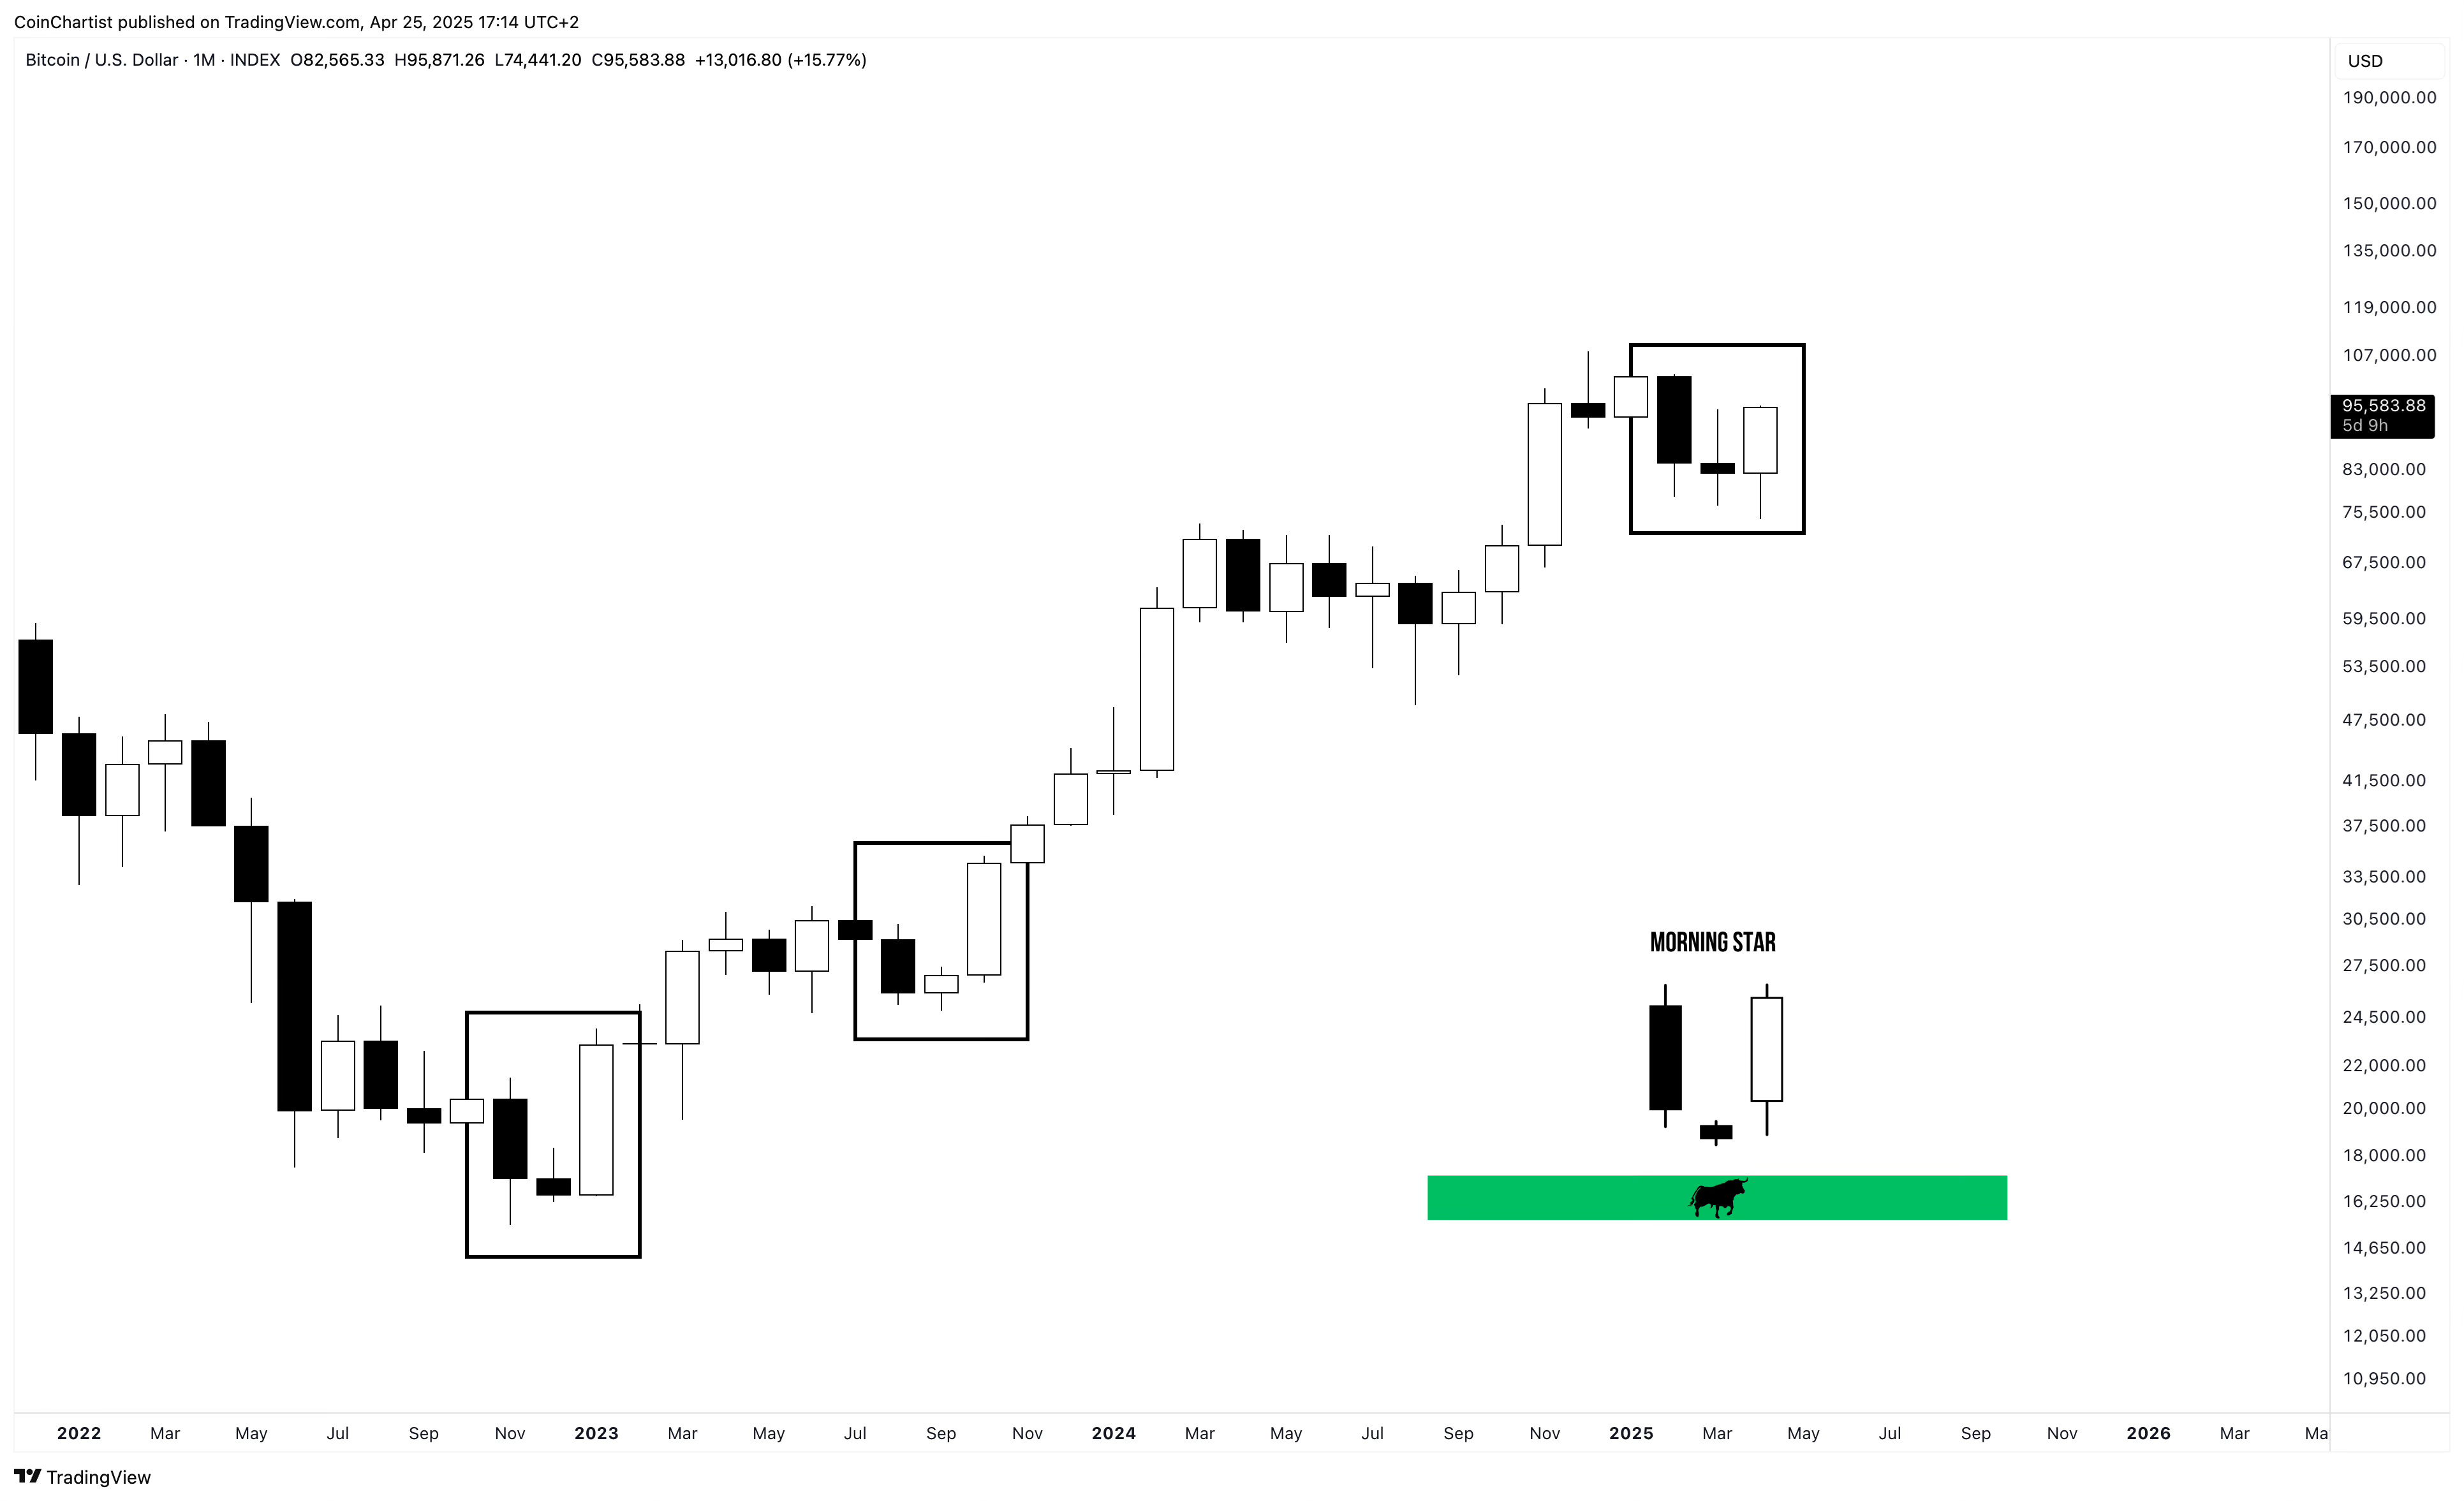
And that’s exactly what Bitcoin is trying to do currently. A Morning Star pattern starts with bears in full control, leading to a large black candlestick down. Then there is a pause from indecision, before bulls resume control with a large white candlestick upward.
Keep reading with a 7-day free trial
Subscribe to CoinChartist to keep reading this post and get 7 days of free access to the full post archives.