


Winter is Coming
If the market doesn’t bounce by end of Feb, crypto winter could be beginning.
Disclaimer: The information provided in this Substack newsletter is for general informational purposes only and should not be considered as financial advice. Investing involves risk, and past performance is not indicative of future results. Please conduct your own research or consult a financial advisor before making any investment decisions. The newsletter disclaims any liability for losses or damages arising from the use of this information.
Winter is Coming overview:
An extended look at how bad Ethereum looks from a high timeframe technical perspective
Can an Ethereum apocalypse bring down Bitcoin and the rest of crypto?
Was Bitcoin’s fifth wave to blame for altcoin underperformance?
A special 18-chart deep dive into why Bitcoin and Ethereum/altcoins have diverged so much this cycle with textbook examples
Plus, why Bitcoin could still have one more wave up left!
Humans instinctively recognize patterns because it provides an evolutionary survival advantage. Recognizing patterns allows us to predict future outcomes and prepare in advance, improving chances of survival. For example, knowing Winter is coming allowed humans to prepare for the harsh conditions. If another Crypto Winter and bear market is coming, wouldn’t you want to know the signs and prepare accordingly? February’s collection of newsletters have all been about such an alternative scenario and because technical conditions have worsened, this will continue.
Humans find comfort in patterns. It is when patterns change, we begin to feel discomfort. Cognitive dissonance might prompt us to ignore bearish signals or other information that conflicts with a bullish expectation. Confirmation bias pushes us to actively seek out data that supports our expectations to reestablish mental comfort. Anchoring bias keeps people stuck on the expectation of a bull run every four years after the halving. Sunk cost fallacy could leave you at a standstill rather than changing your stance, considering all the time, money and emotional energy you’ve already invested. We are our own worst enemies.
It is incredibly difficult for me as someone who serves an audience who hopes their investments rise to deliver these possible signals above. But as someone familiar with these instinctive human biases and trained on how to manage them, I have a responsibility to be honest with what I am seeing in the charts. The patterns I predicted and were working like a charm the last several years are starting to change. At the moment, I haven’t yet been able to recognize new patterns, so I am not yet ready to ditch the old patterns. As such, I am looking everywhere for new patterns to emerge so I can adapt and survive.
I credit a lot of my pattern recognition prowess to my childhood playing video games. Facing off against the “computer” means paying attention to the cyclical patterns that video game bosses display. Even in the Super Mario franchise, the boss you’re facing will follow a specific pattern. Once you’ve hit the boss three times, the pattern changes. This increases stress and discomfort, amplifying the difficulty and intensity of the experience. The moment the player is used to the pattern and able to exploit it, the pattern changes.
Bitcoin has had three significant post-halving cyclical rallies where it made new ATHs. This most recently cycle, however, has behaved very different from the beginning. Bitcoin hit a new all-time high before the halving for the first time ever. Altcoins have been absolutely brutalized due to lack of market breadth. The pattern may have been changing right before our eyes all along.
In approximately 3 days, the February candlestick will close. That should supply enough data to potentially confirm if our patterns are broken and indeed changing, or if this was our last taste of revulsion before a bigger boom cycle begins.
Show me the charts and I’ll tell you the news
Over the last few issues, I repeatedly noted that Ethereum appeared to be at an inflection point. It was either going to bottom and bounce, or kick off an extreme bearish phase. The chart was always telling us something was going to happen with ETH, but we didn’t know what. Since those issues, ByBit was hacked for $1.4 billion worth of ETH.
While Ethereum charts were ultra bearish, it could have been foretelling the hack. The hack itself is negative news, but oftentimes negative news is associated with market bottoms. A great example of this is the FTX collapse, which put in Bitcoin’s bear market bottom. This Ethereum hack while sentiment was already so bad could be just what ETH needed for a bounce. But like technicals were warning, it also could commence a new bear market.

From a pure classical charting perspective, this decline is difficult to ignore. This month’s candle body is currently making a lower low, but is tapping into a demand area where bounces have occurred. The biggest problem is ETHUSD losing the uptrend line that’s been in place since mid-2022.
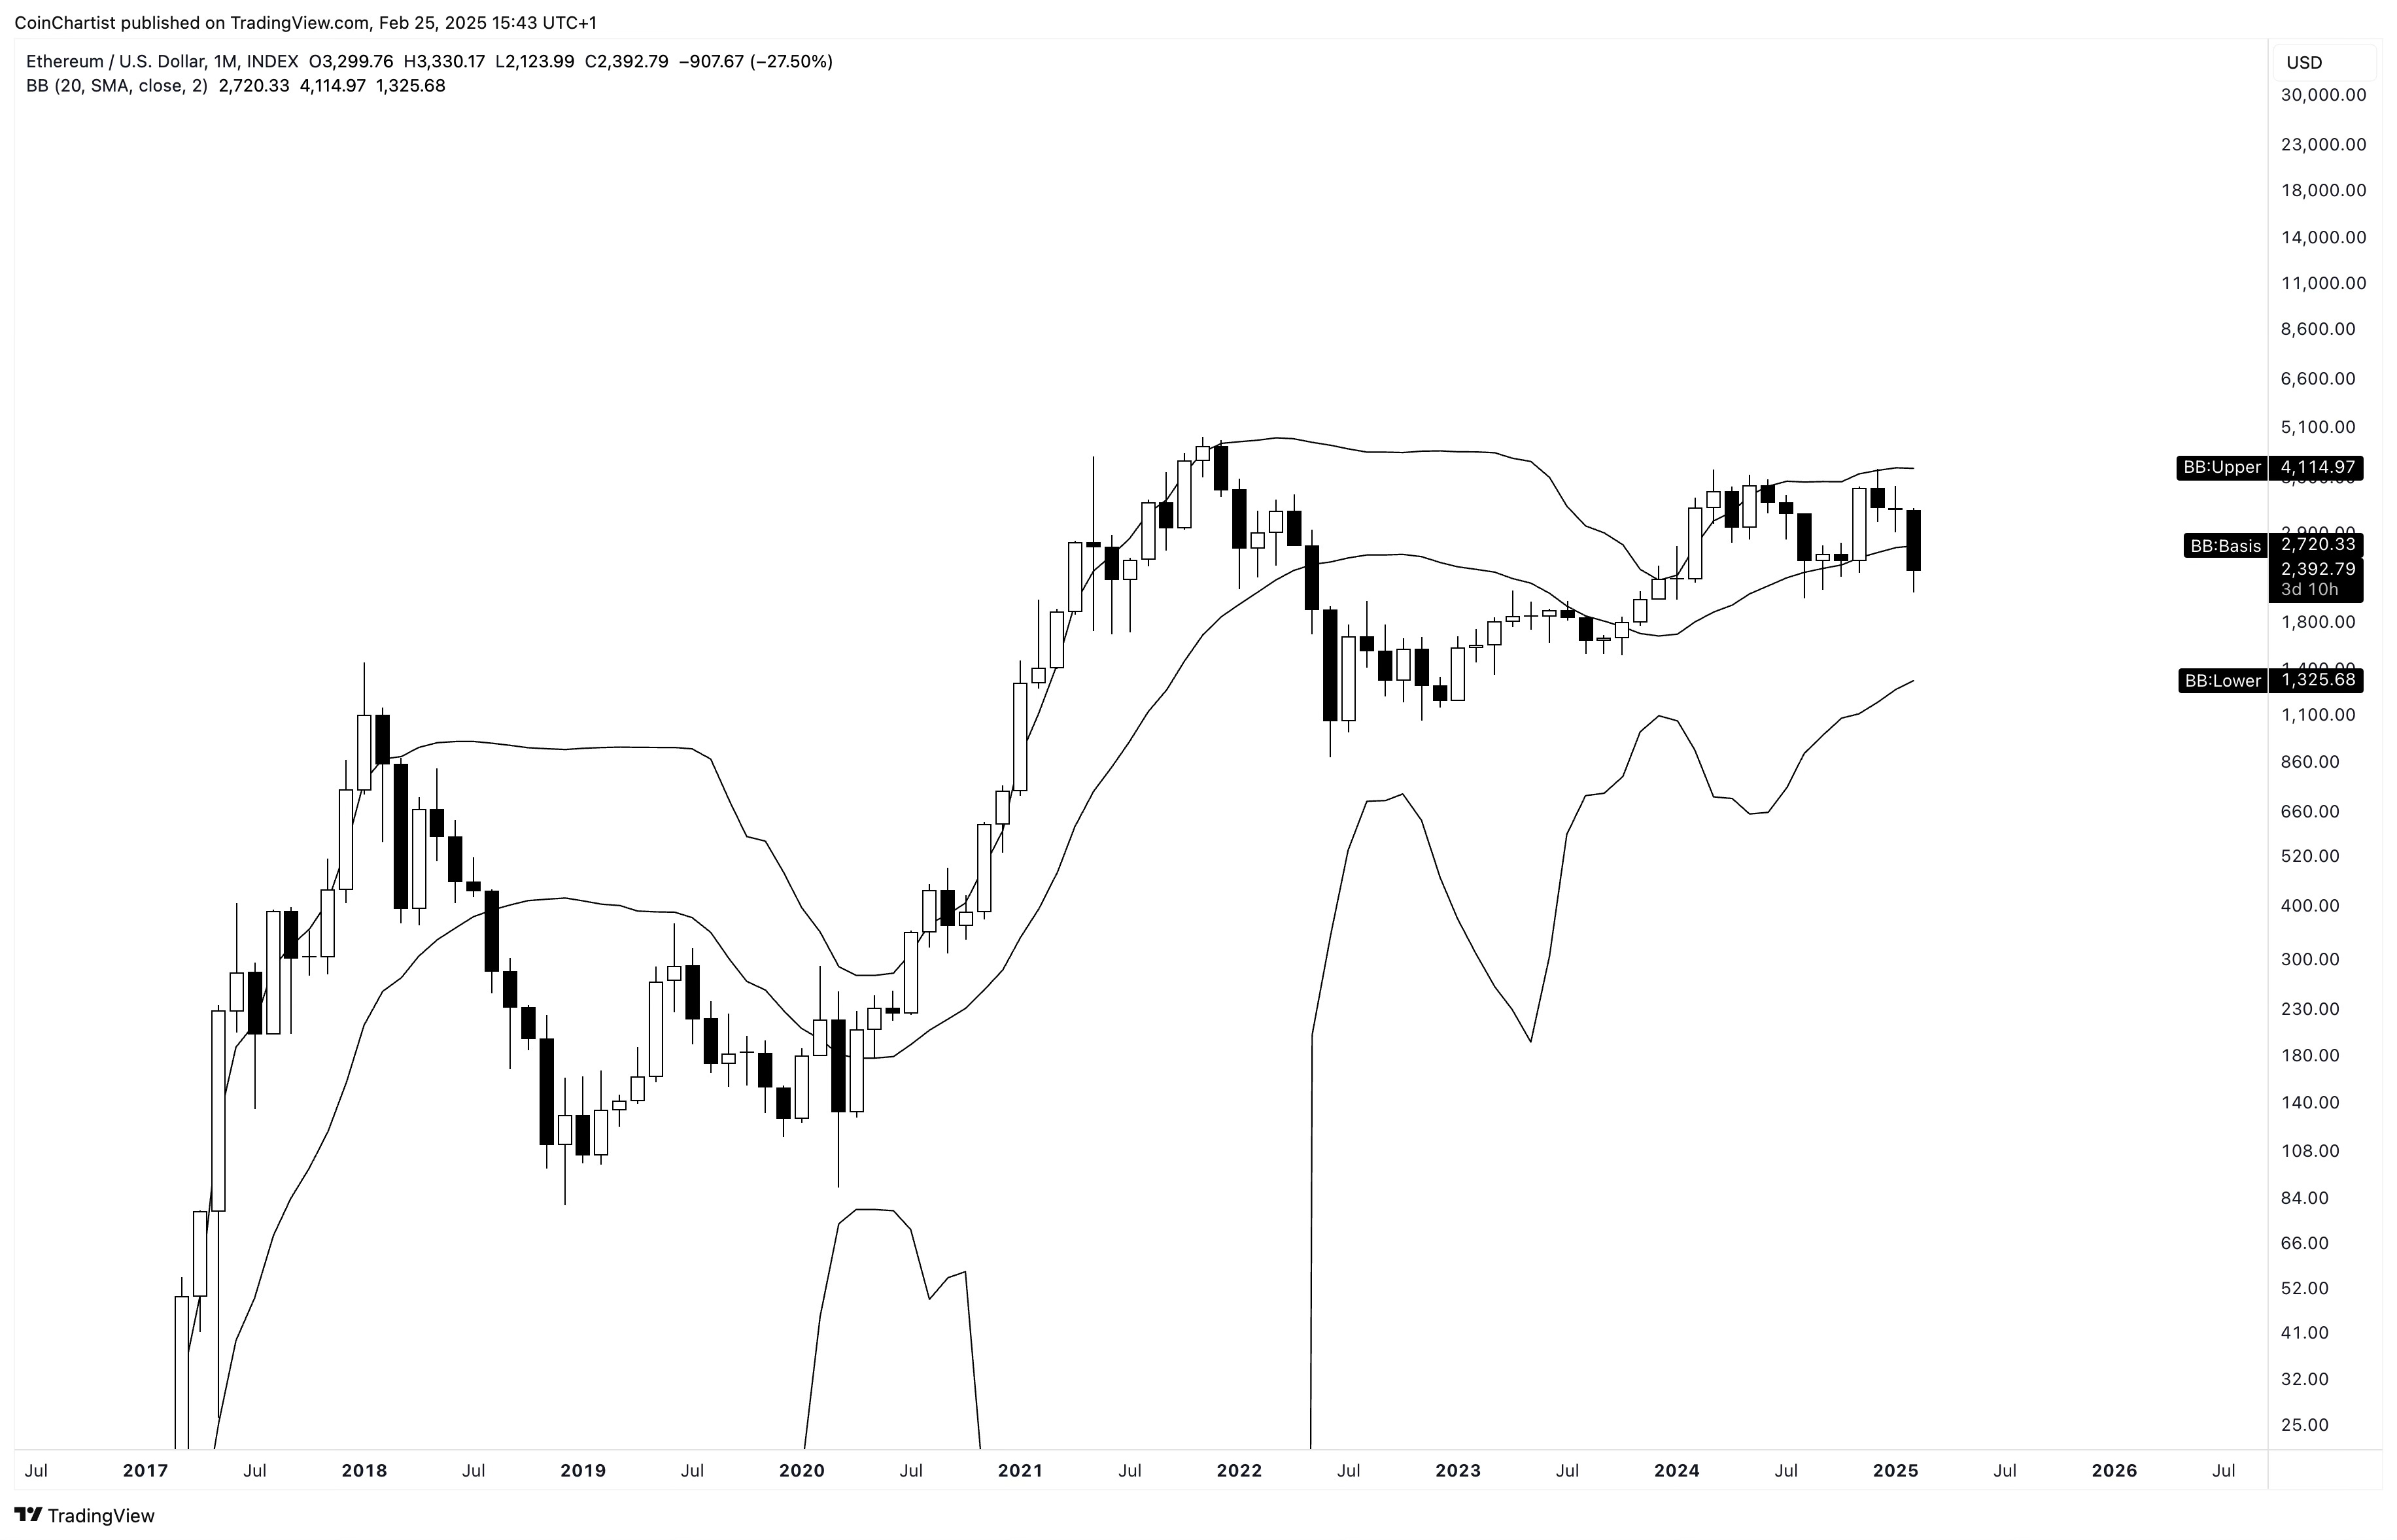
Ethereum is at risk of losing the monthly Bollinger Band basis. This historically has kicked off a 50% to 80% decline. Holding here is necessary to avoid further losses. The lower Bollinger Band, which has never been hit before, could be the next logical target in ETHUSD breaks down.
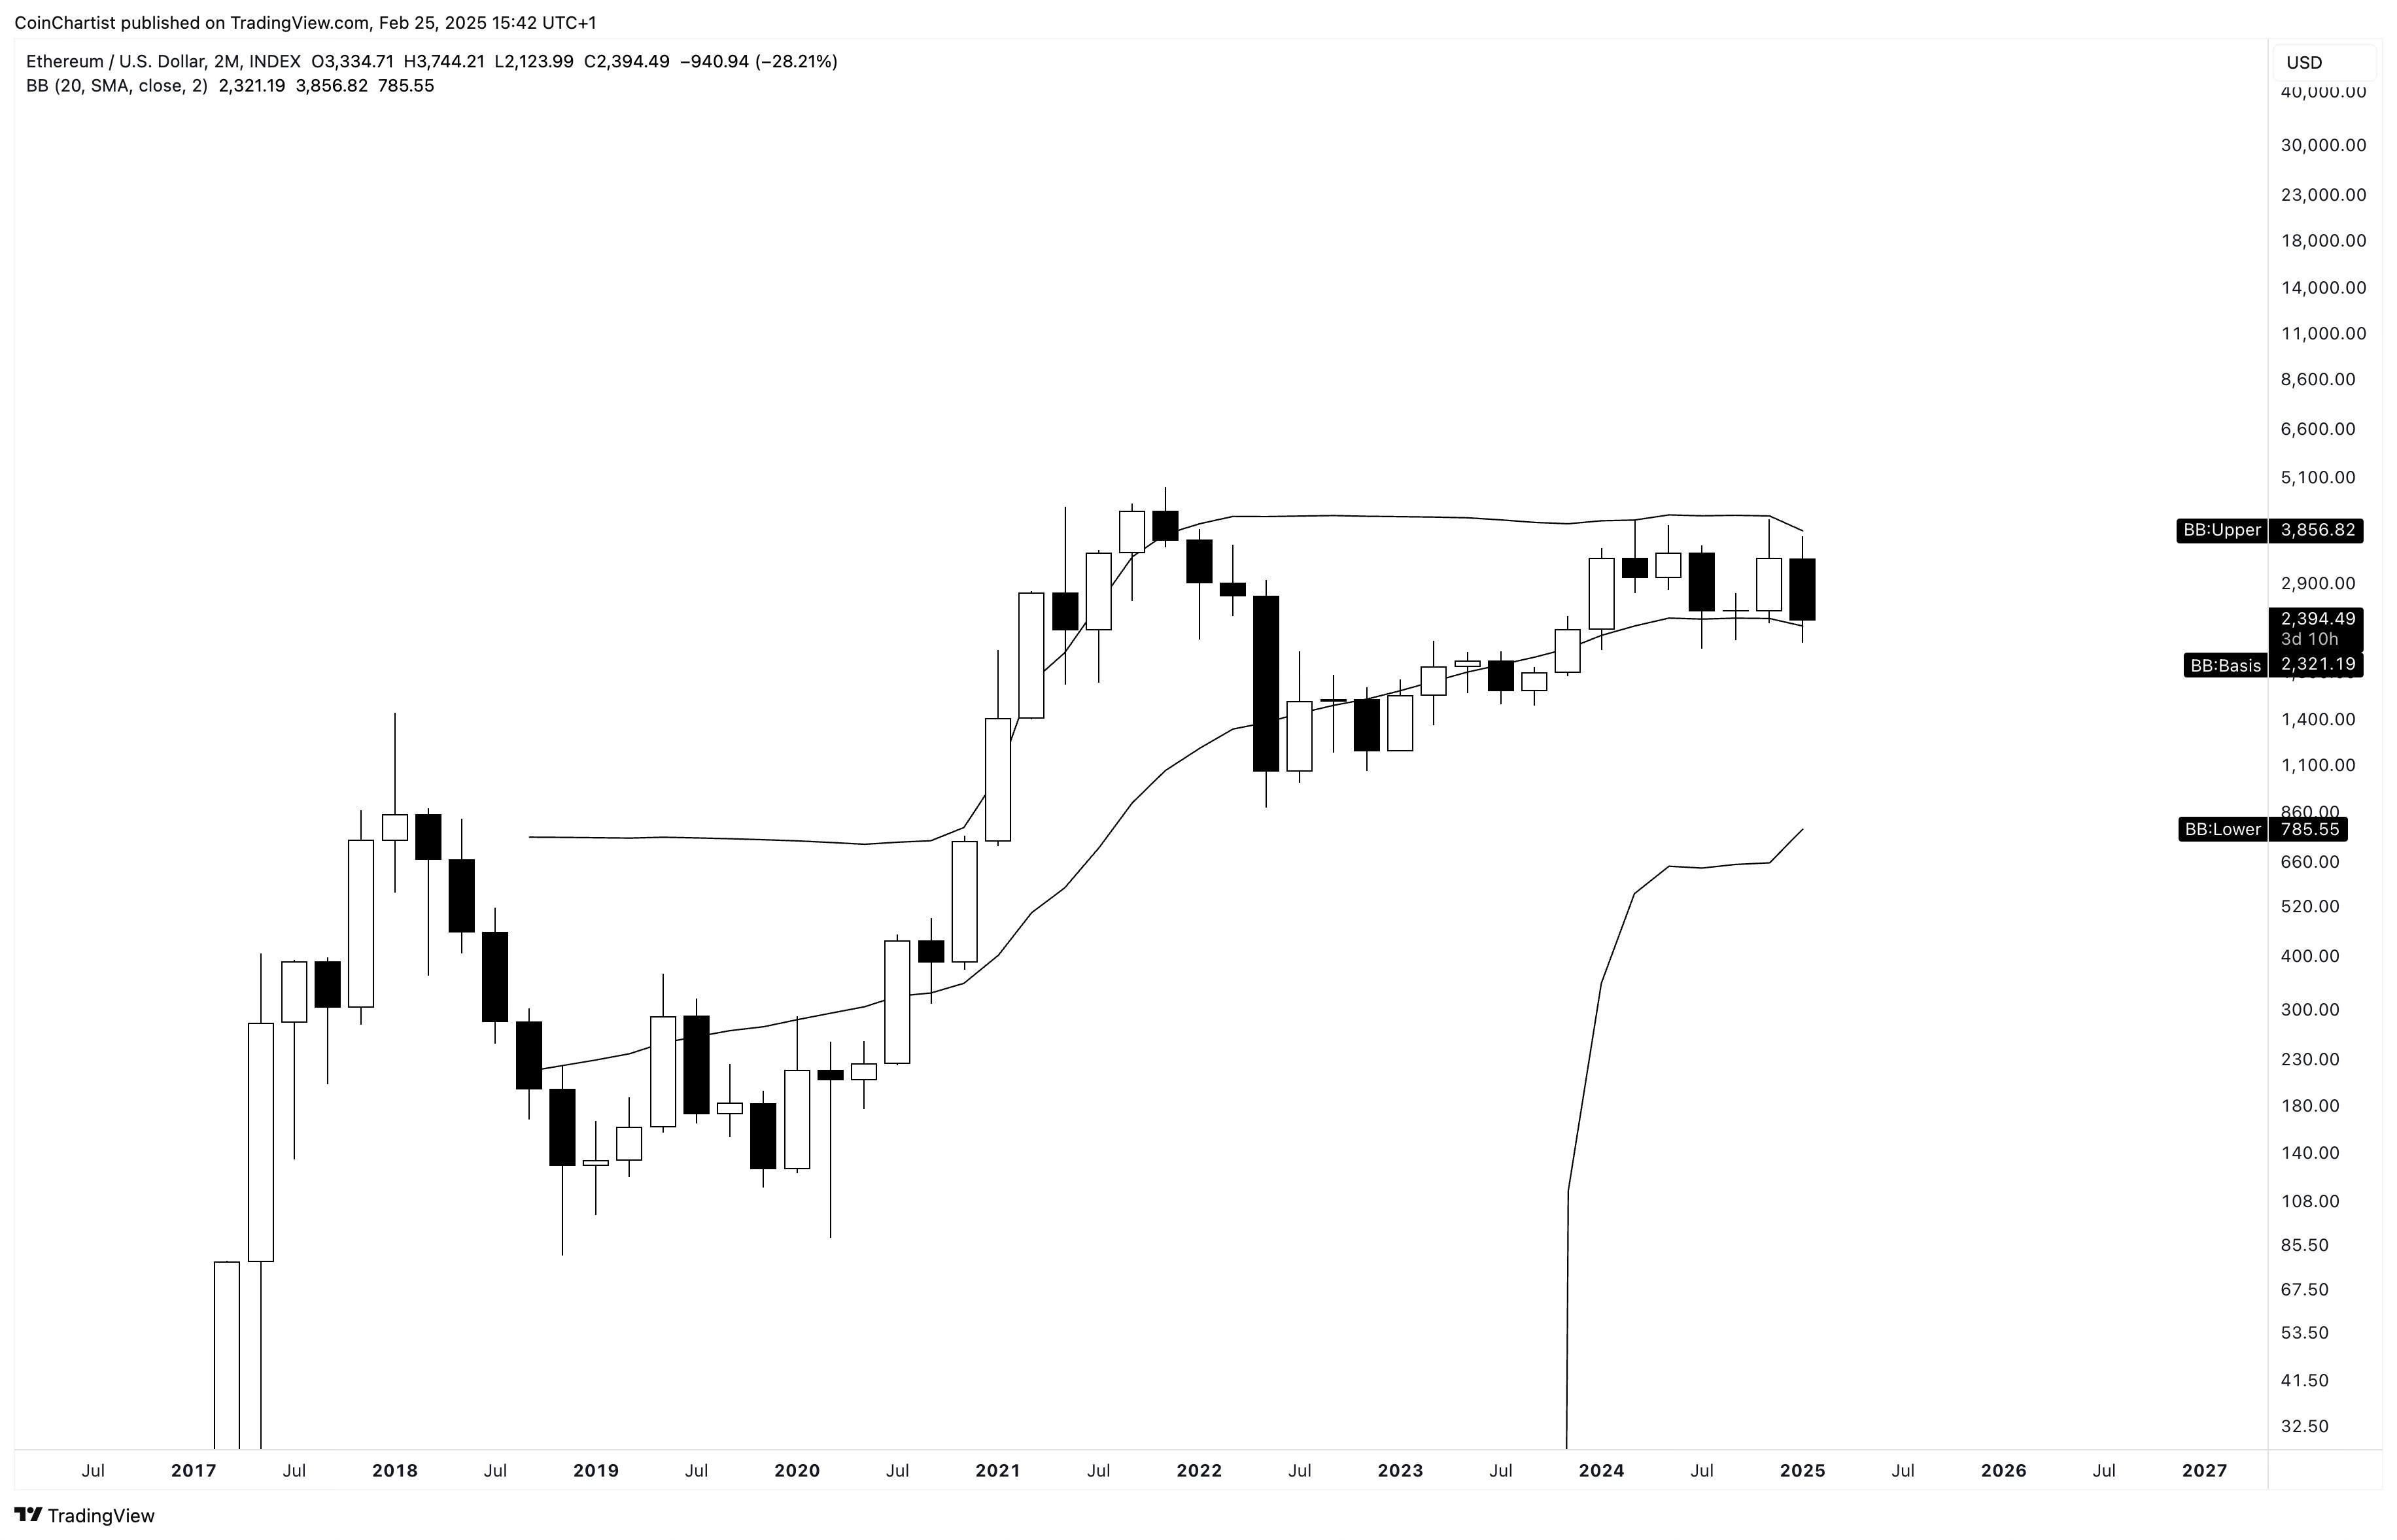
The 2M chart is still holding the Bollinger Band basis line, but by a thread. The basis line has started to turn down for the first time ever on the chart, which could be signaling a major trend change. Even scarier, the 2M Bollinger Bands are the tightest ever. They could continue to tighten and squeeze further, but that will only increase the strength of the move. Considering the rest of the technicals, down seems more likely. However, if Ethereum can recover this record tightness could be a catalyst for a huge surprise move to the upside.
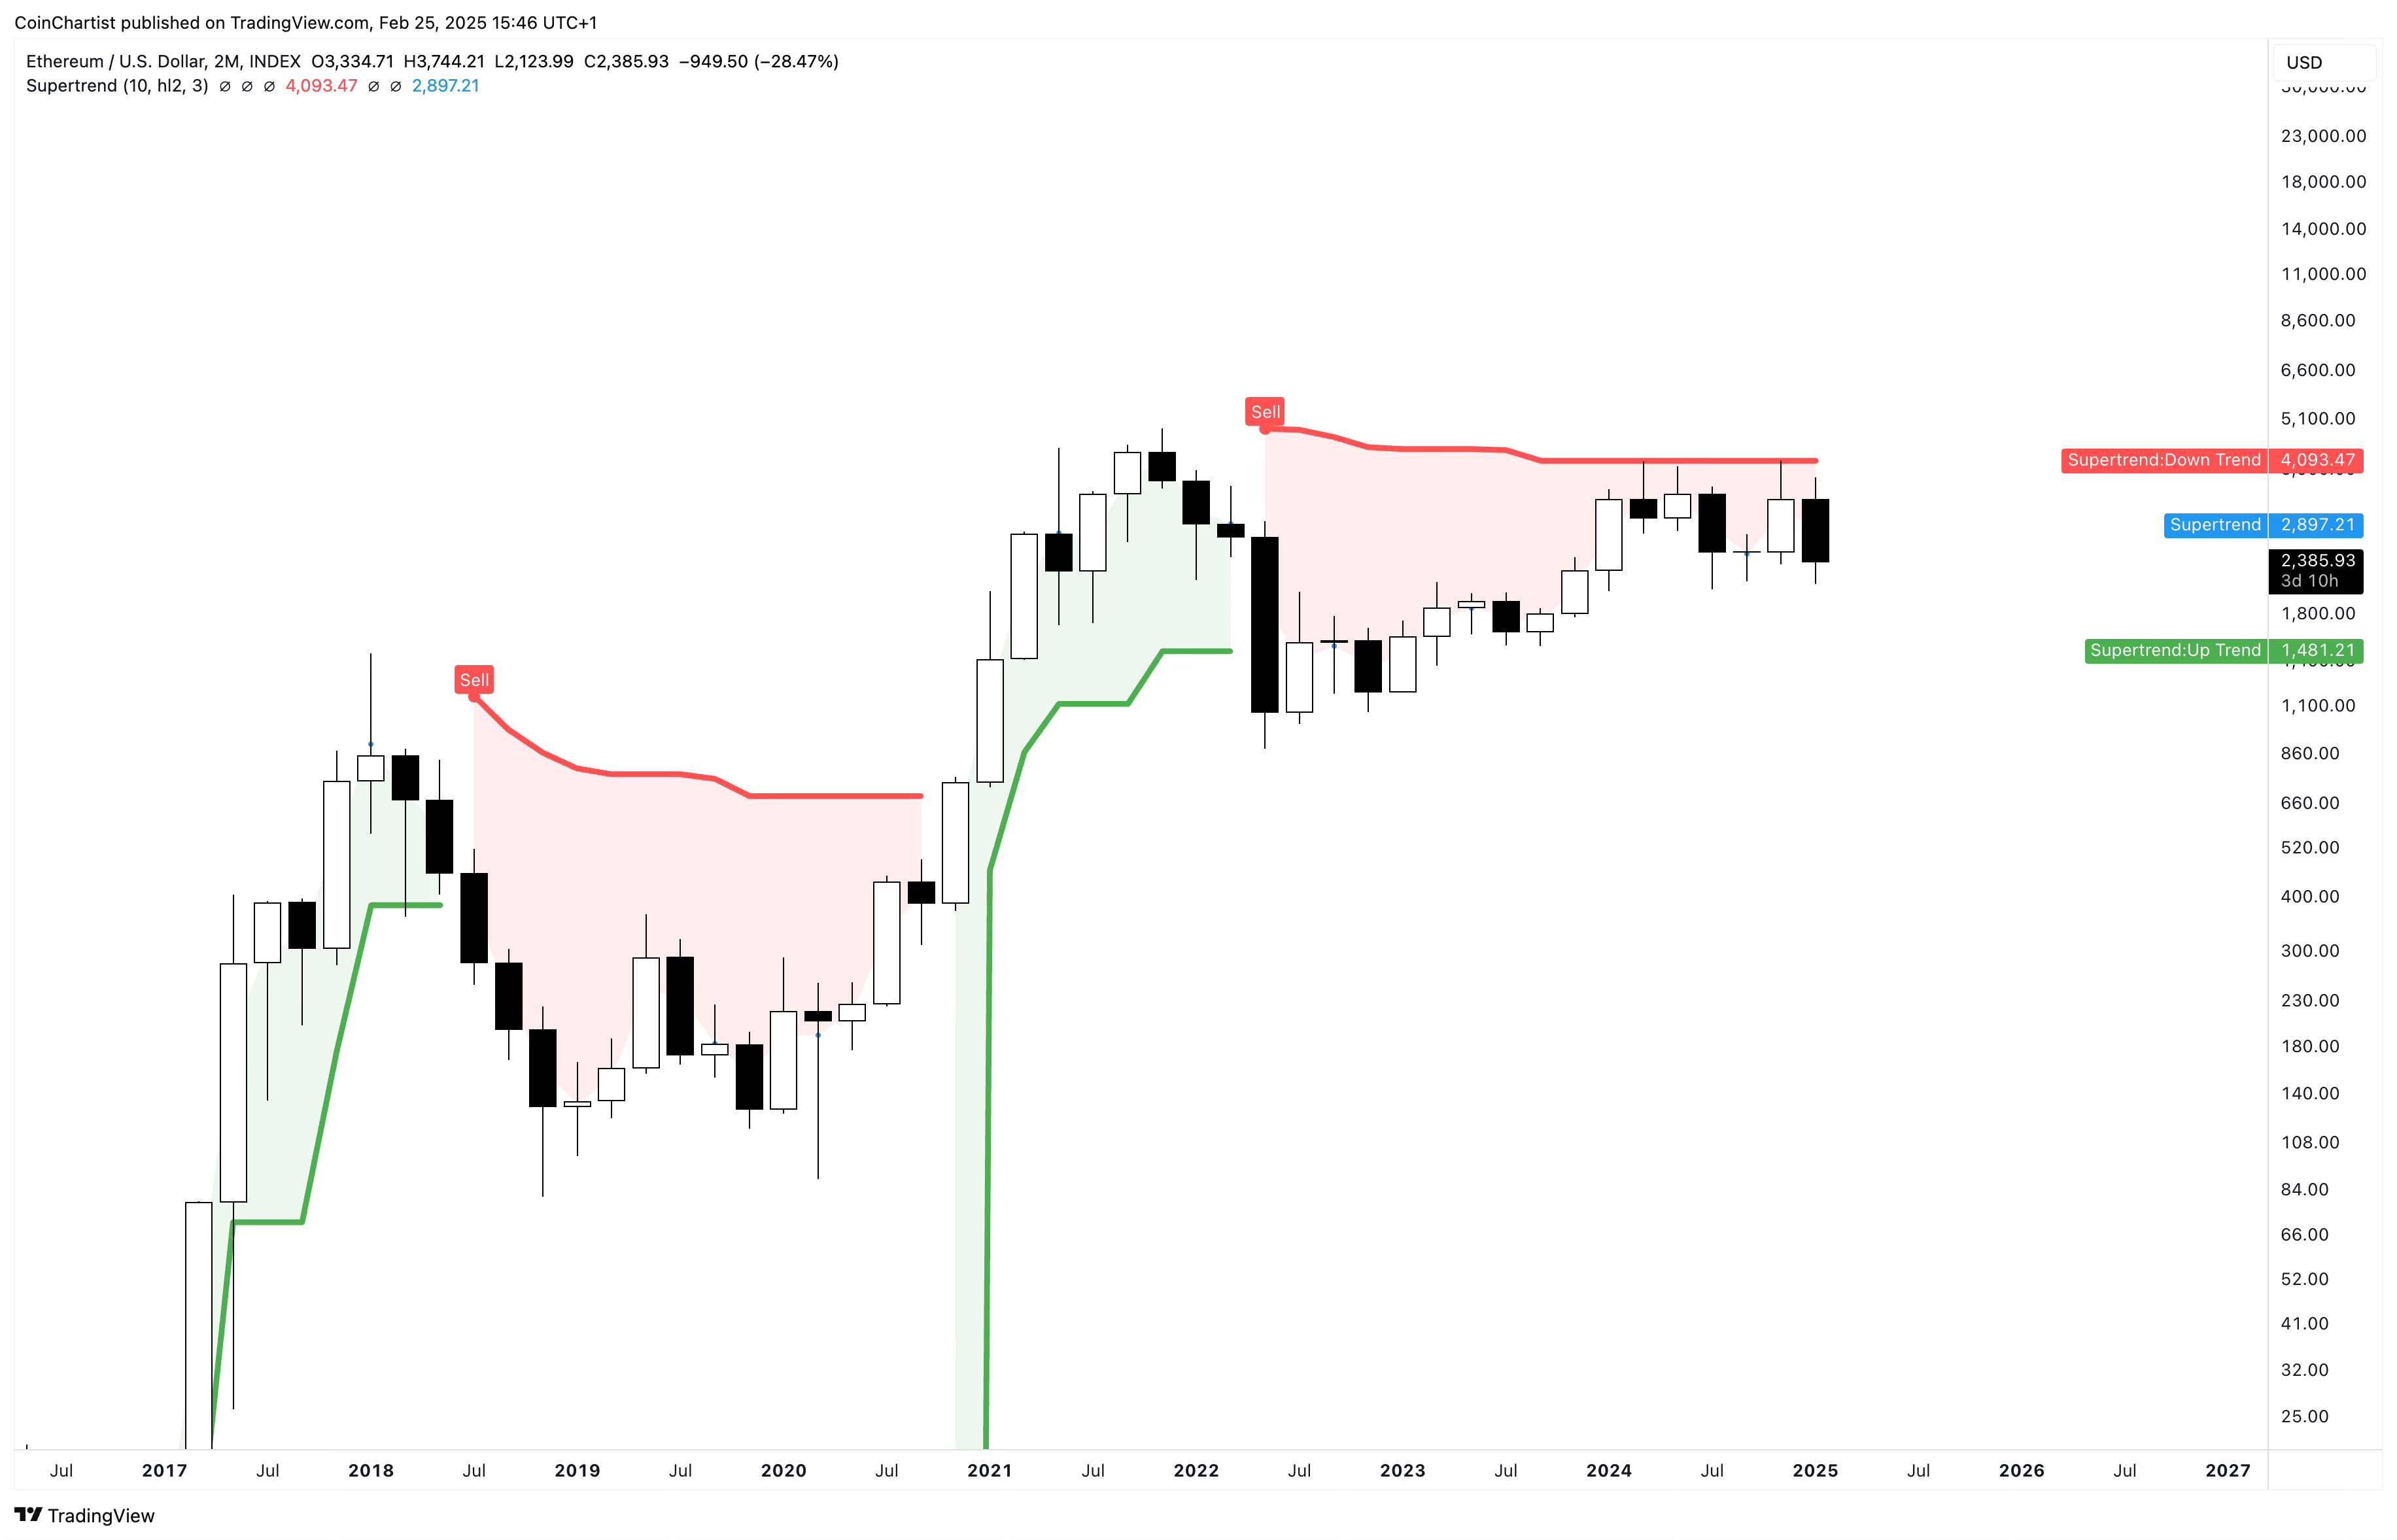
The 2M SuperTrend sell signal dynamic trend line was too strong of resistance to break, prompting the rejection we’ve seen. 2020 shows what a proper bullish impulse looks like compared to what we are witnessing the last few years in Ether.
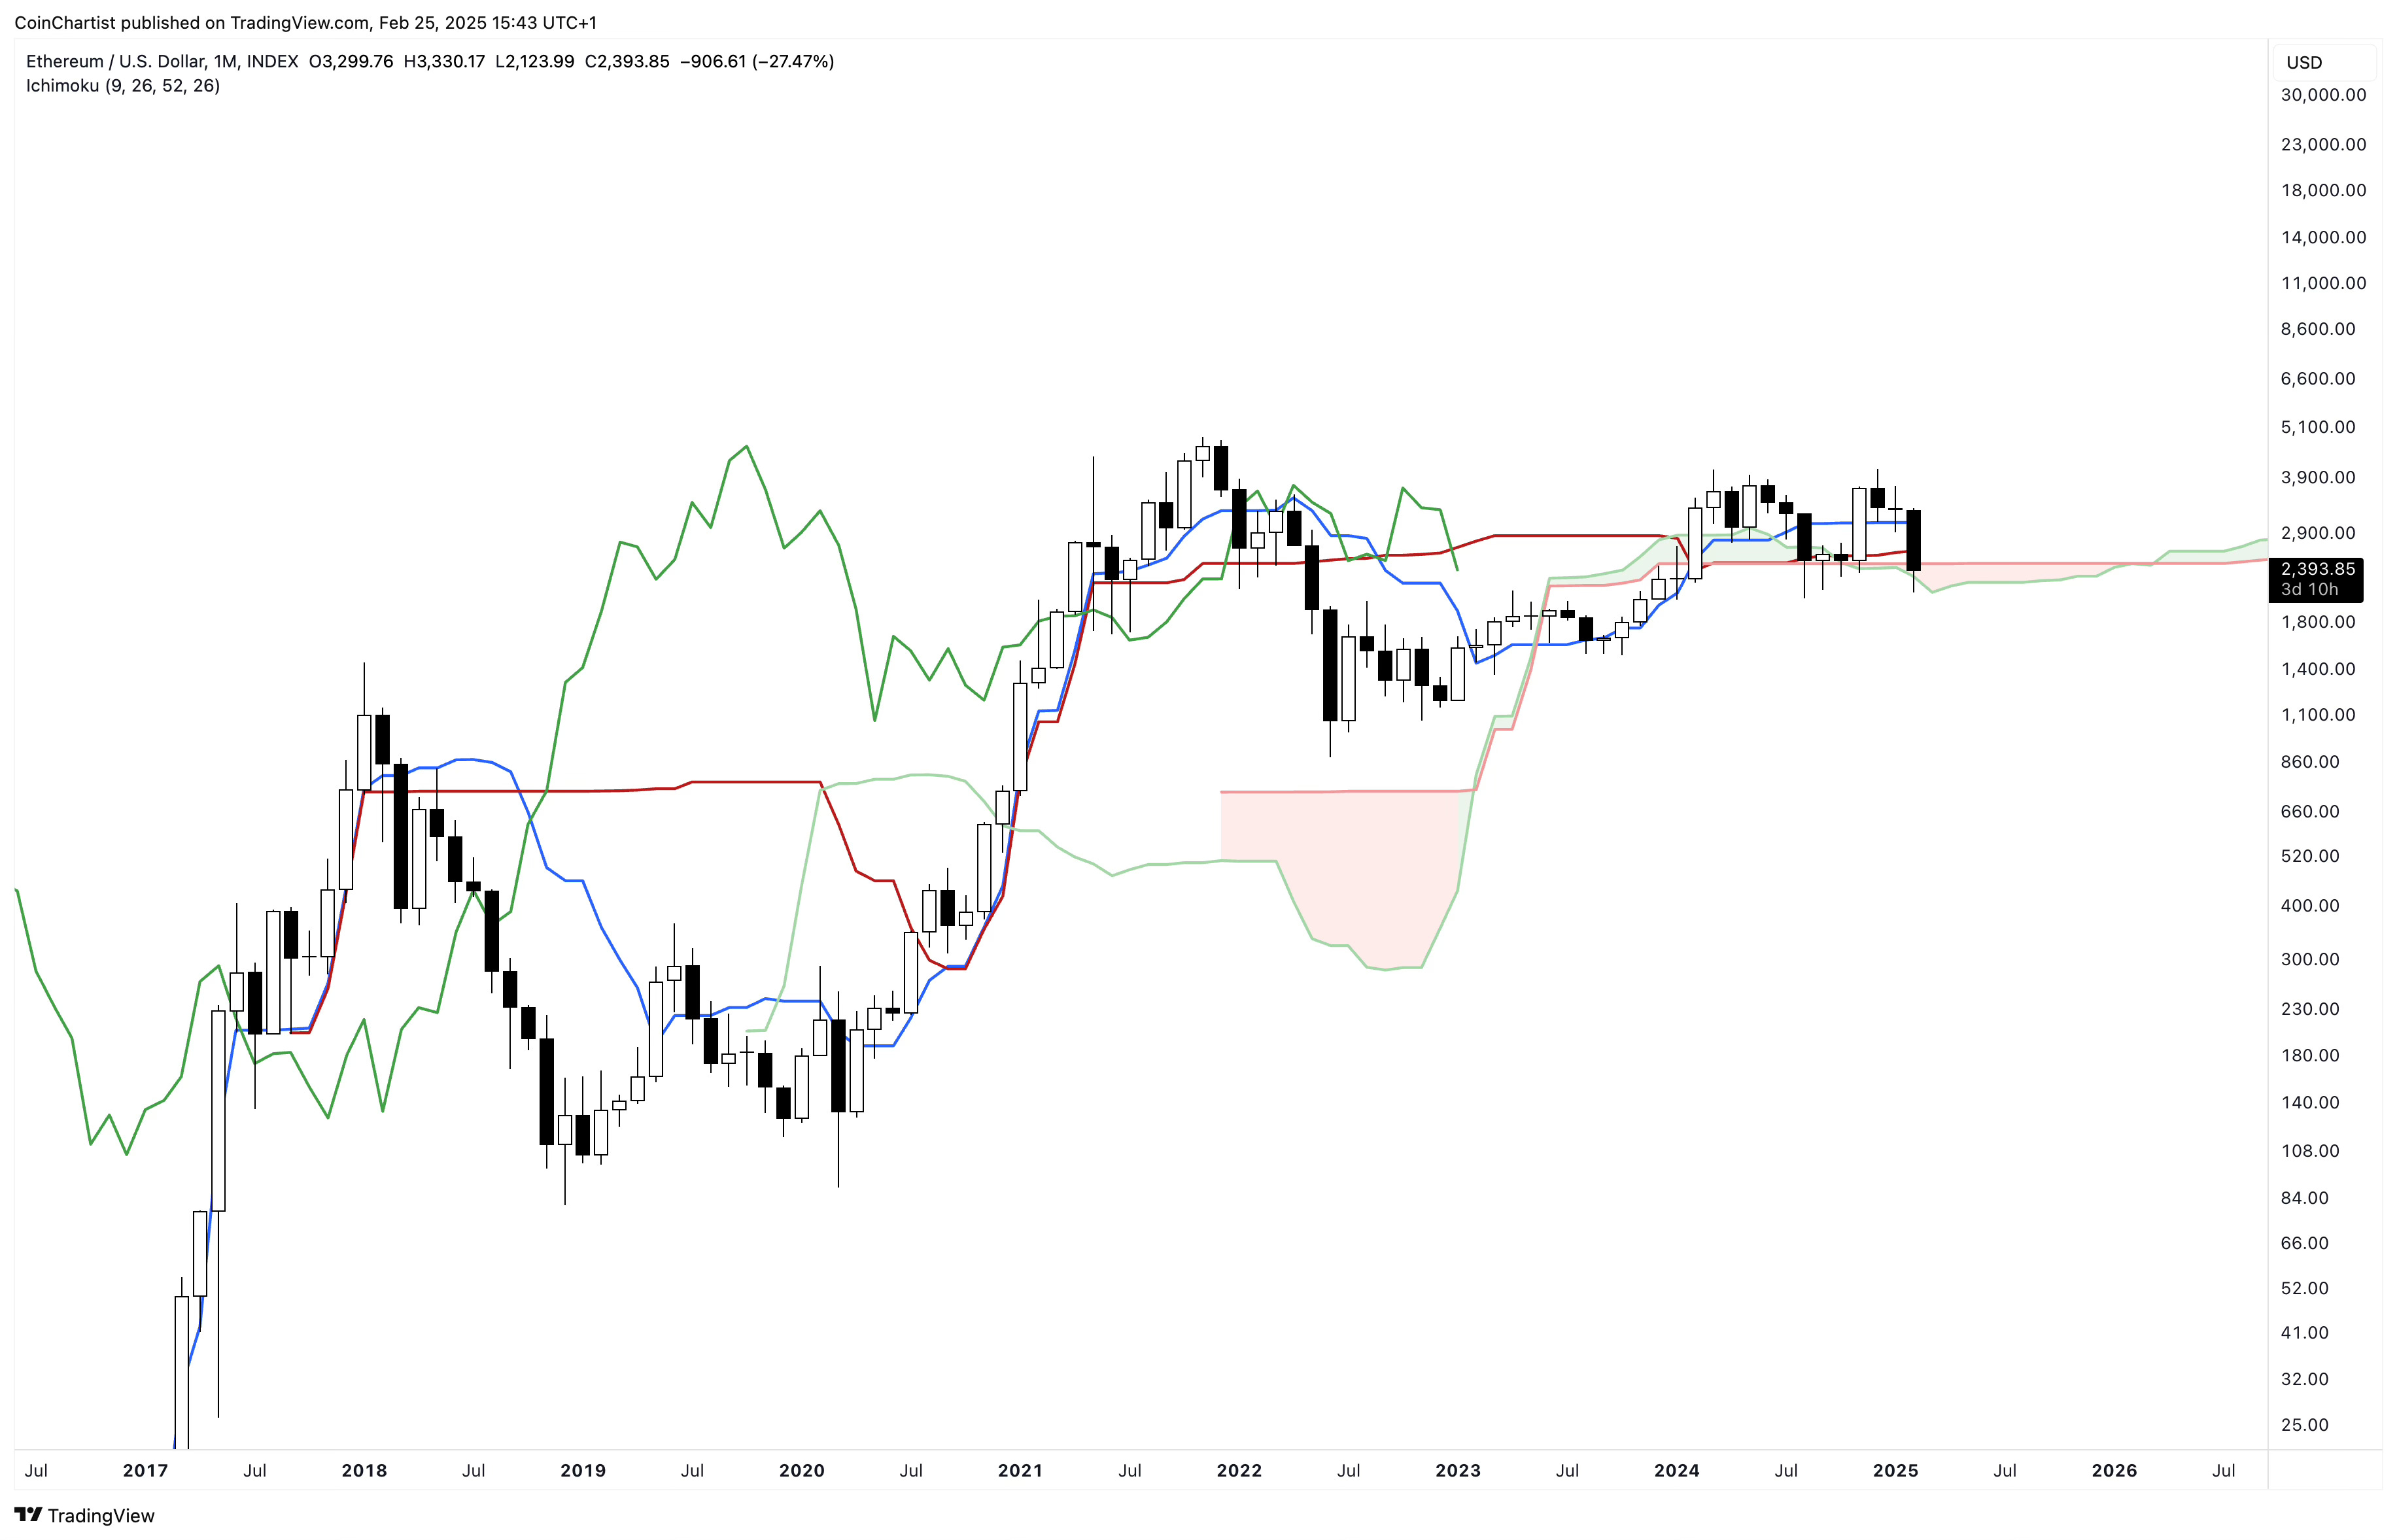
The plethora of negative charts continues with the monthly Ichimoku. Ethereum is now through the Tenkan-Sen and Kijun-Sen and is deep into the cloud. Falling through the cloud after previously retesting it would be a very bad sign.
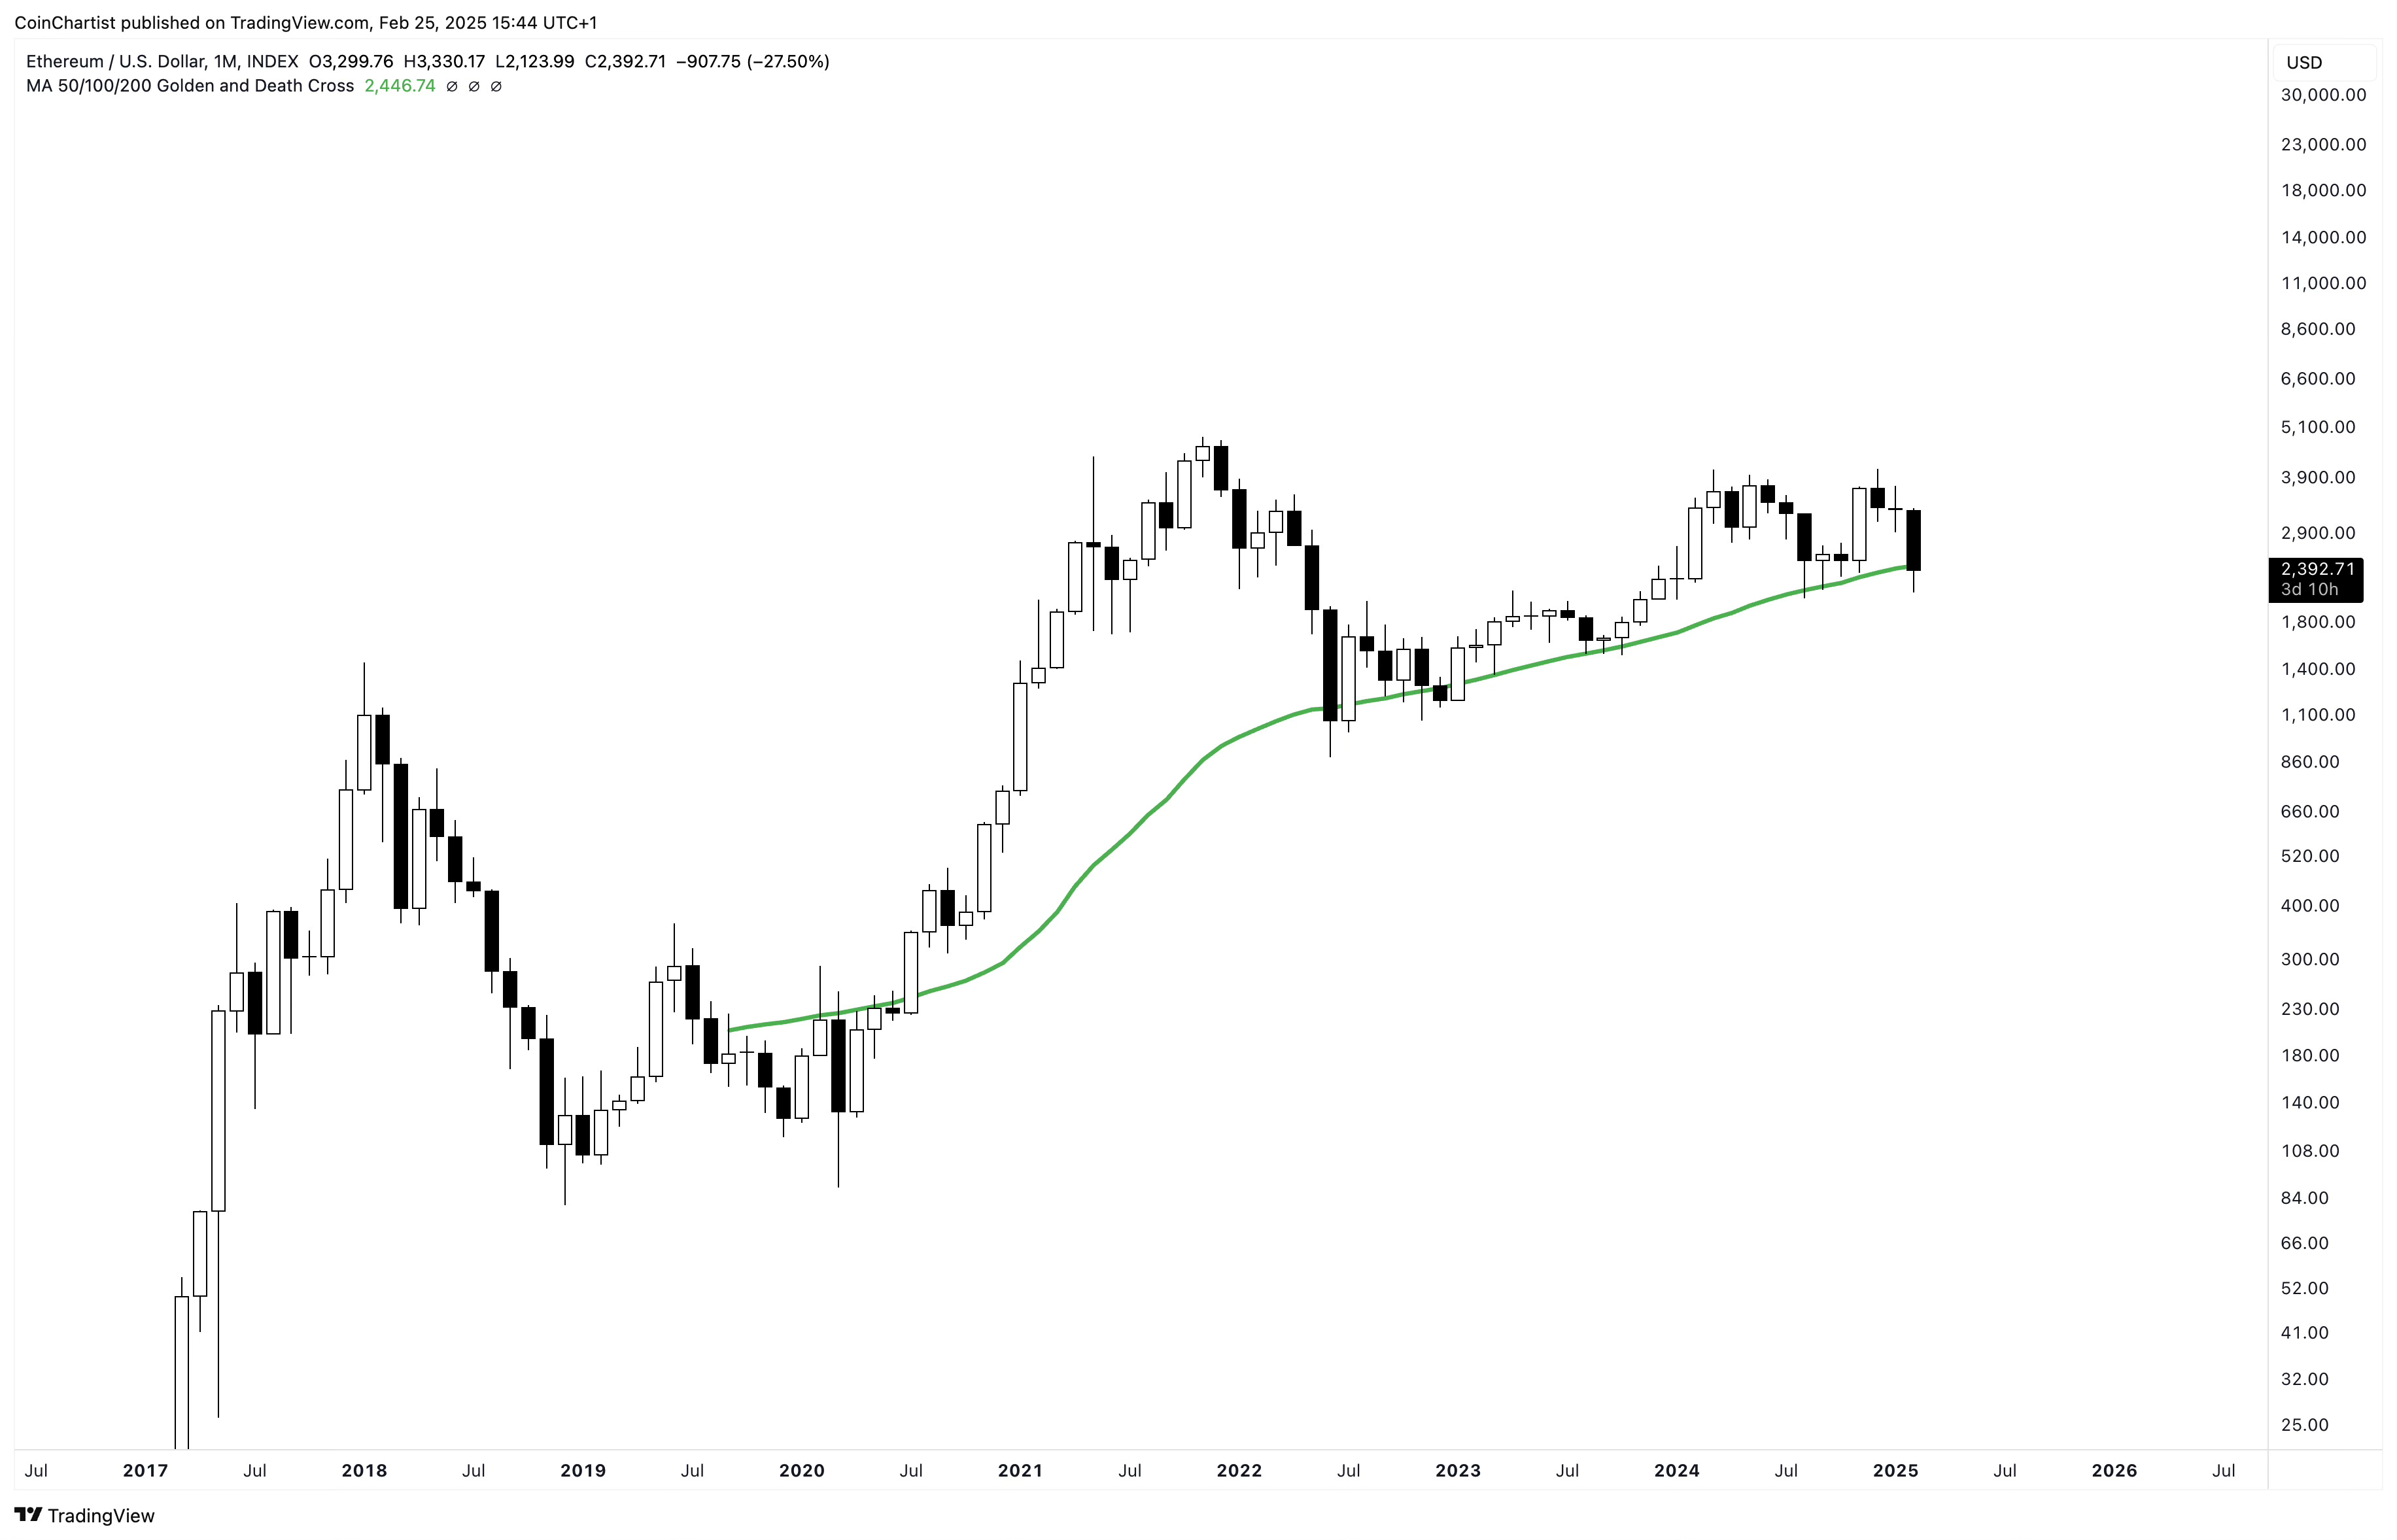
Ethereum is also currently below the 50-month Moving Average. There have been closes below it in the past, but price has always rebounded immediately after. Will that happen again, or will it be lost this time in a dramatic fashion?
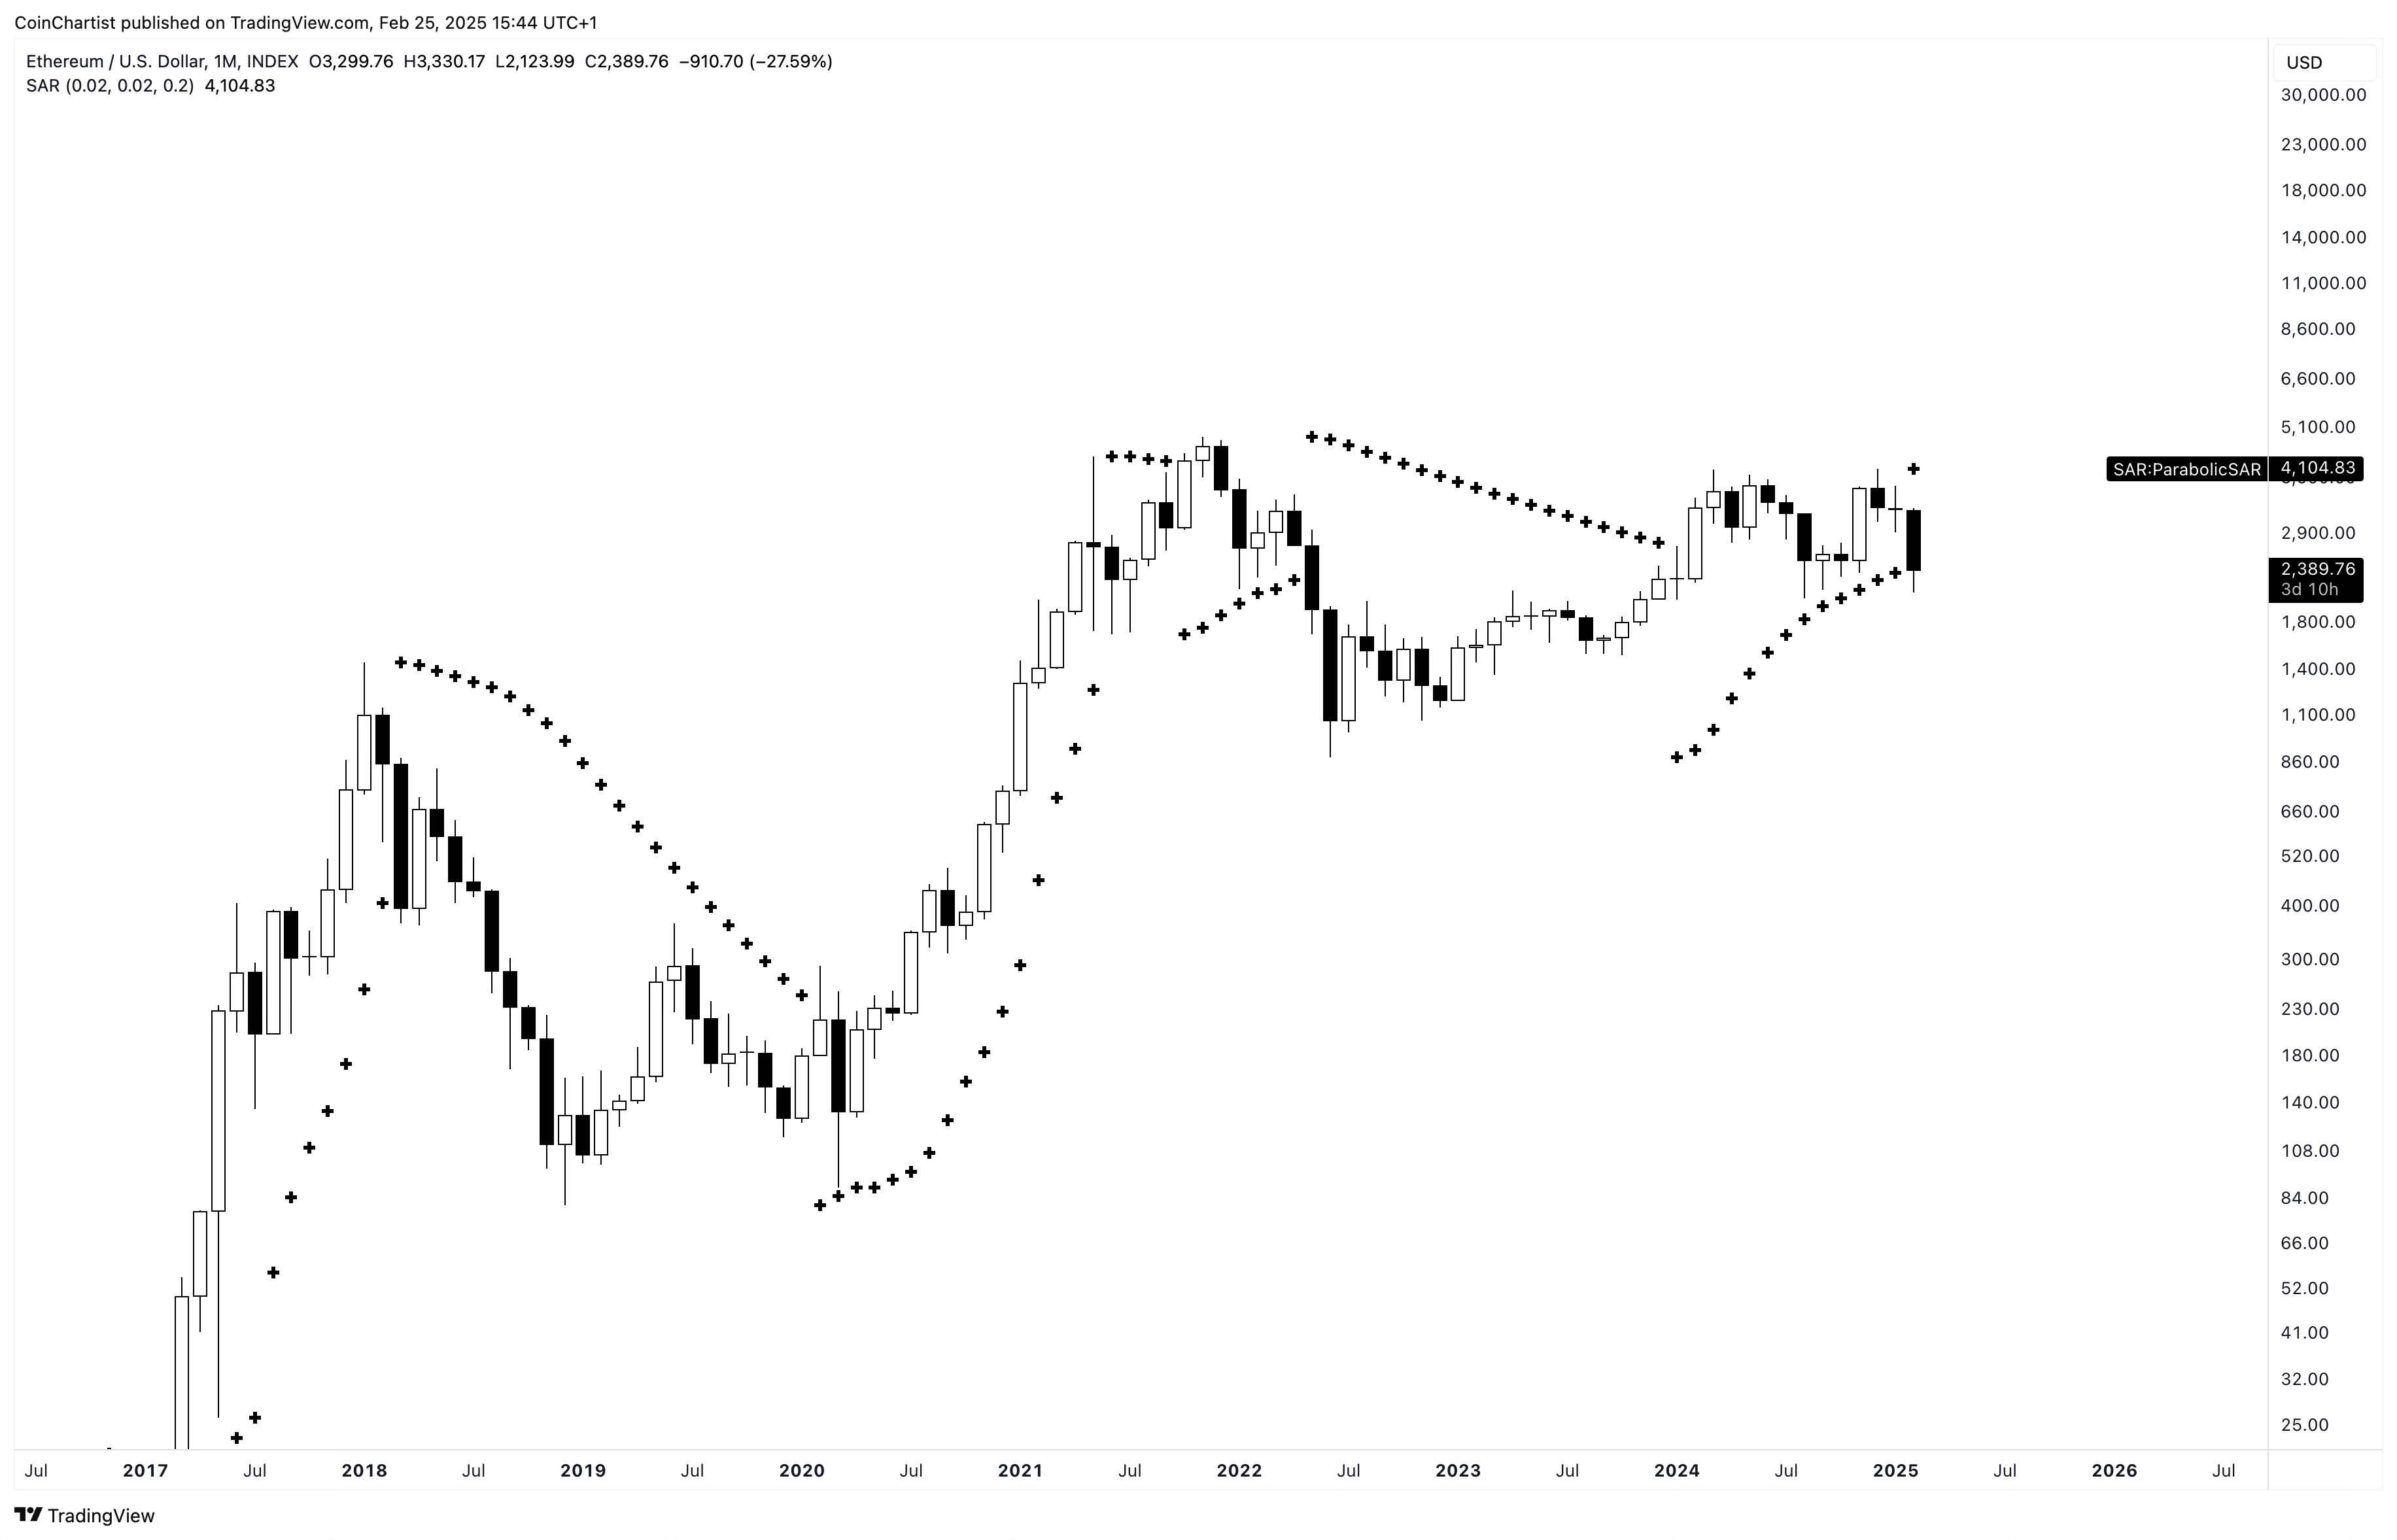
Ethereum has triggered the Parabolic SAR on the monthly. SAR stands for stop and reverse, and this tool could be telling us that the trend has stopped and reversed back into a bearish phase.
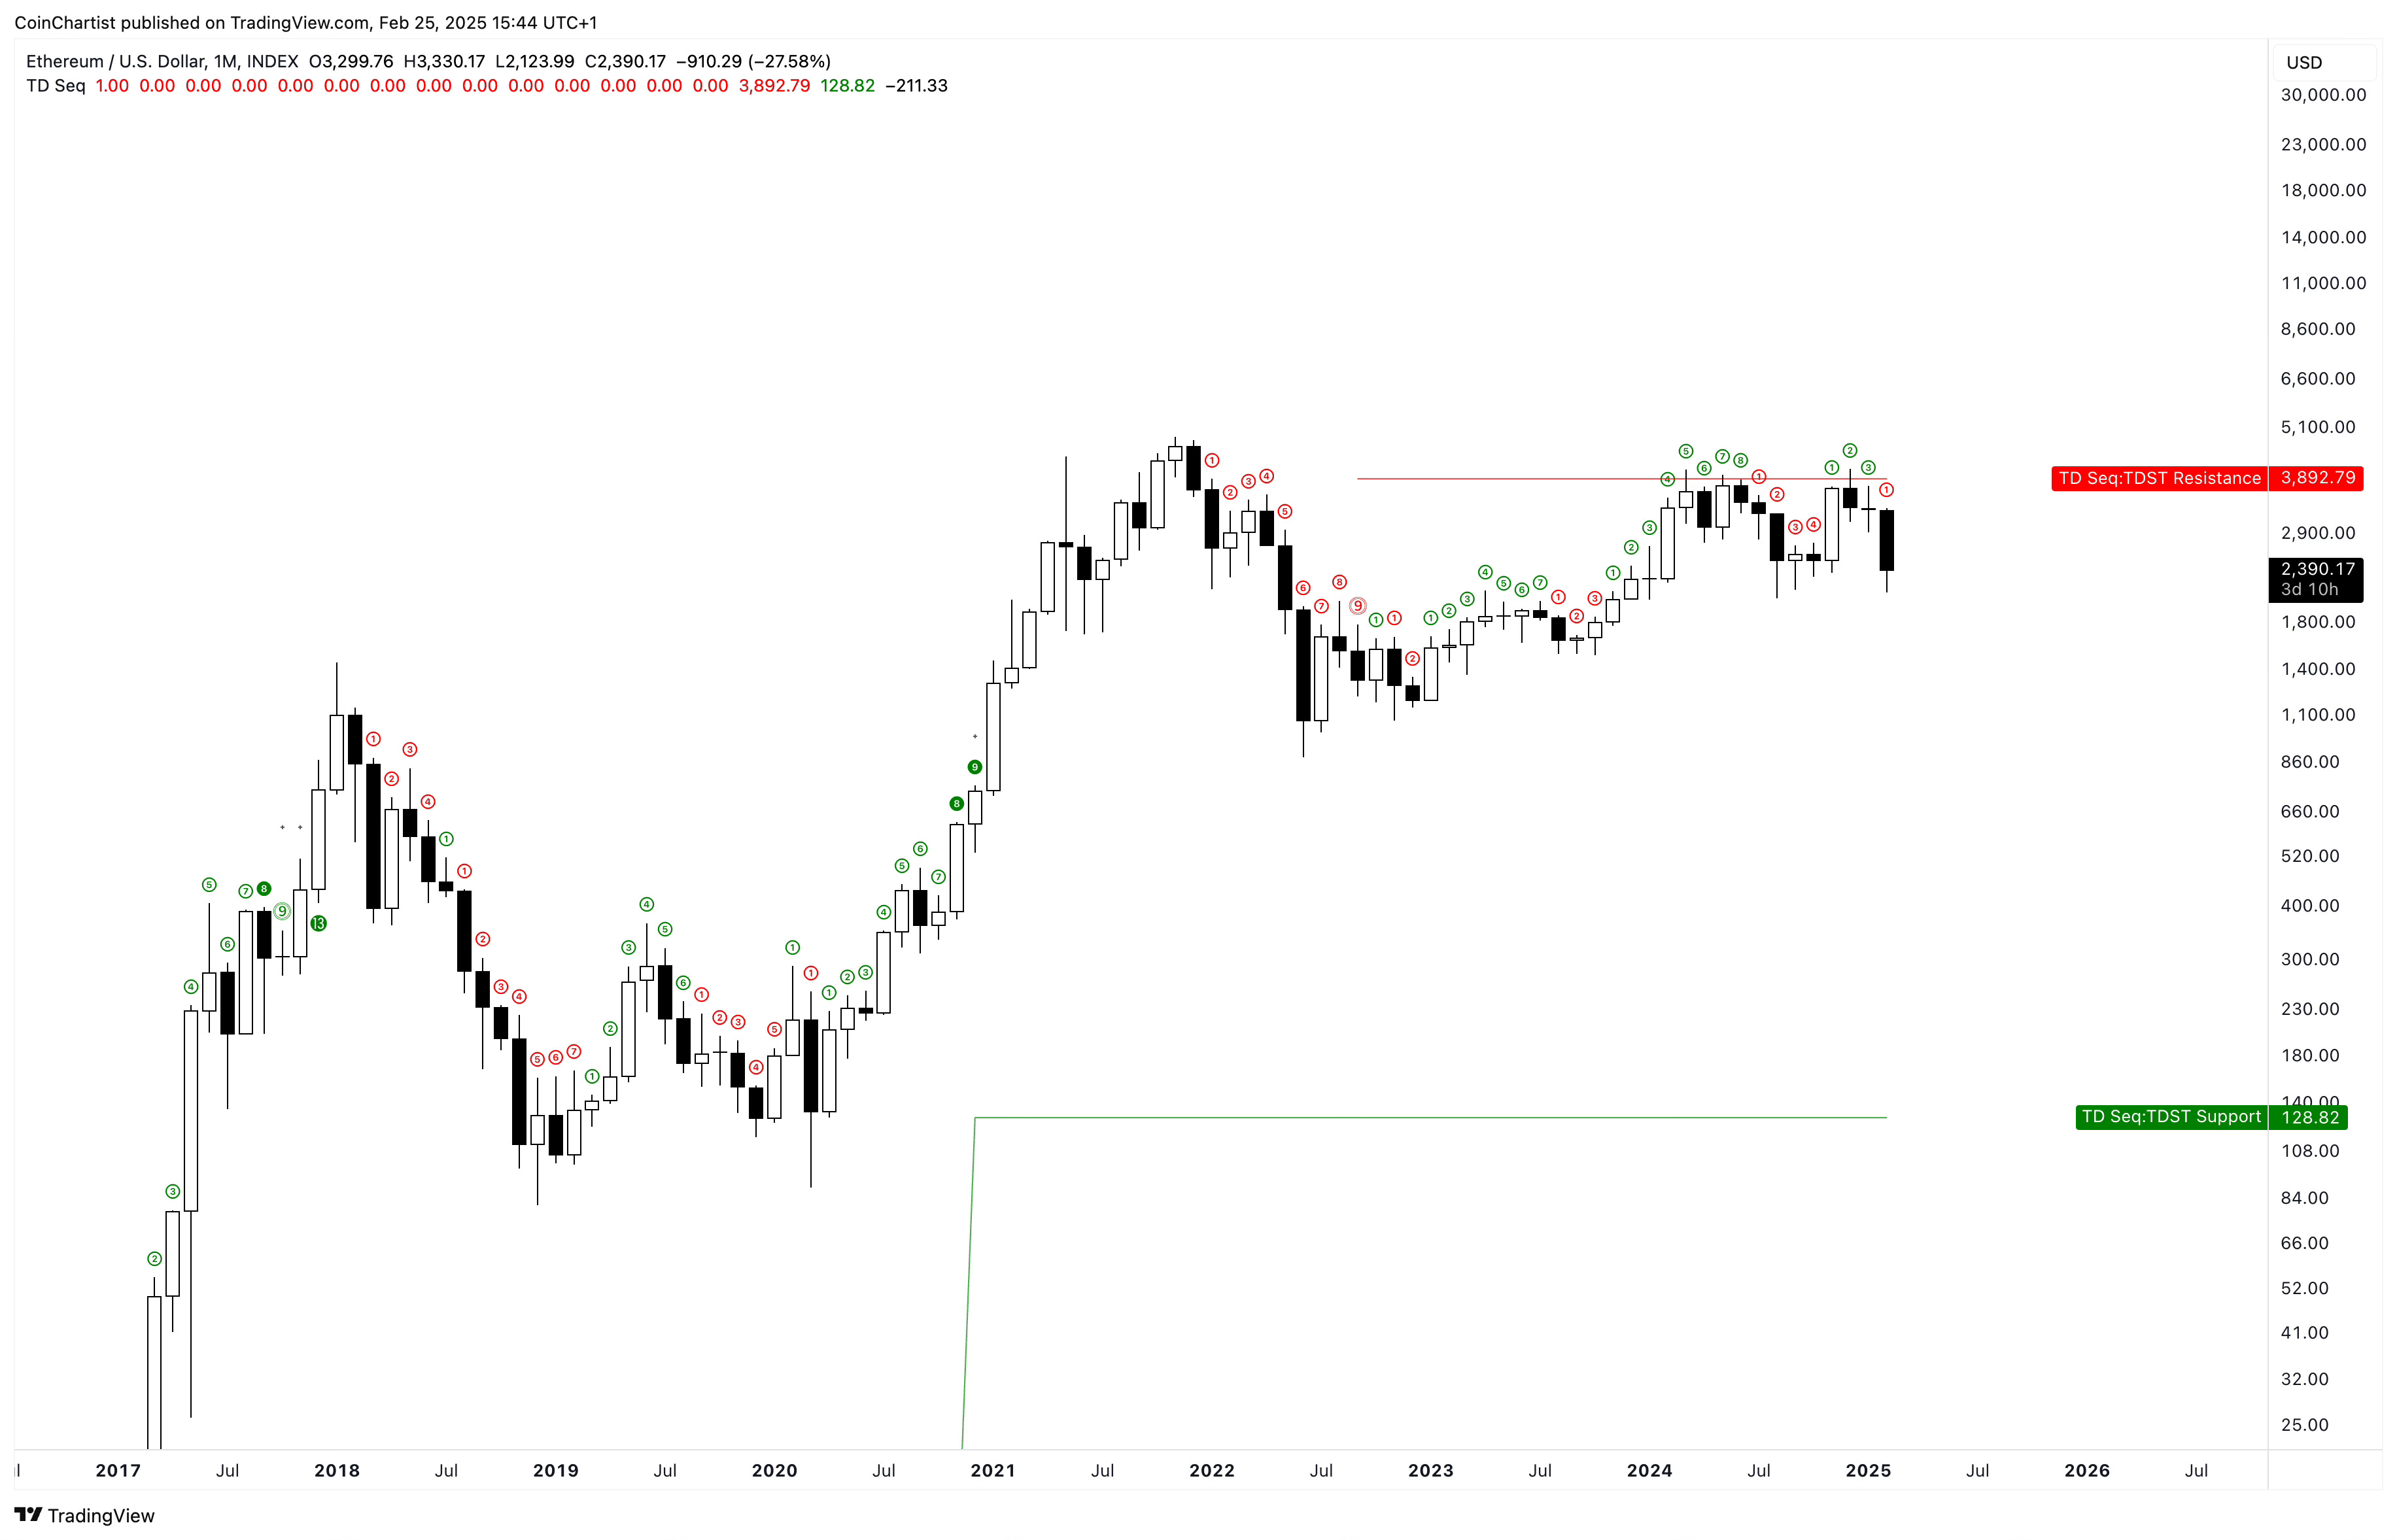
The chart above shows the TD Sequential on a red 1 count, denoting the start of a new downtrend. This can of course change in 3 days, but it is what it is currently. We can also see that price was rejected from TDST downtrend resistance, and that TDST uptrend support is located as low as $128.
Can Ethereum drag down the rest of crypto?
Ethereum is still one of the most important market drivers in the crypto space. It not performing has been a large part of why the rest of altcoins aren’t either. It is essentially a risk barometer. If ETH is performing relative to Bitcoin, that means it’s usually altcoin season. But there’s barely been a glimmer of altcoin season thus far.
Bitcoin being the primary market driver performing so well and reaching all-time highs could have carried Ethereum higher during what for Ether might have been a bear market rally and failure to reach new all-time highs. Later, I explore the cyclical market conditions for this happening using Elliott Wave Principle, but for now lets look at what Ether’s teetering momentum could do to the rest of crypto.
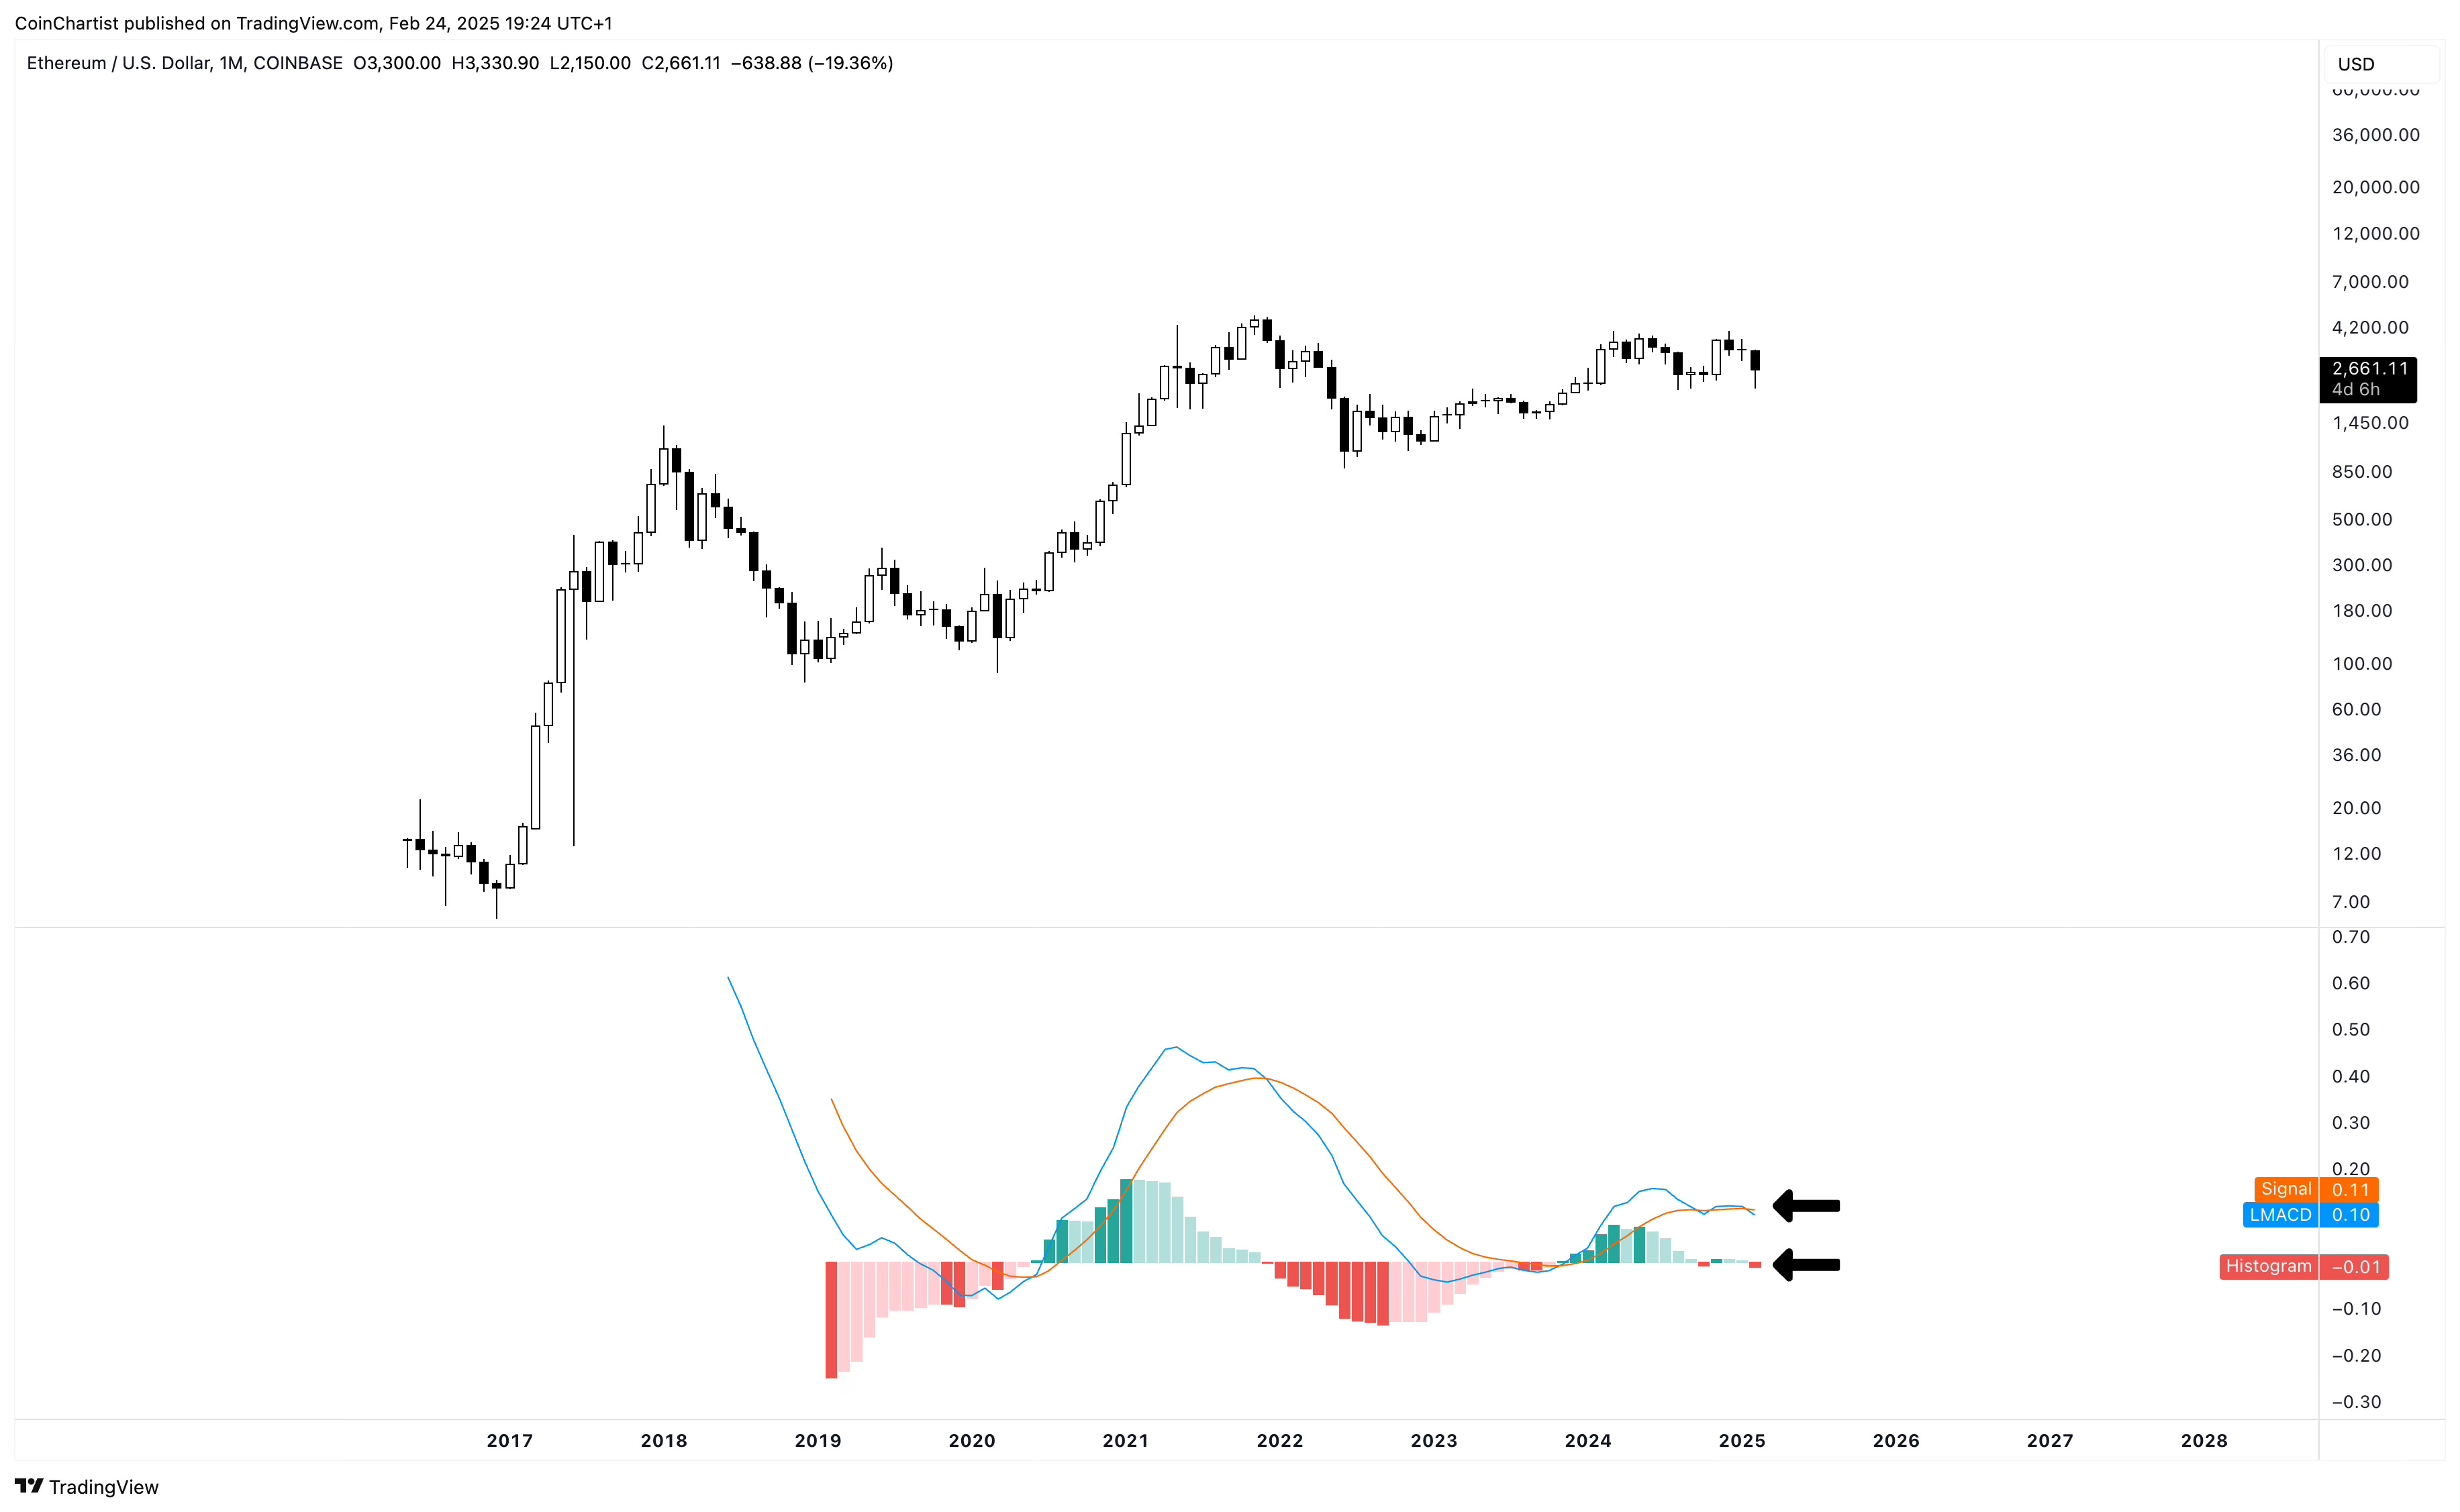
Like prior TA, Ethereum could be bottoming instead of falling off a cliff. A recovery in the next 3 days into March is necessary for an ETHUSD revival. The monthly LMACD is showing a bearish crossover and dark red tick on the histogram. This can change within the next 3 days, but it doesn’t look likely and a negative monthly close could cause a high timeframe domino effect.
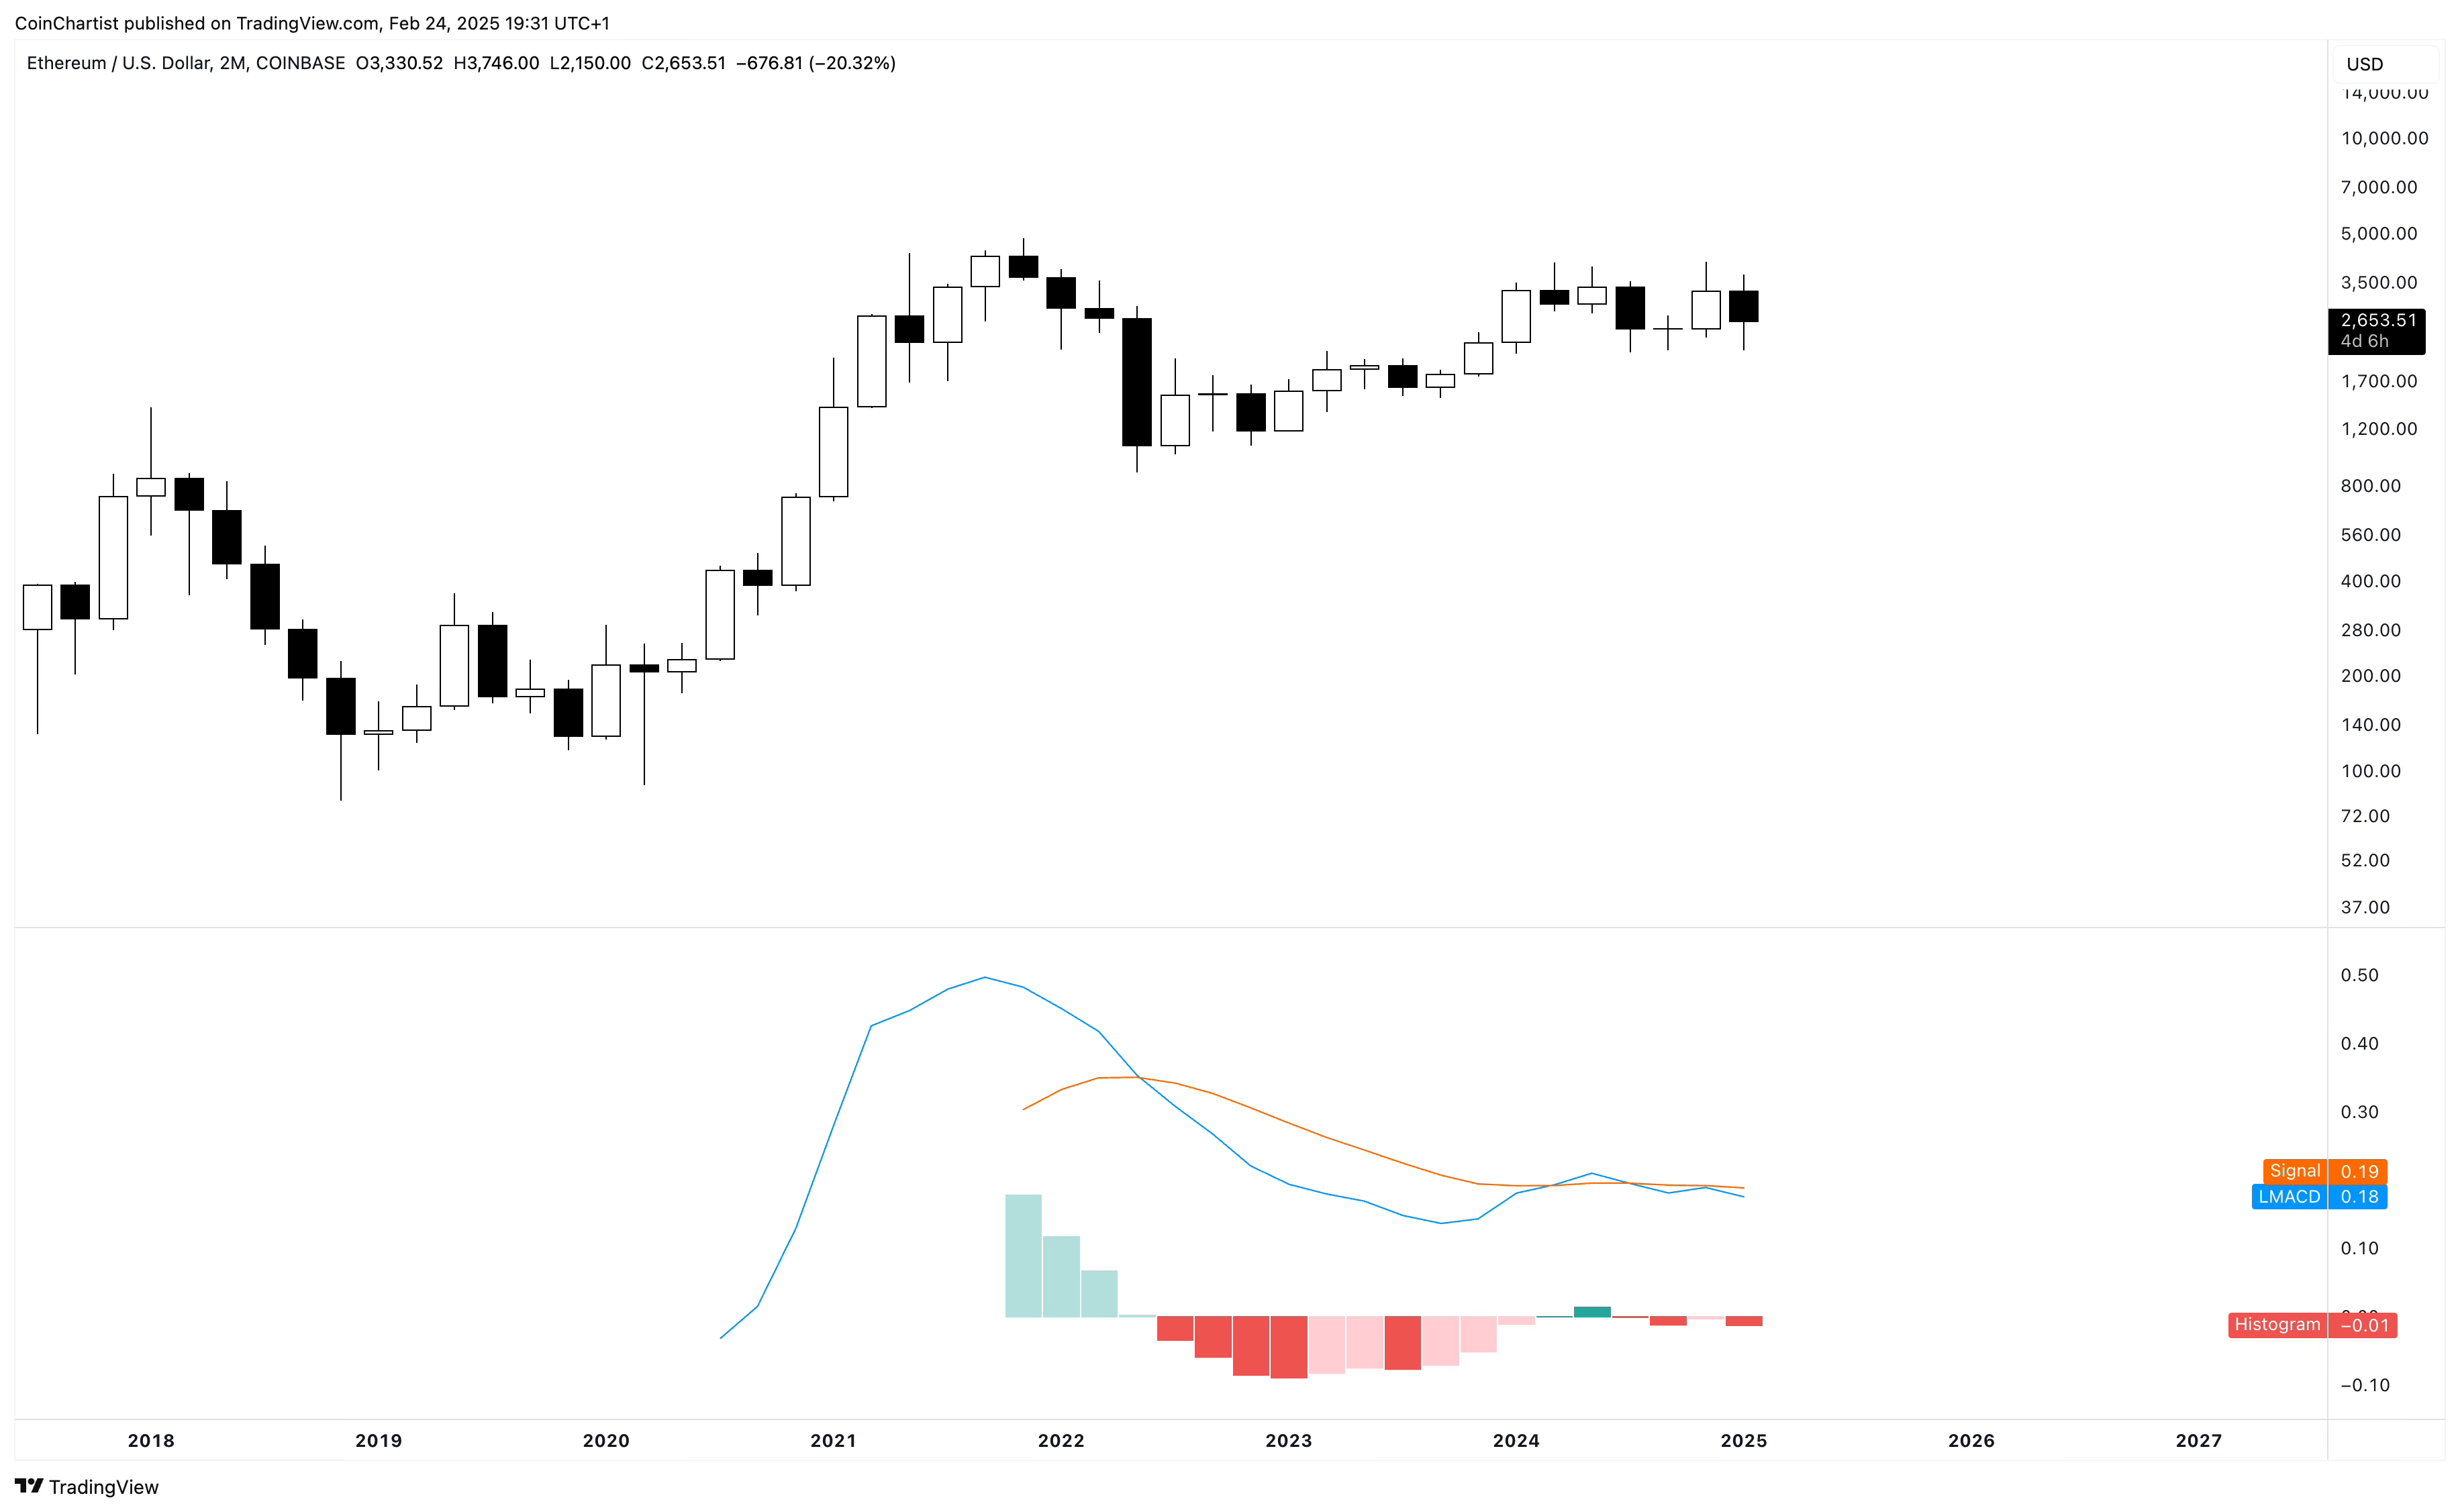
As mentioned, the 2M candlestick is also closing in 3 days. Closing at current prices or lower would add another darkening red tick on the histogram and cause the LMACD signal line to begin moving down while crossed bearish. This higher timeframe looks heavier than the monthly, but it is still a close enough call where bulls can turn the indicator back up.
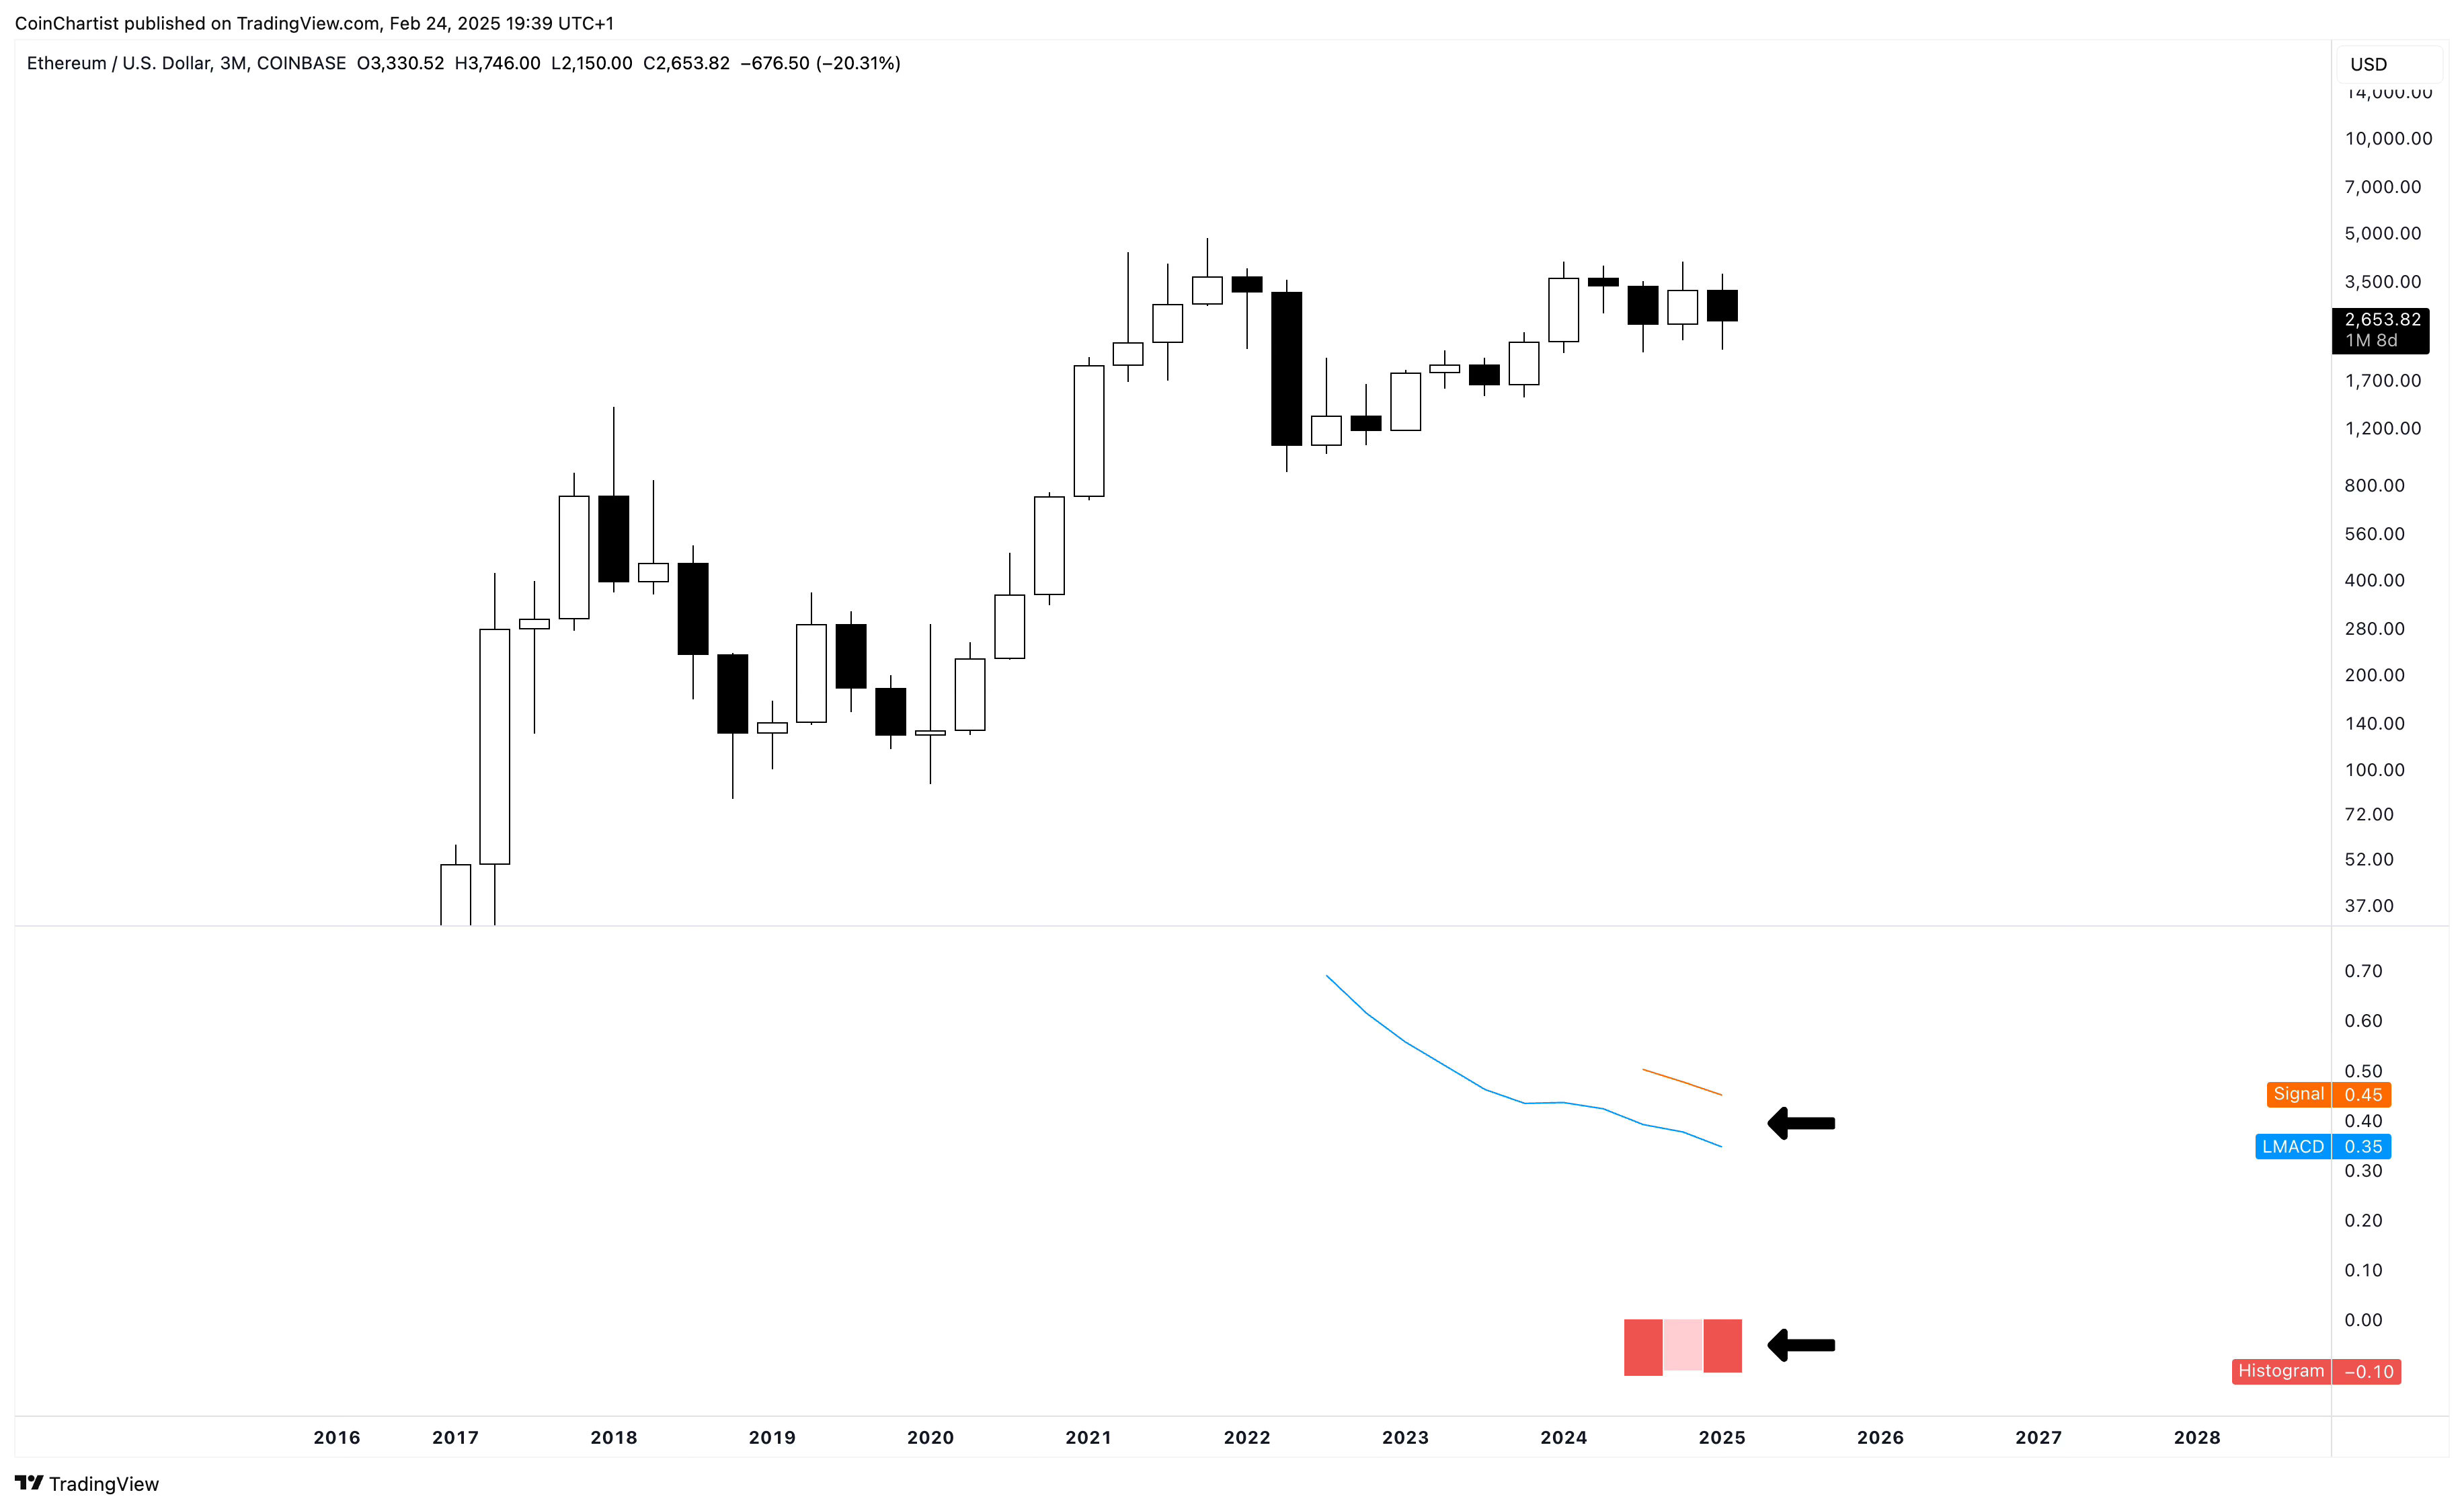
The 3M (quarterly) closes at the end of March and is even more important than the monthly or 2M. I hate to say it, but this highest timeframe is the heaviest looking of them all. The LMACD line and signal line aren’t anywhere near each other to suggest a bullish crossover is coming soon. Darkening red ticks on the histogram tend to showing strengthening bearish momentum, which is pointed to the downside. Not good.
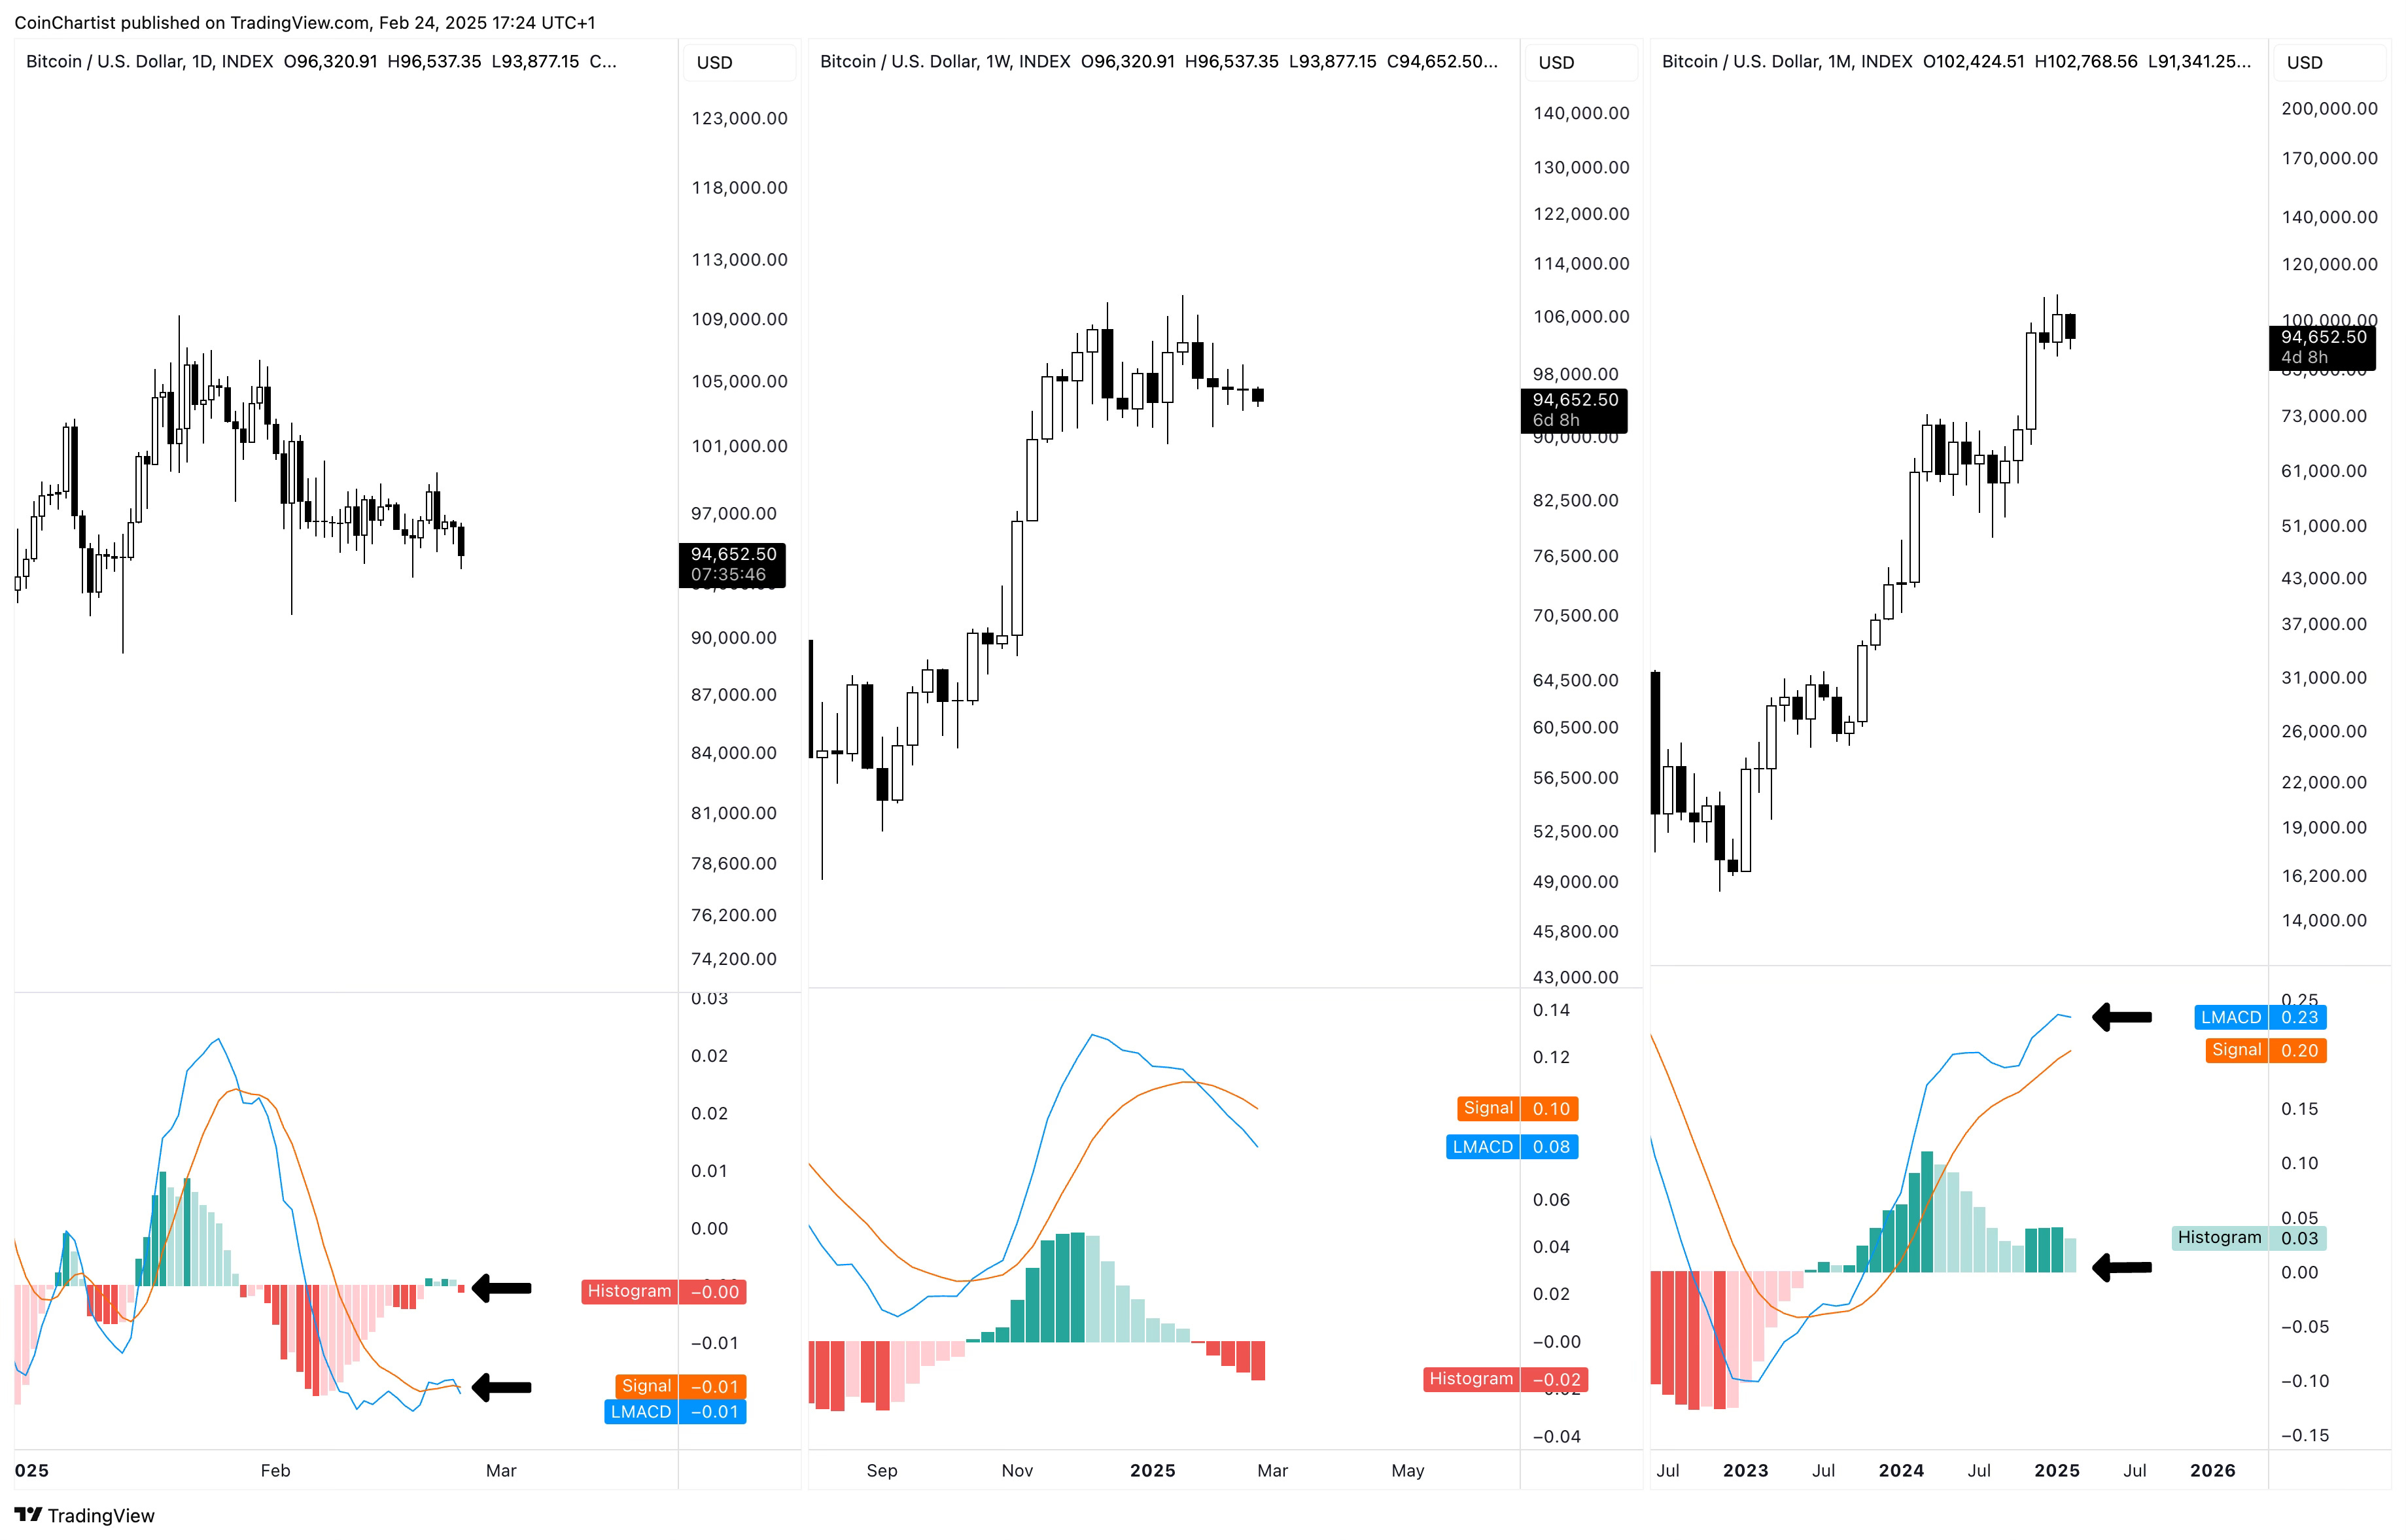
The negative sentiment surrounding the ByBit hack and what’s going on with altcoins, Ethereum, and meme coins is starting to pull Bitcoin’s momentum down. On the left, we have the daily starting to cross bearish. The middle shows the weekly with several weeks of increasing bearish momentum – ticks will have to turn pink before we see a reversal. On the right, we have the monthly, which is starting to inch closer toward a bearish crossover. The LMACD line is starting to curl downward and the histogram is showing a light green tick highlighting weakening bullish momentum. Weak bullish momentum can quickly turn into bearish momentum with a crossover.
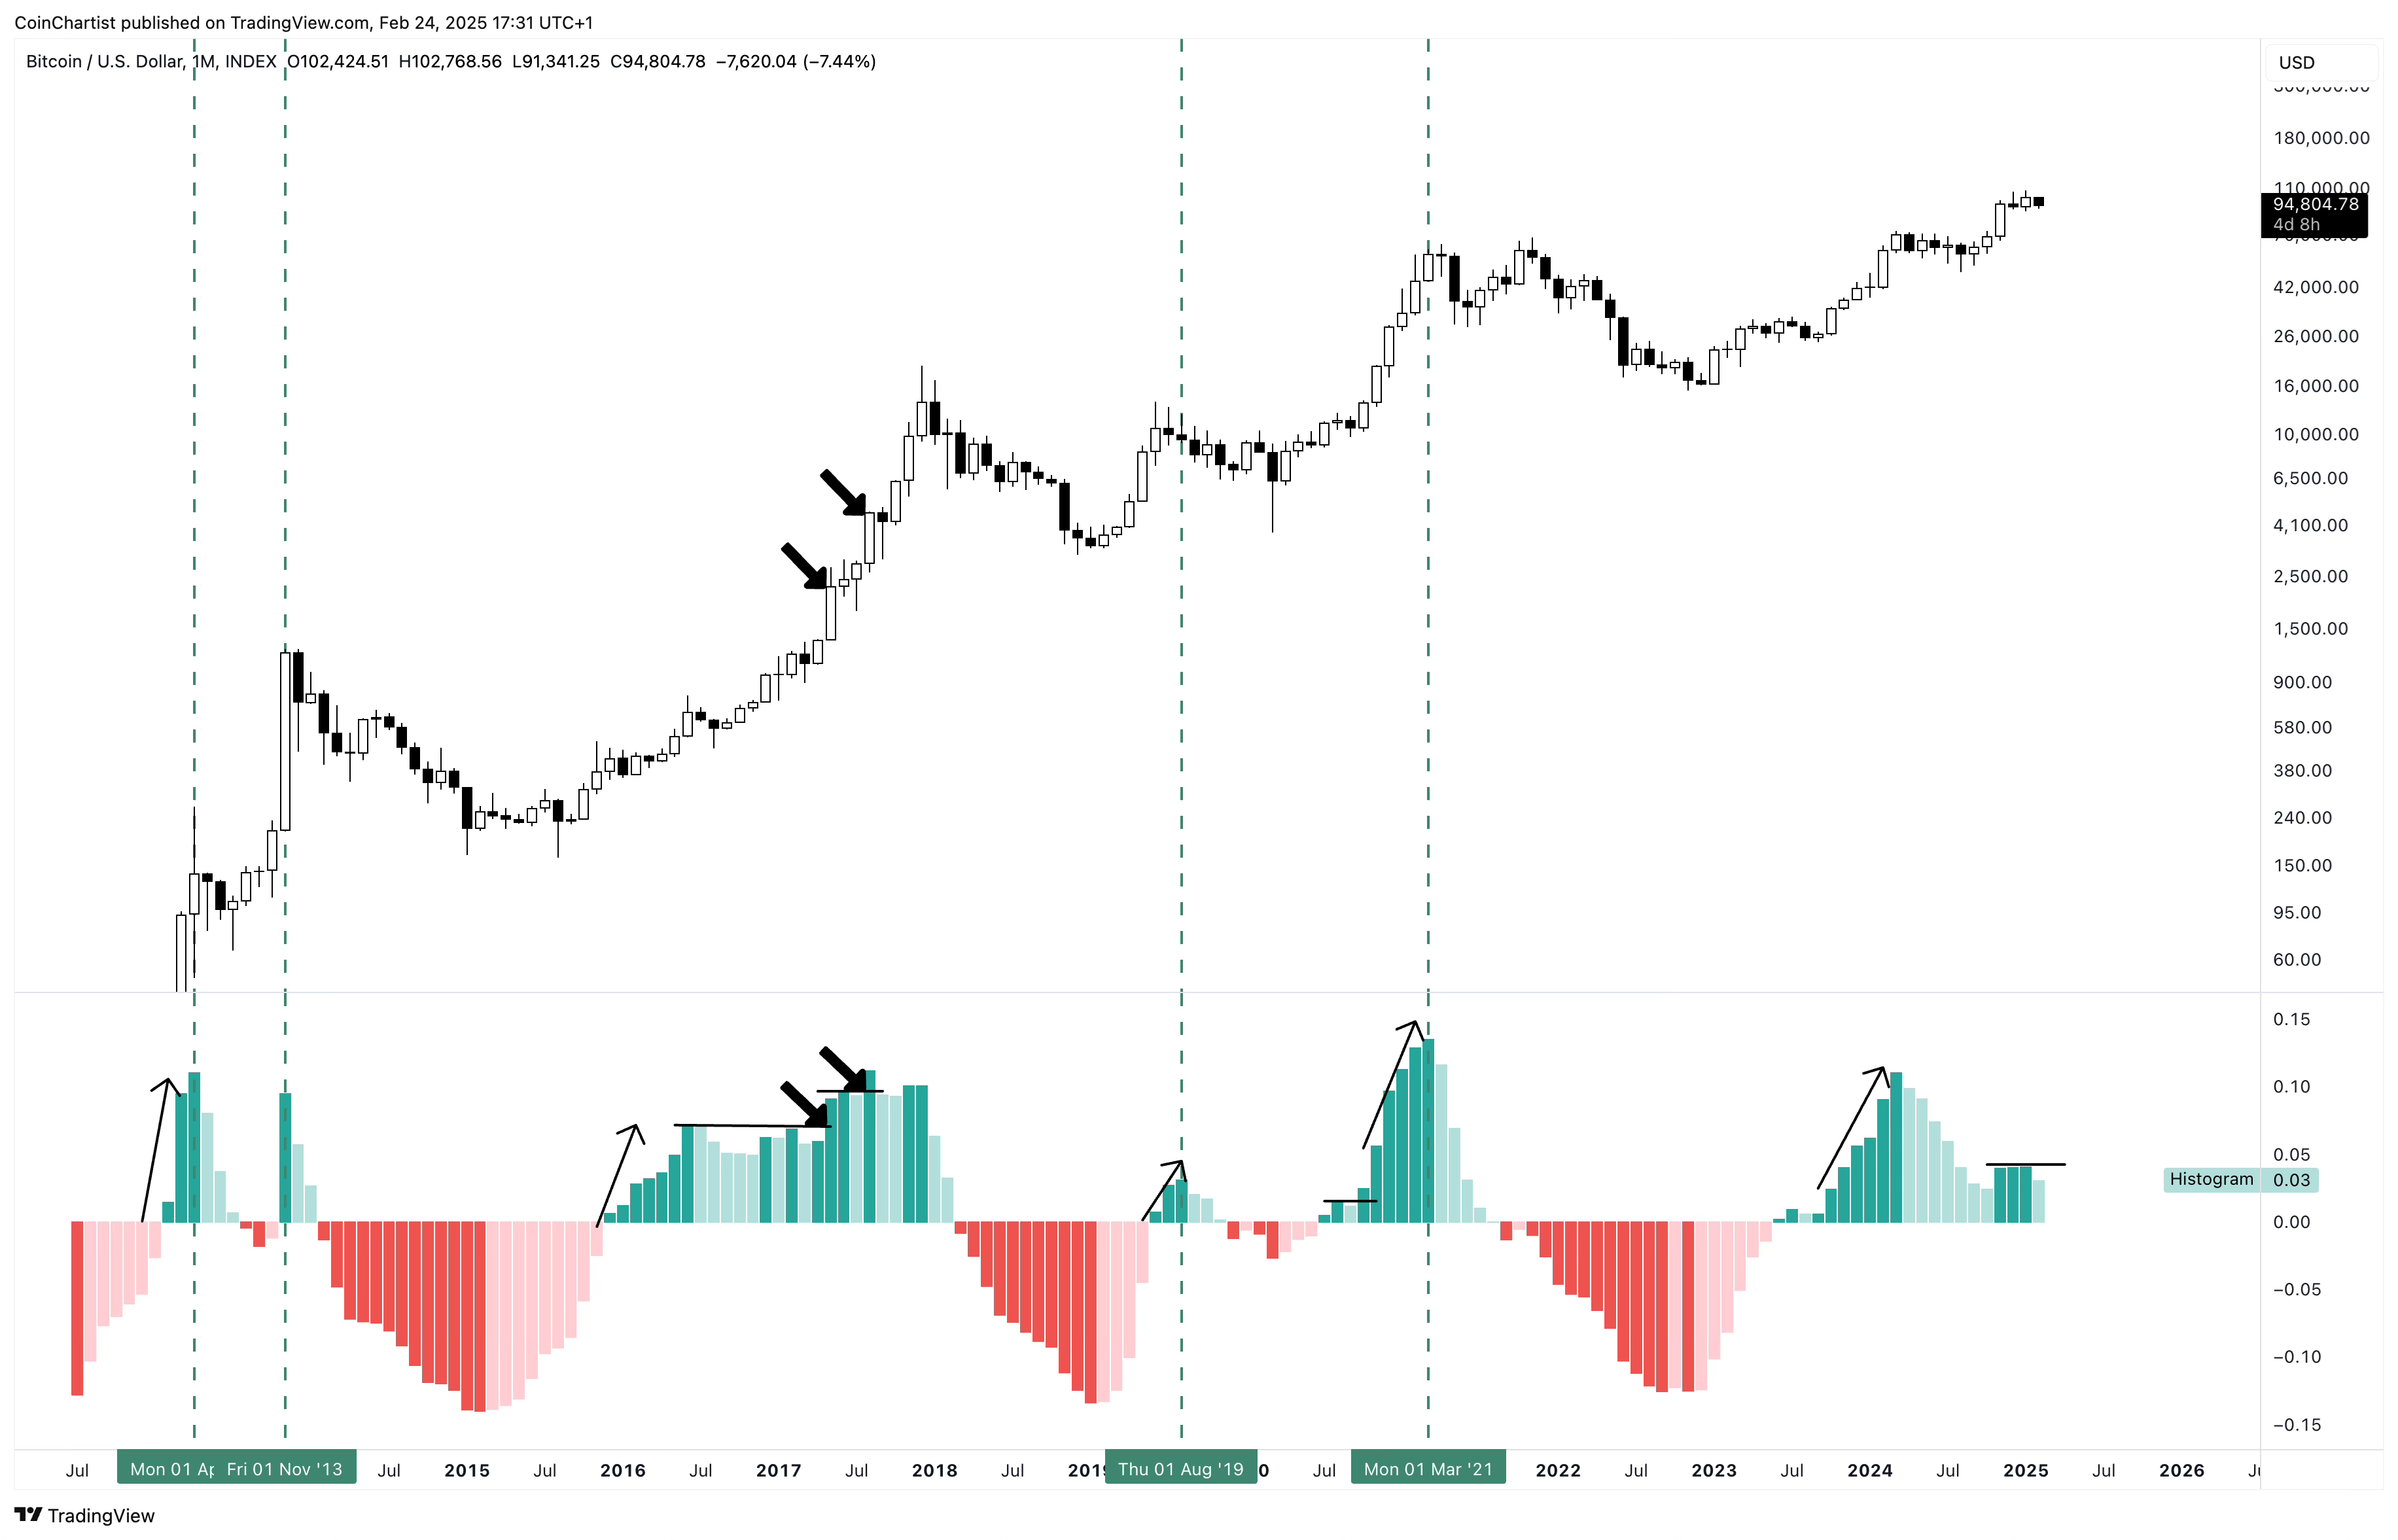
If February leaves a light green tick on the histogram, it could mean a bear market is starting in Bitcoin. In 2017, this recurring behavior was different, with several instances where the LMACD histogram made sudden higher highs after beginning to weaken. This scenario is still possible, but history shows this isn’t the norm, and instead was an outlier. If the LMACD histogram can make a higher high, it could lead to a strong move up. Turning red would signal a bear market.
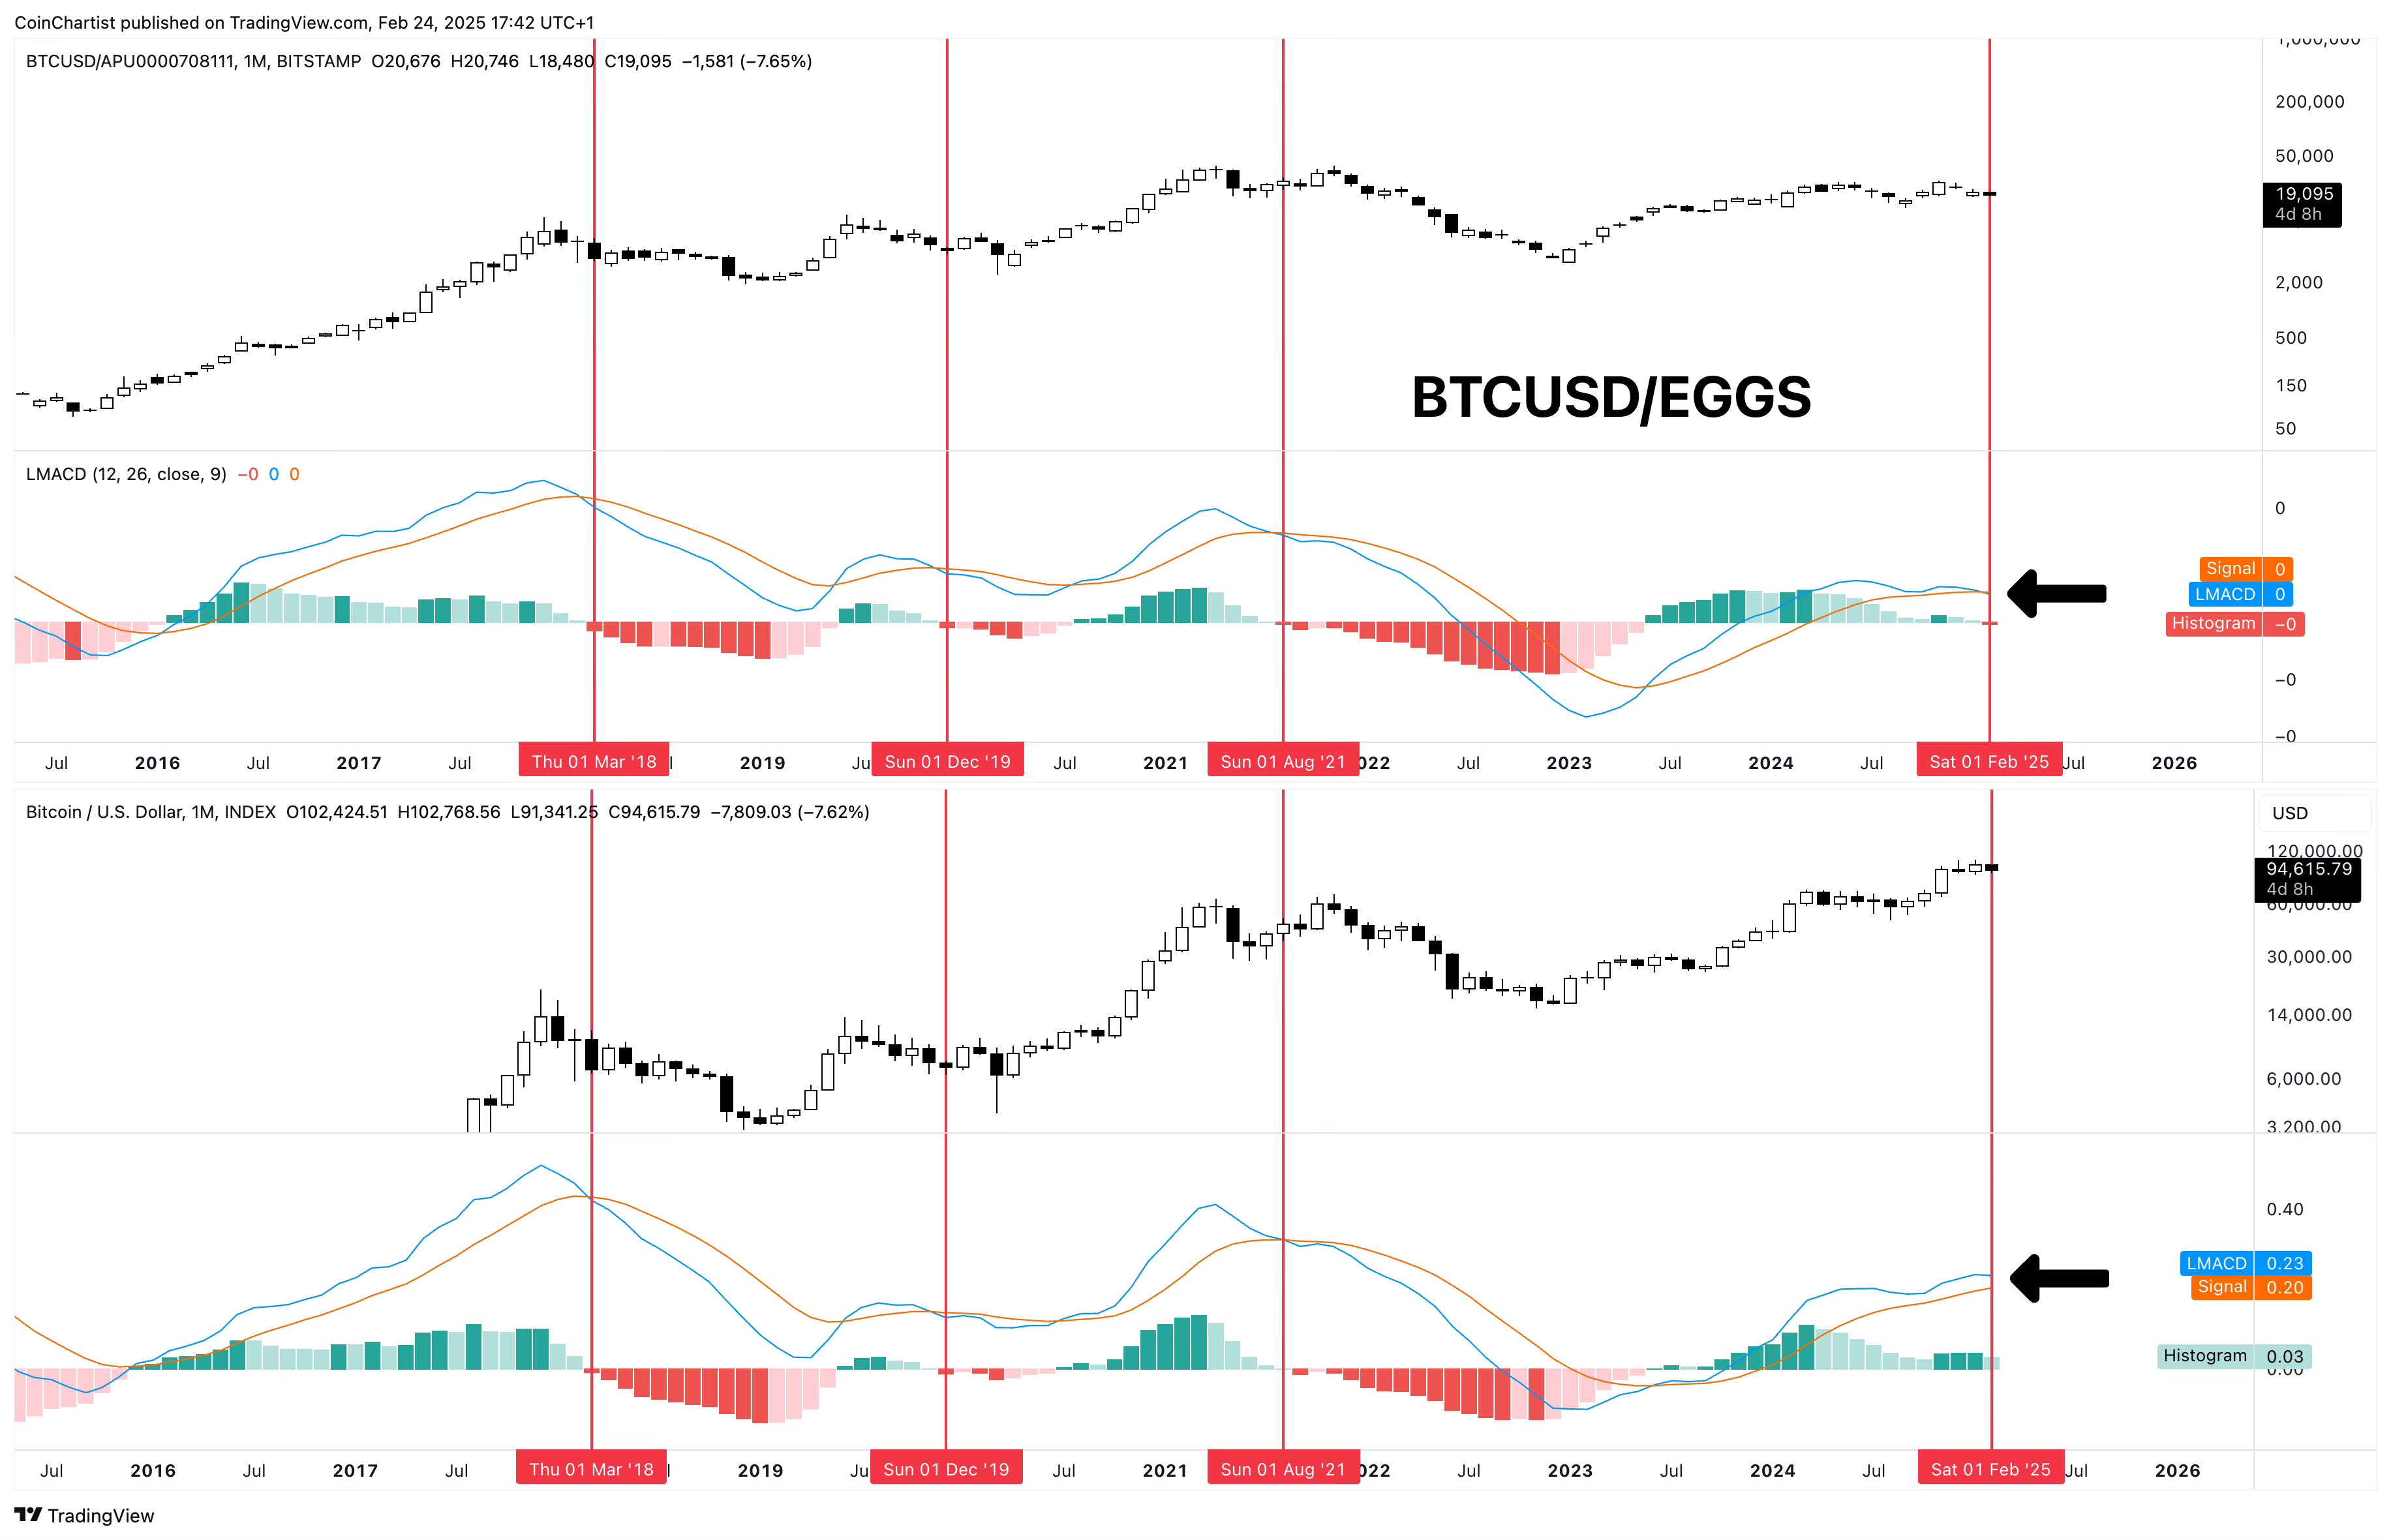
Eggs just hit a new all-time high. This food staple charted against Bitcoin as a ratio could be telling us early that a bear market is coming. I know it’s an unusual one, but I cannot unsee the chart. If we look at past red vertical lines, a bear market always started when the LMACD of BTCUSD/EGGS crossed bearish on the monthly. I’ve added the regular BTCUSD chart and its LMACD at the bottom for comparison. Notice how all past peaks were 1:1 with eggs. This cycle, however, BTCUSD/EGGS is crossing bearish this month in February, while the regular BTCUSD chart is still showing a green histogram and lack of bear crossover. Which chart is telling us the truth?
Riding the waves in choppy waters
The above technicals are telling us momentum is turning over, especially in Ethereum and altcoins. Bitcoin being so far along into its bull market has it looking closer to being finished with its cycle than most want to admit. The idea Bitcoin could have topped without any glimmer of an altcoin season is a difficult reality for any to stomach. This would mean most crypto holders missed the bull market completely or worse, took losses during it because their altcoin of choice didn’t rally.
The answer could have been in the Elliott Wave Principle textbook all along in plain sight. Whether it is me talking or another analyst who practices Elliott Wave Principle, there is a broad consensus that Bitcoin is in its fifth wave. Bitcoin being in its fifth wave could be the answer to the lack of an altcoin season.
Late into the EW textbook, there’s a section that discusses performing wave counts on individual stocks and recommends against it. It states that while some stocks display some wave structure and personality, there isn’t enough human participation and growth associated with the individual stock to apply a methodology designed for mass crowd psychology. EW counts should be performed on major stock indexes, like the S&P 500, Dow Jones, and the Nasdaq. These counts better reflect the crowd and its moods.
When an index is in its fifth wave, individual stocks don’t perform anywhere near as well as they did in the past due to a lack of breadth associated with bull markets. Third waves experience so much breadth and participation, it adds to the expectation that this should happen again in the next wave up. Only select stocks will perform during this final fifth wave.
This all should sound familiar. This is precisely what’s been happening in the stock market and in crypto. Major stock indexes repeatedly make new all-time highs while individual stocks struggle. There are constant complaints about the lack of breadth.
Bitcoin isn’t an index, but as the primary market driver and crypto industry benchmark, it replaces an index. Bitcoin and the one major index, TOTAL, which is the total crypto market cap both display similar wave counts. Due to Bitcoin’s dominance, it has the biggest influence on TOTAL. If our crypto “indexes” are in a fifth wave, shouldn’t we also expect a lack of participation in the cryptocurrency market, where only select altcoins perform? Once again, this should sound very familiar with the distinct lack of an altcoin season.
The content below is designed to do my very best to provide evidence that supports the above statements about Bitcoin being in its fifth wave, its fifth wave being near its end, and how this may have led to many altcoins beginning an extended bear market early.

Let’s start with the basic Elliott Wave structure of five waves. This is called a motive wave or a complete market cycle. Odd numbered waves are in the direction of the trend, while even numbered waves correct the progress the previous wave made.
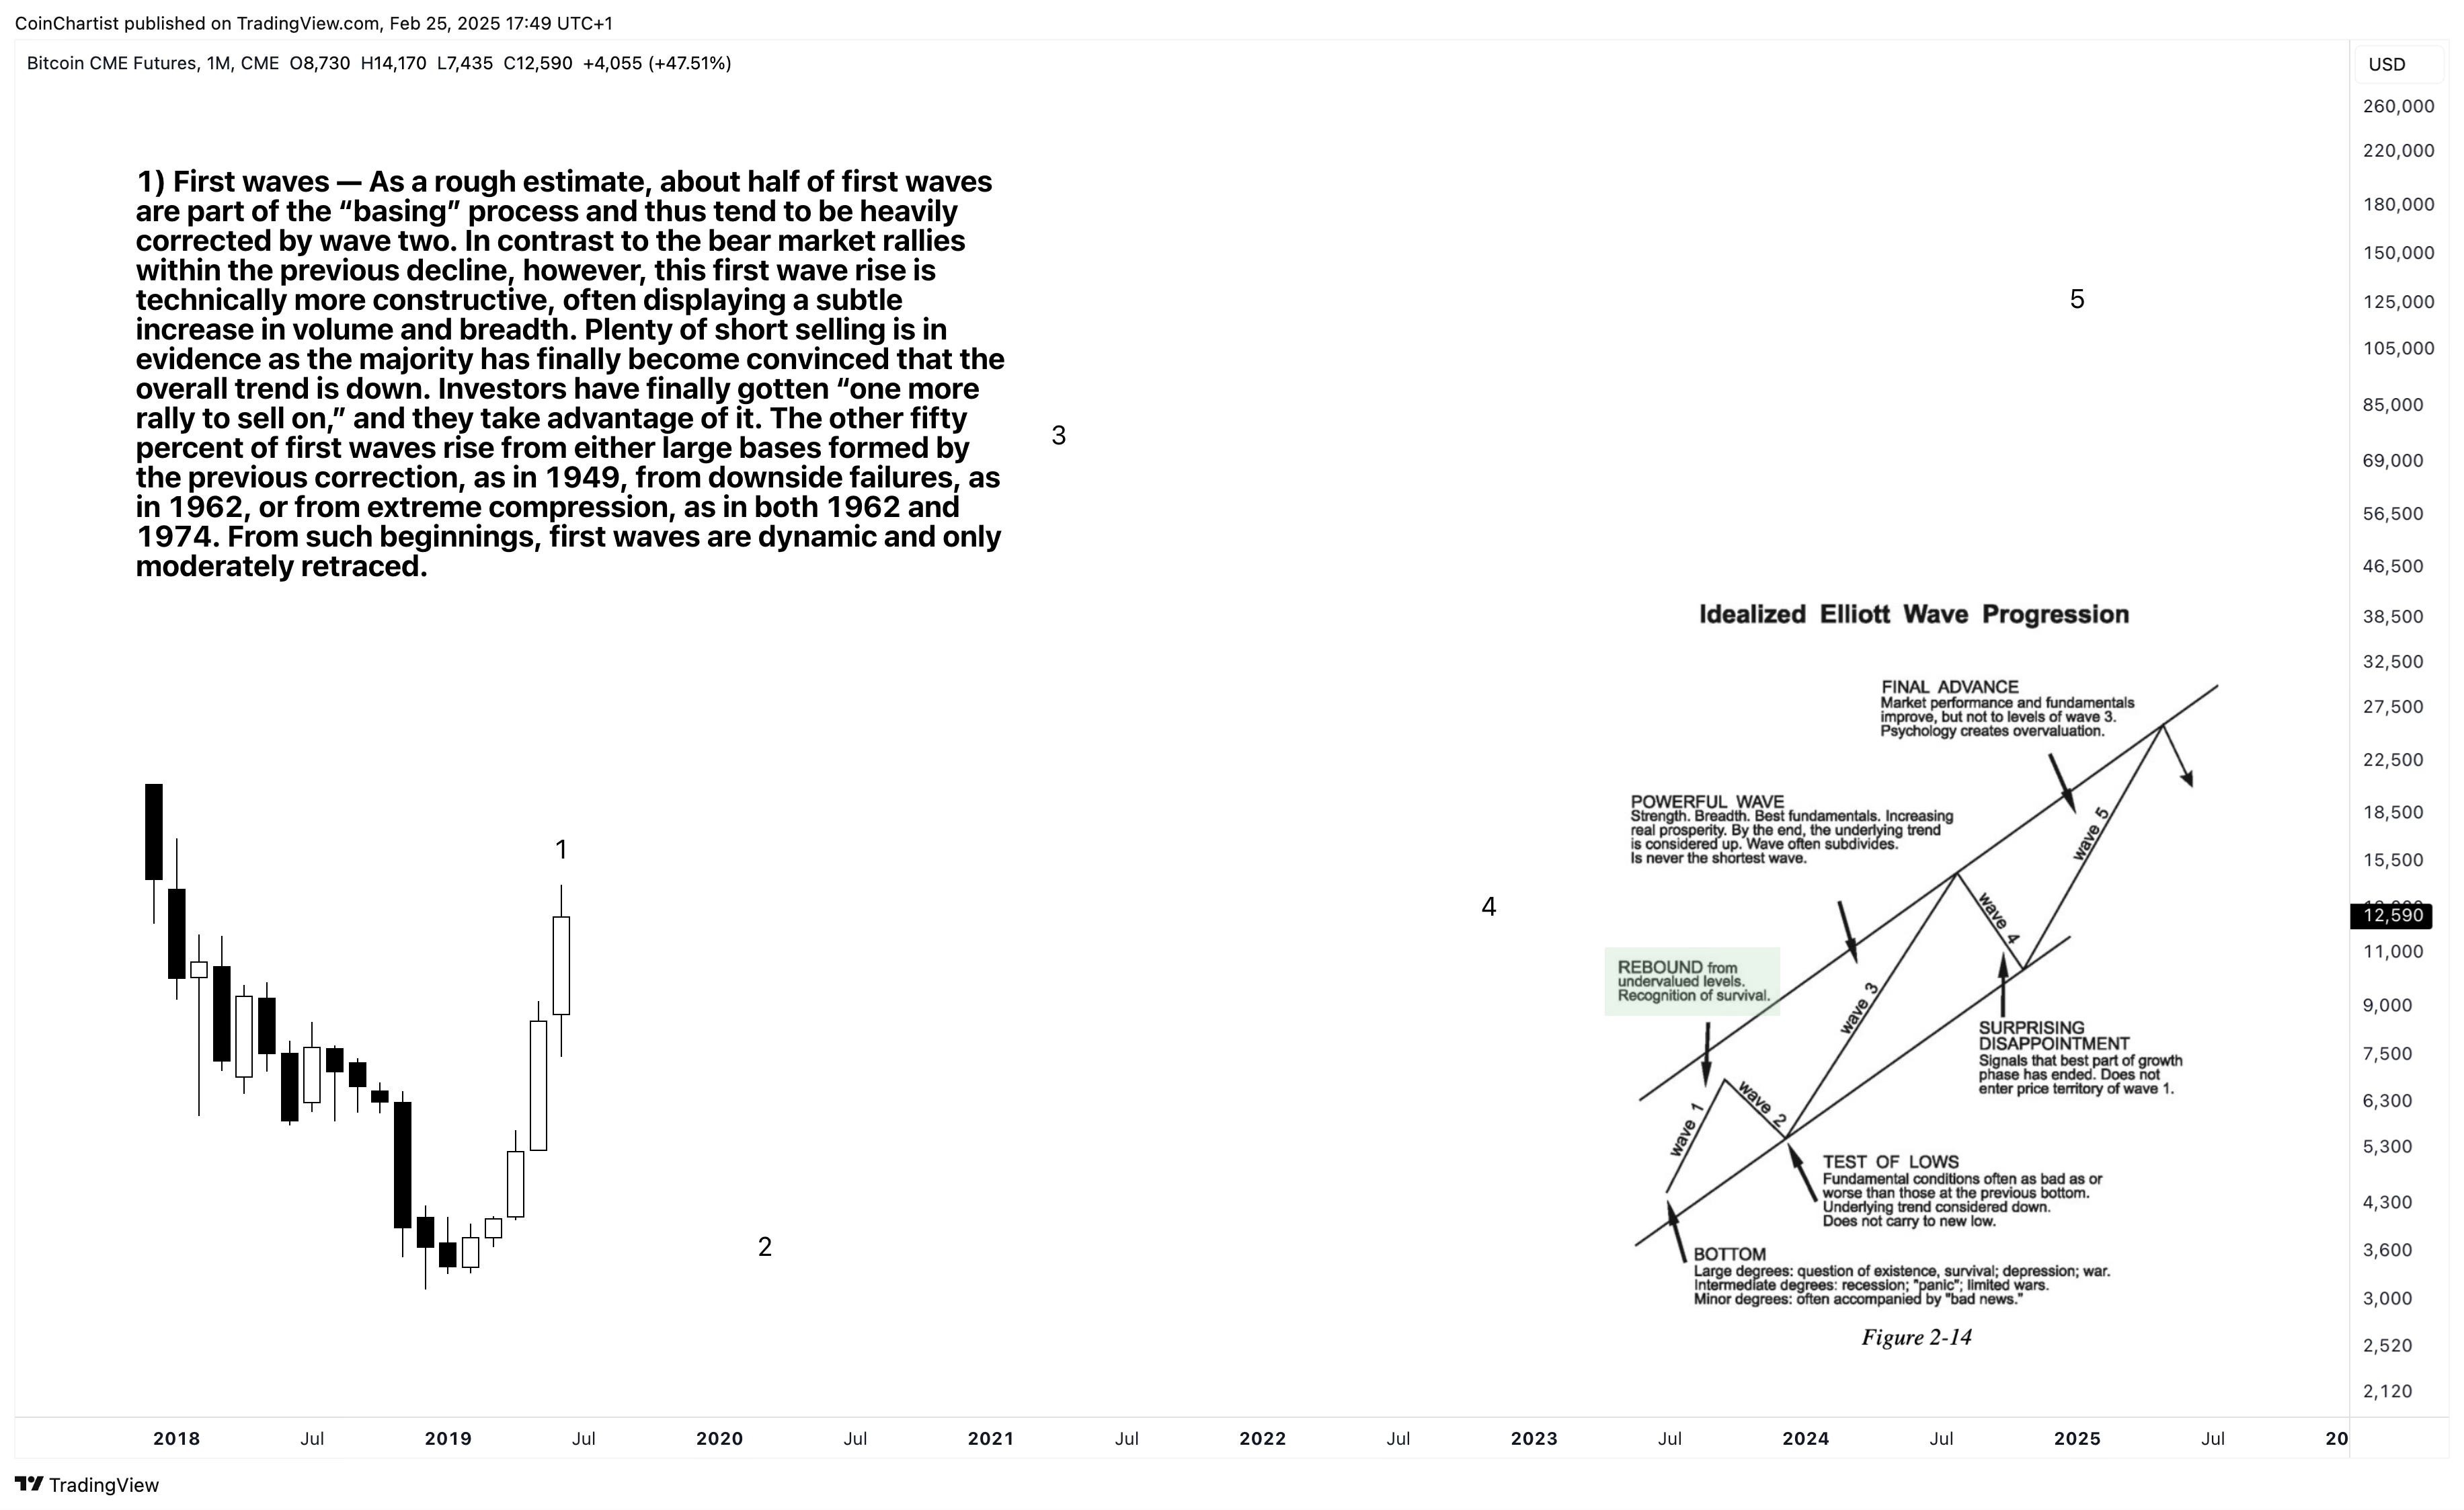
This entire structure began with a primary degree wave 1. This is described as a rebound and recognition of survival. They typically occur from a basing pattern, and give bears one more rally to sell down before the new uptrend becomes more convincing.
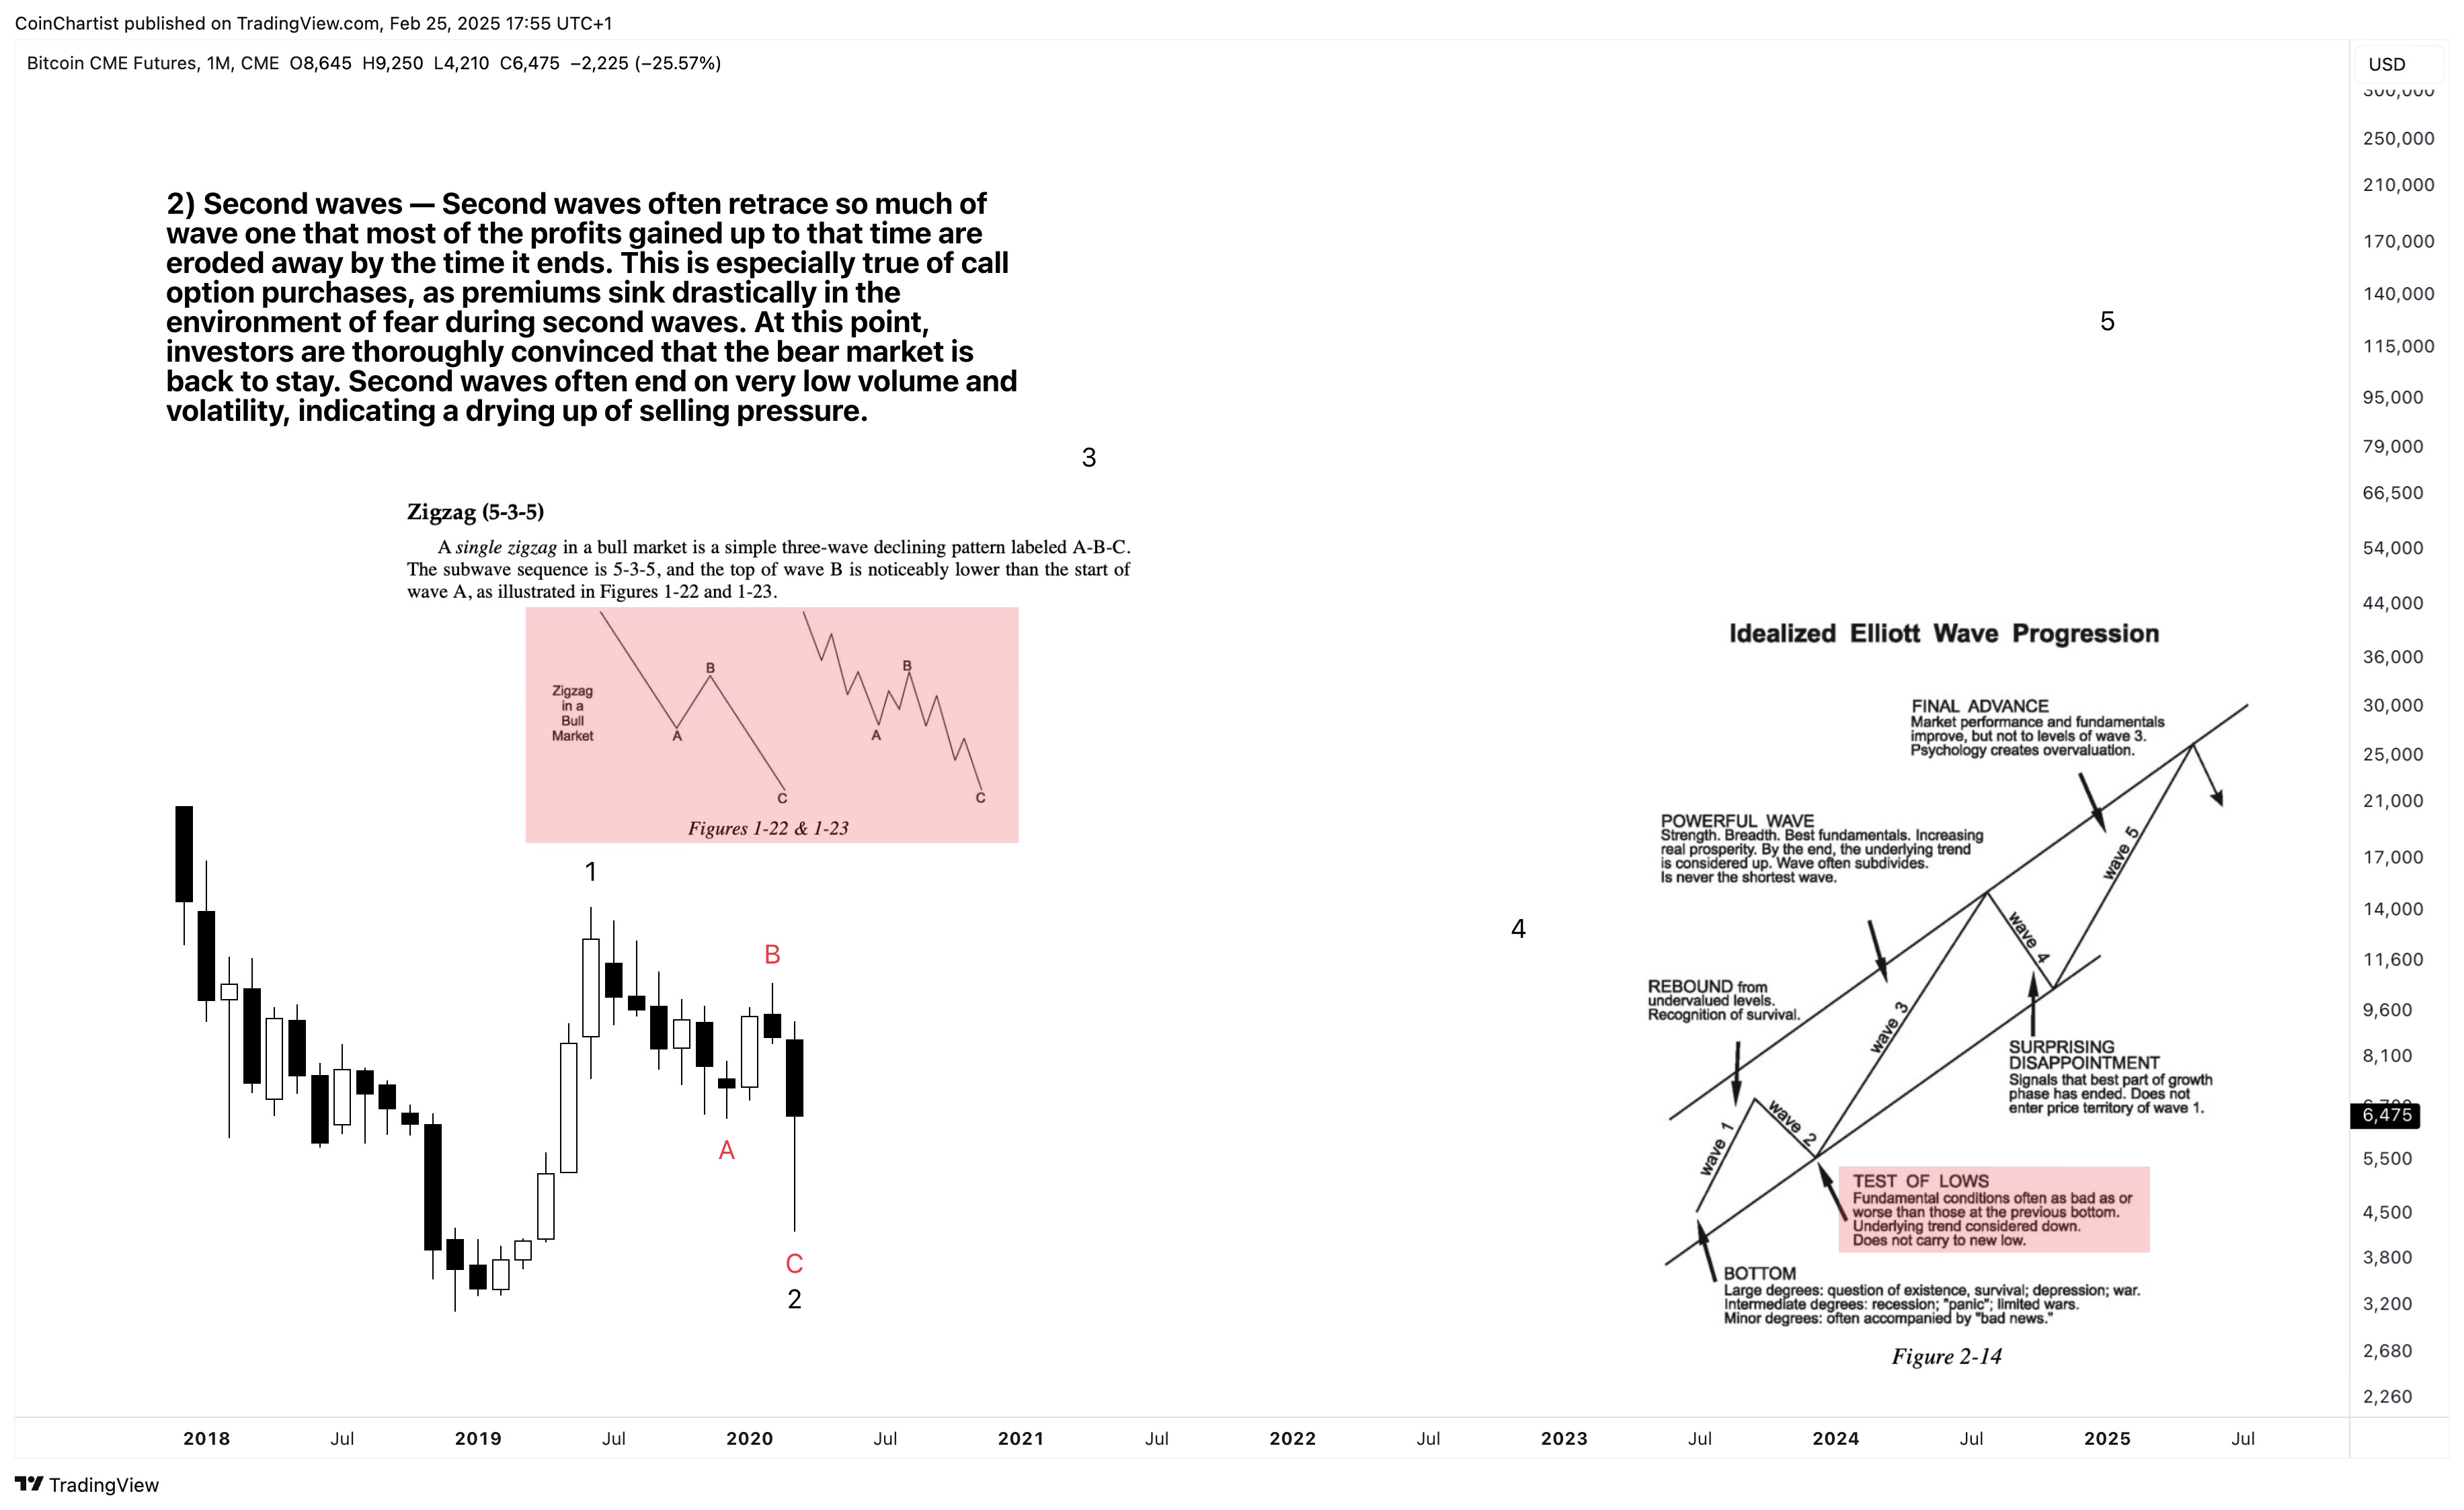
Wave 2 is a sharp correction, as they often are. Wave 2s tend to retrace most of wave 1, leaving little profitability behind. The macro environment is often worse during a wave 2 than the actual bottom. If you recall, the bottom of wave 2 was the COVID pandemic, which was significantly worse than the conditions around the bottom. However, despite the conditions, price does not carry to a new low.
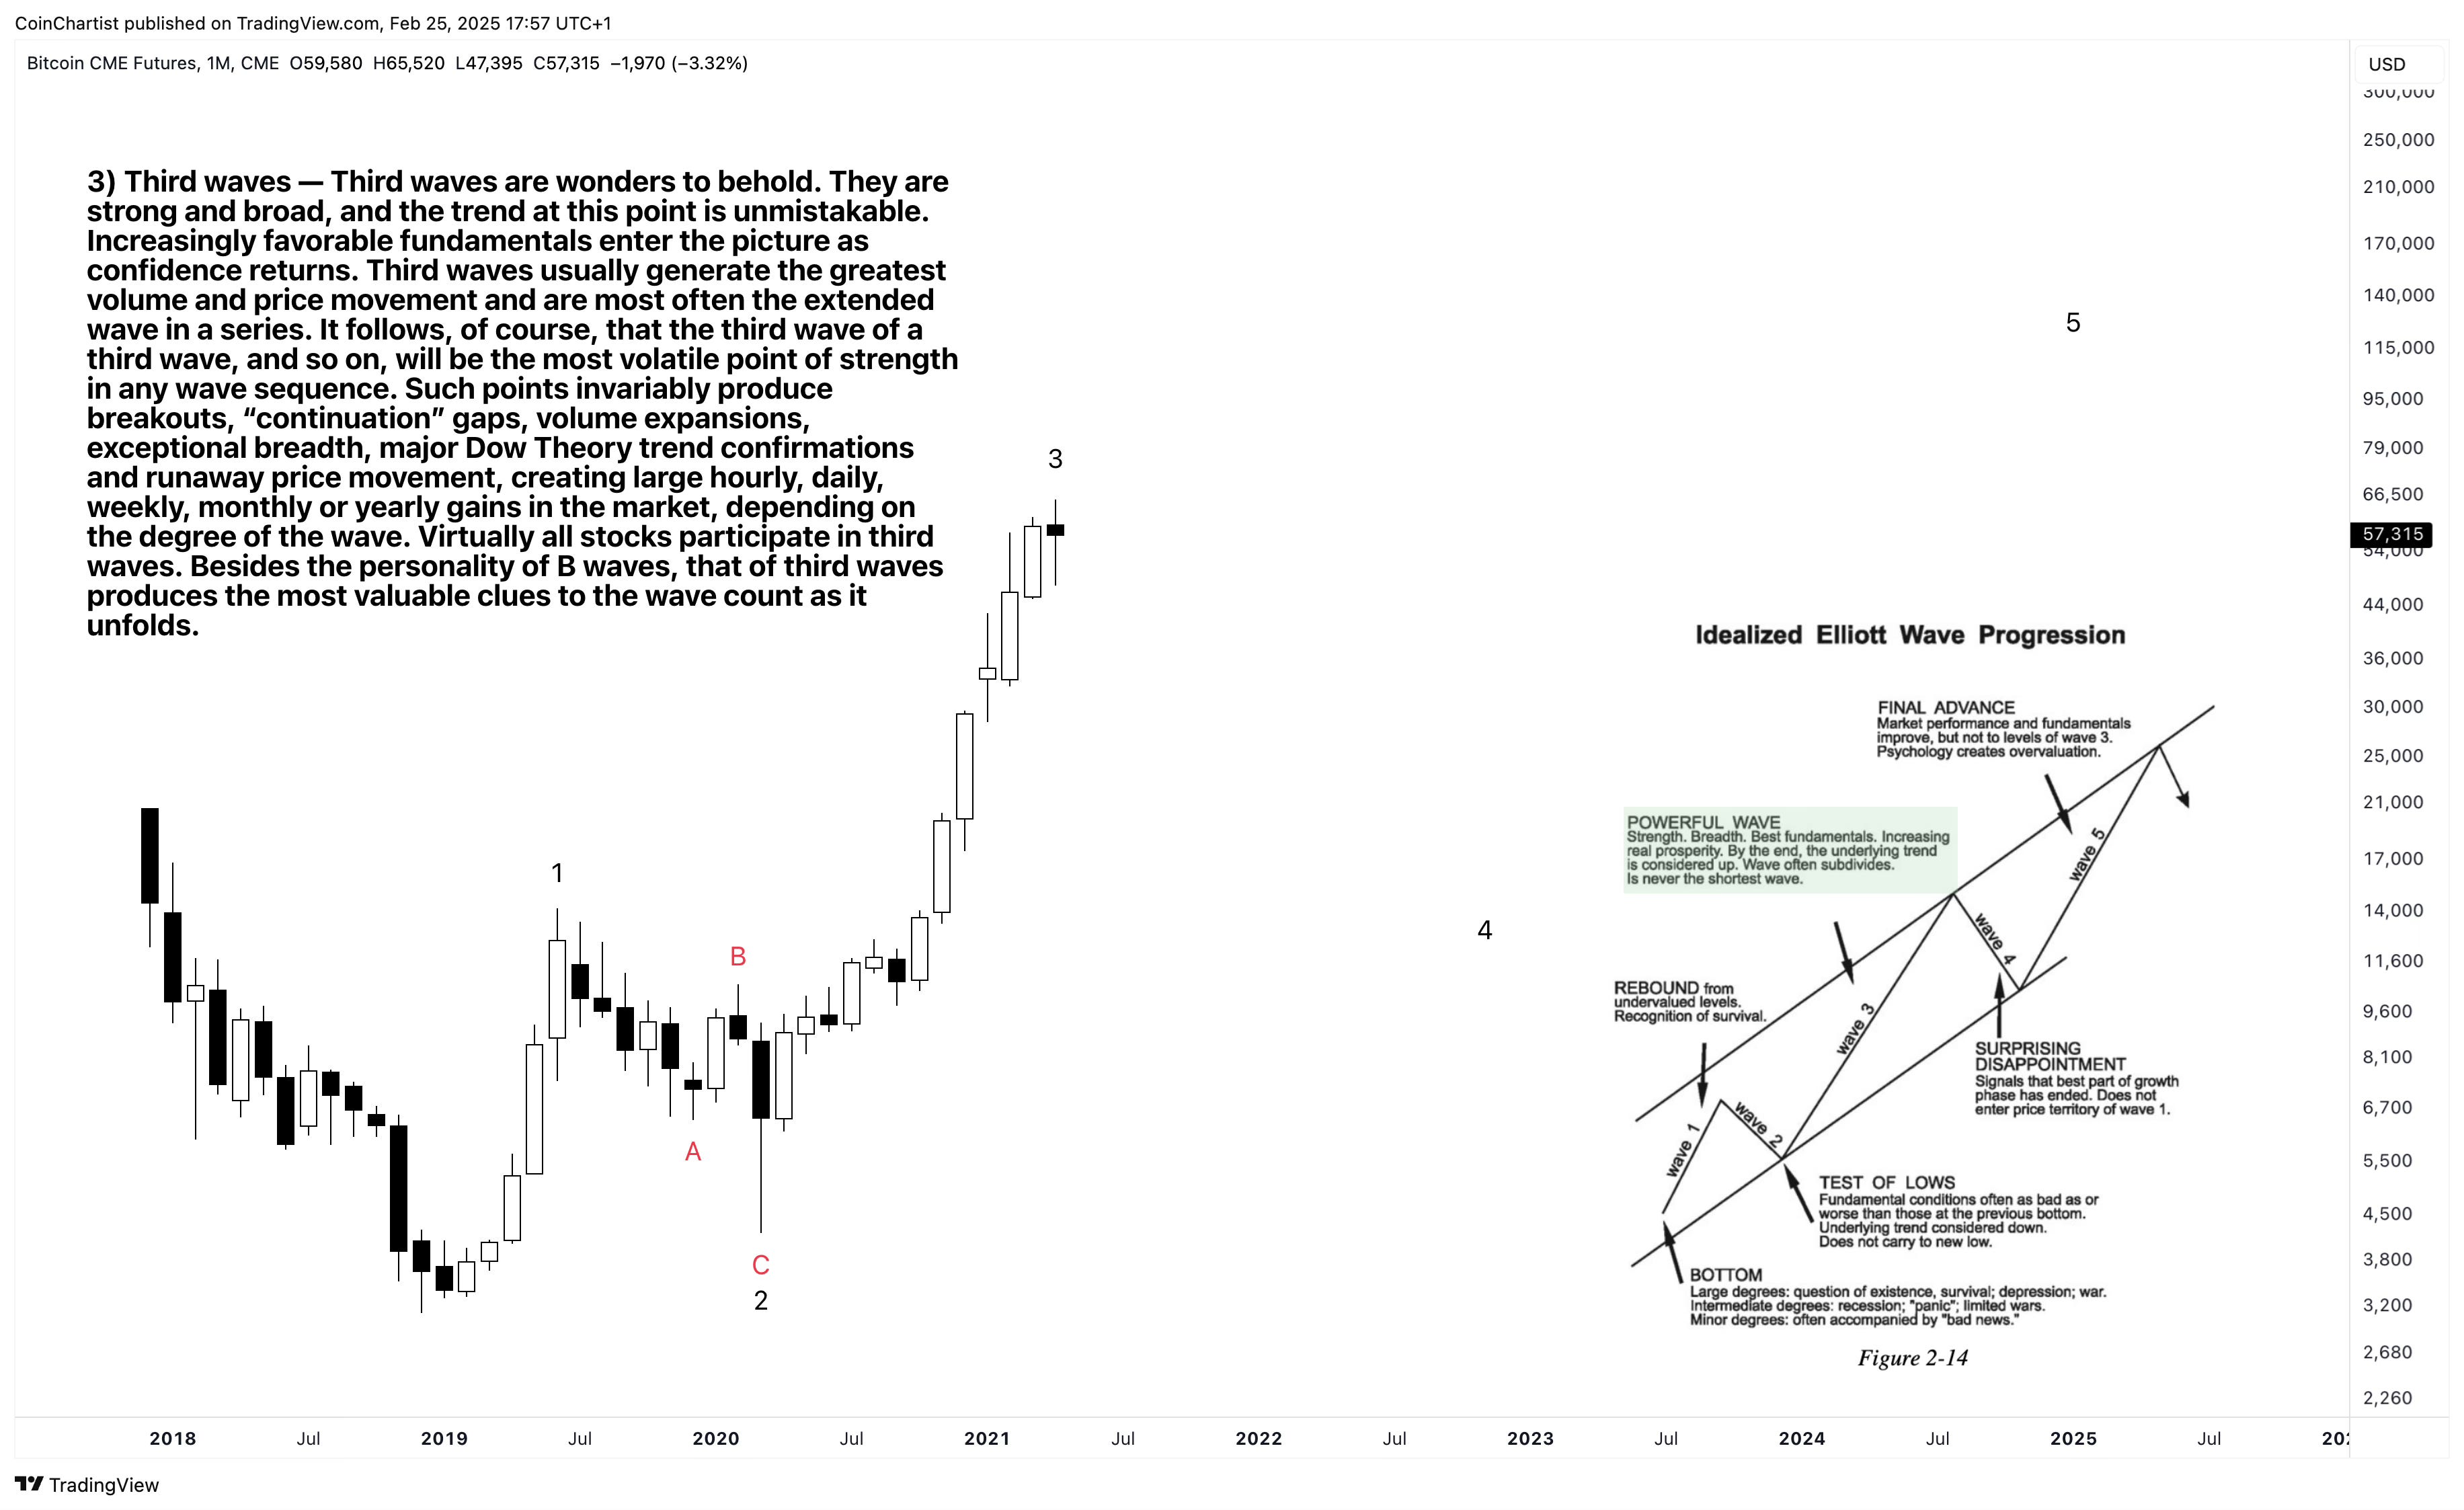
Because there wasn’t a new low even with such terrible conditions, and because of quantitative easing associated with the pandemic, a powerful wave 3 began that was undeniable. The same strong economic conditions, enthusiasm, etc. allowed for significant breadth and a massive altcoin season.
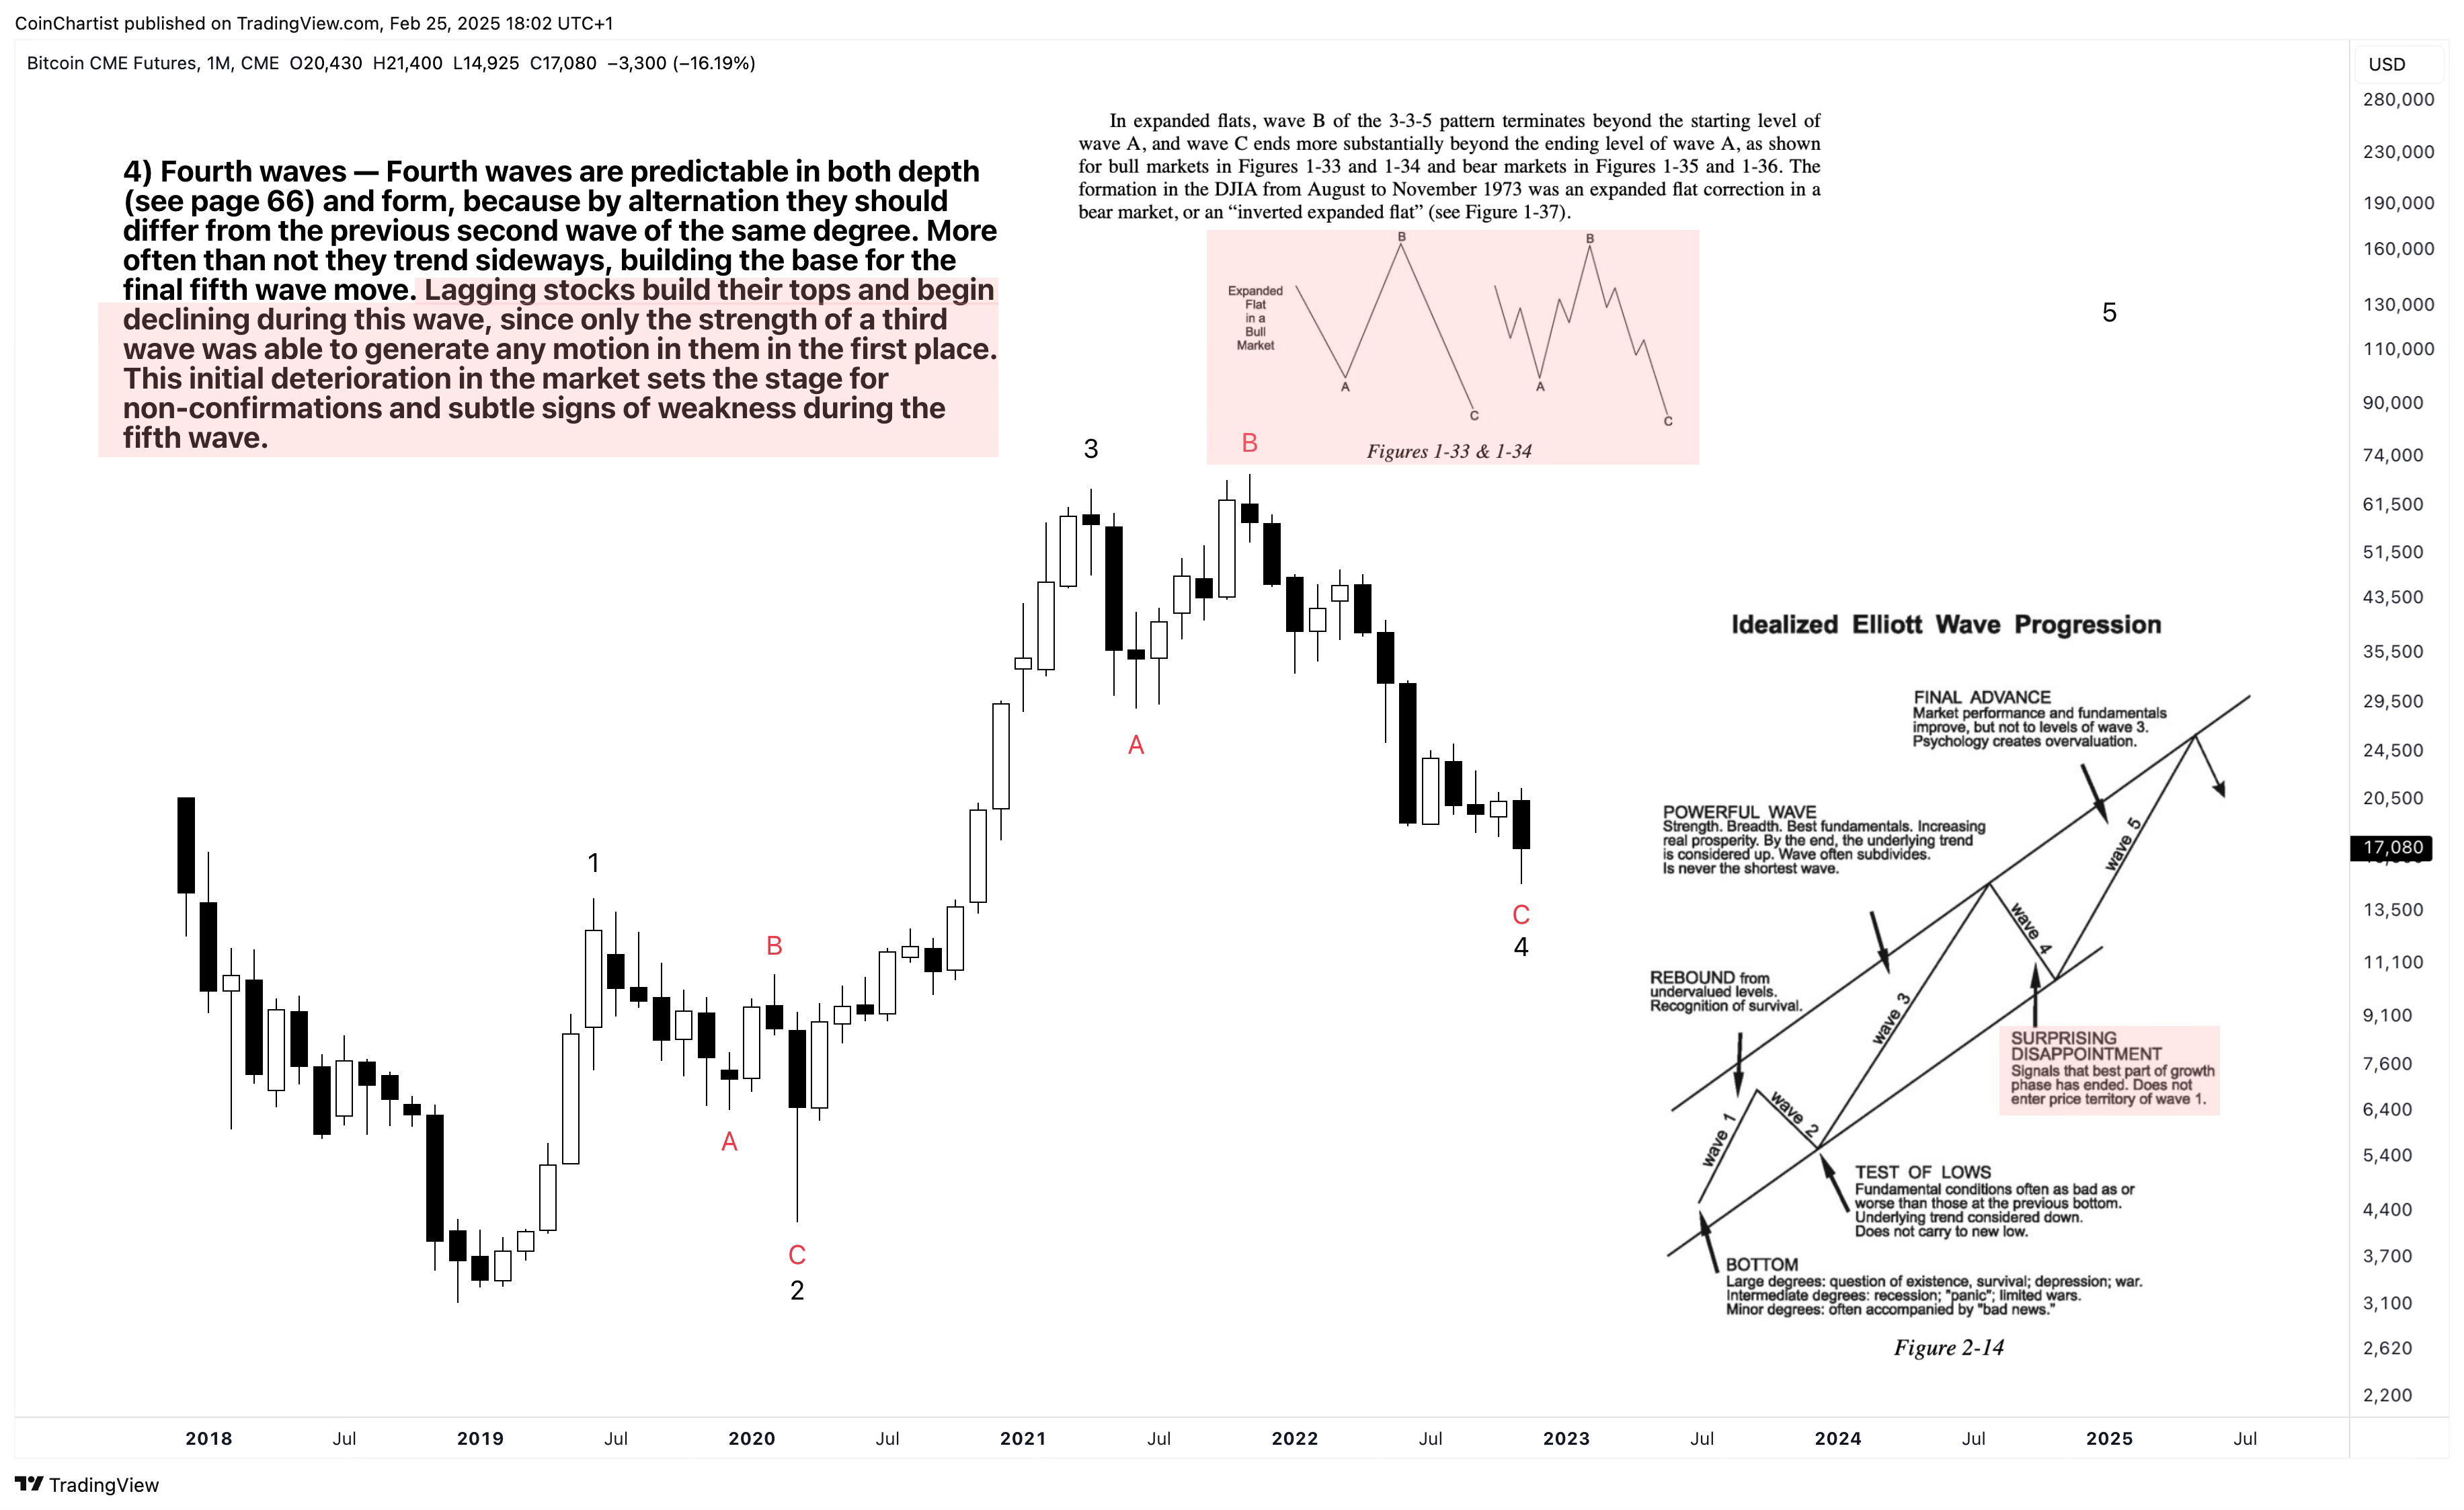
Wave 4 was indeed a surprising disappointment. Considering the strength of wave 3 and the economic backdrop, expectations of $100K+ Bitcoin were rampant. Yet Bitcoin fell to $16K instead after a failure to make a sustainable higher high. A weak higher high with non-confirmation signals such as a lack of volume is a hallmark of a B wave in a flat correction. Worse yet, we got an expanded flat in which the C wave vastly overshot the A wave. Importantly, the EW textbook states that “stocks build their tops and begin declining during this wave, since only the strength of a third wave was able to generate any motion in them in the first place.” This initial deterioration in the market sets the stage for non-confirmations and subtle signs of weakness during the fifth wave,” it continues. More simply put, the bear market in individual assets begins with wave 4 and there isn’t a proper fifth wave.
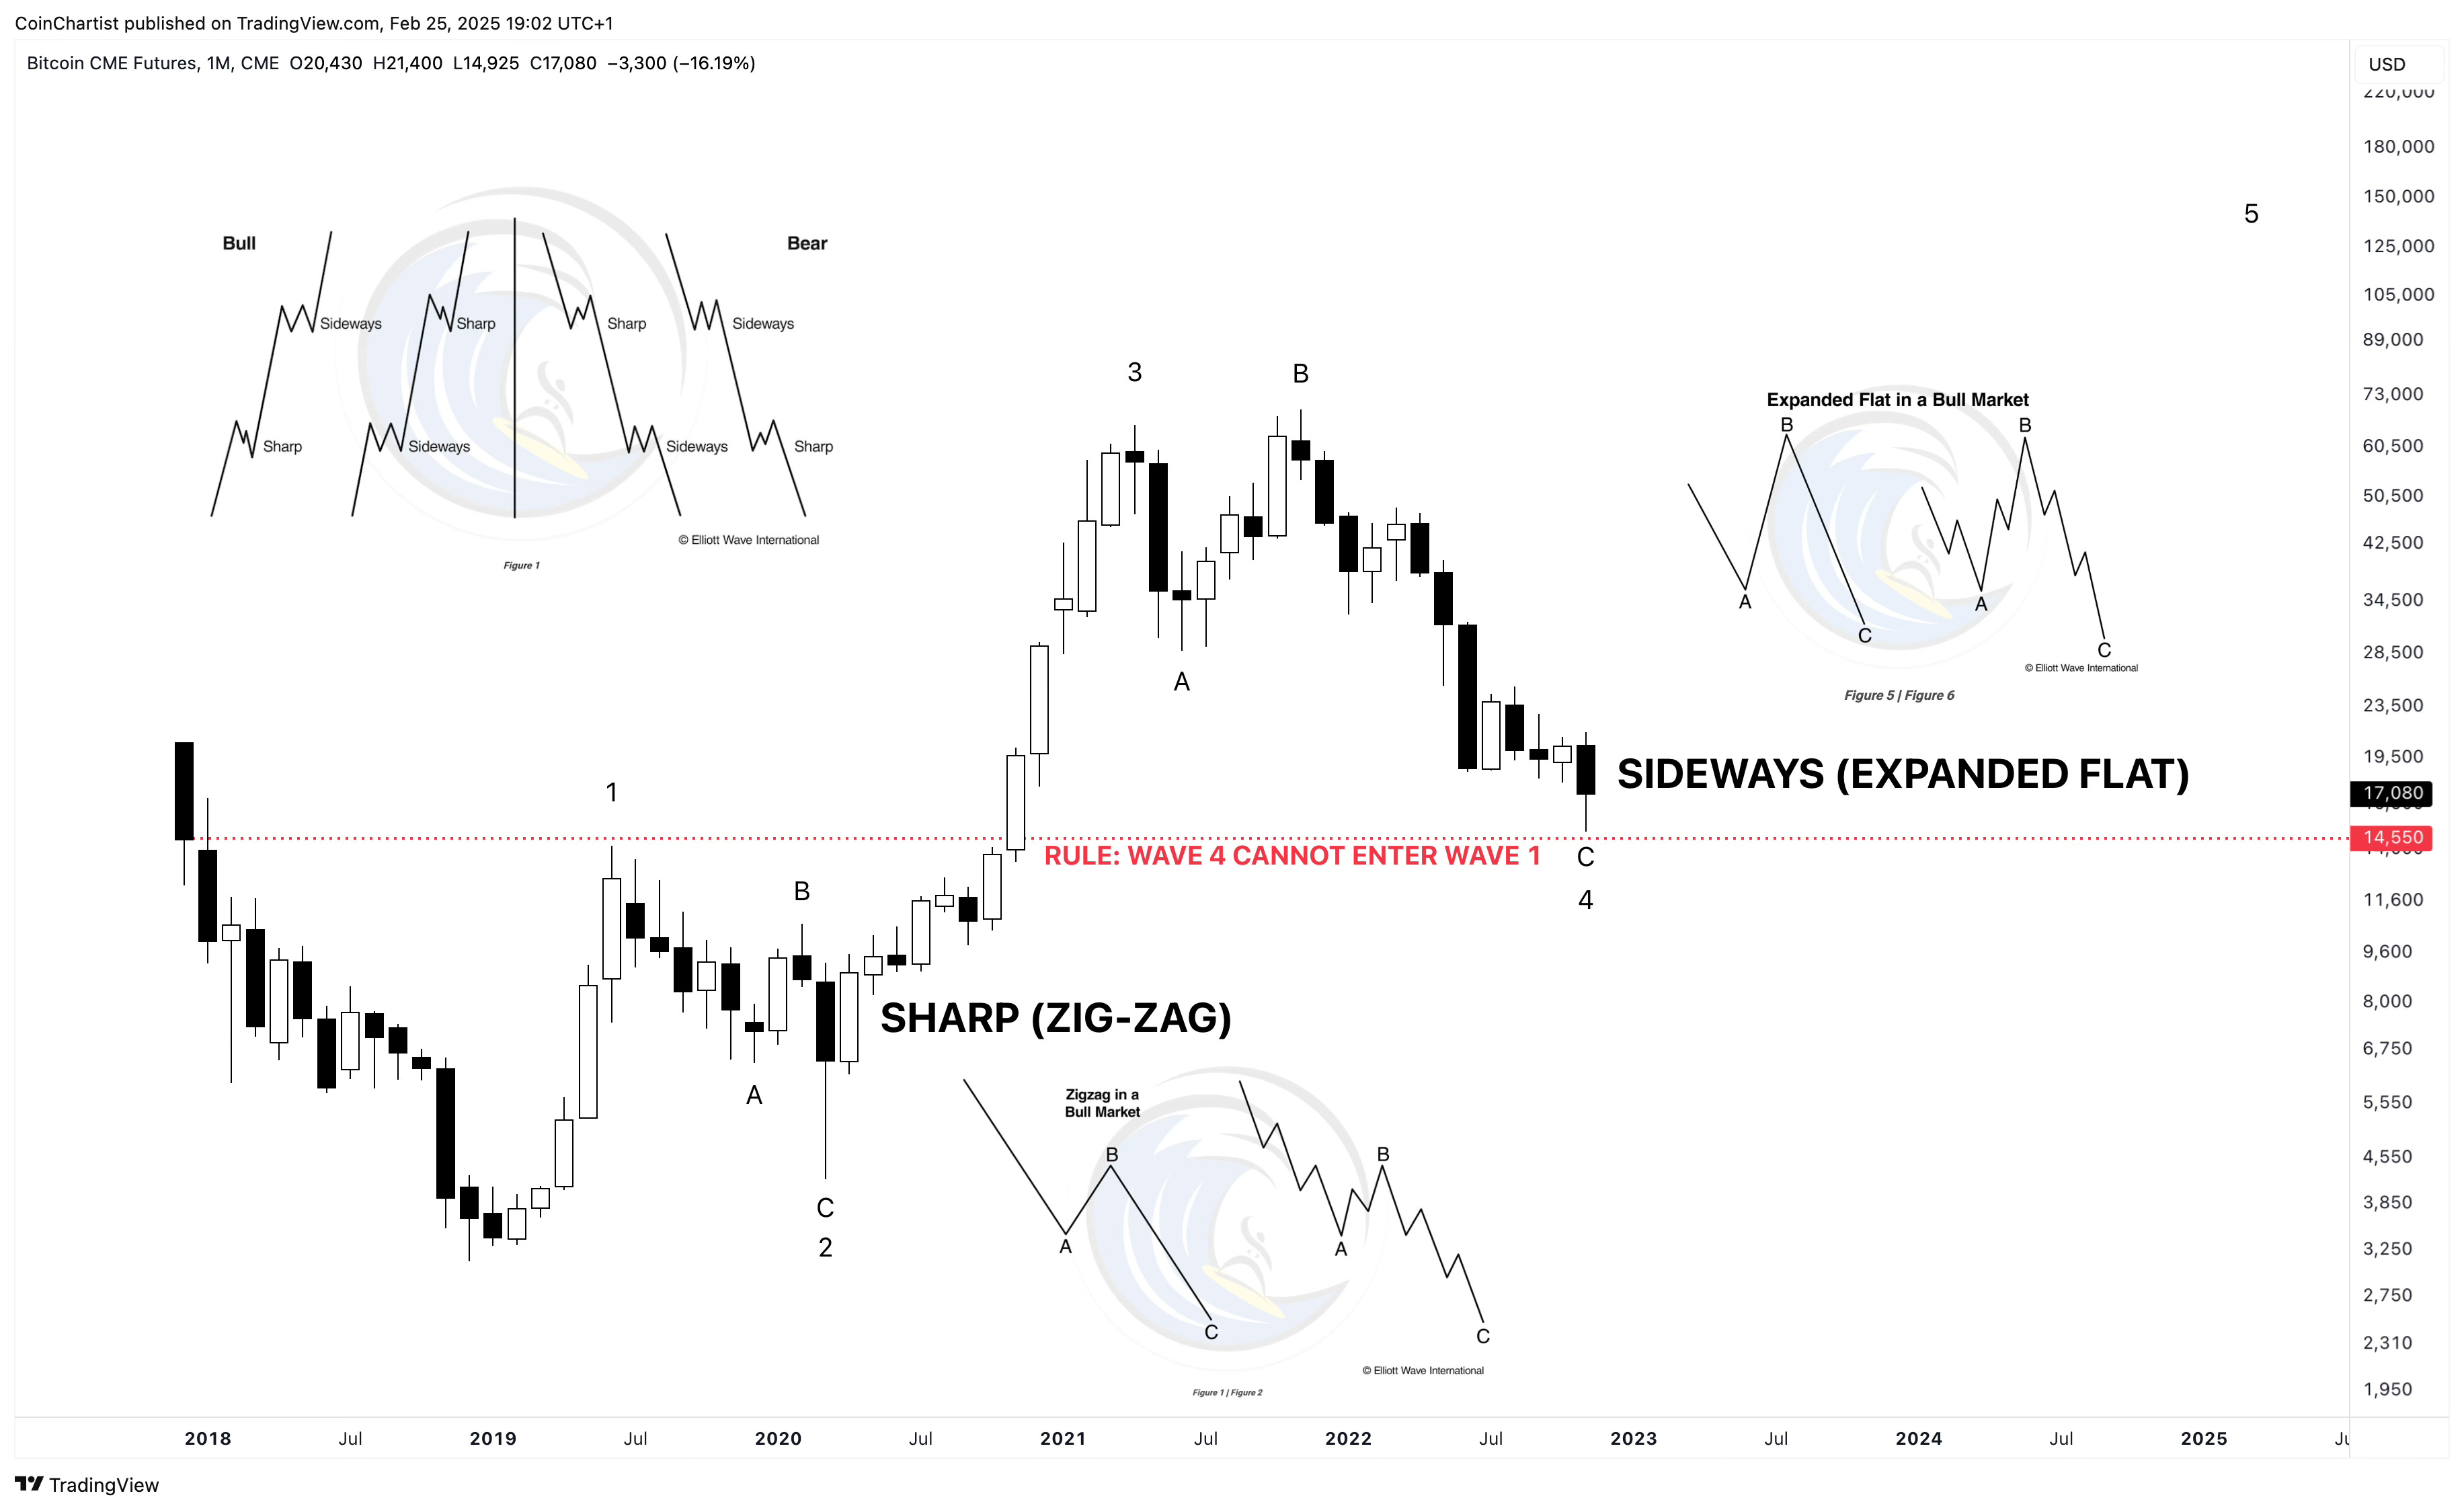
Before we move onto our wave 5, let’s stop and confirm some aspects of the structure to validate the wave count. Wave counts must have the “right look” and follow certain rules and guidelines. One rule is that wave 4 cannot enter wave 1 territory. There is also a guideline that states correction types will alternate between sharp (zig-zags, combos) and sideways (flats, triangles). Our structure in Bitcoin adheres to all of these rules and guidelines perfectly.
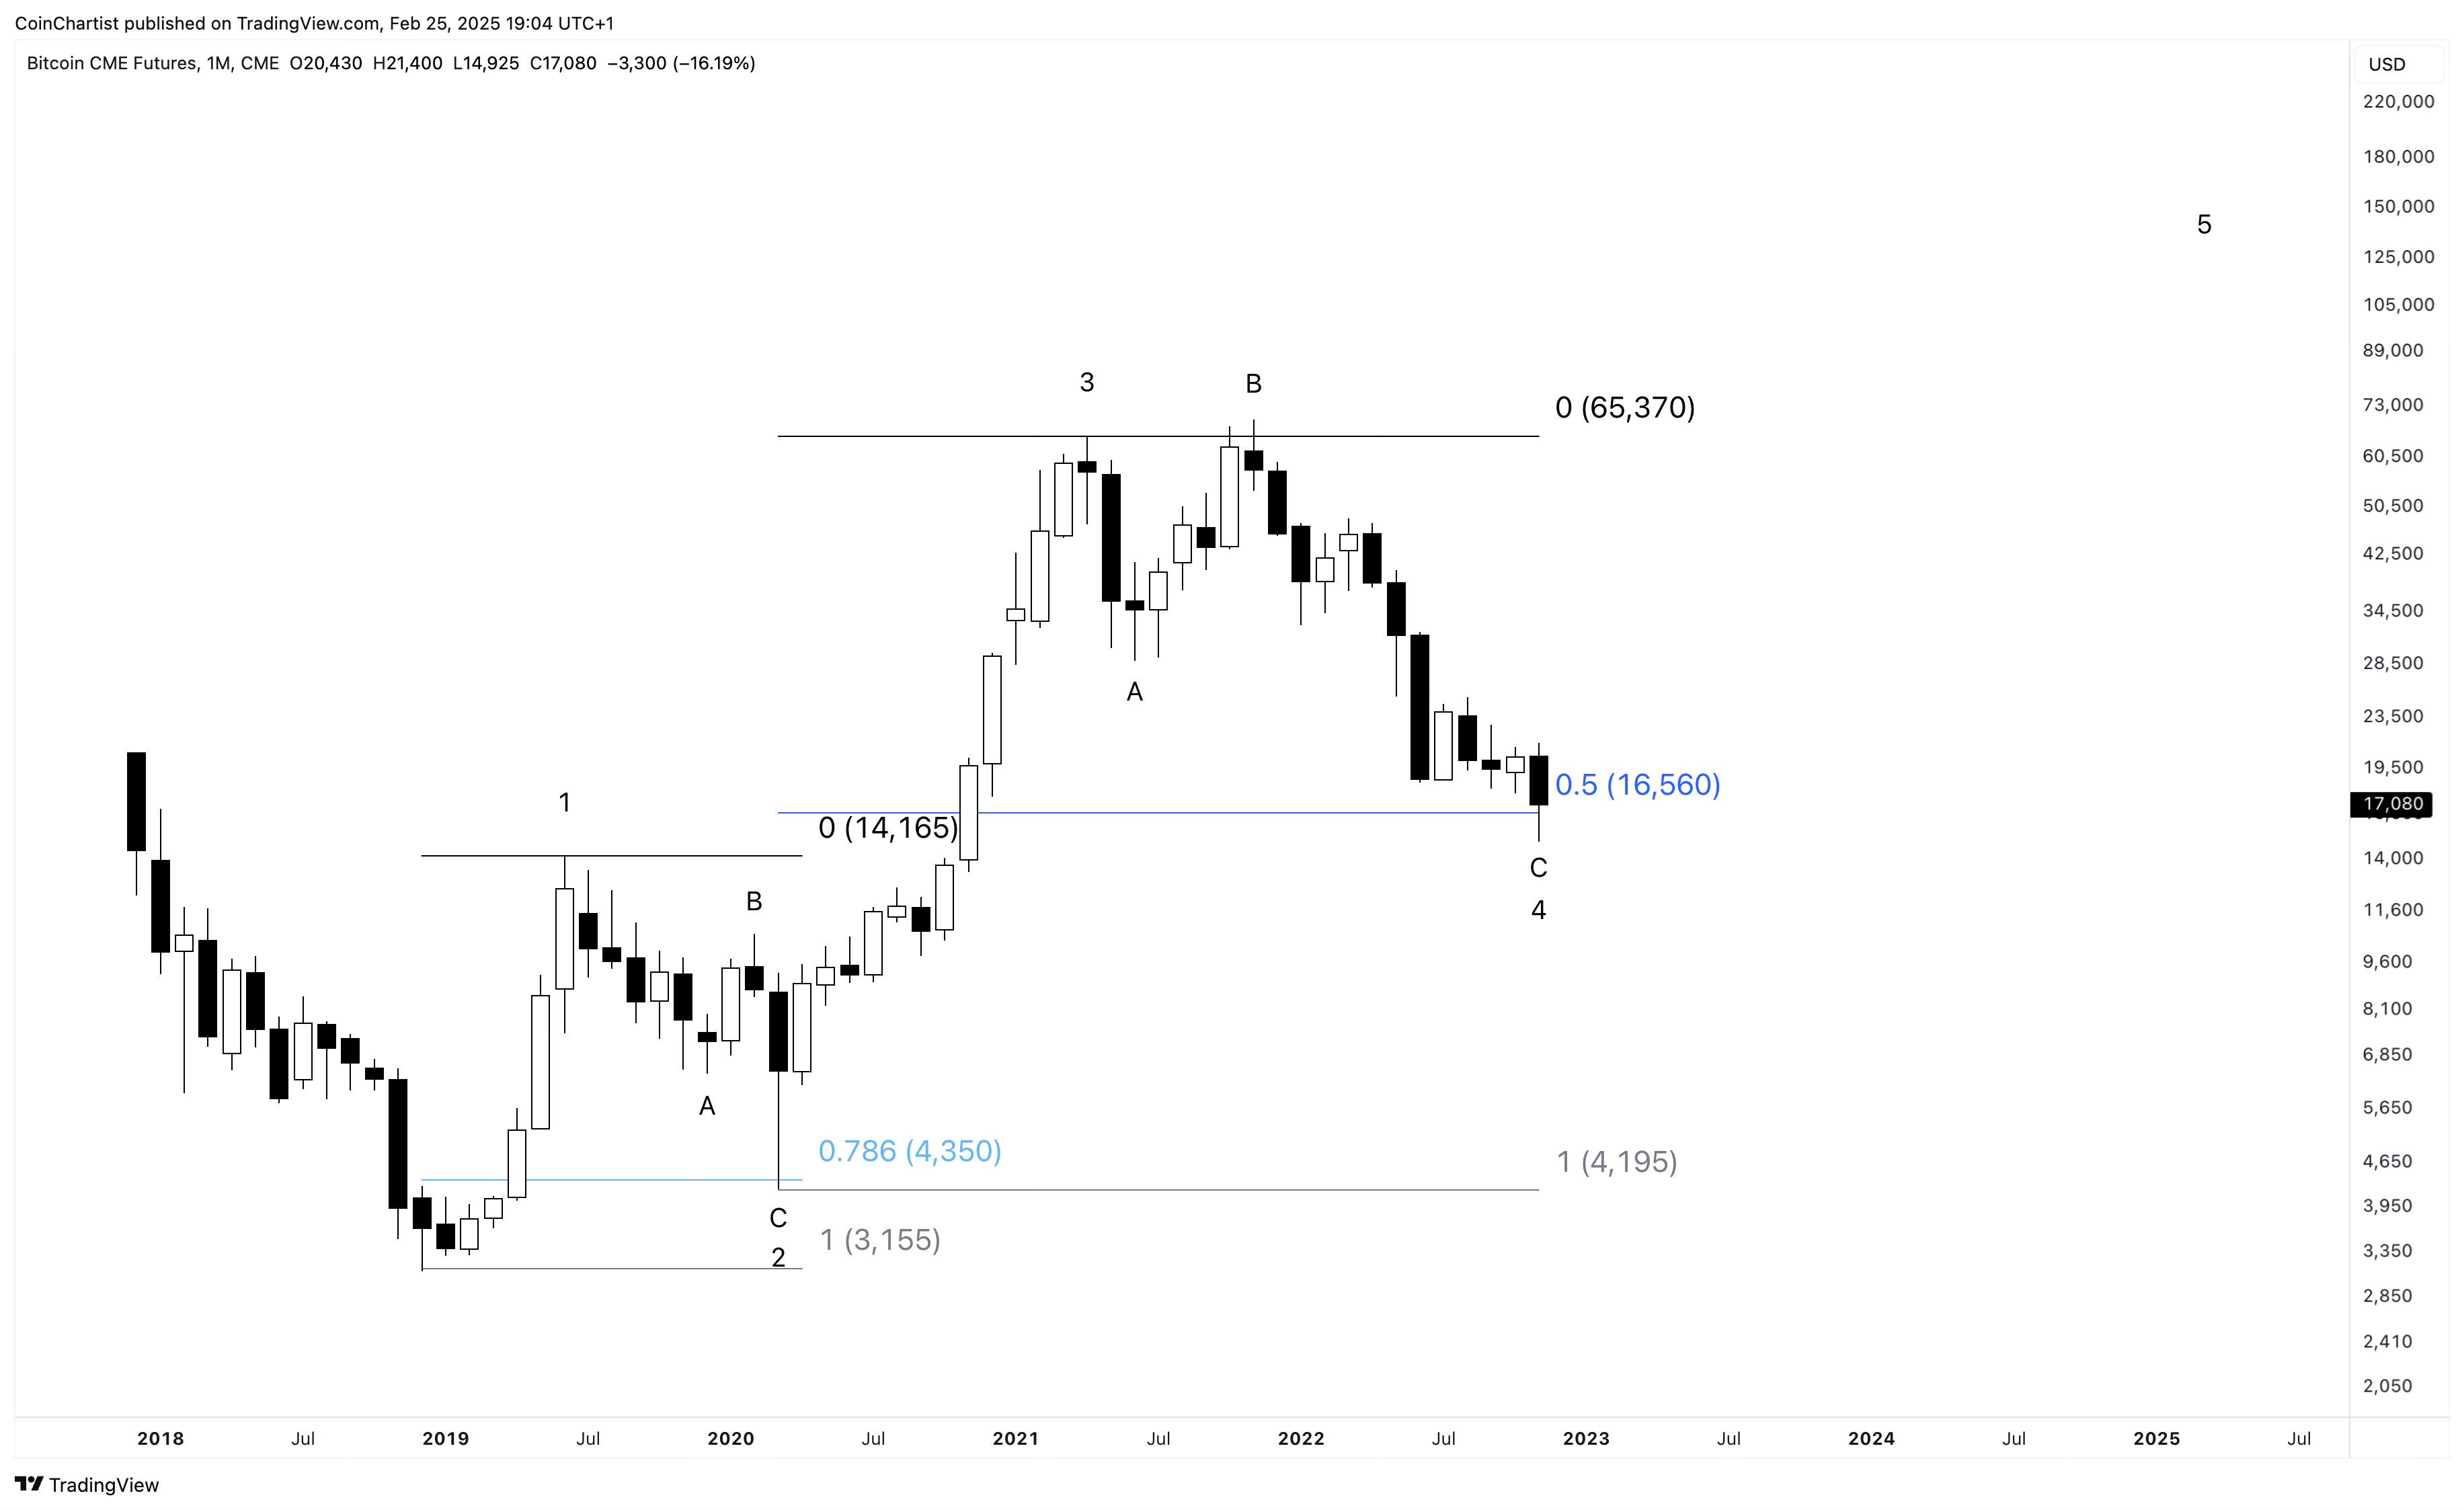
Further validation of corrective waves can potentially be confirmed using Fibonacci retracement. Wave 2 corrects much more of wave 1 than wave 4 will of wave 3. The result is a wave 2 that stopped around the 0.786 Fibonacci, and a wave 4 that stopped right around the 0.5 retracement. Fun fact: 0.5 isn’t an actual Fib ratio, but is on the retracement tool because 0.5 is a 50% retracement and is essentially the market’s point of equilibrium.
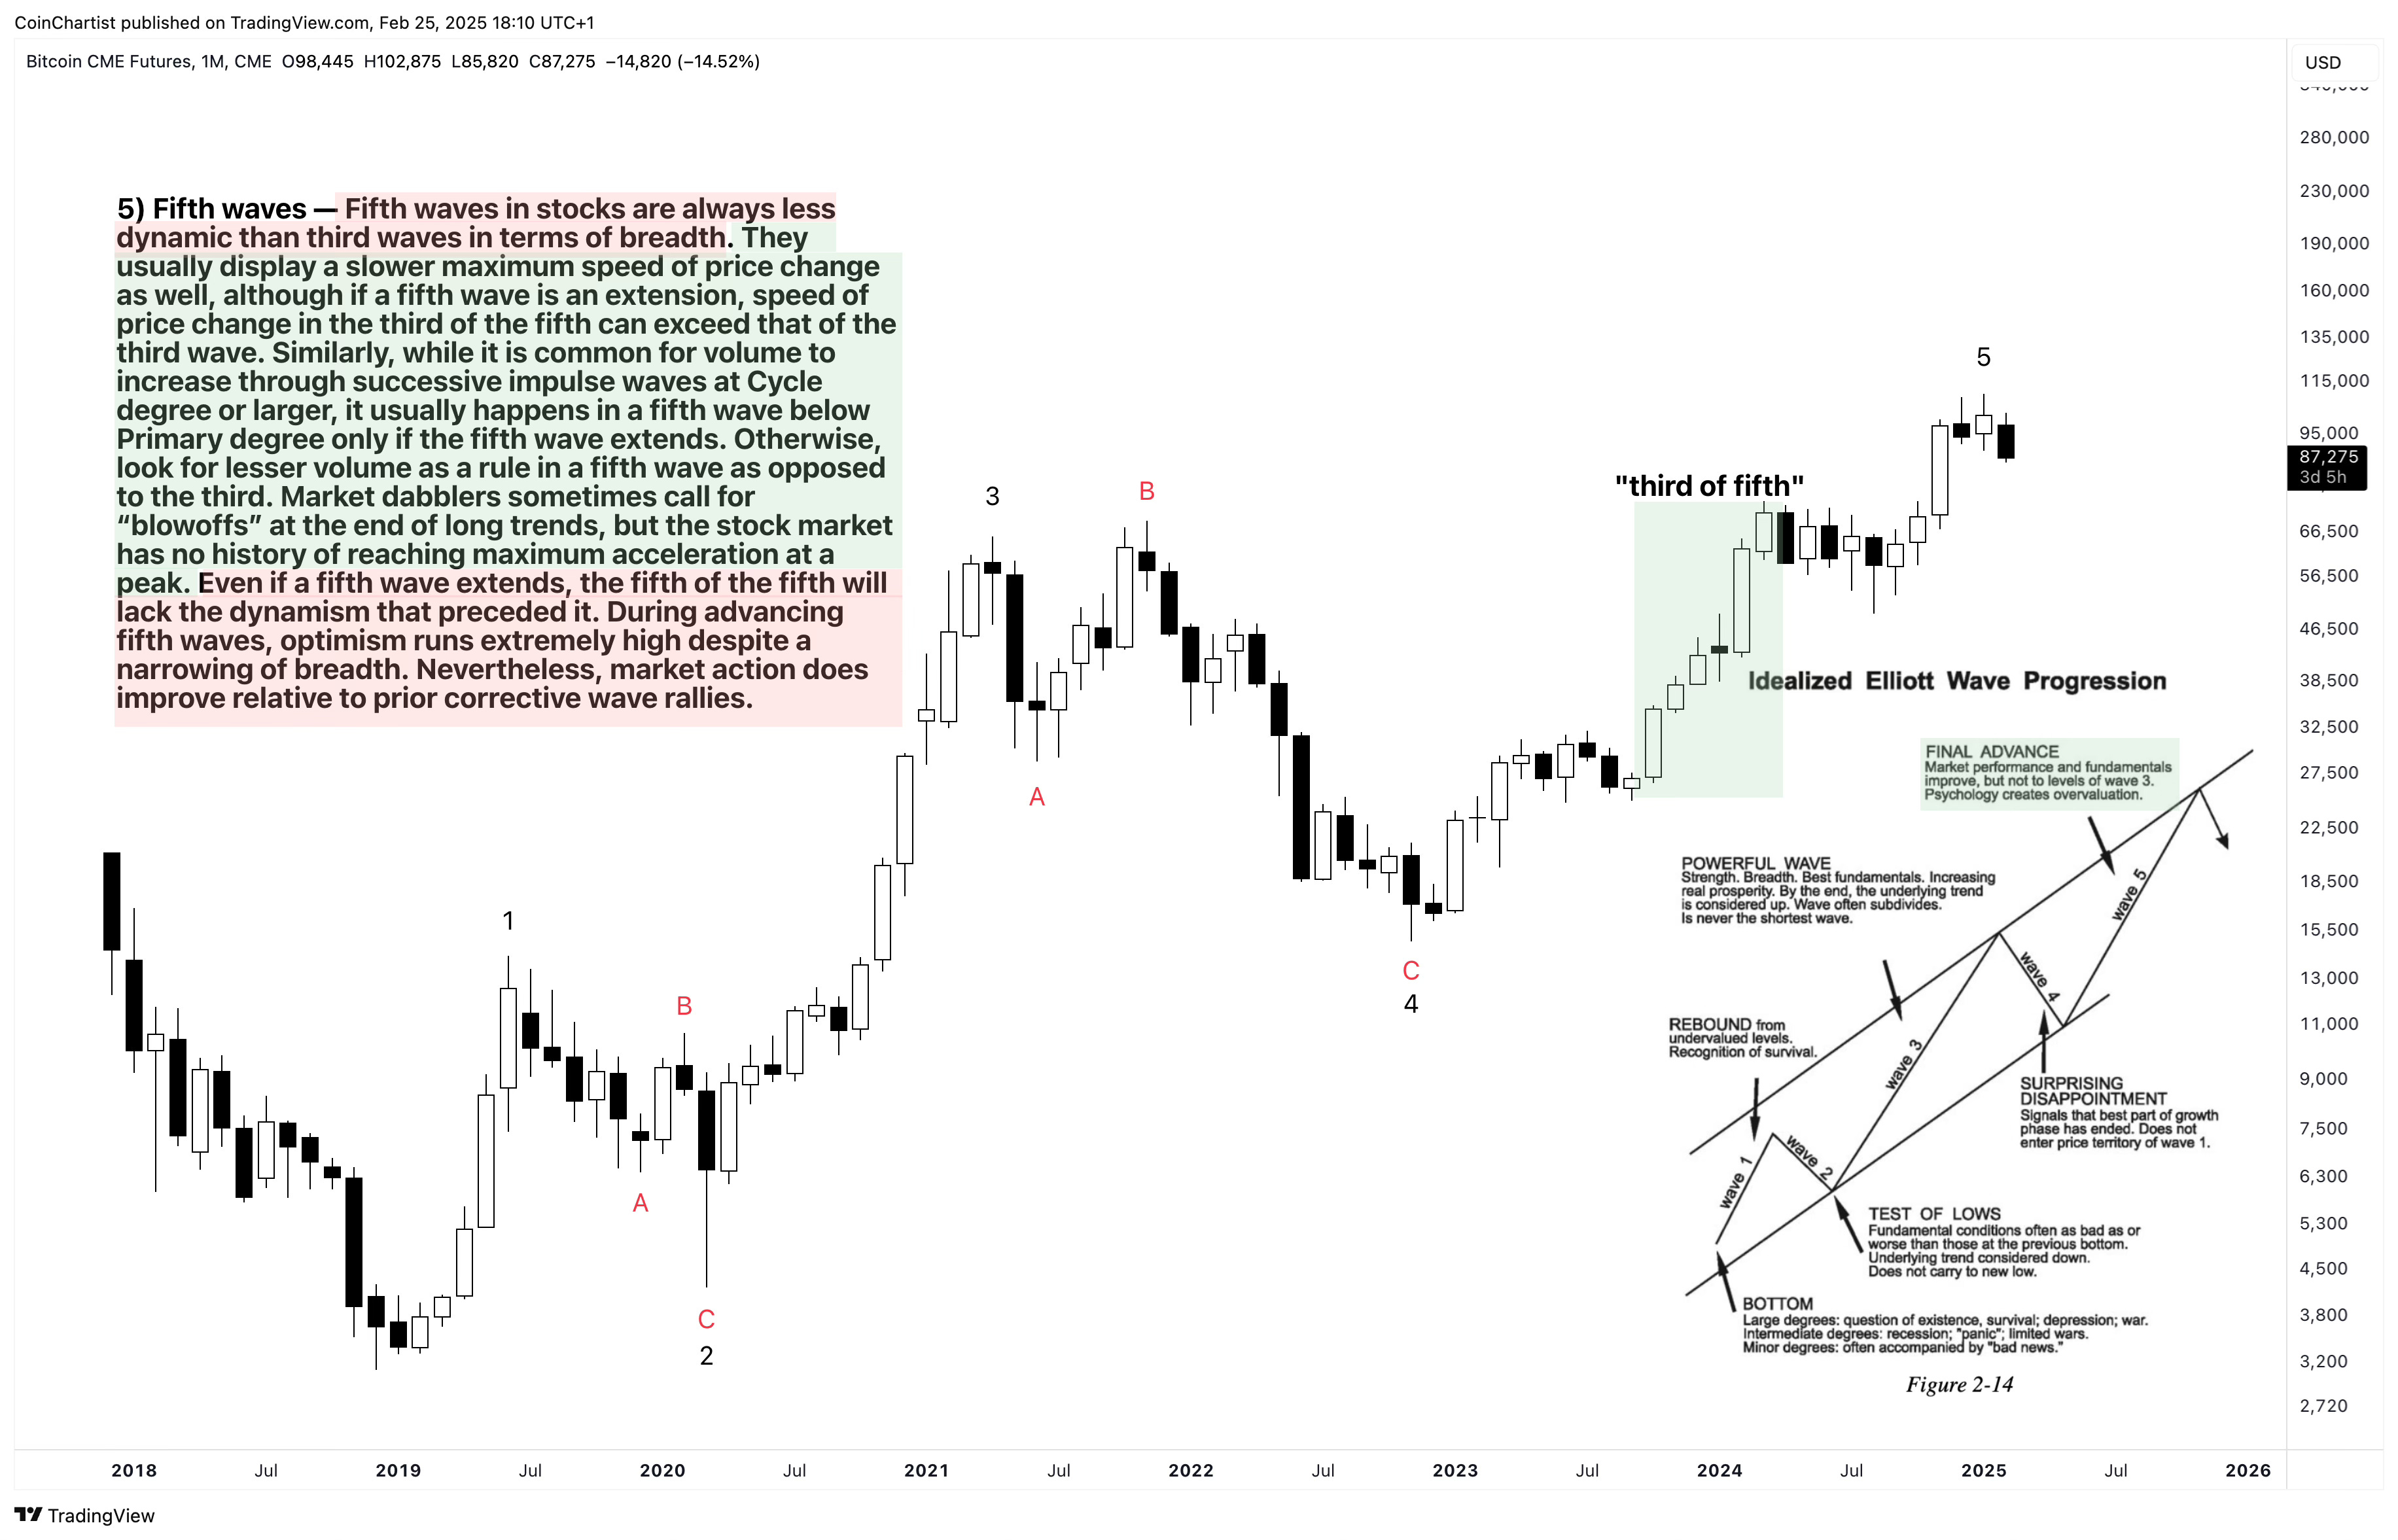
There is plenty of supporting evidence that Bitcoin was ready for its wave 5. It is difficult to truly understand how a wave might behave until you’ve lived it. Because of the speed of wave 1 and wave 3, I expected wave 5 to have started and completed long ago. It took significantly longer than I expected, but apparently that’s normal for a wave 5, as the personality description reads:
“Fifth waves in stocks are always less dynamic than third waves in terms of breadth. They usually display a slower maximum speed of price change as well, although if a fifth wave is an extension, speed of price change in the third of the fifth can exceed that of the third wave.”
We know there has been a distinct lack of breadth during Bitcoin’s wave 5. It has displayed a much slower maximum speed, except for the third subwave of wave 5, which I highlighted with a green box. While all of these things confused me, in hindsight this could just be normal wave 5 behavior.
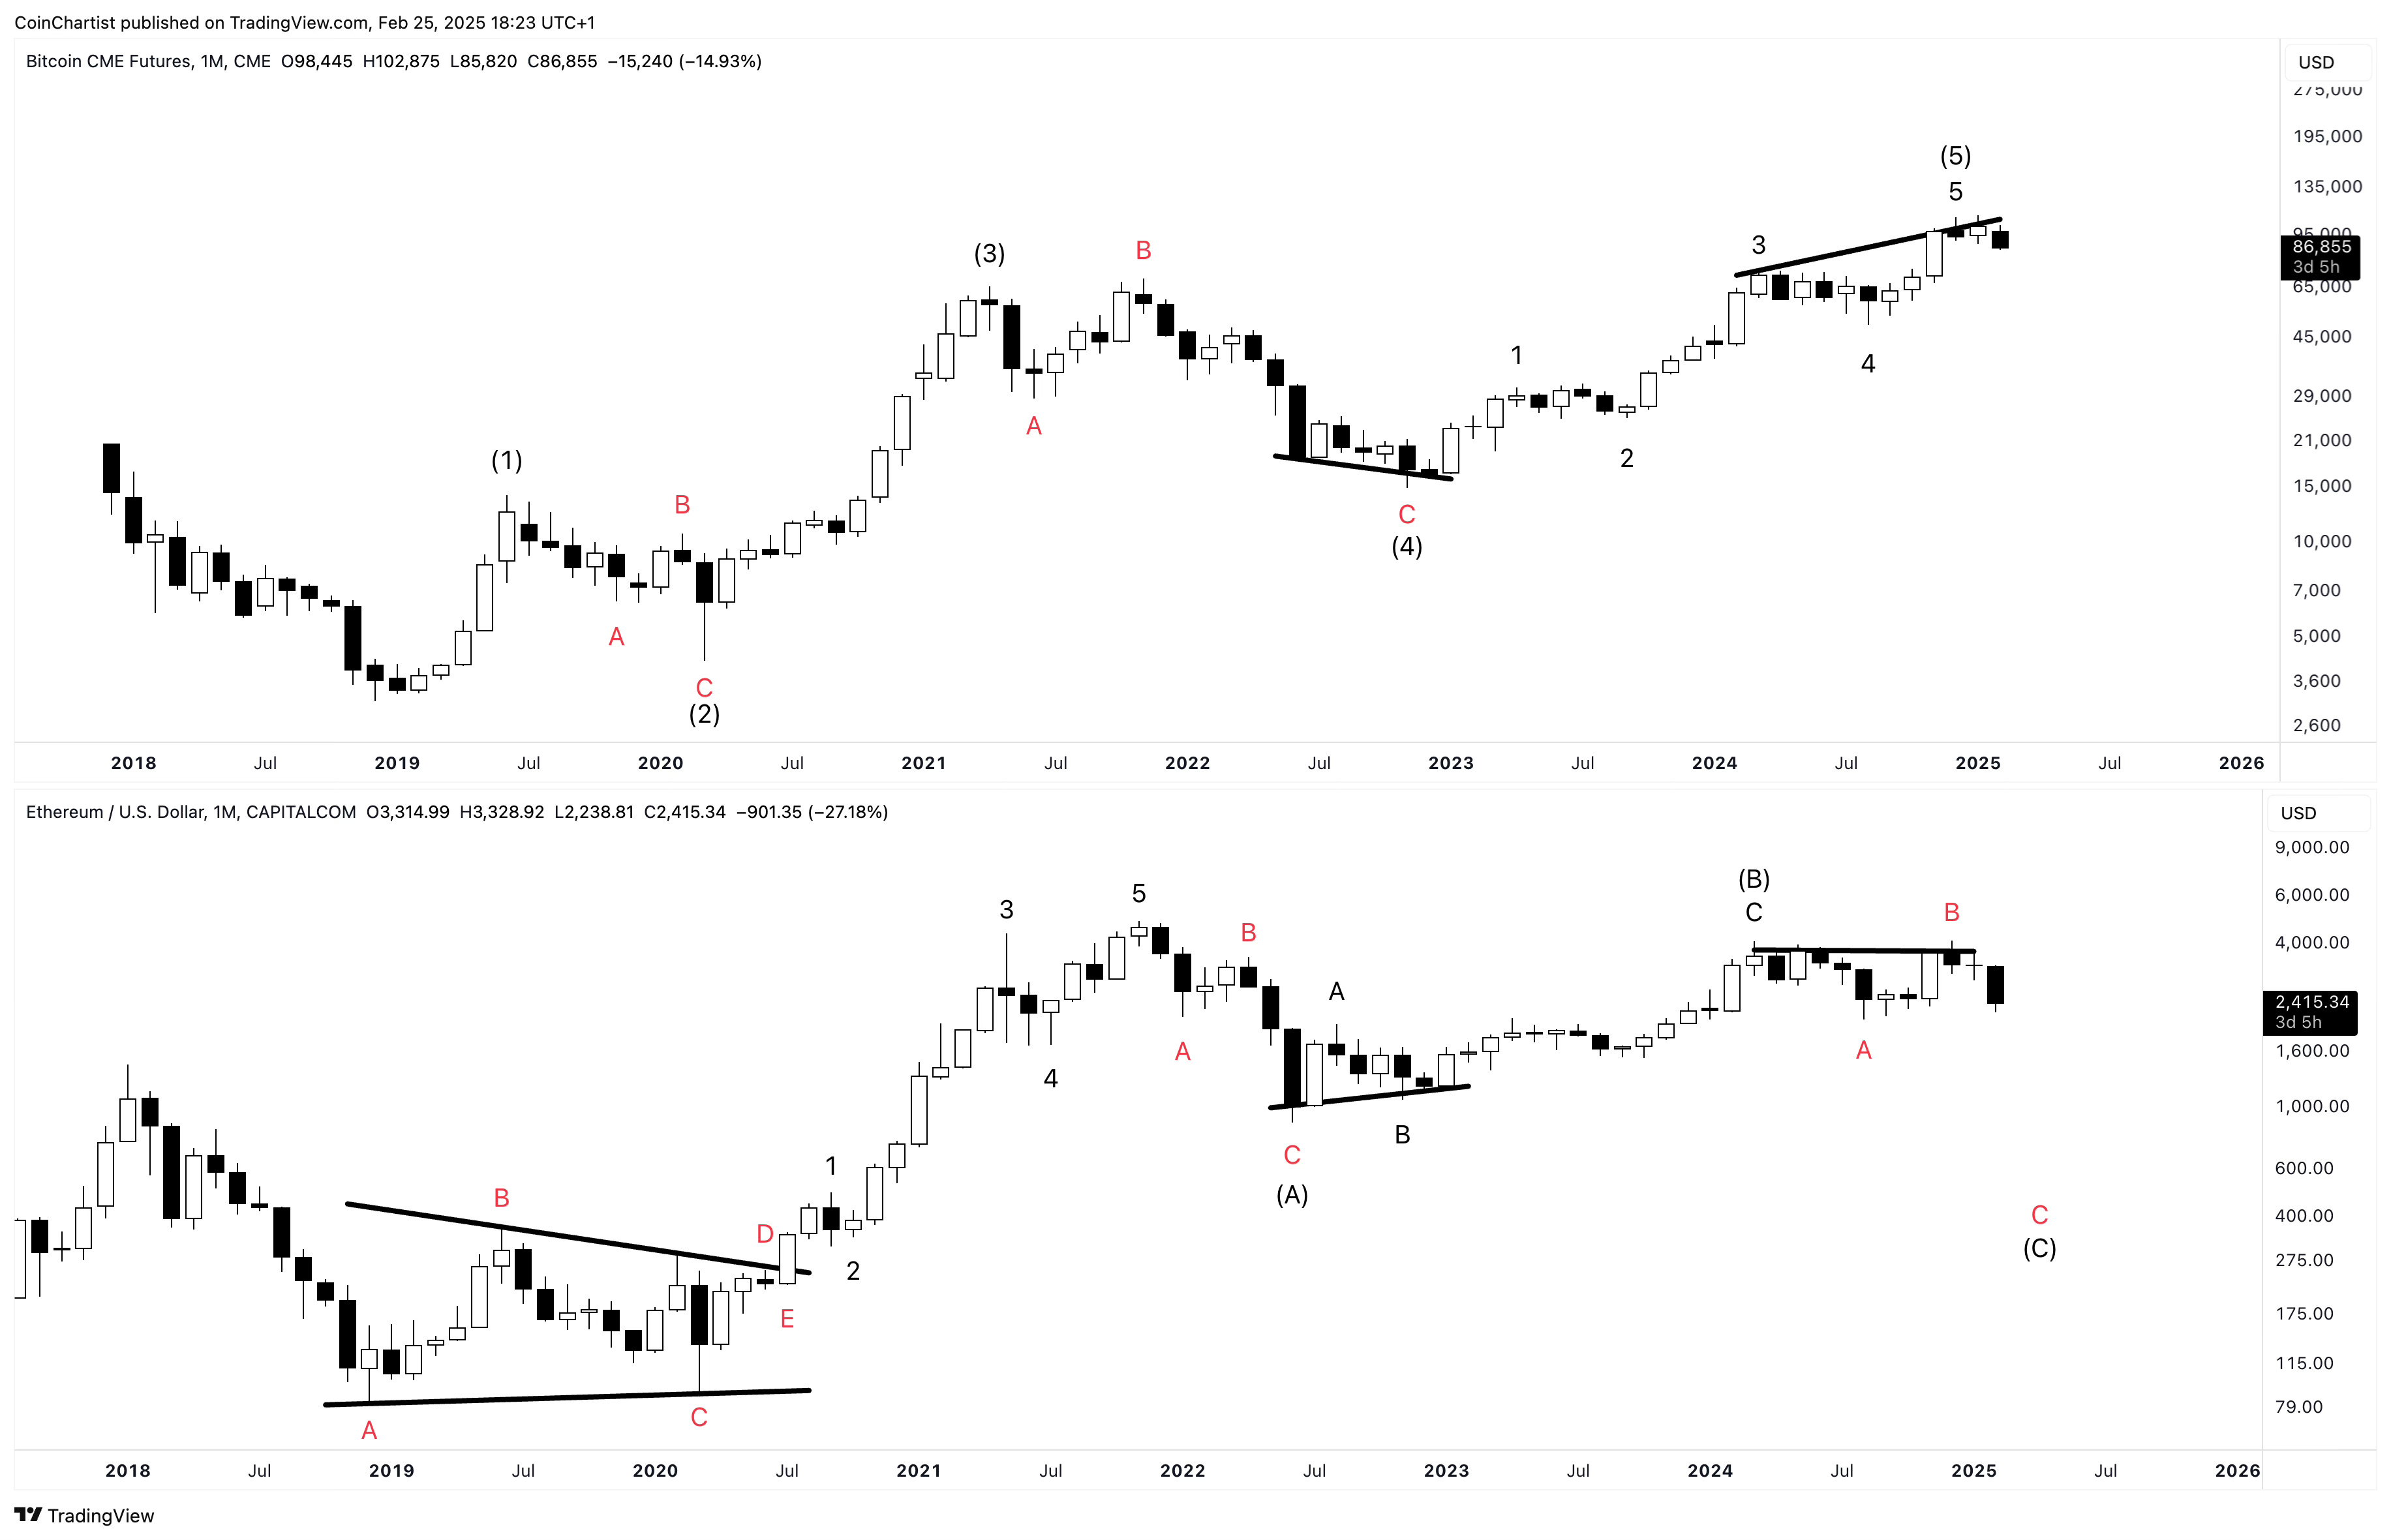
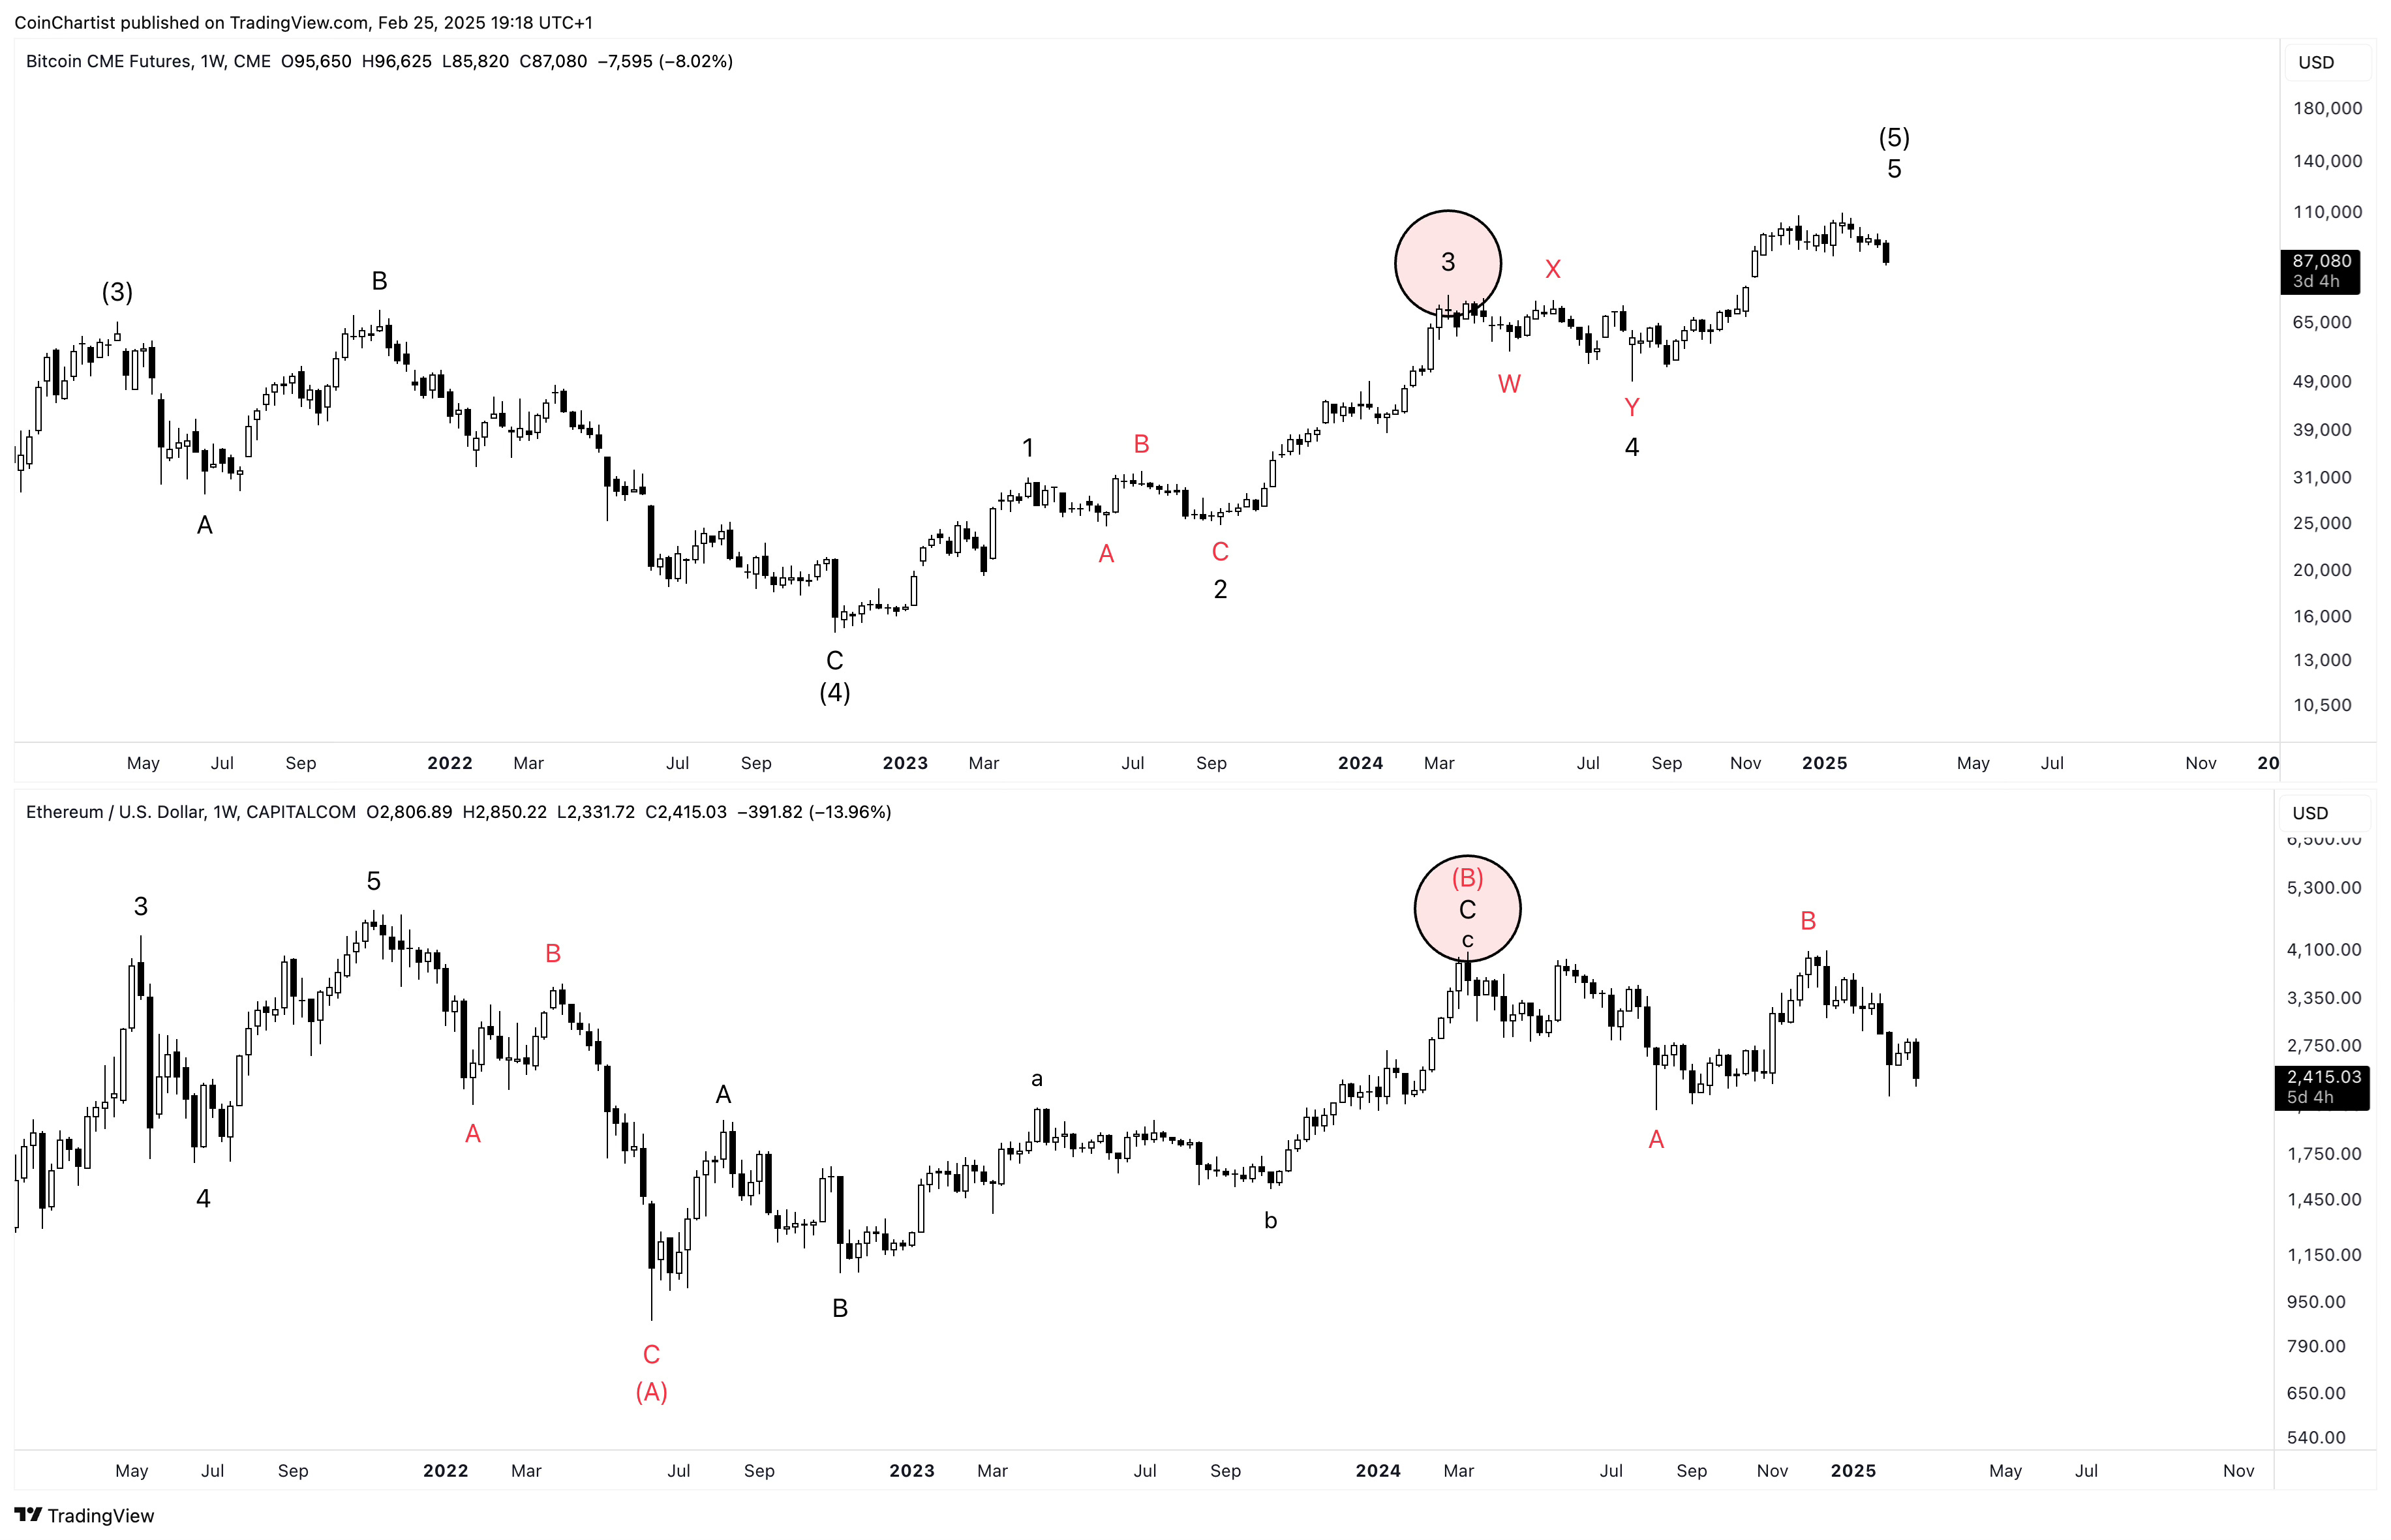
I’ve added Ethereum below Bitcoin to demonstrate how their peaks and troughs don’t quite line up 1:1. For example, Ethereum bottomed in June 2022 after the LUNA collapse, while Bitcoin bottomed in November with FTX’s scandal. From this bottom forward, the two coins diverged even further in behavior.
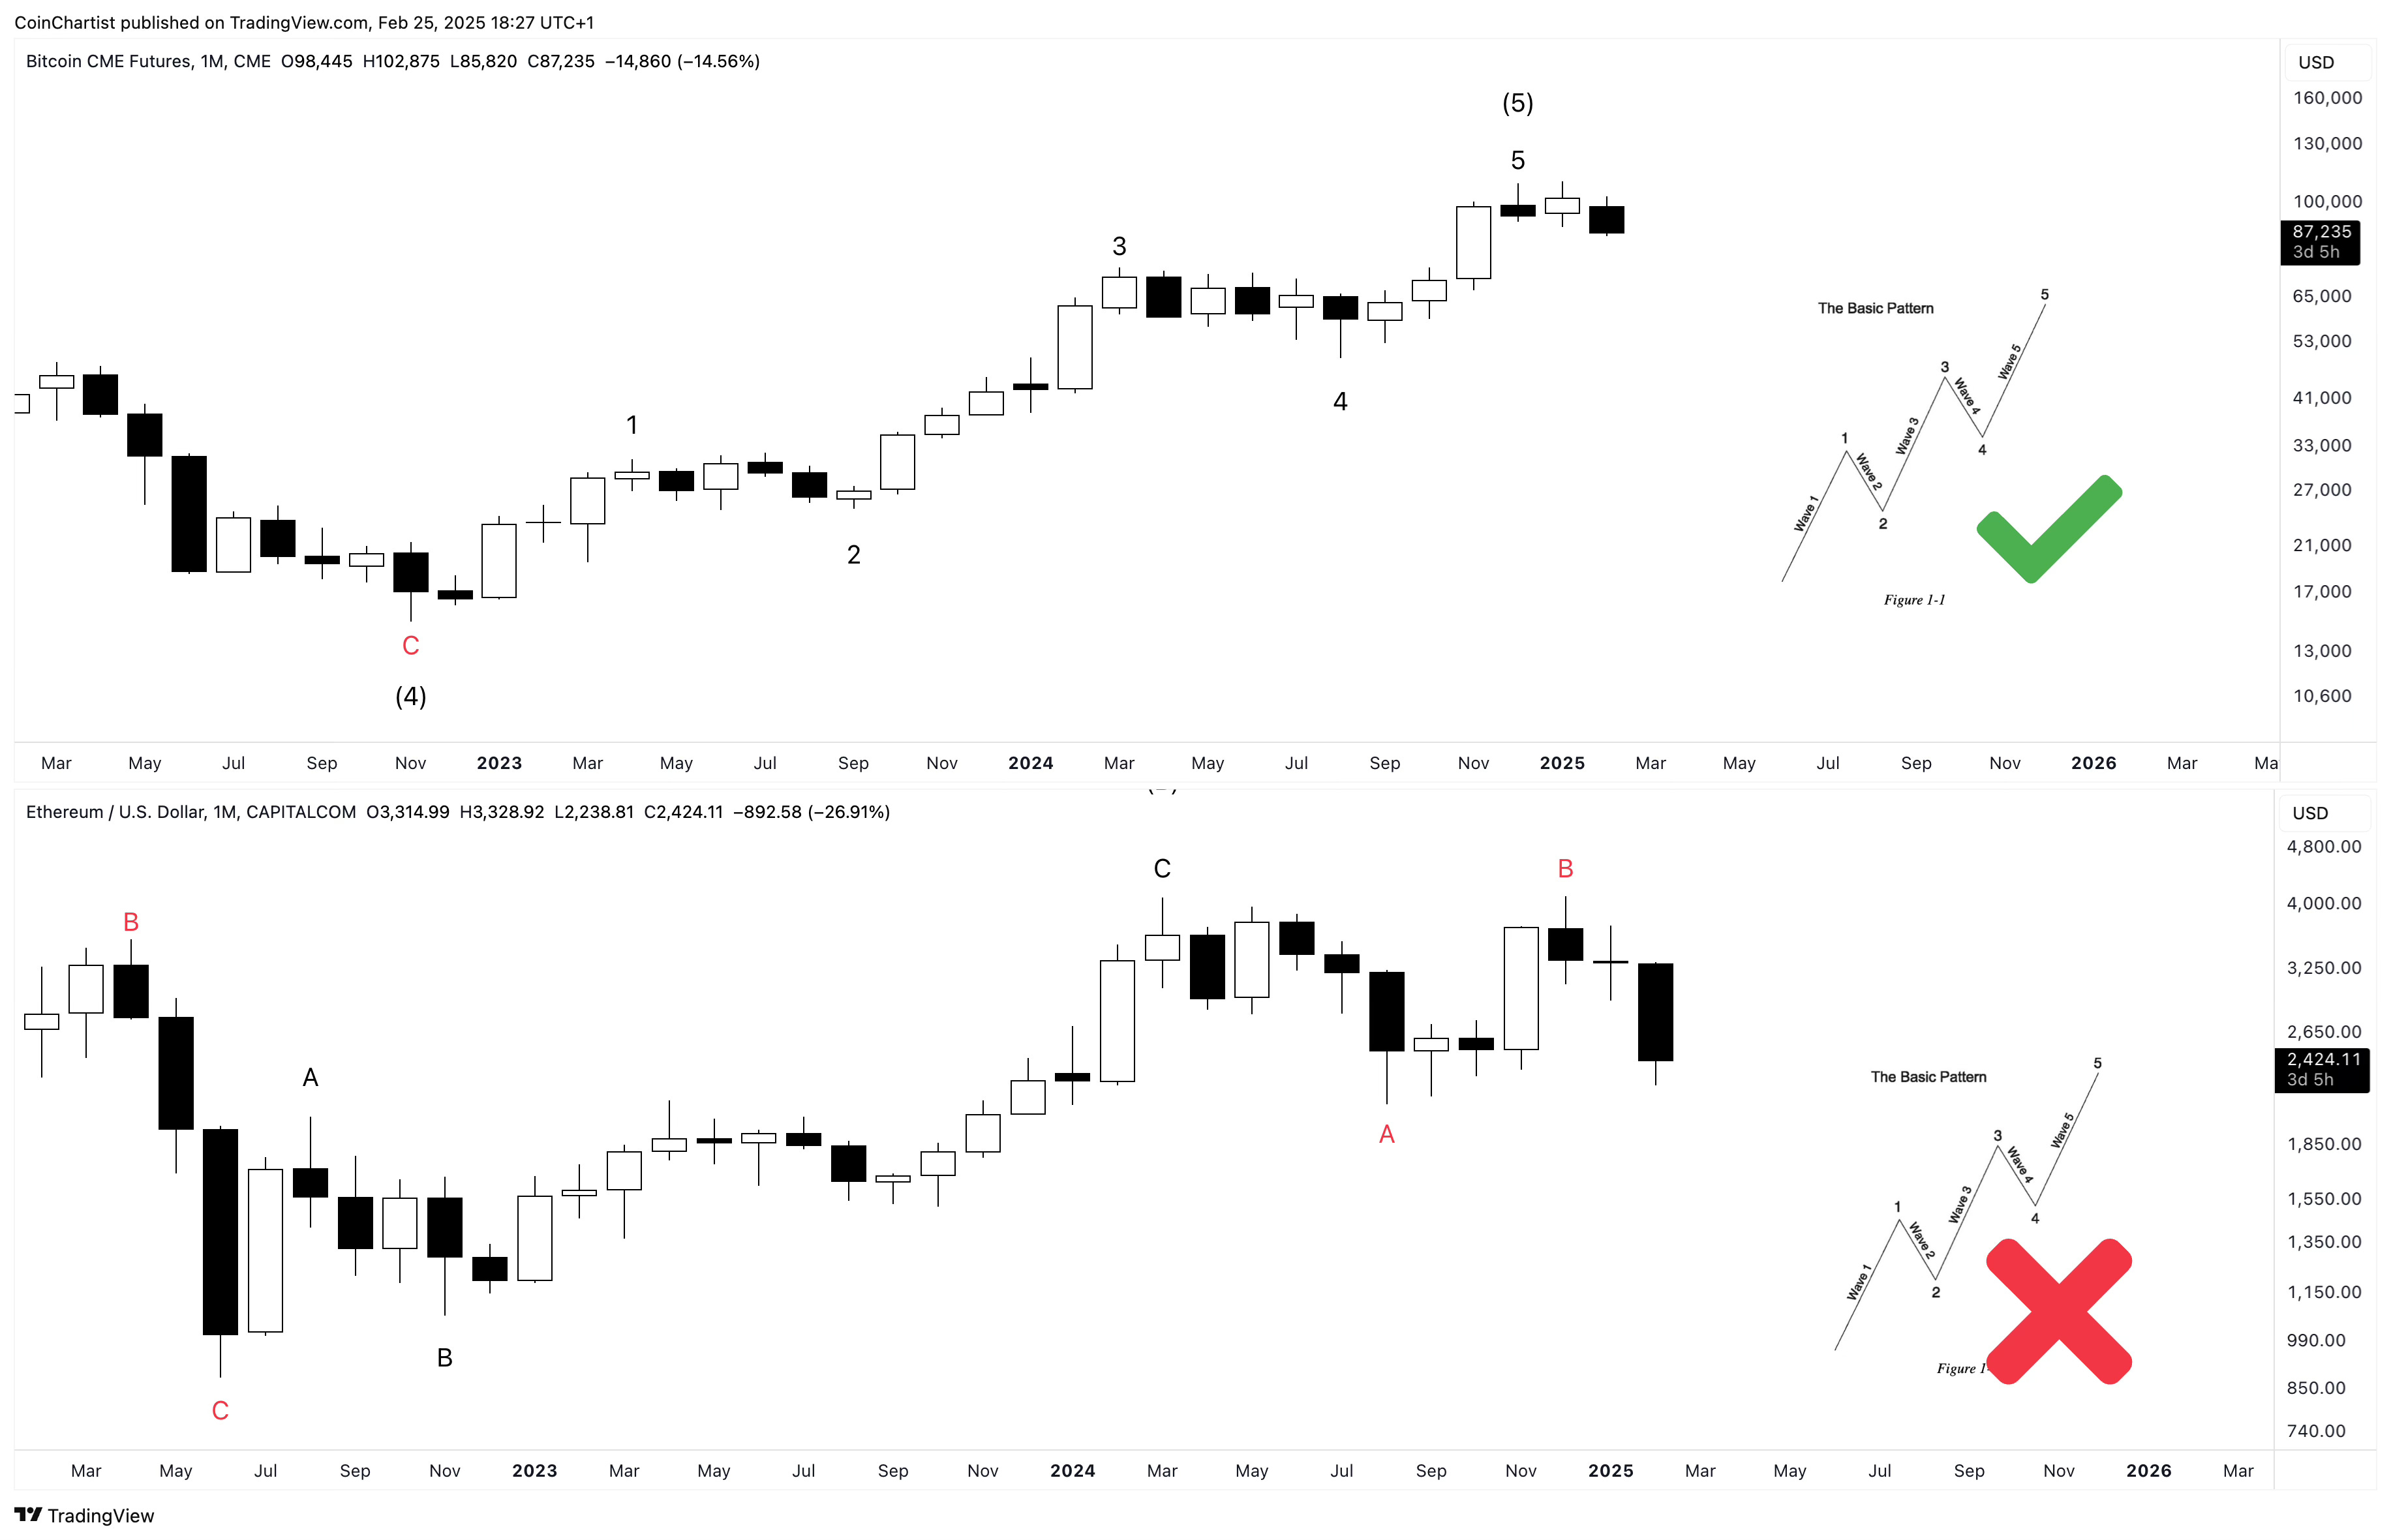
Looking only at price action from 2022 forward, we can see that Bitcoin displays the “right look” while Ethereum does not at all. That’s because I believe Ethereum started its larger bear market during Bitcoin’s wave 4, just like the EW textbook states about wave personalities. That would mean that the entire rally from 2022 to 2025 was a bear market rally and the B wave of a larger correction.
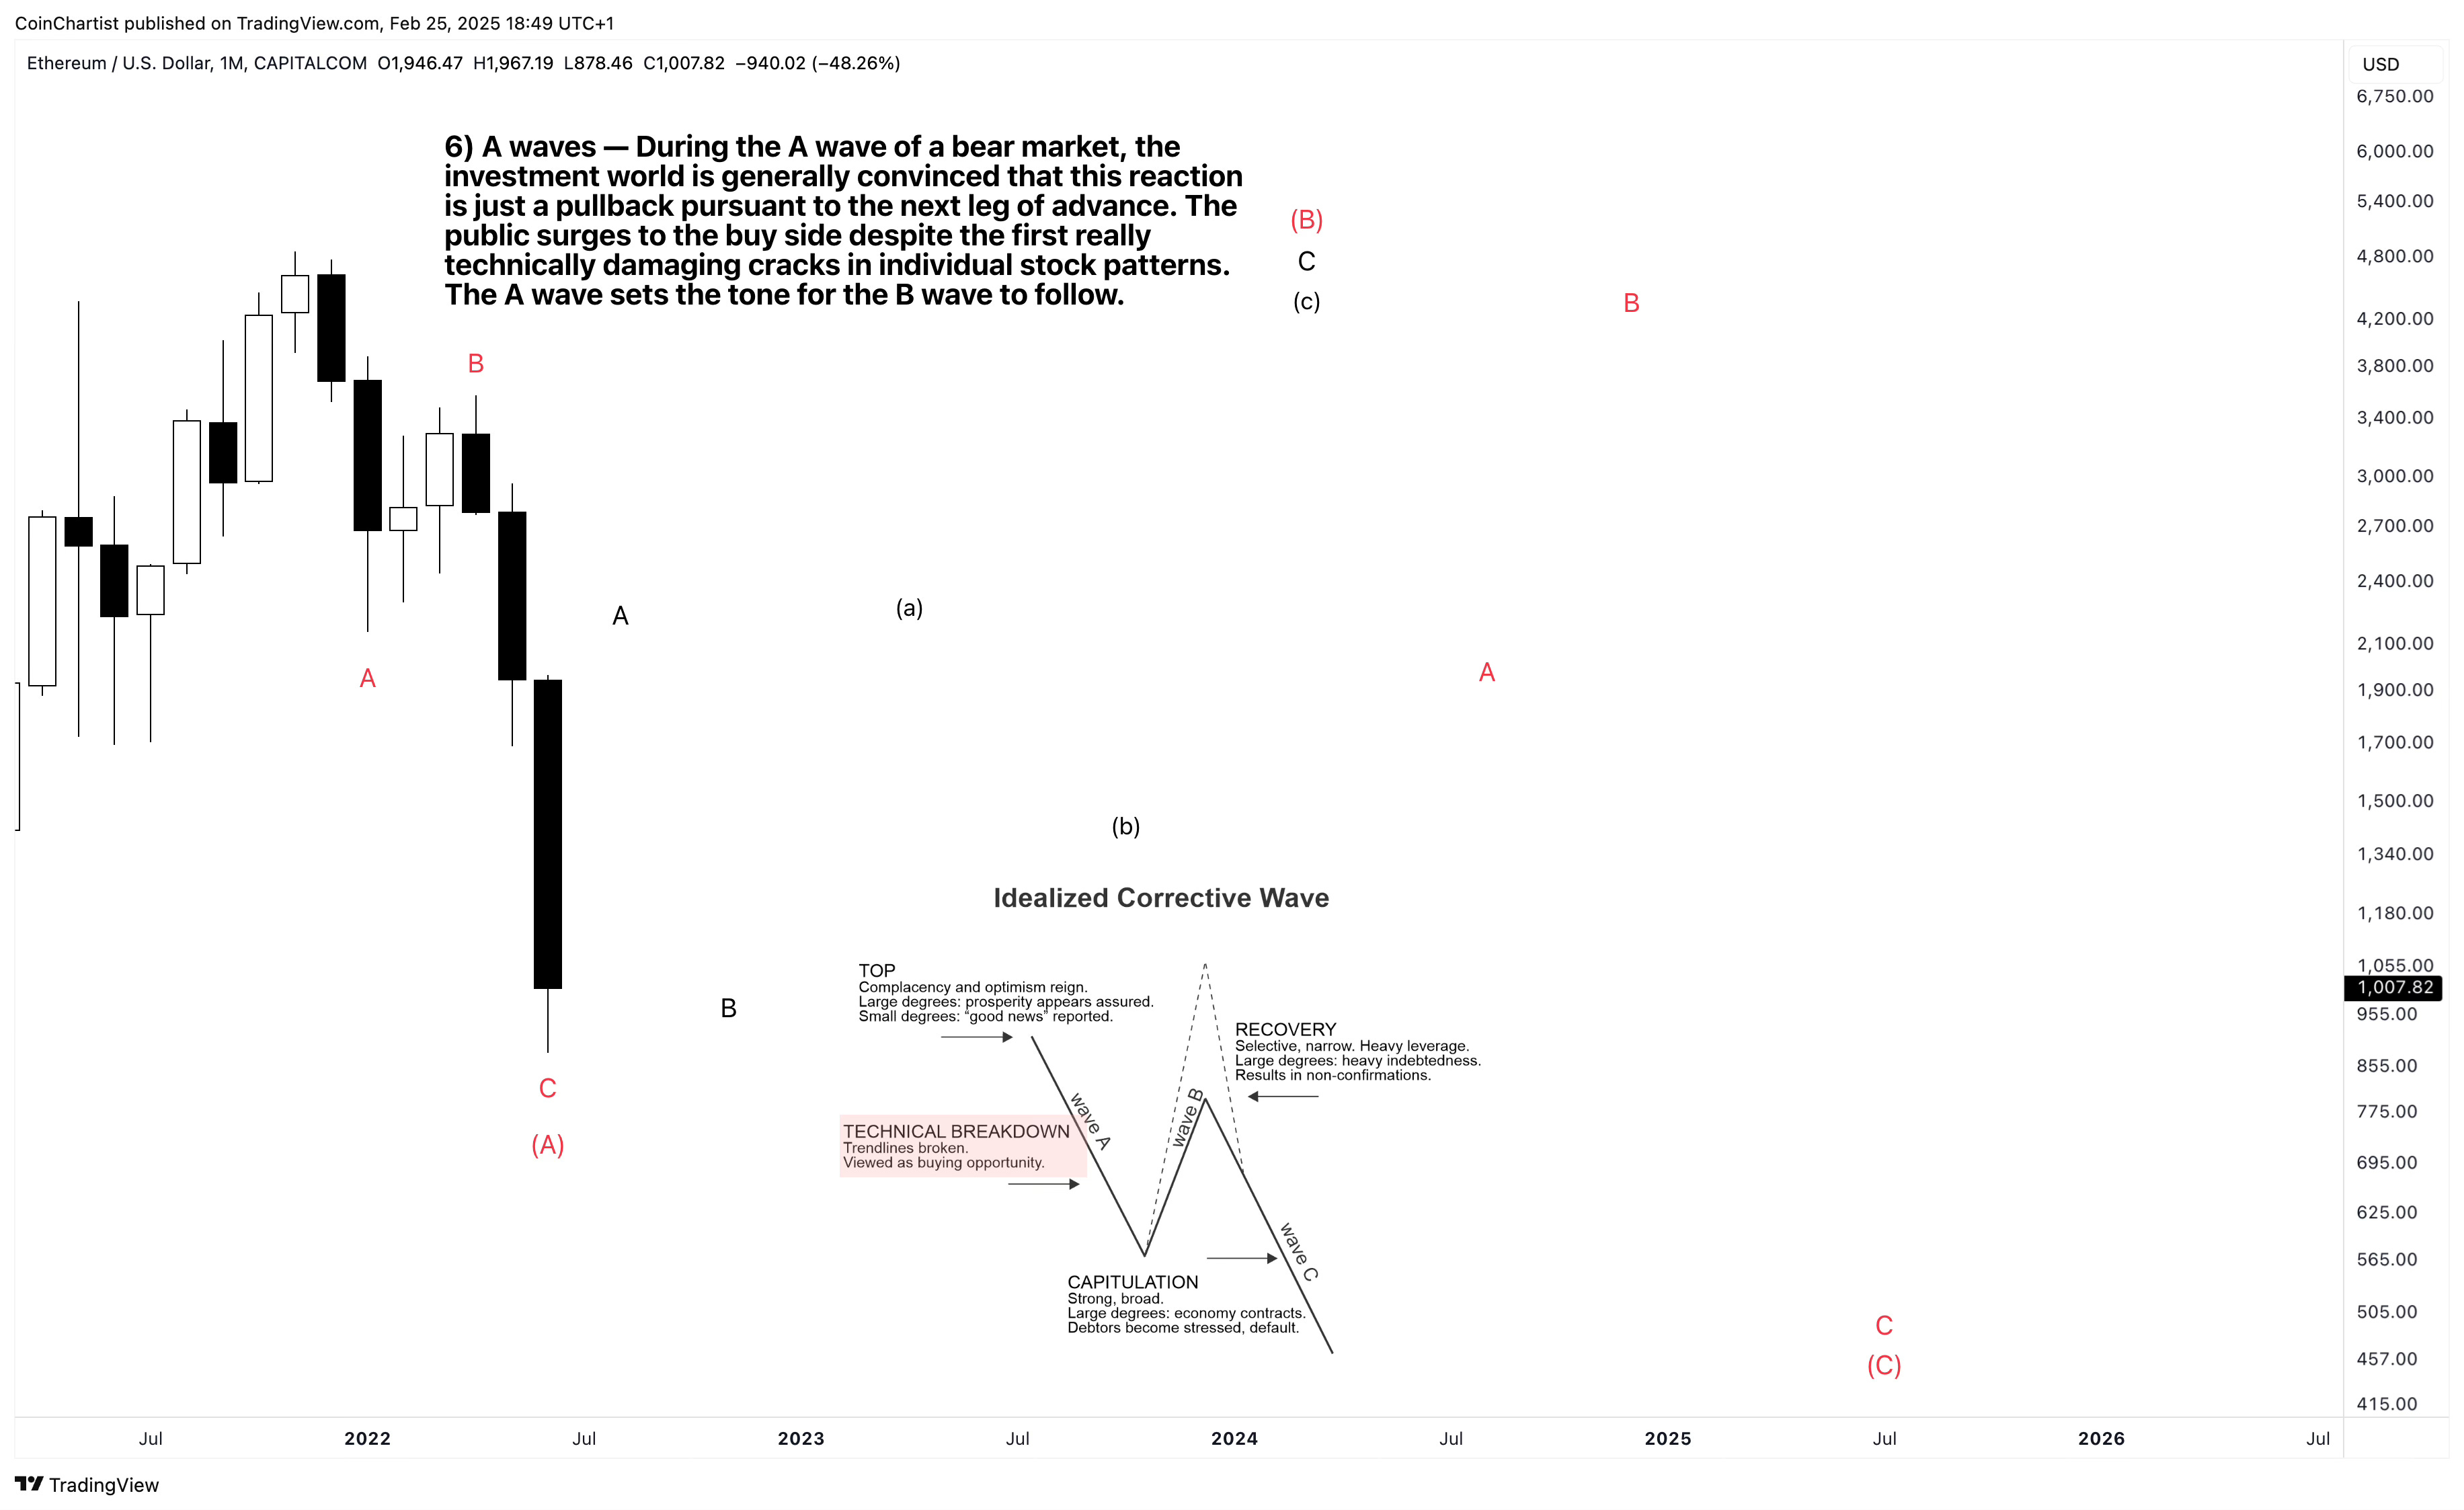
Much like we mapped out Bitcoin using wave personalities, let’s do so with Ethereum and start with its A wave. Wave A is widely viewed as a buying opportunity in advance of the next major rally. The “public” scrambles to the buy side despite technical cracks beginning to show. This mistake makes the C wave especially devastating.
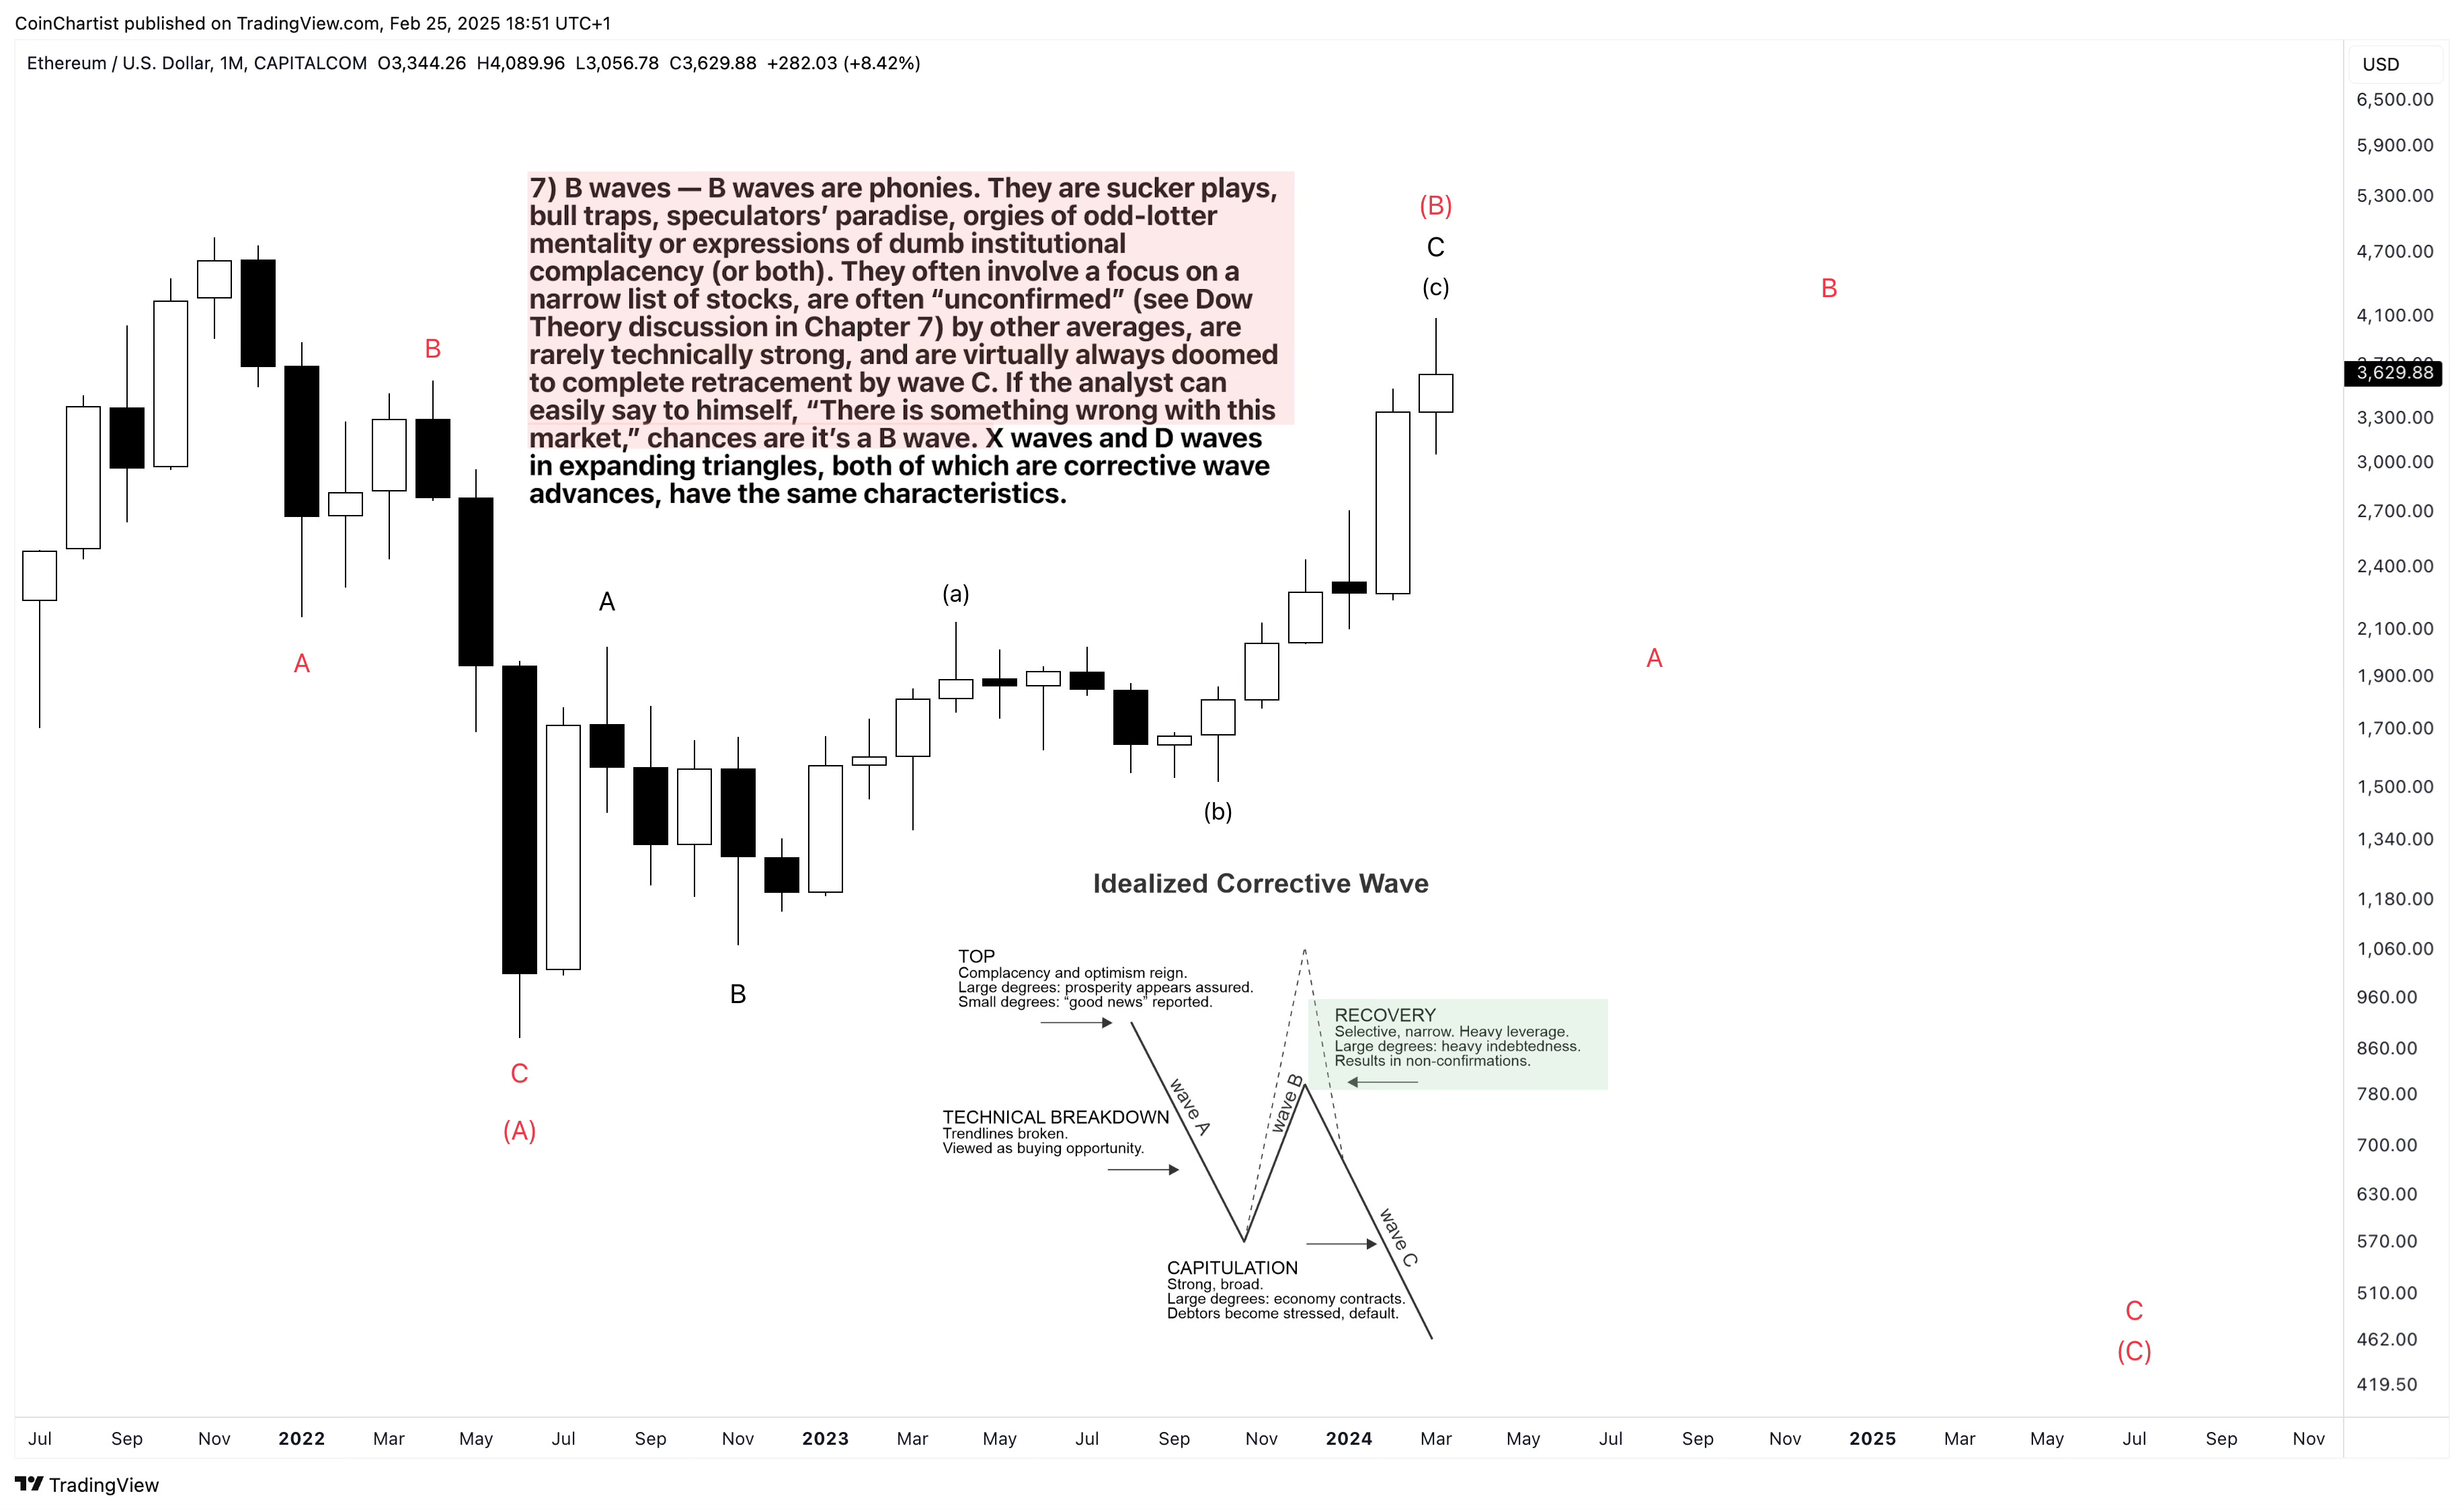
B waves are “big phonies.” They move with the primary trend (up) so they’re deceiving and viewed as another cyclical rally. When they eventually show non-confirmations, the B wave is nearing its end.
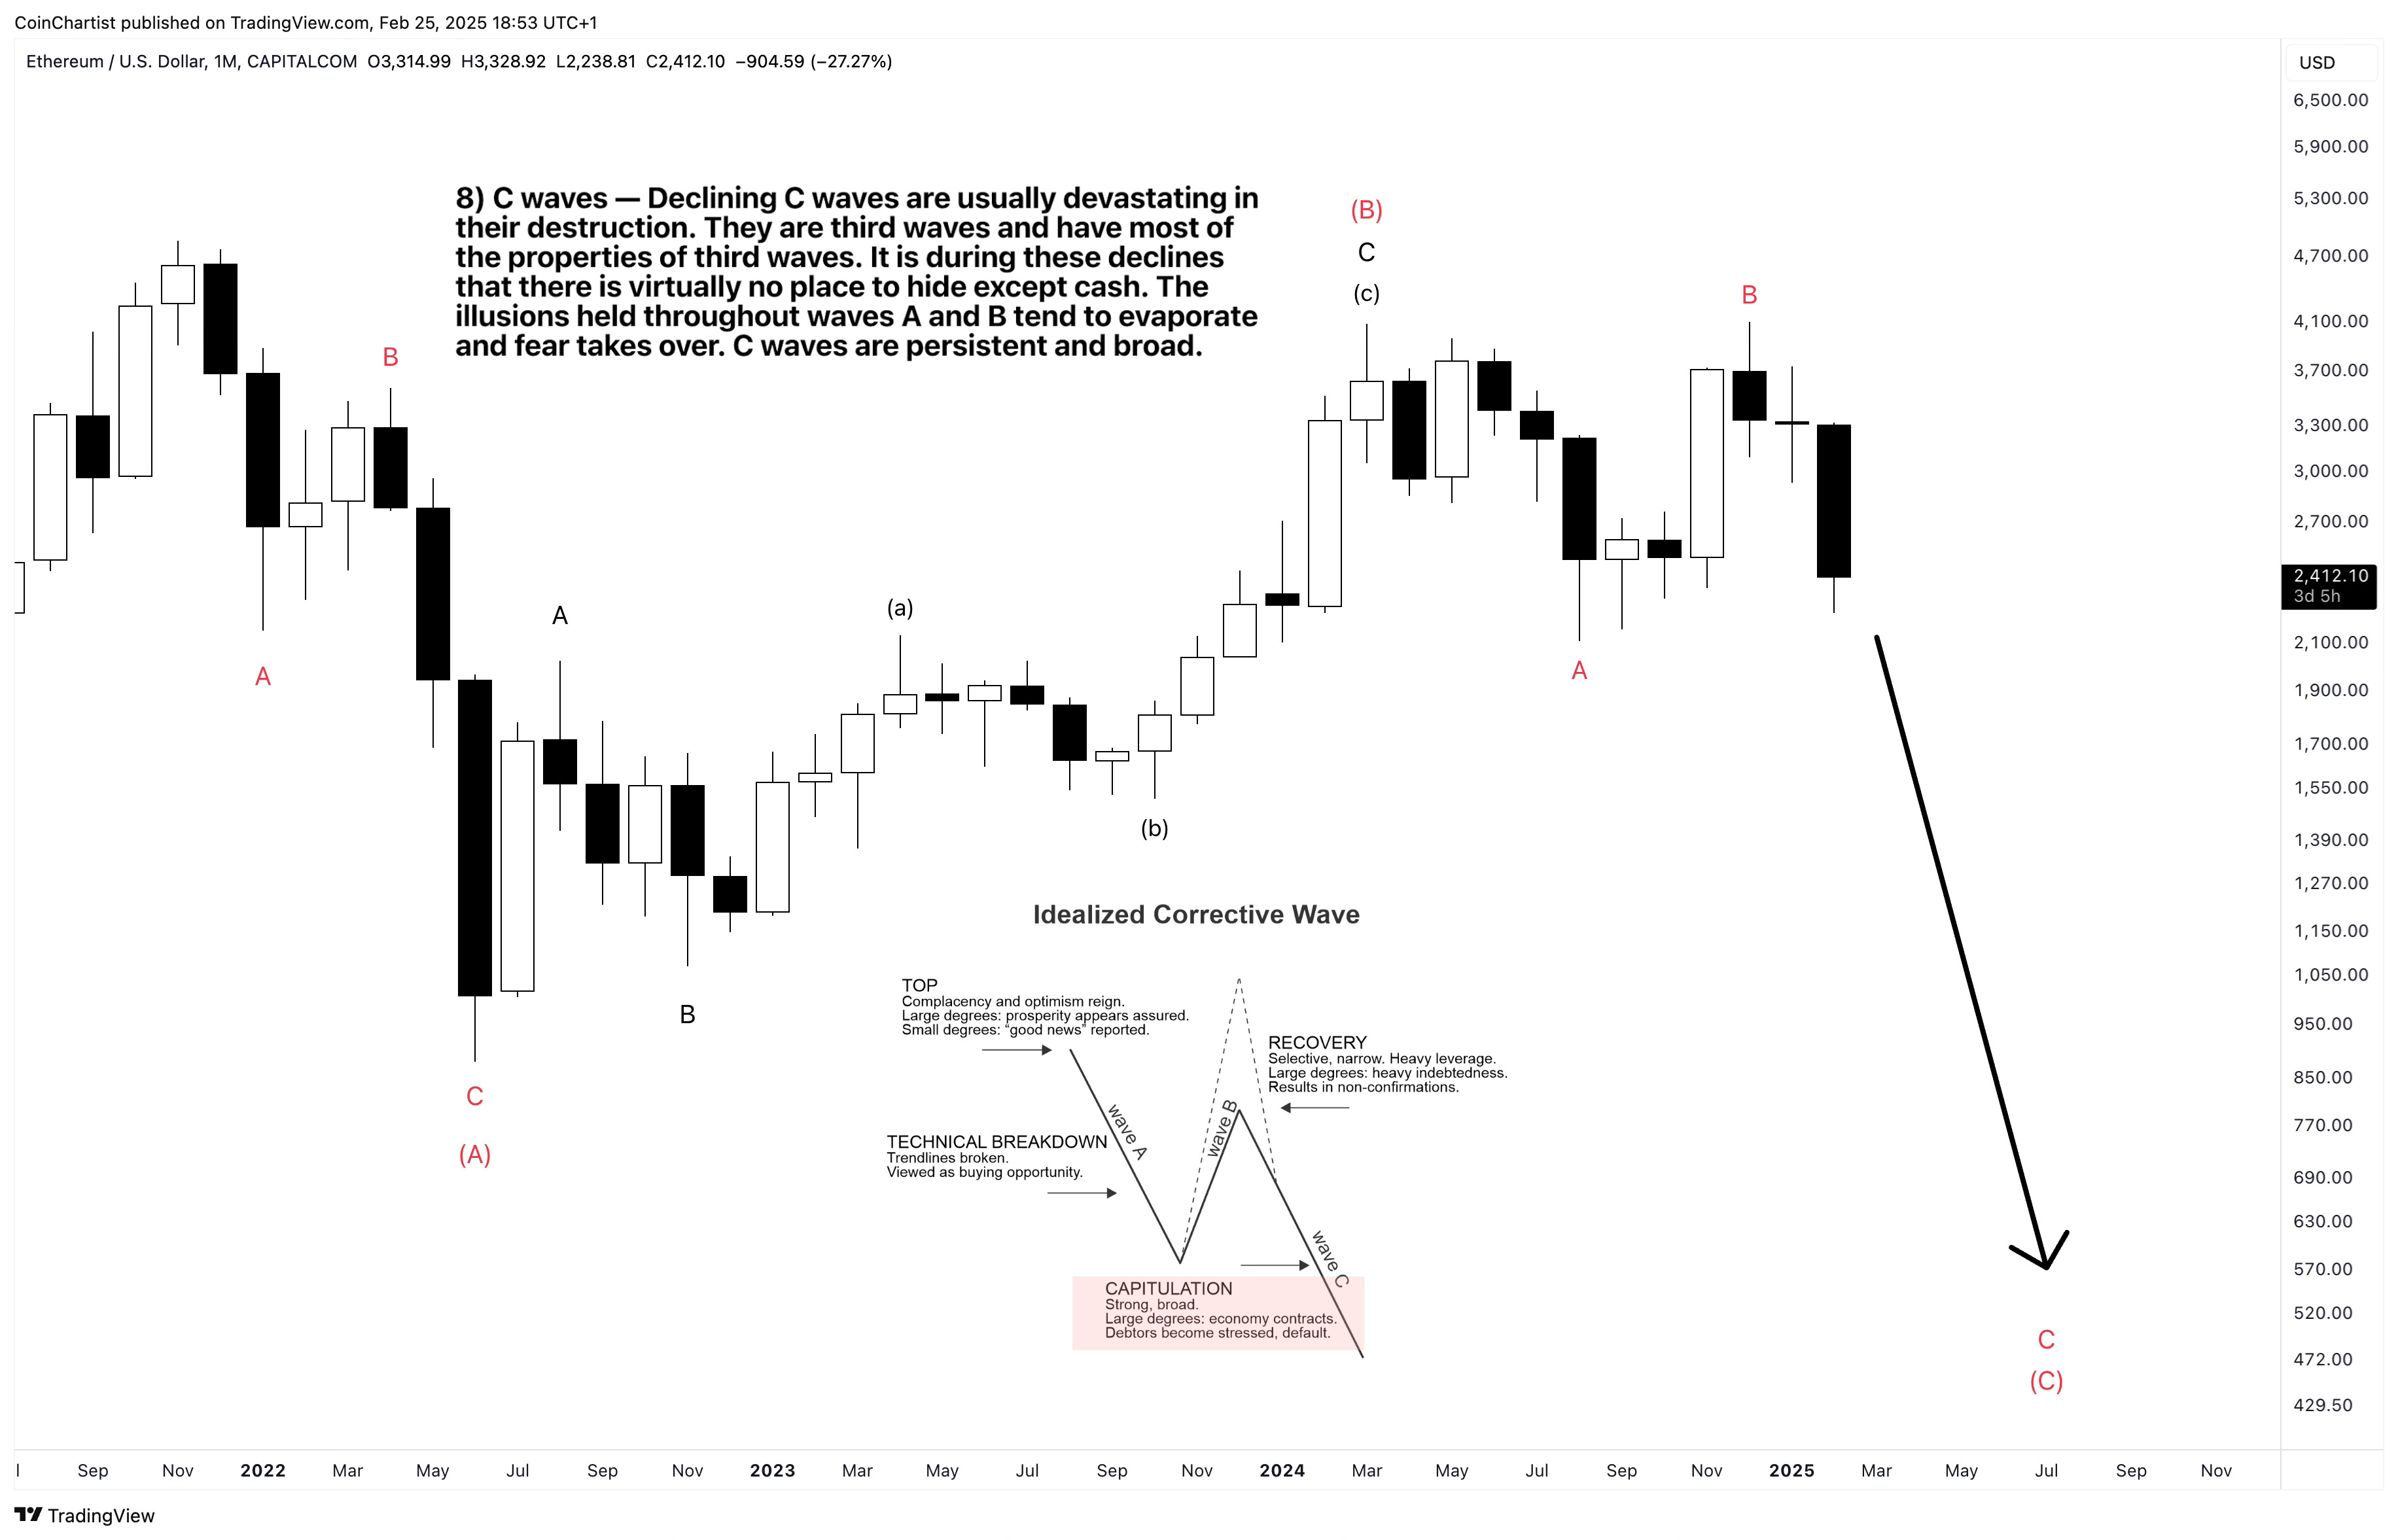
When a B wave ends, a “devastating” C wave begins. These are third waves, impulsive in behavior, and driven by emotions like fear. They’re often sharp, fast, and exceed the low of the A wave. This reality could mean that 2022 lows in ETHUSD could be taken out. A higher low could suggest Ethereum is forming a triangle, in which a D and E wave would follow.

We already used certain rules and guidelines previously to confirm Bitcoin’s primary degree wave count, and we can do the same for the intermediate degree count. Our wave 2 in this case was a sideway flat correction, which alternated with a combo correction with a zig-zag at the end to make it sharp.
Much like the higher degree Bitcoin and Ethereum charts showed some divergent behavior, the zoomed in lower degree view shows much more of this behavior. I point this out, because we can see that Ethereum’s high degree B wave ended just as Bitcoin’s intermediate degree wave 3 ended. Just like the larger degree wave 4 in Bitcoin kicked off Ethereum’s A wave, the intermediate degree wave 4 is kicking off Ether’s C wave. It appears wave 4s of any degree can cause a bearish phase to follow in individual assets.
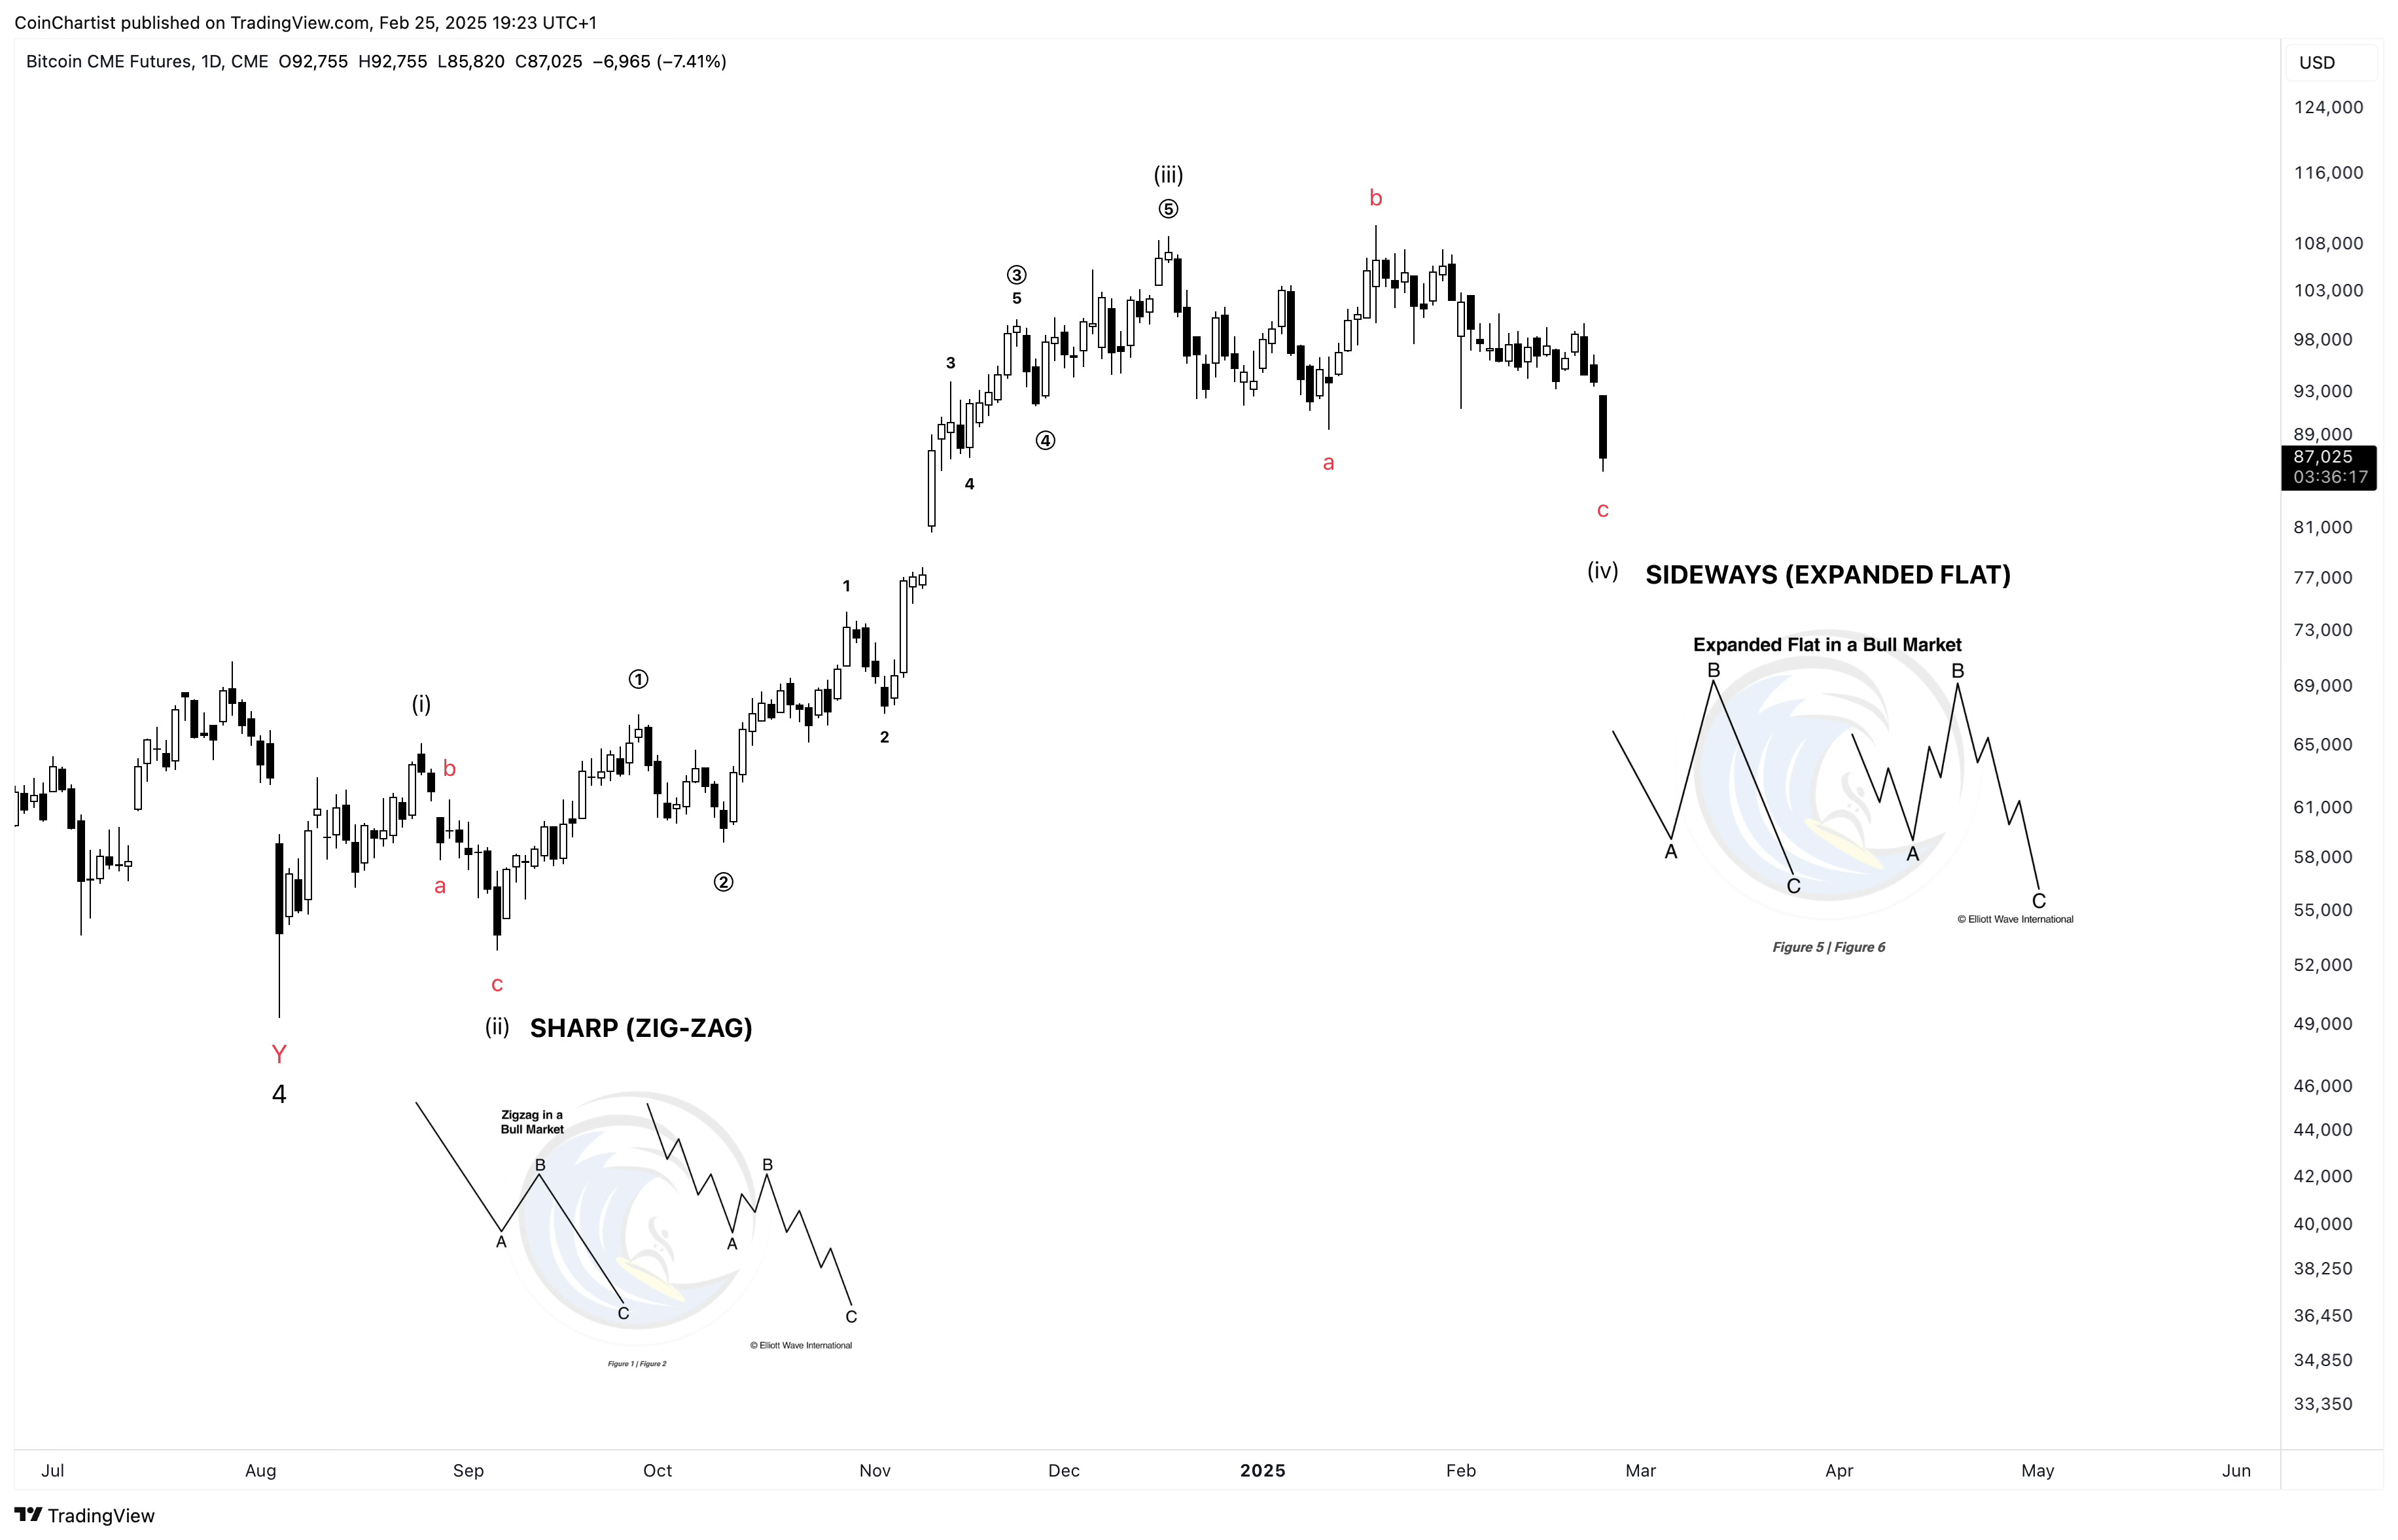
Finally, I am getting to some good news. While all of this could mean Ethereum is cooked, the lower degree wave counts could now support Bitcoin in a subwave 4 expanded flat.
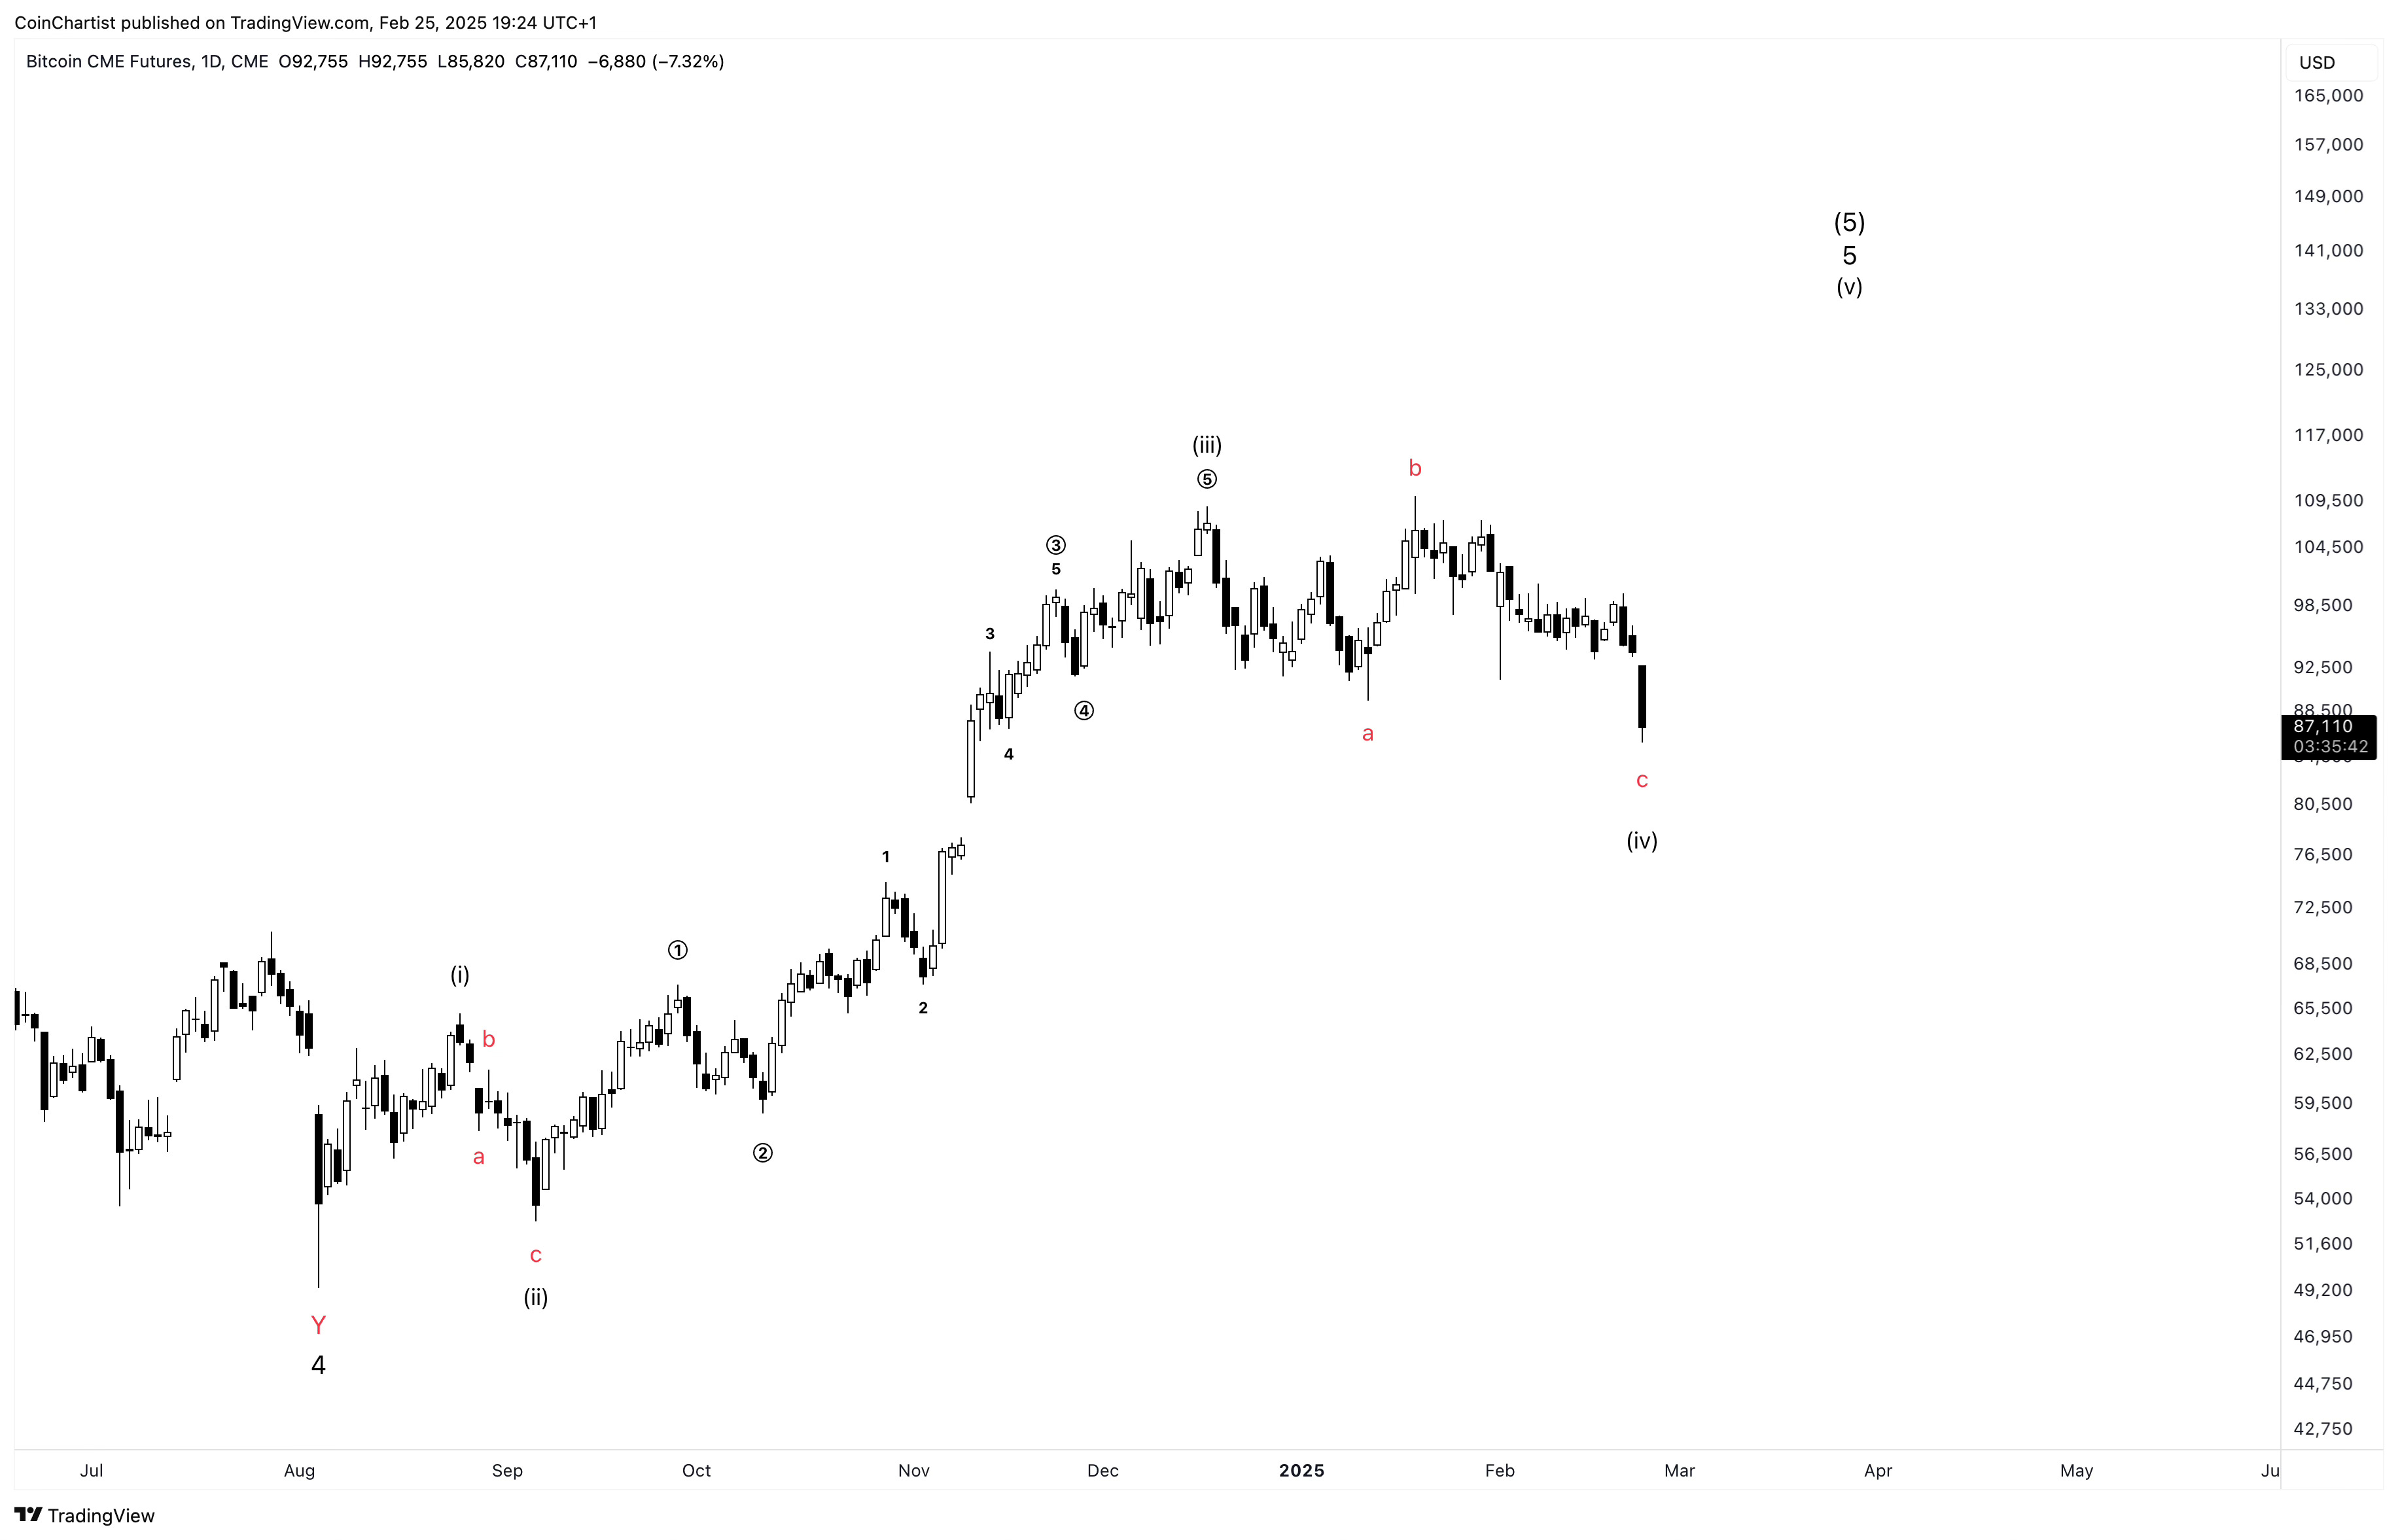
If that’s the case, Bitcoin would have one more subwave v up to go before the top is truly in.
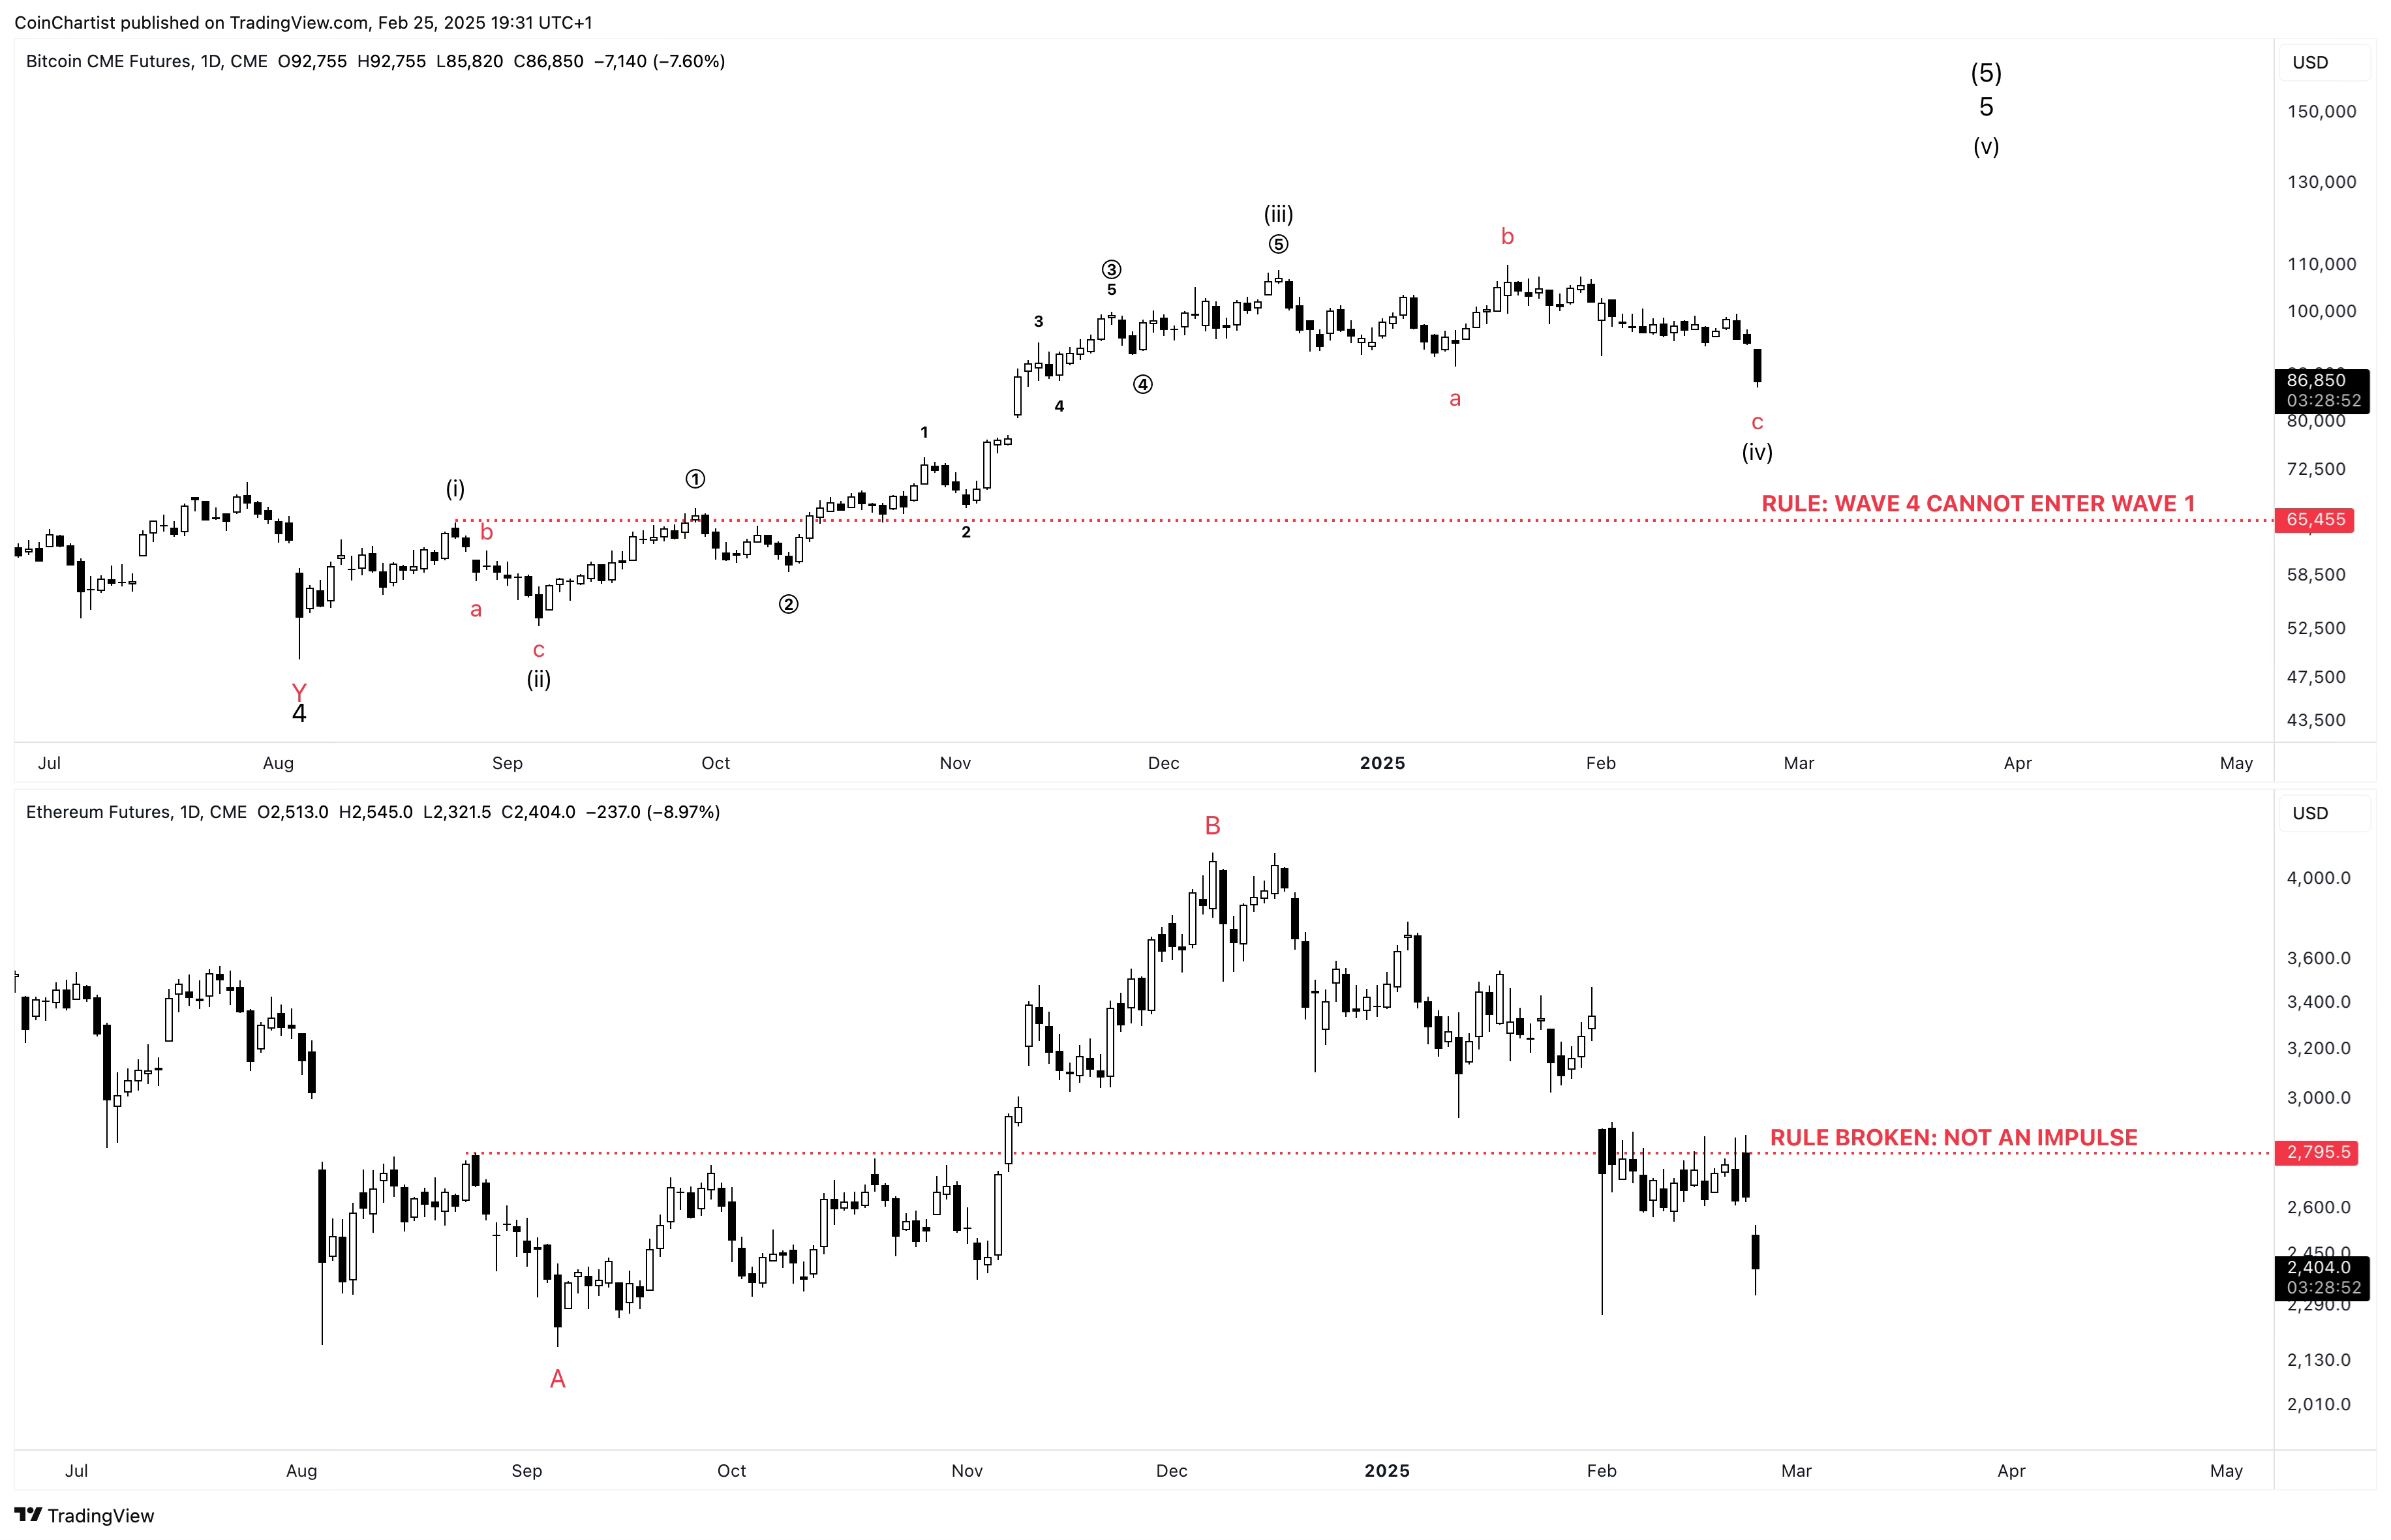
To maintain this count, Bitcoin cannot enter what would be wave 1 territory. Once again, Bitcoin maintains the right look while Ethereum doesn’t. Ethereum shows complete impulse invalidation by entering what would be wave 1 price territory. And once again, even on the lowest degrees, Ethereum began its bearish phase once Bitcoin completed its subwave iii and began subwave iv.
Closing thoughts: This was a tough issue to write, because even I don’t want this to be the fate of the crypto market. I wanted more upside in Bitcoin, and I had expectations for many altcoins. But if I shed my hopes and personal biases, and stick only to objective technical signals supplemented with subjective yet evidence-driven wave counts, I cannot deny that something just feels off.
I have felt something was wrong with this market for a couple years now. I got Bitcoin mostly right all along except for how long it would take, but altcoins have been deceptive to chart. Many times they showed buy signals, only to be massively rejected. Perhaps it is the contracting macro conditions associated with a fifth wave that is responsible for the lack of breadth. Whatever the case may be, wave personalities and counts do one hell of a job describing what’s going on in crypto, and Elliott Wave Principle was developed all the way back in the 1930s.
Until there is more clarity, I have to go with what the charts are telling me, and at the moment there’s a real chance a nasty Crypto Winter is inching closer and closer.
Thank you for being a CoinChartist VIP premium subscriber.
Remember to leave a comment, hit like, or restack this content.
Please feel free to contact us with any issues or inquiries by emailing coinchartist@gmail.com.
-Tony “The Bull” Severino, CMT