

2026 Preview
What to expect from Bitcoin, altcoins, stocks, metals, macro, and more

Disclaimer: The information provided in this Substack newsletter is for general informational purposes only and should not be considered as financial advice. Investing involves risk, and past performance is not indicative of future results. Please conduct your own research or consult a financial advisor before making any investment decisions. The newsletter disclaims any liability for losses or damages arising from the use of this information.
2026 Preview overview:
Bitcoin’s yearly chart is forming a Doji – what this could mean
Quarterly BTCUSD charts are riddled with bearish signals
The quarterly timeframe is also forming an Evening Star pattern
Why this could mean upwards of two years of a downtrend
The psychology behind the pattern
Examining the business cycle and its impact on Bitcoin, stocks, etc.
The stock market is showing some warning signs, while a secular shift into hard assets (Gold/Silver) takes place
How long will Gold and Silver dominate for and what does this imply for BTC?
The final verdict on Bitcoin’s 4-year cycle and why the 16-year cycle is far more important
Altcoins... What about Altcoins? Why many will go extinct
2025 is almost over, and I don’t think there’s a single person out there that expected this year to play out the way it did. The loudest influencers expected Bitcoin to follow money supply, reach $150,000+, experience a blow off top, and replace Gold on the financial food chain. They were certain altcoin season was coming — it was just a matter of timing. None of these things came to fruition.
Unlike past cycles, when liquidity was abundant and the business cycle kicking in sent Bitcoin parabolic, we got a muted rally and incremental new highs. Although a higher high was made in late 2025 over early 2025’s “inauguration peak,” it only resulted in a little more than a 15% gain. The lack of confirmation signals and a breakout into a renewed trend point more to a complacency phase (in Elliott Wave Principle referred to as a B wave) at the second “peak.”
In the past, as Bitcoin topped, retail investors rolled profits into altcoins. Bitcoin’s institutional bid saw entities enter with a much longer investment horizon and more diligence in what assets they choose. Simply put, they’d rather stay in Bitcoin or roll back into cash rather than increase risk in altcoins. Less retail participation means less Bitcoin sellers rolling profits into altcoins, and less altcoin buyers in general.
An era where precious metals are outperforming everything highlights risk-averse sentiment and a focus on proven value as a hedge. Bitcoin could be a hedge but it isn’t truly proven like Gold is. Altcoins have no place in the discussion around proper monetary hedges, due to their lack of longevity and significant risk structure. All of this is reflected in price action this year.
This risk was put in the spotlight on October 10th when the market saw unprecedented liquidations. Everyone started to second-guess touching crypto. Interest hasn’t returned in the same way and both bears and bulls are confused and lack conviction. Since then, the Yen carry trade began to unwind, adding an element of elevated risk to the market. Unemployment skyrocketed. Economic conditions are rapidly deteriorating. This has created Bitcoin’s most indecisive year yet – but that could mean a decision comes next year.
2025: Bitcoin’s Most Indecisive Year Yet
All of this confusion and indecision around Bitcoin in 2025 has appeared in the yearly (12M) chart as a Doji. The Doji features the smallest real body in Bitcoin’s history.
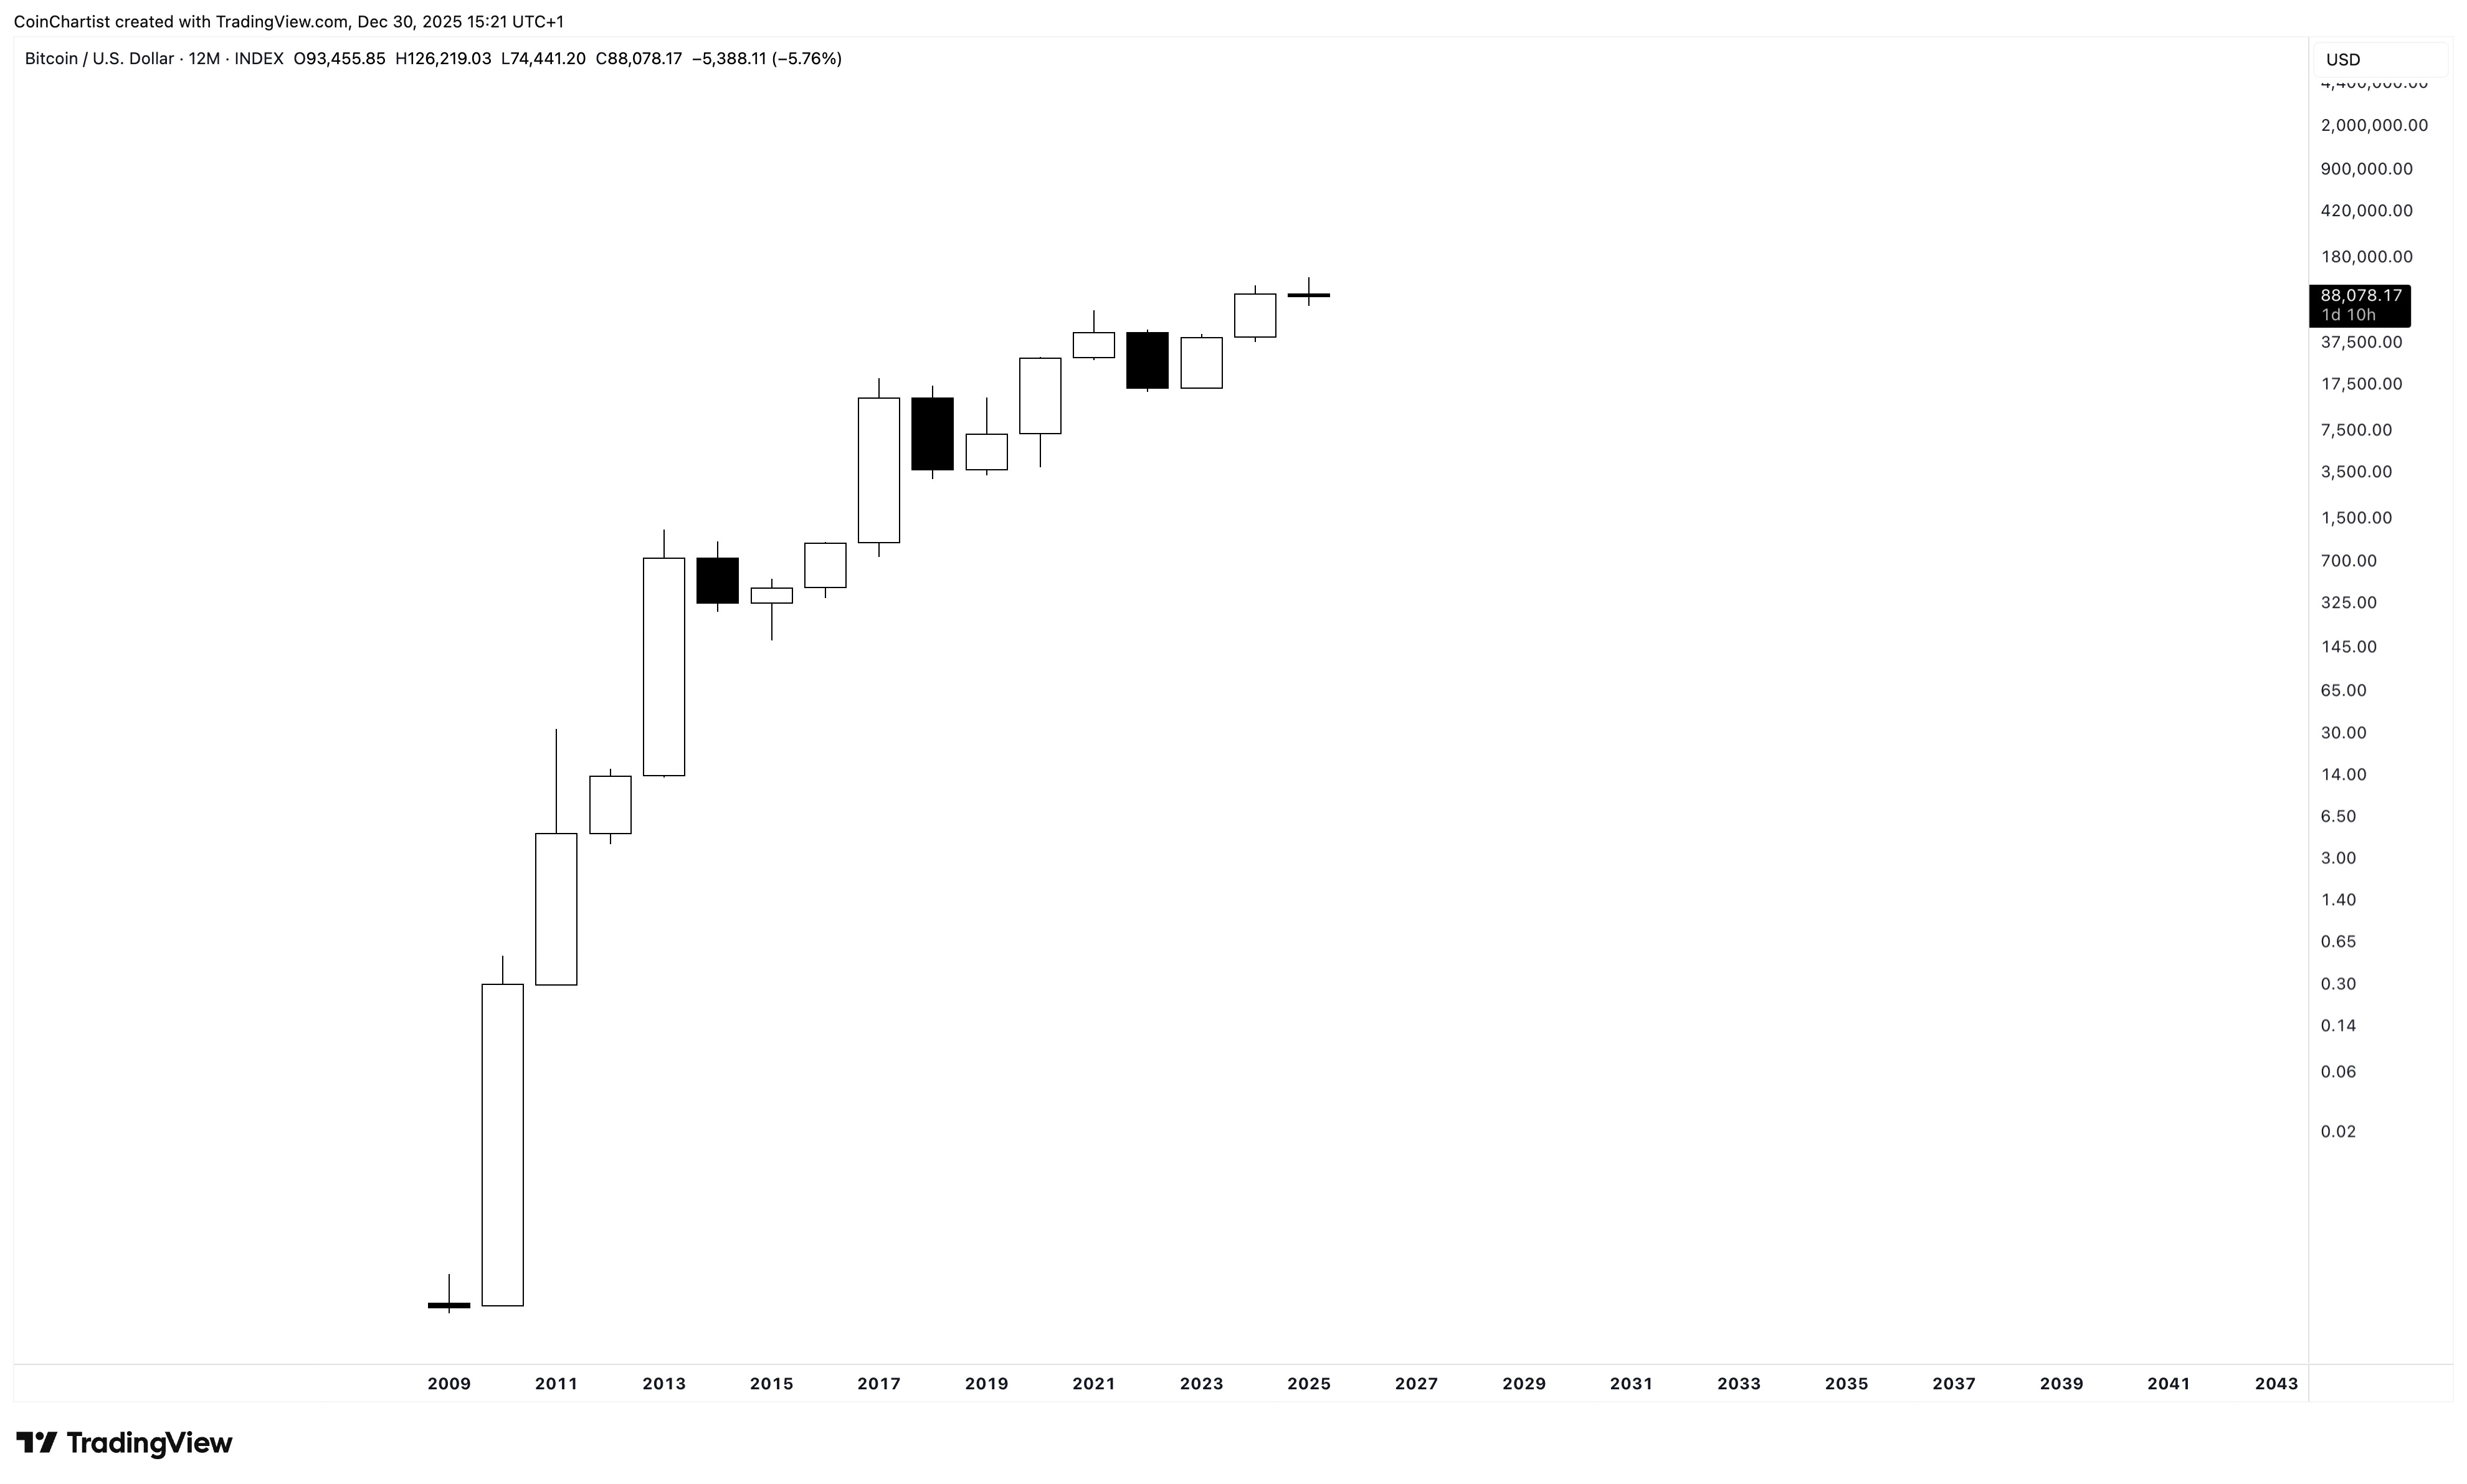
A Doji is not a reversal signal, but it can produce a reversal. It represents a pause in a trend from indecision. If we follow the entire price chart up from the beginning, we can see momentum was strong to start, leading to the largest white candlesticks. Over time, white candlesticks get smaller, while black candlesticks start to overwhelm the white. This all translates to a strong trend that’s lost momentum over time, year after year, and has come to the point where a decision must be made: continue up and make the uptrend obvious again, or reverse and show that the uptrend is over.
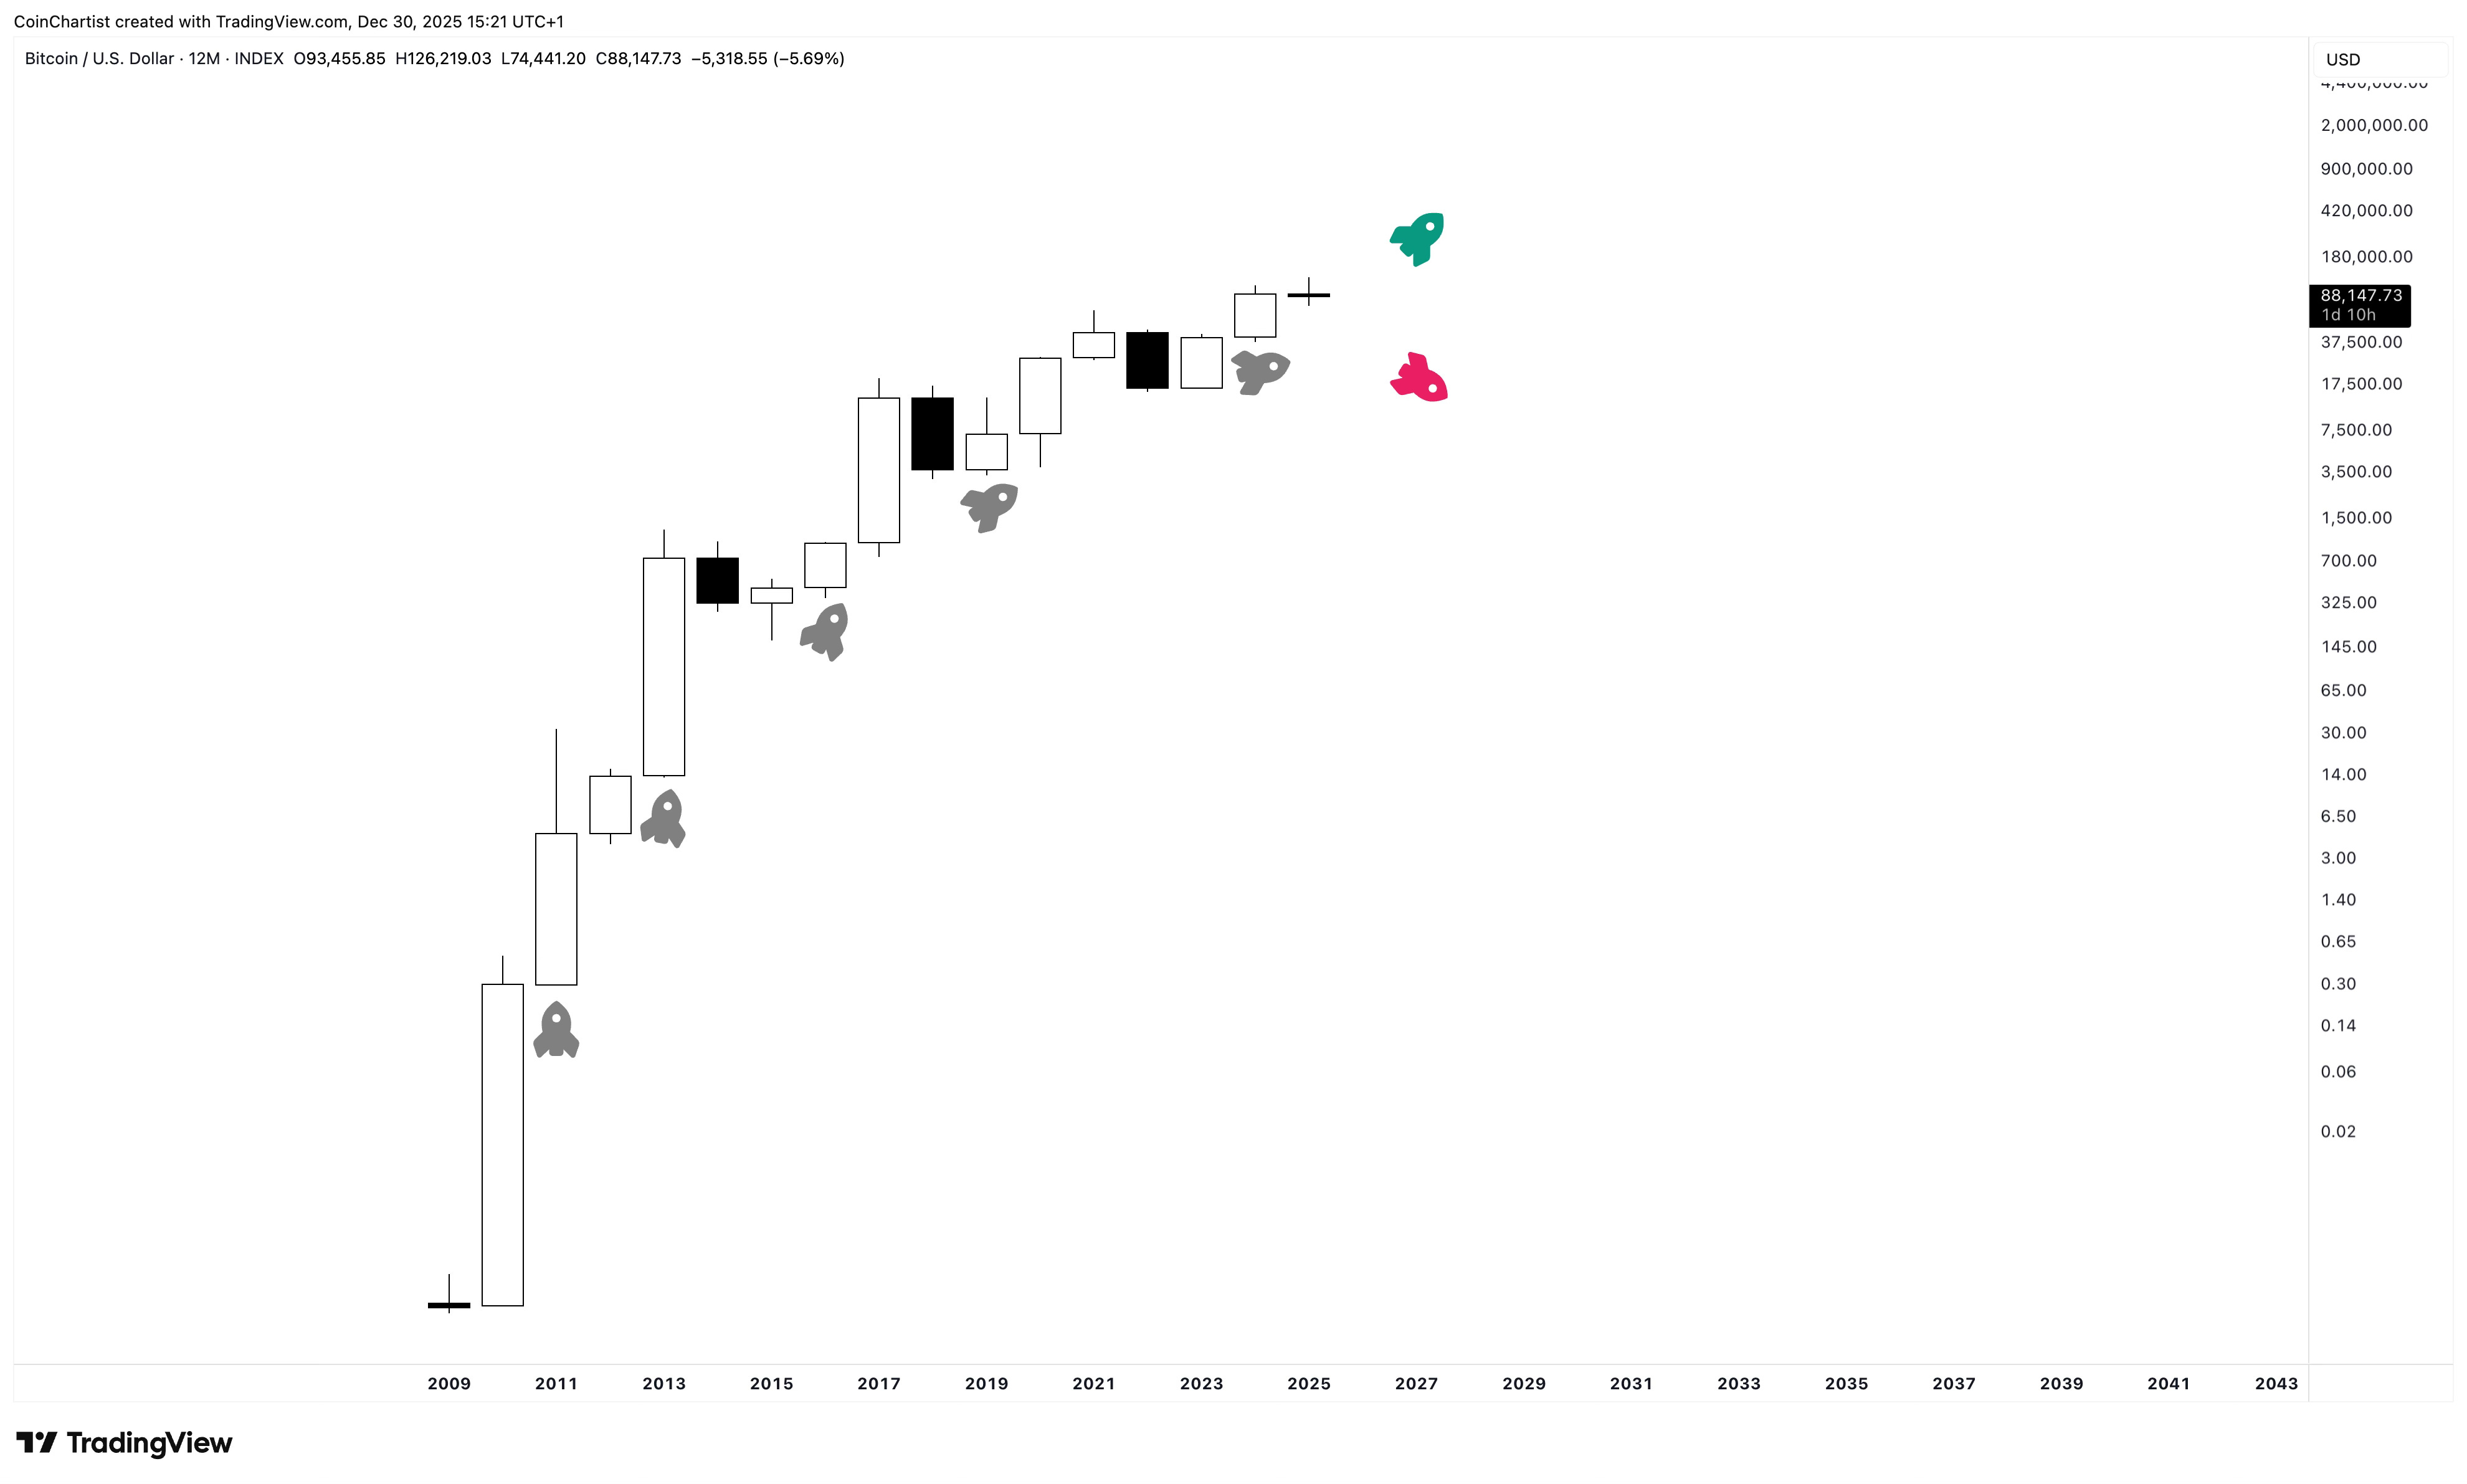
Imagine Bitcoin as a rocket ship. As it left orbit, its trajectory began to slope less aggressively and is now moving nearly sideways. Think of the Doji as either a point the rocket ship will refuel and continue its mission, or its run out of fuel and is going to begin to fall in the other direction. That’s what’s happening here. Sideways is possible, but more likely is a climactic conclusion.
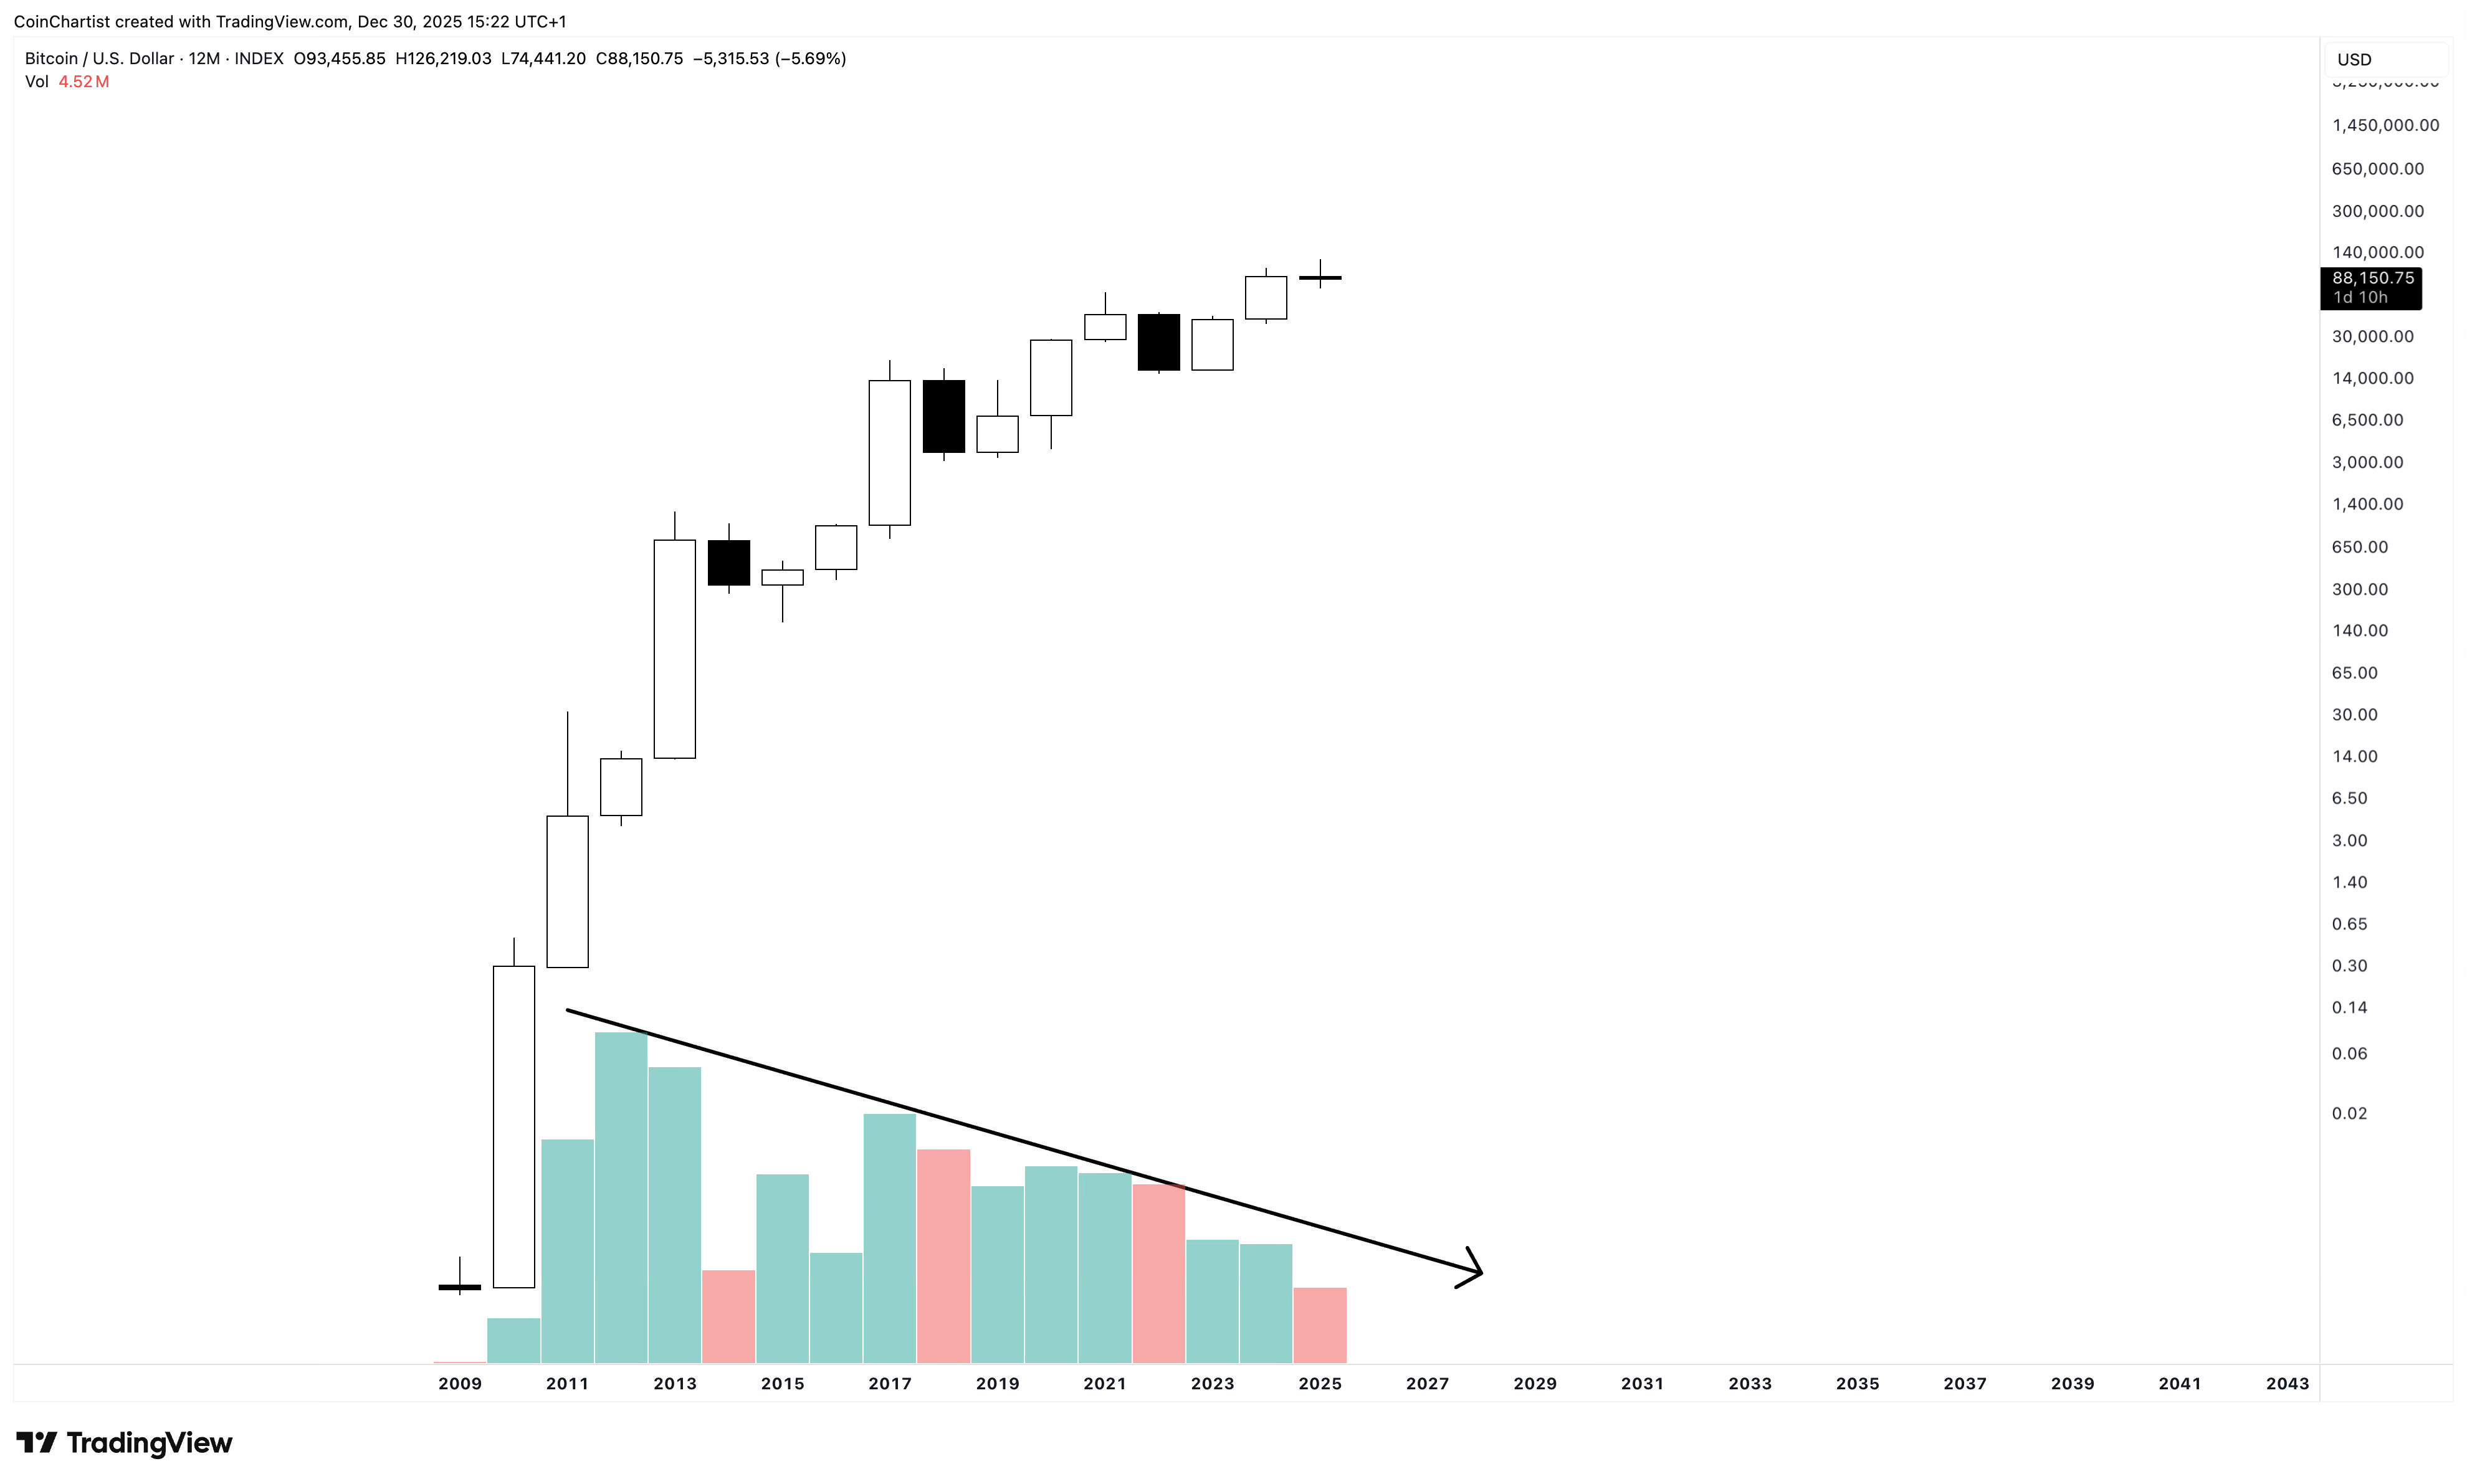
It is not too surprising to see volume declining over time. Of course less coins will change hands when it is priced at $88,000 than it would at 88 cents. But if we see a large red volume bar that is higher than any previous volume bars, then it could help confirm a major trend reversal.
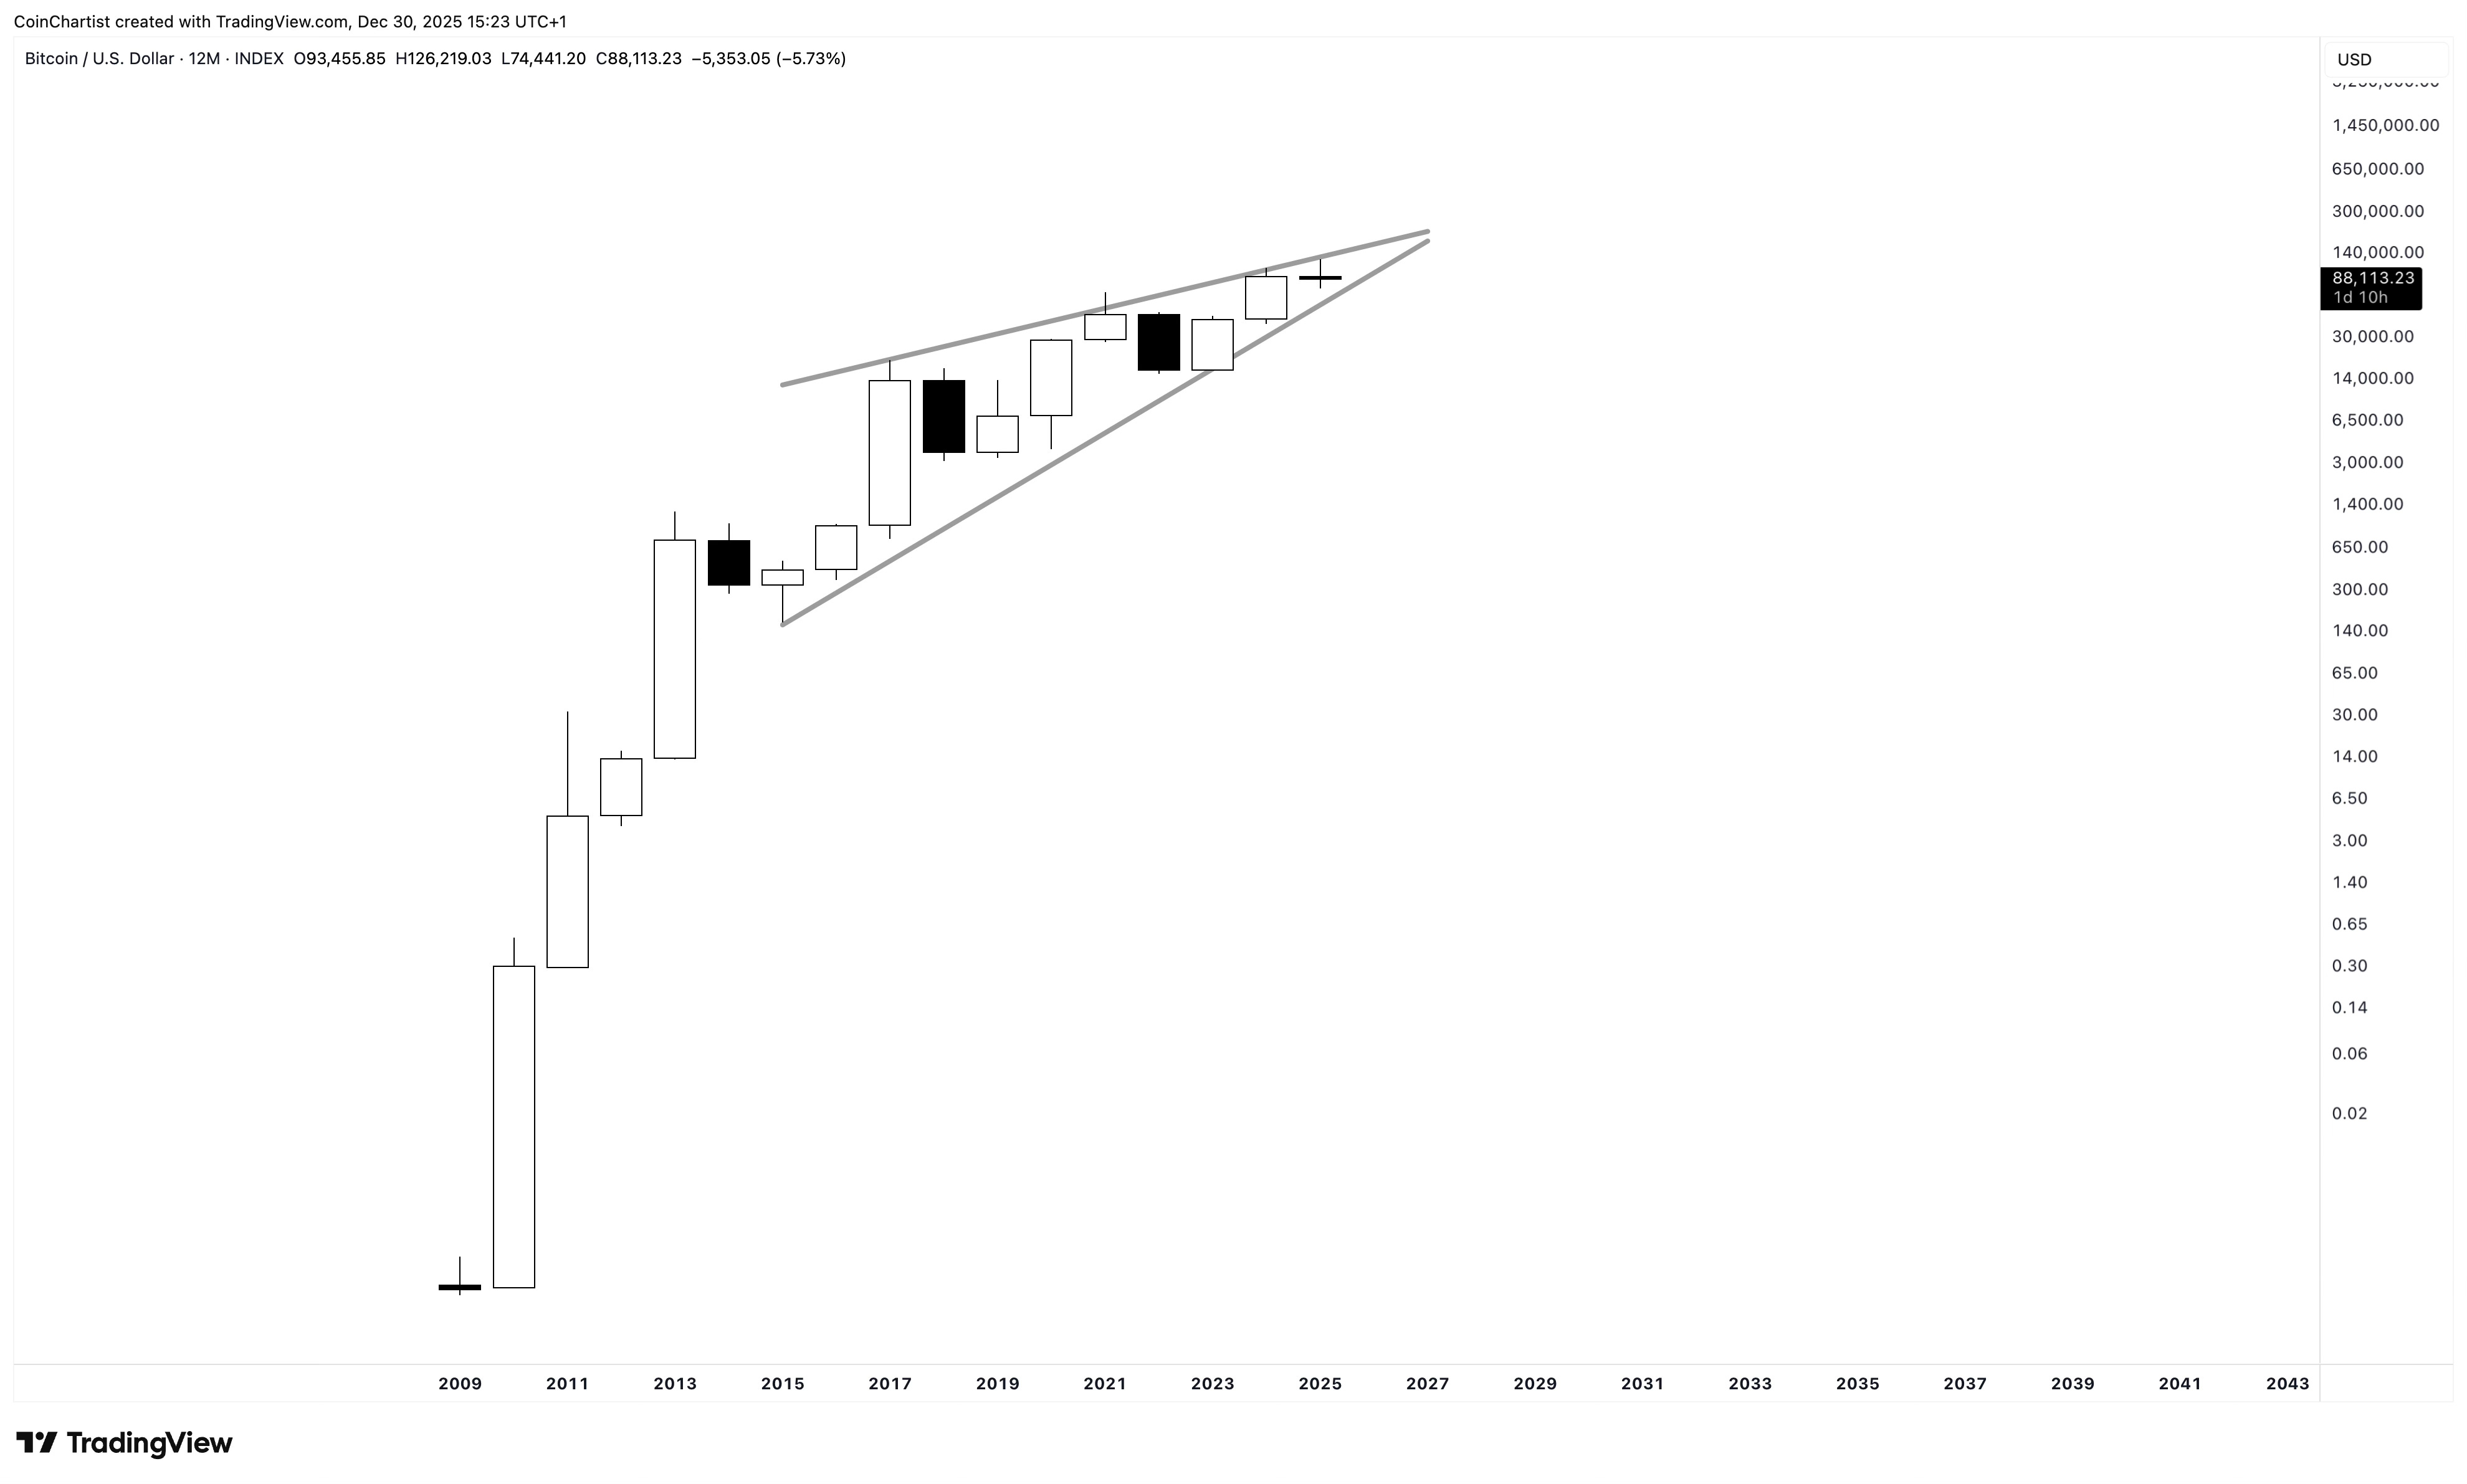
Price is contracting inside a wedge-like shape. The first instinct is to consider an Ending Diagonal, however, the internal subdivisions don’t support such a wave count. This wedge-like shape still shows price contracting over time and if the current yearly Doji is a pause before a reversal, the next yearly candle would fall out of the wedge to the downside. Remember, though, such a structure can also break to the upside, it just seems unlikely at this point given technicals and the macro backdrop.
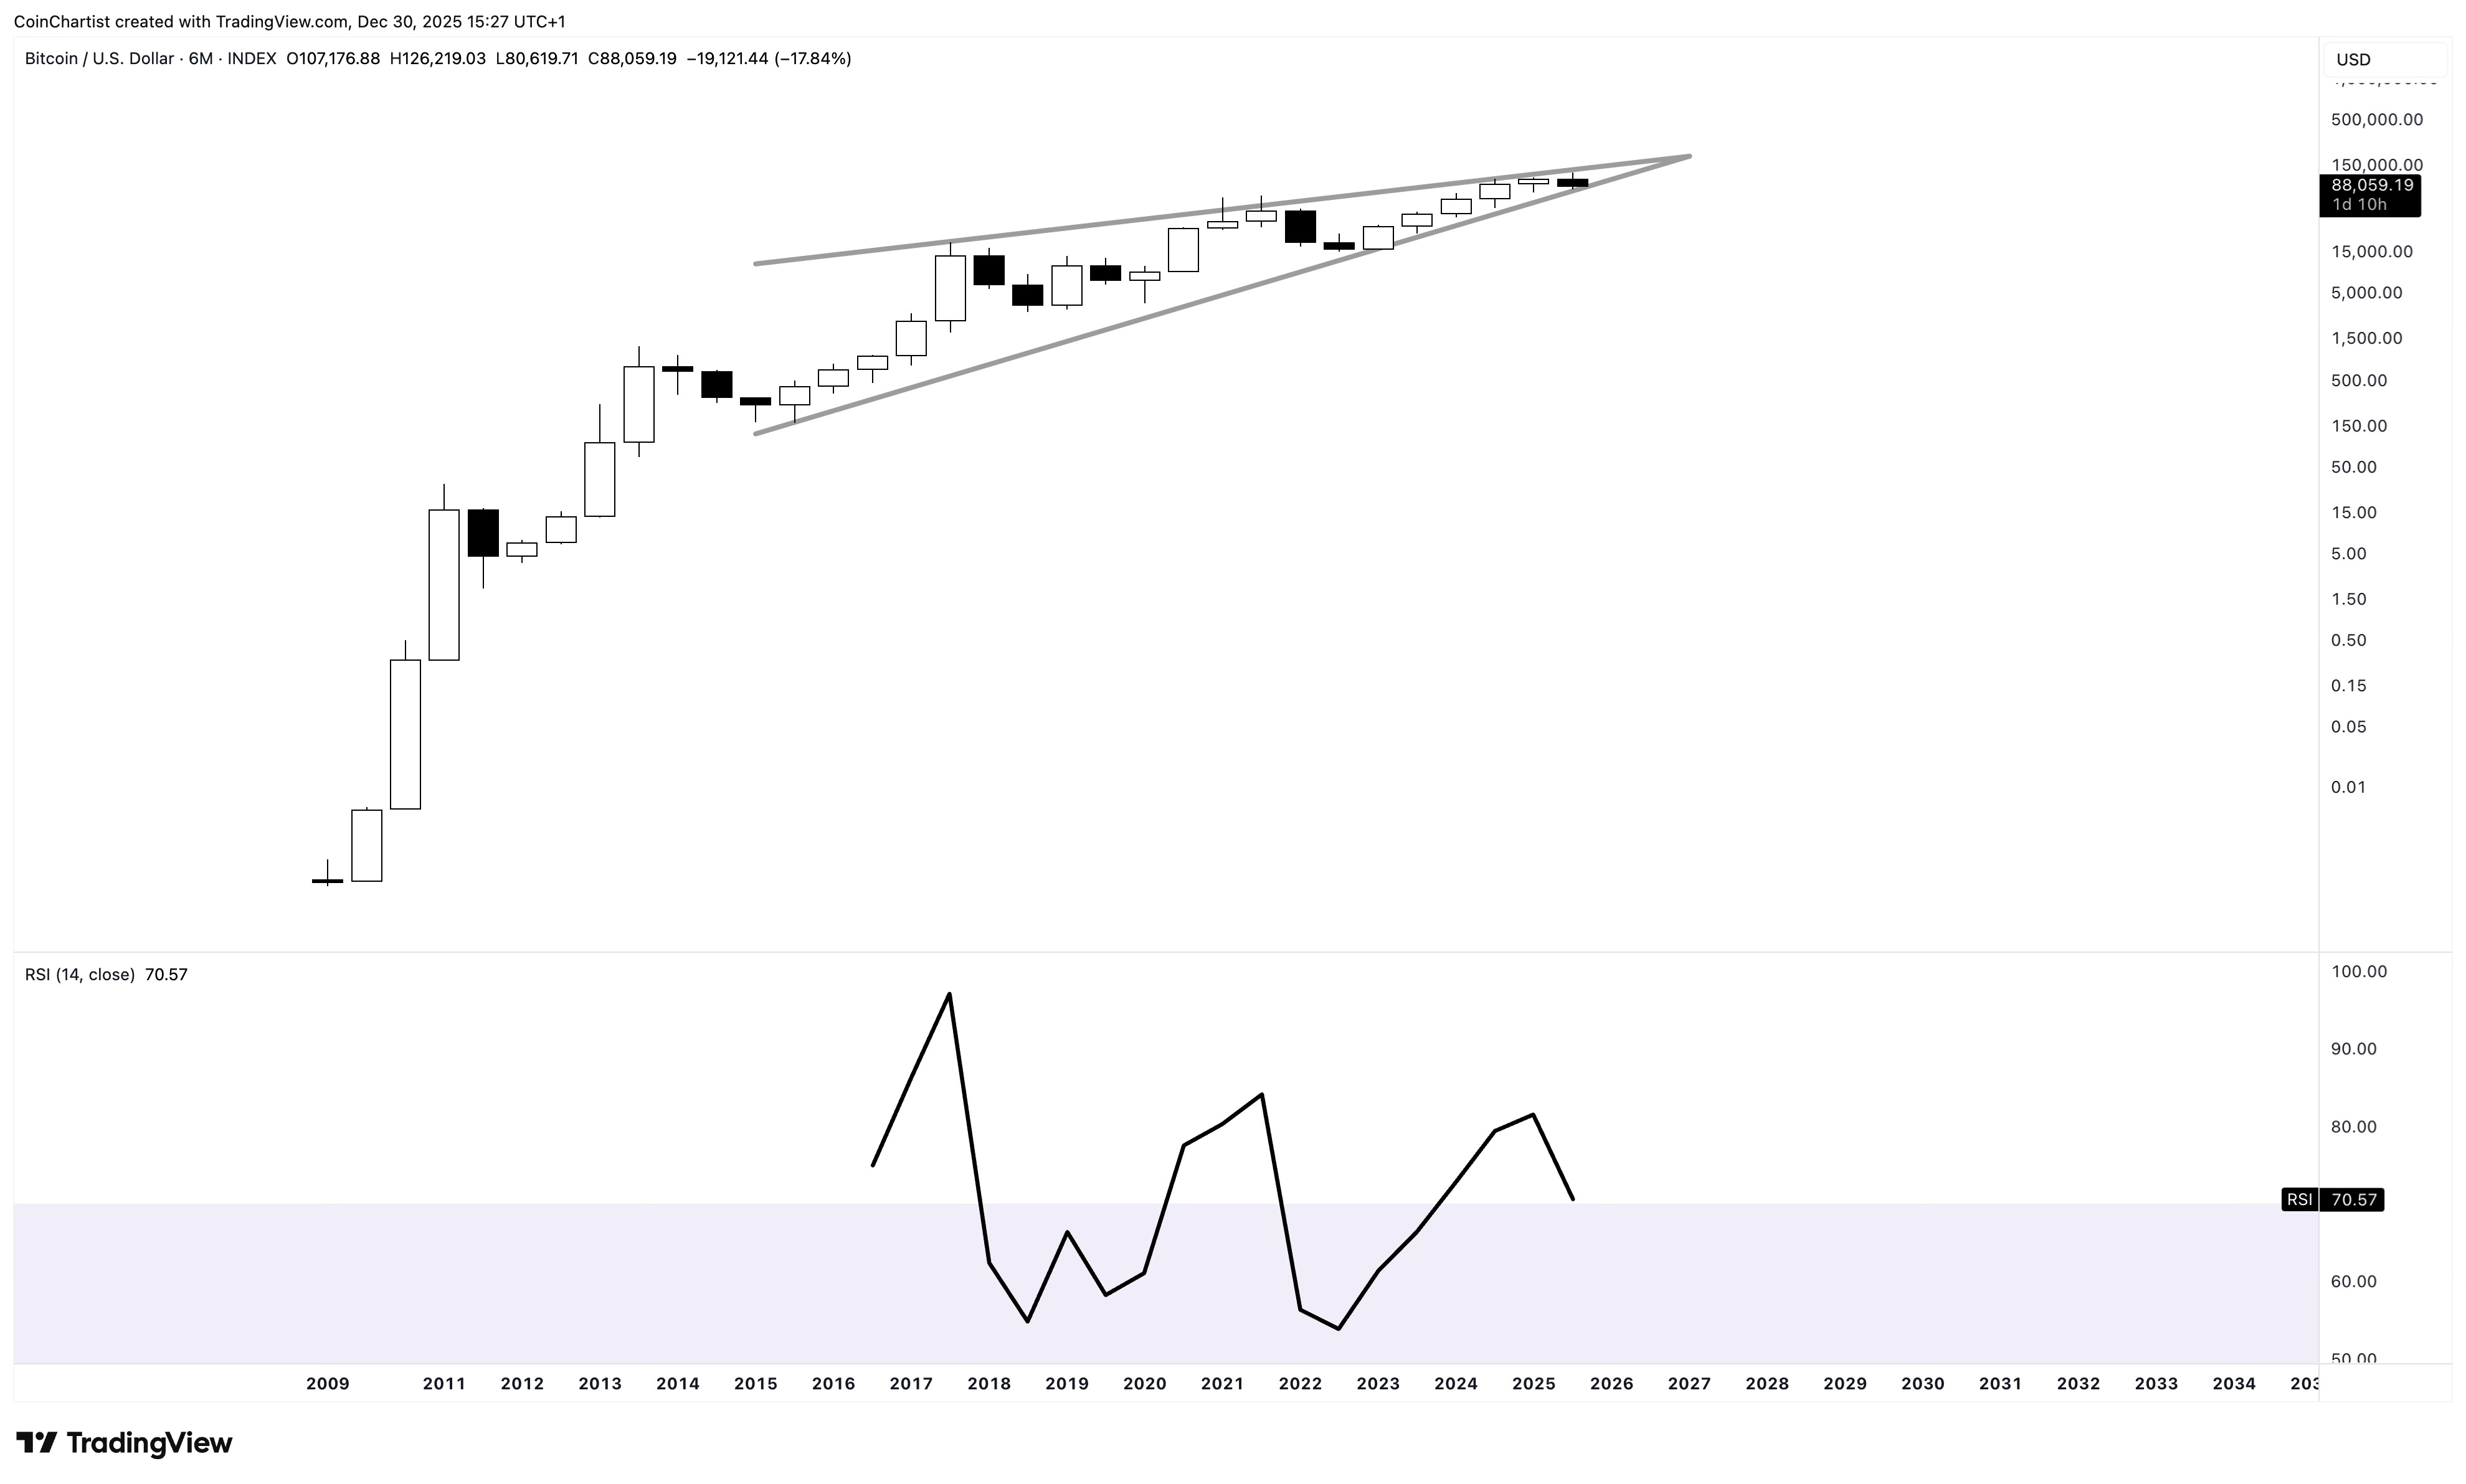
Although this section is focused on the yearly timeframe, the lack of price history in BTCUSD means there are very few indicators that produce meaningful signals yet. However, the 6M timeframe — half a year — has twice the data points so indicators do provide signal. Just like the yearly, the 6M candle closes tomorrow night and it could bring the 6M RSI below 70. Below 70 has ended all prior bull markets.
Quarterly Conclusion Sets the Tone for Next Year
The yearly closes tomorrow showing indecision with a Doji candle. The quarterly has a potentially dangerous candlestick pattern of its own to consider. But first, let’s see if there are any quarterly technicals that might support a bearish reversal in Bitcoin on the highest timeframes.
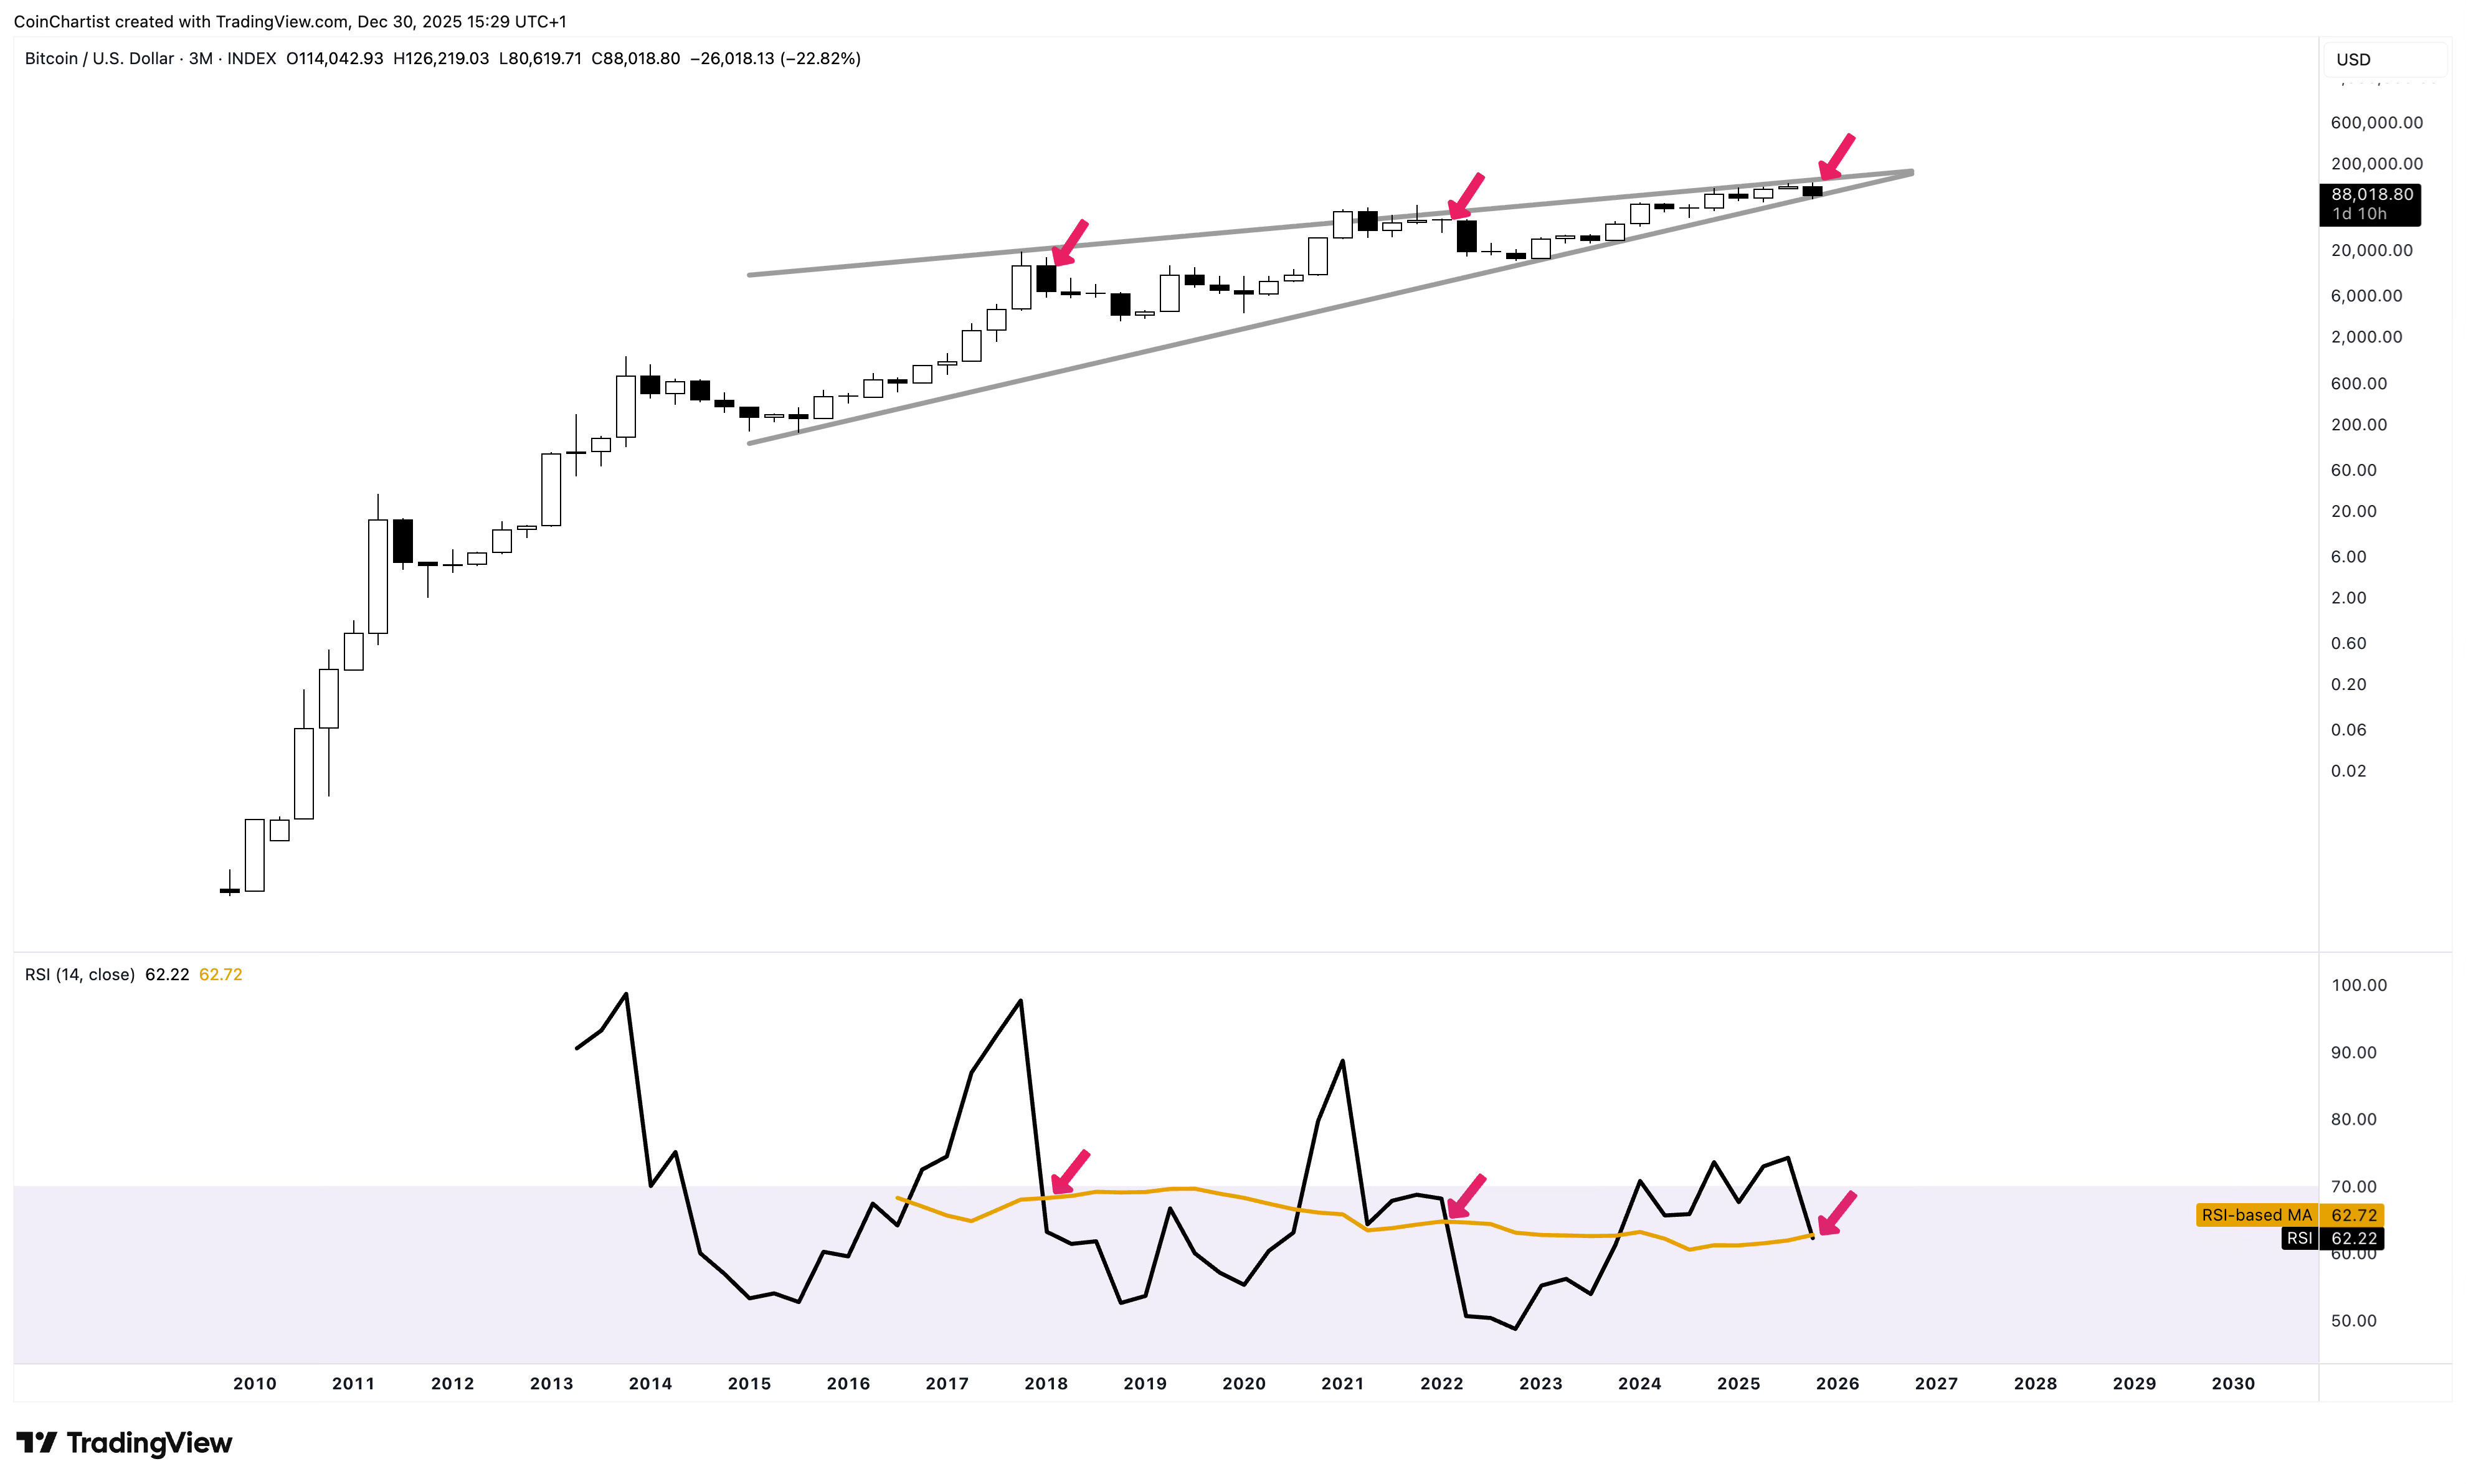
The quarterly RSI is piercing below the RSI-based Moving Average (gold line), which is below 70. Falling below the average in the past has always led to a bear market.
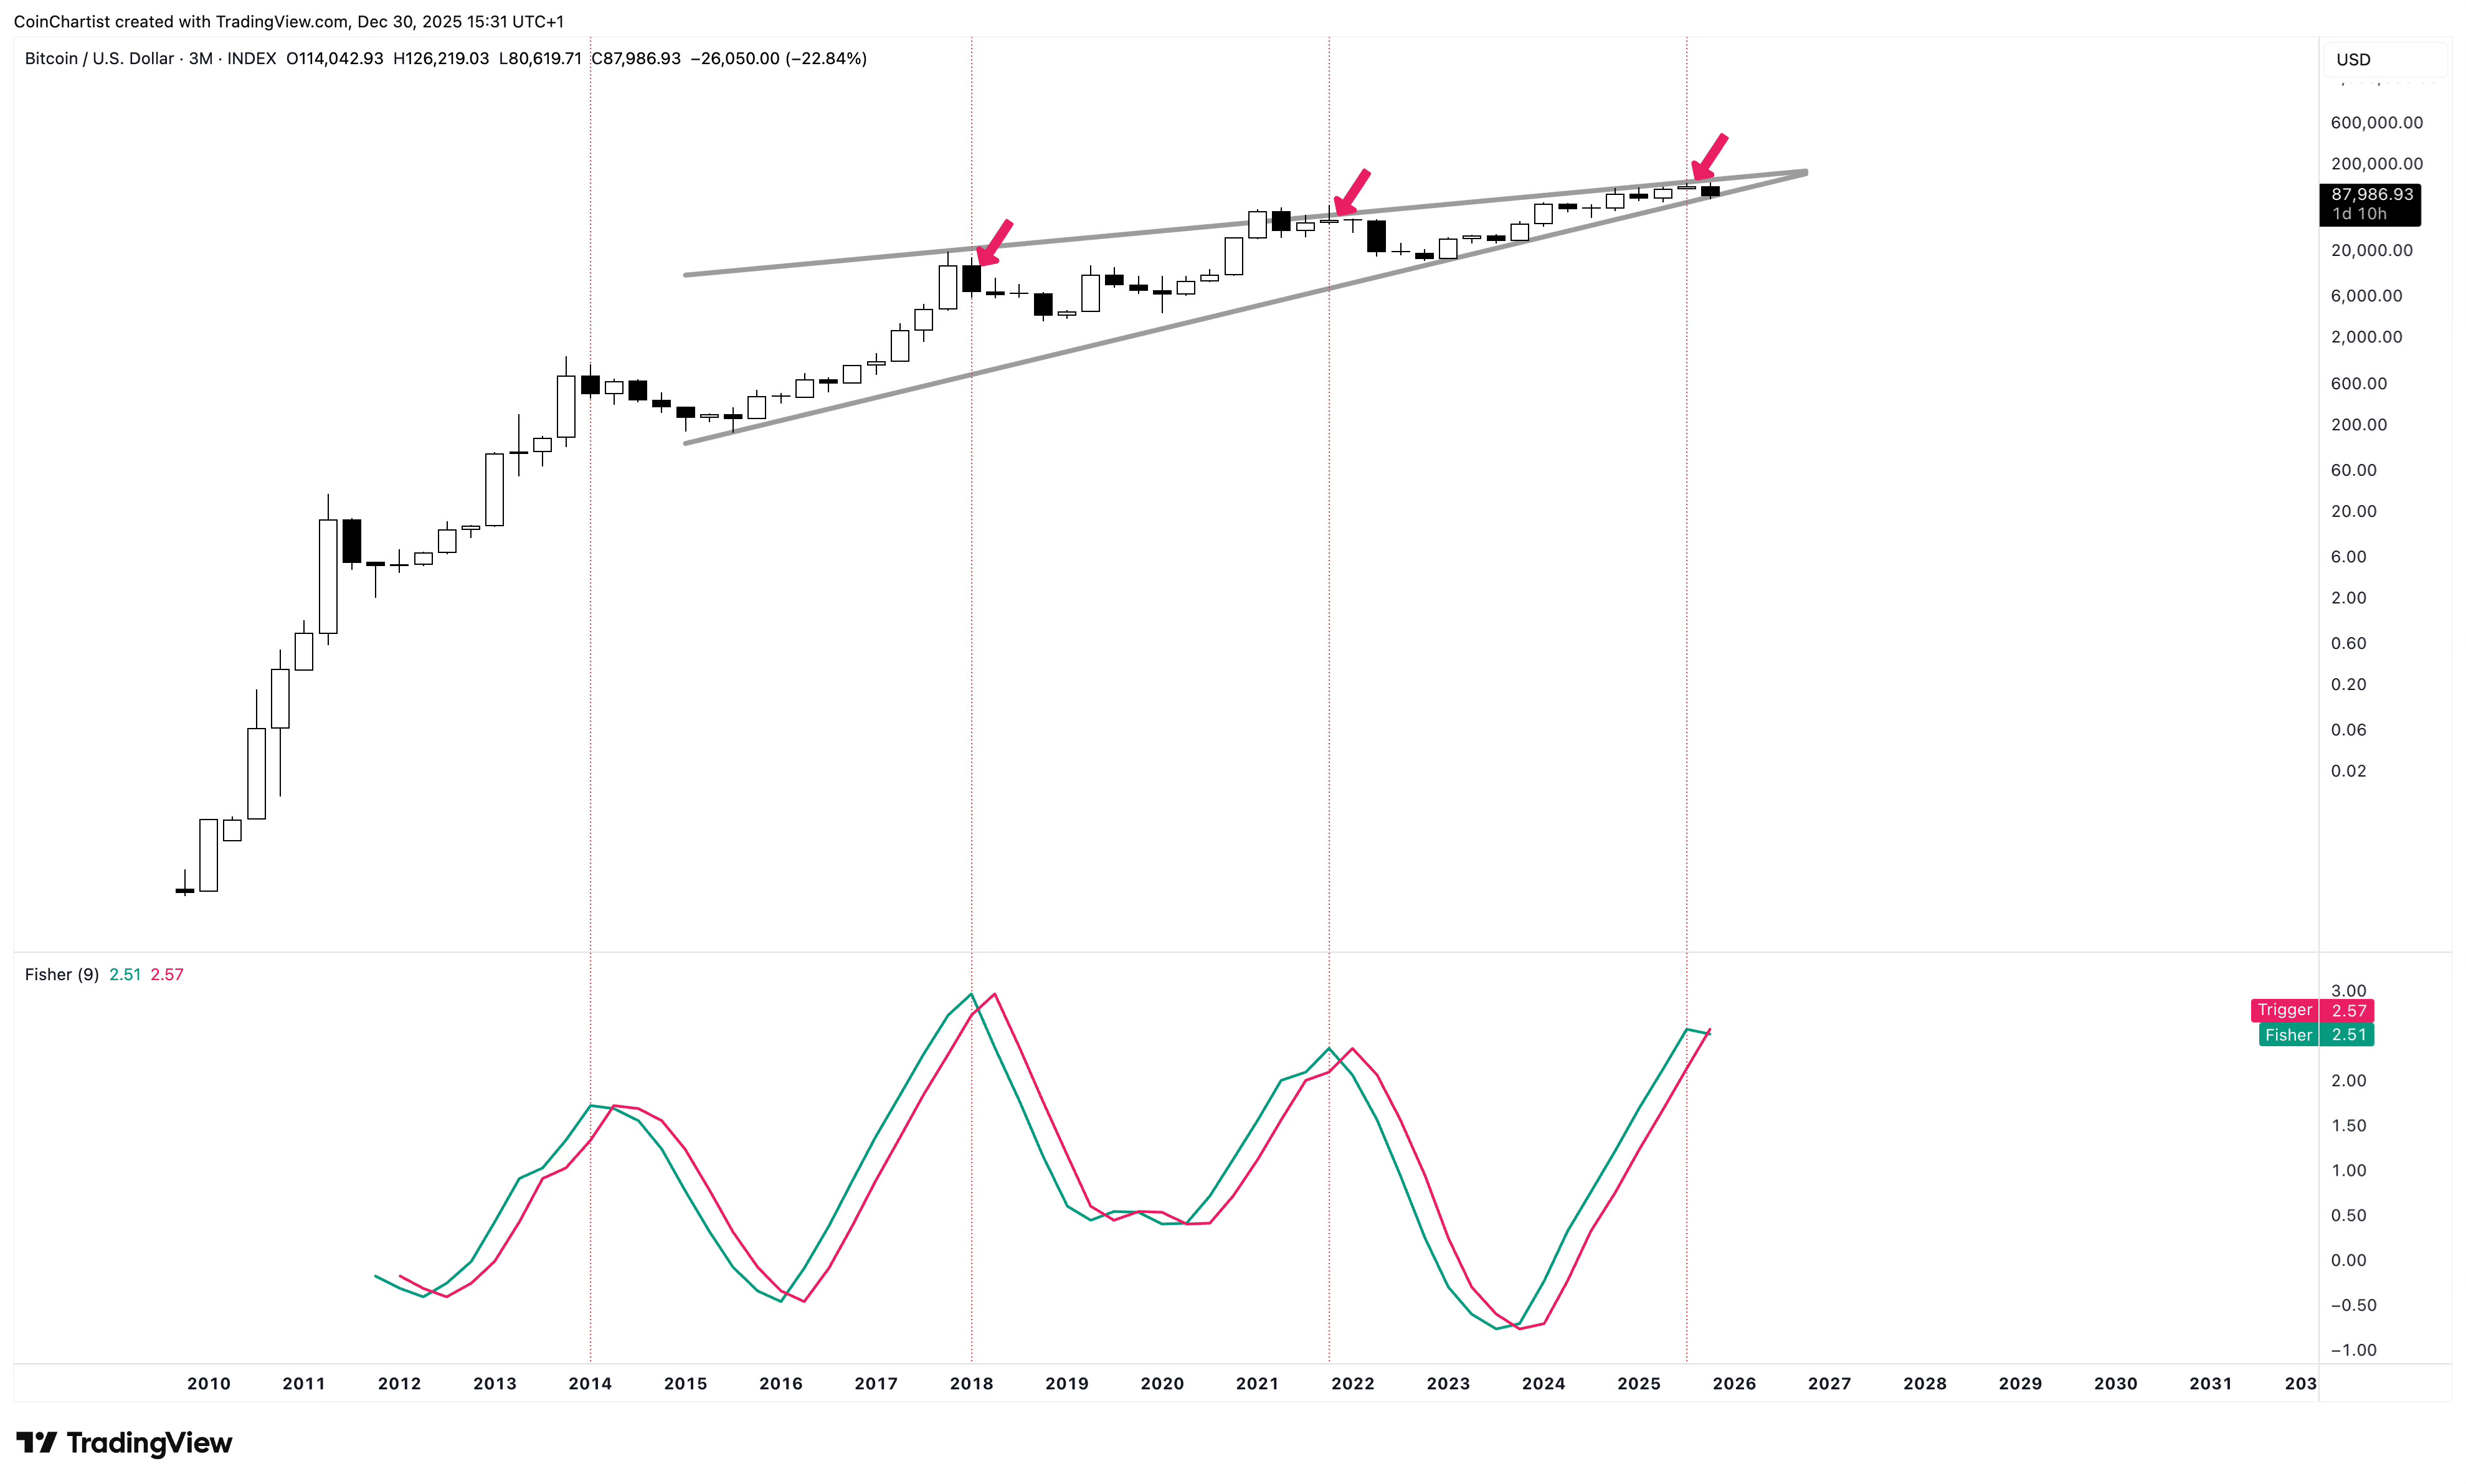
The quarterly Fisher Transform is crossing bearish at statistical highs. Once again, this has typically been a turning point where Bitcoin enters a bear market.
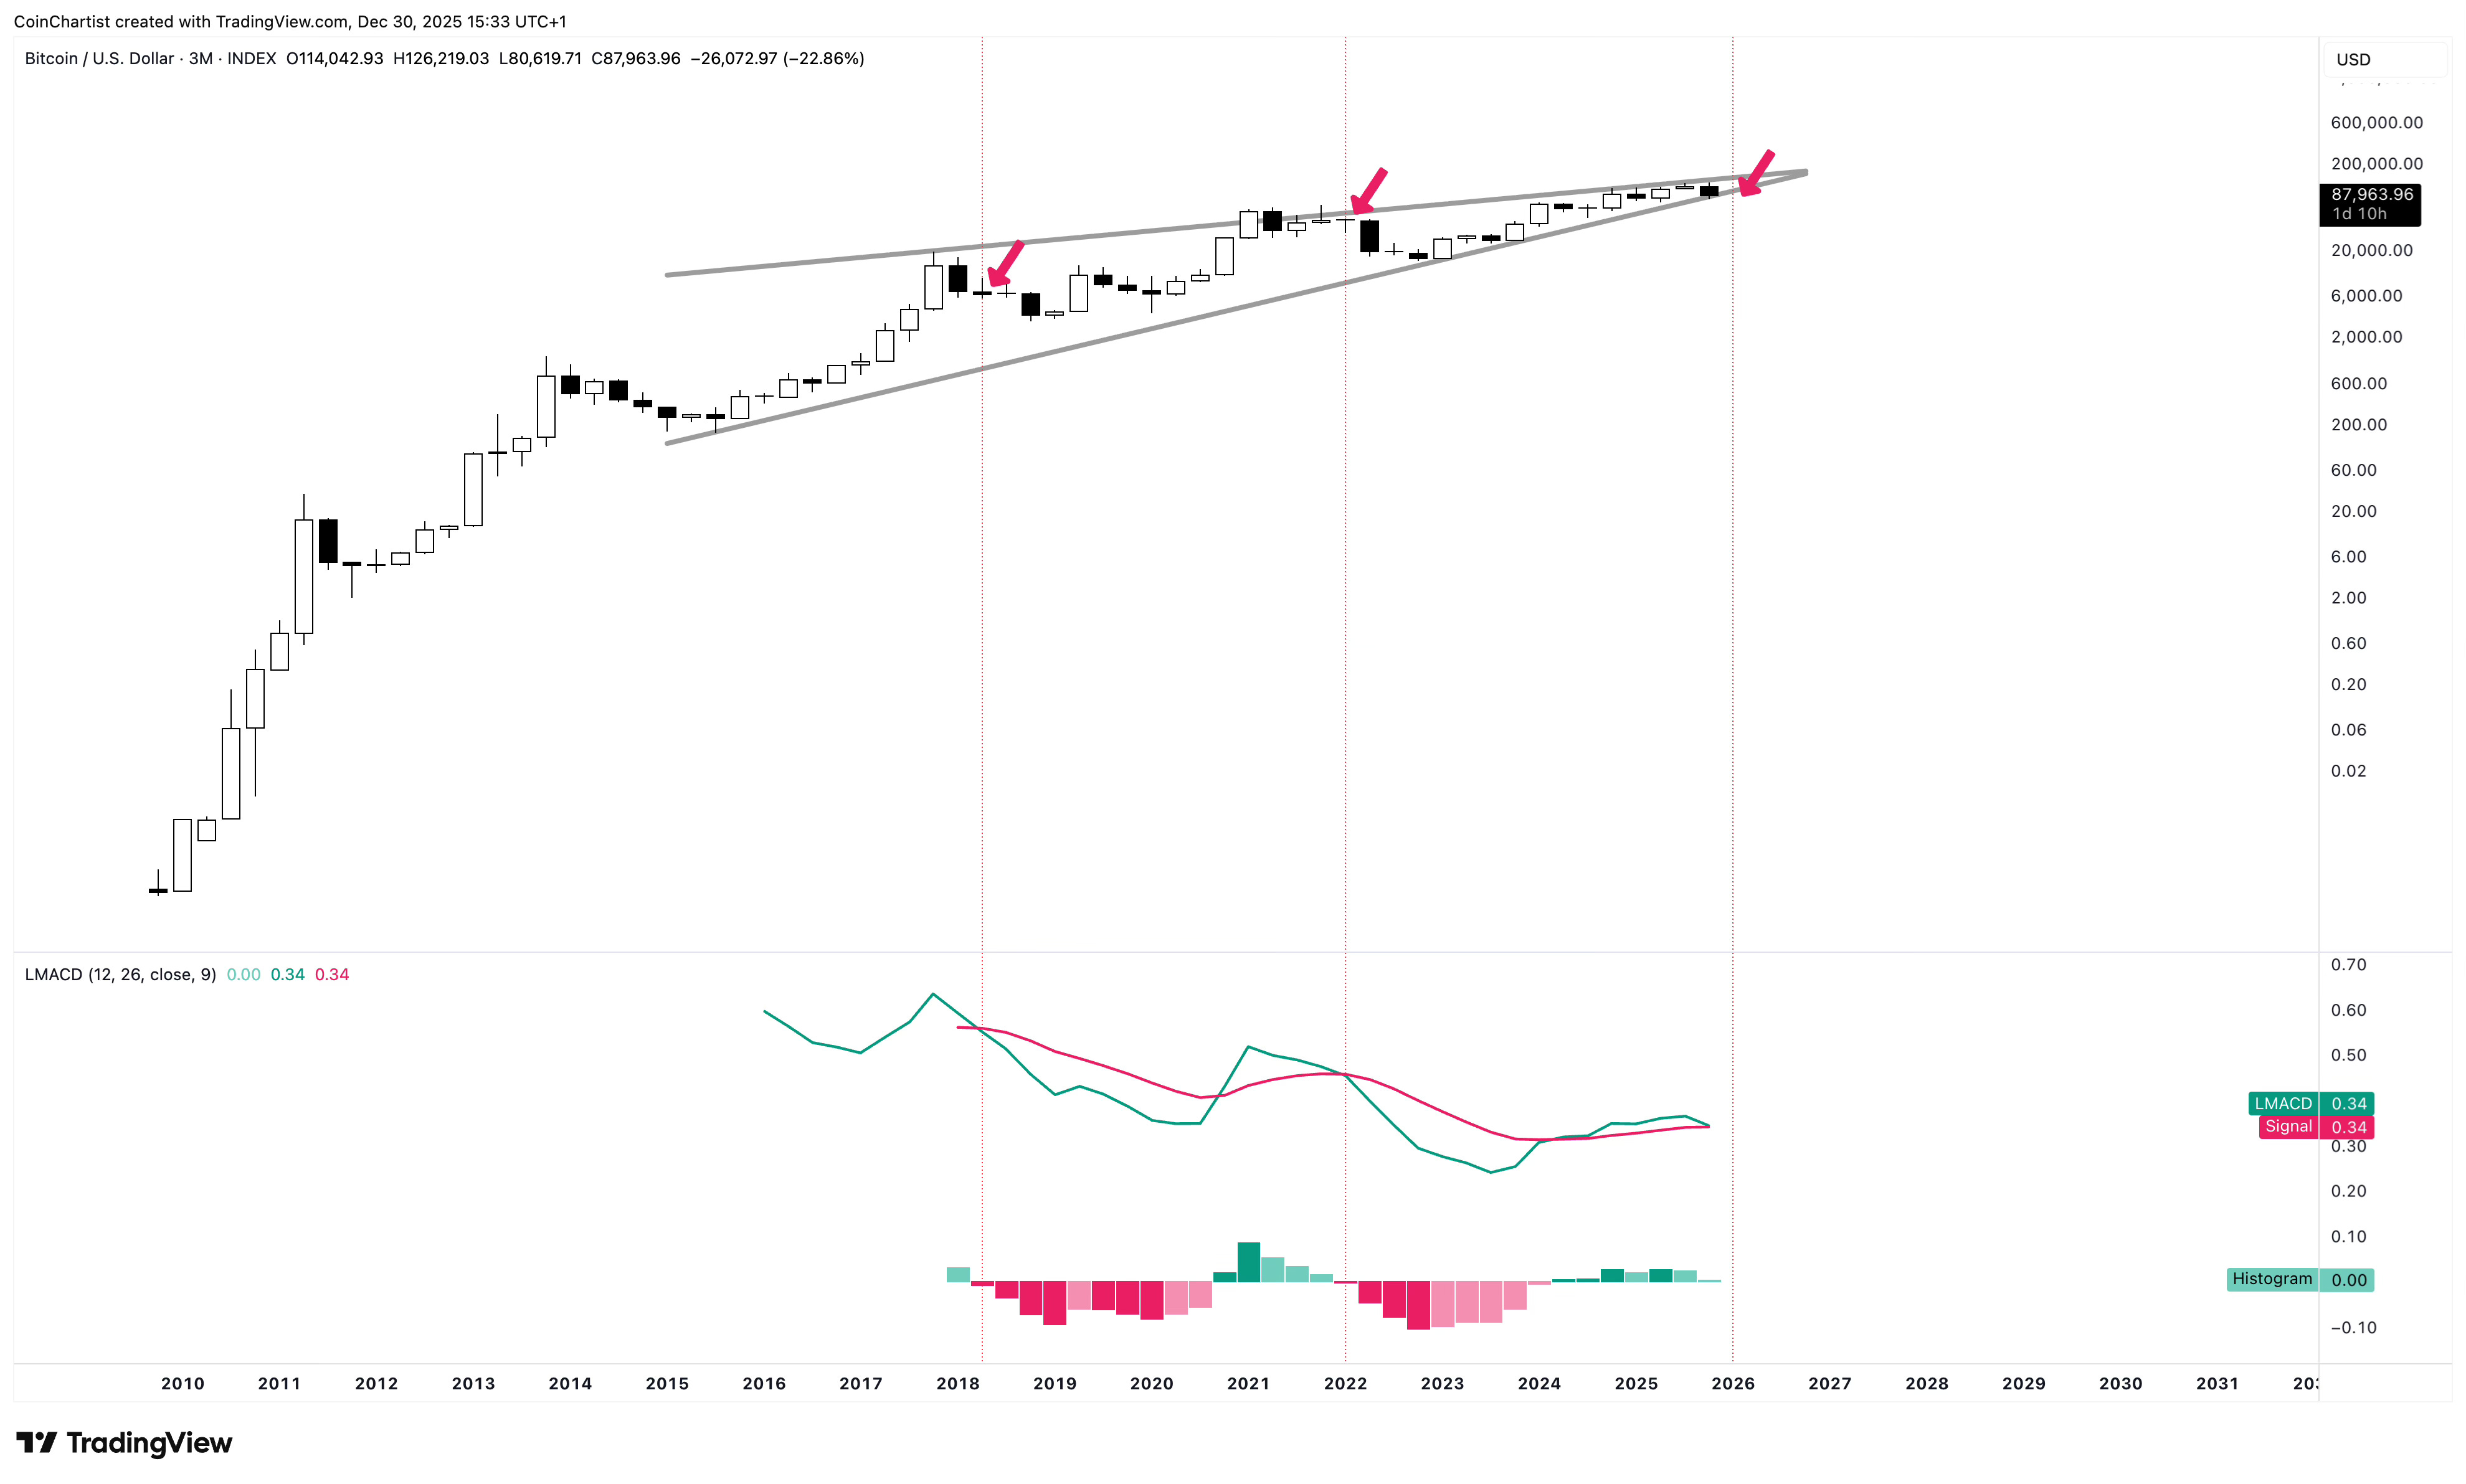
The quarterly LMACD shows momentum diverging downward as price has moved up over the years. The LMACD and signal line are about to cross bearish with the next quarterly open.
Evening Star Suggests it is Lights Out for Bull Trend
Bearish technicals could be confirmation for the bearish Japanese candlestick reversal pattern known as the Evening Star.
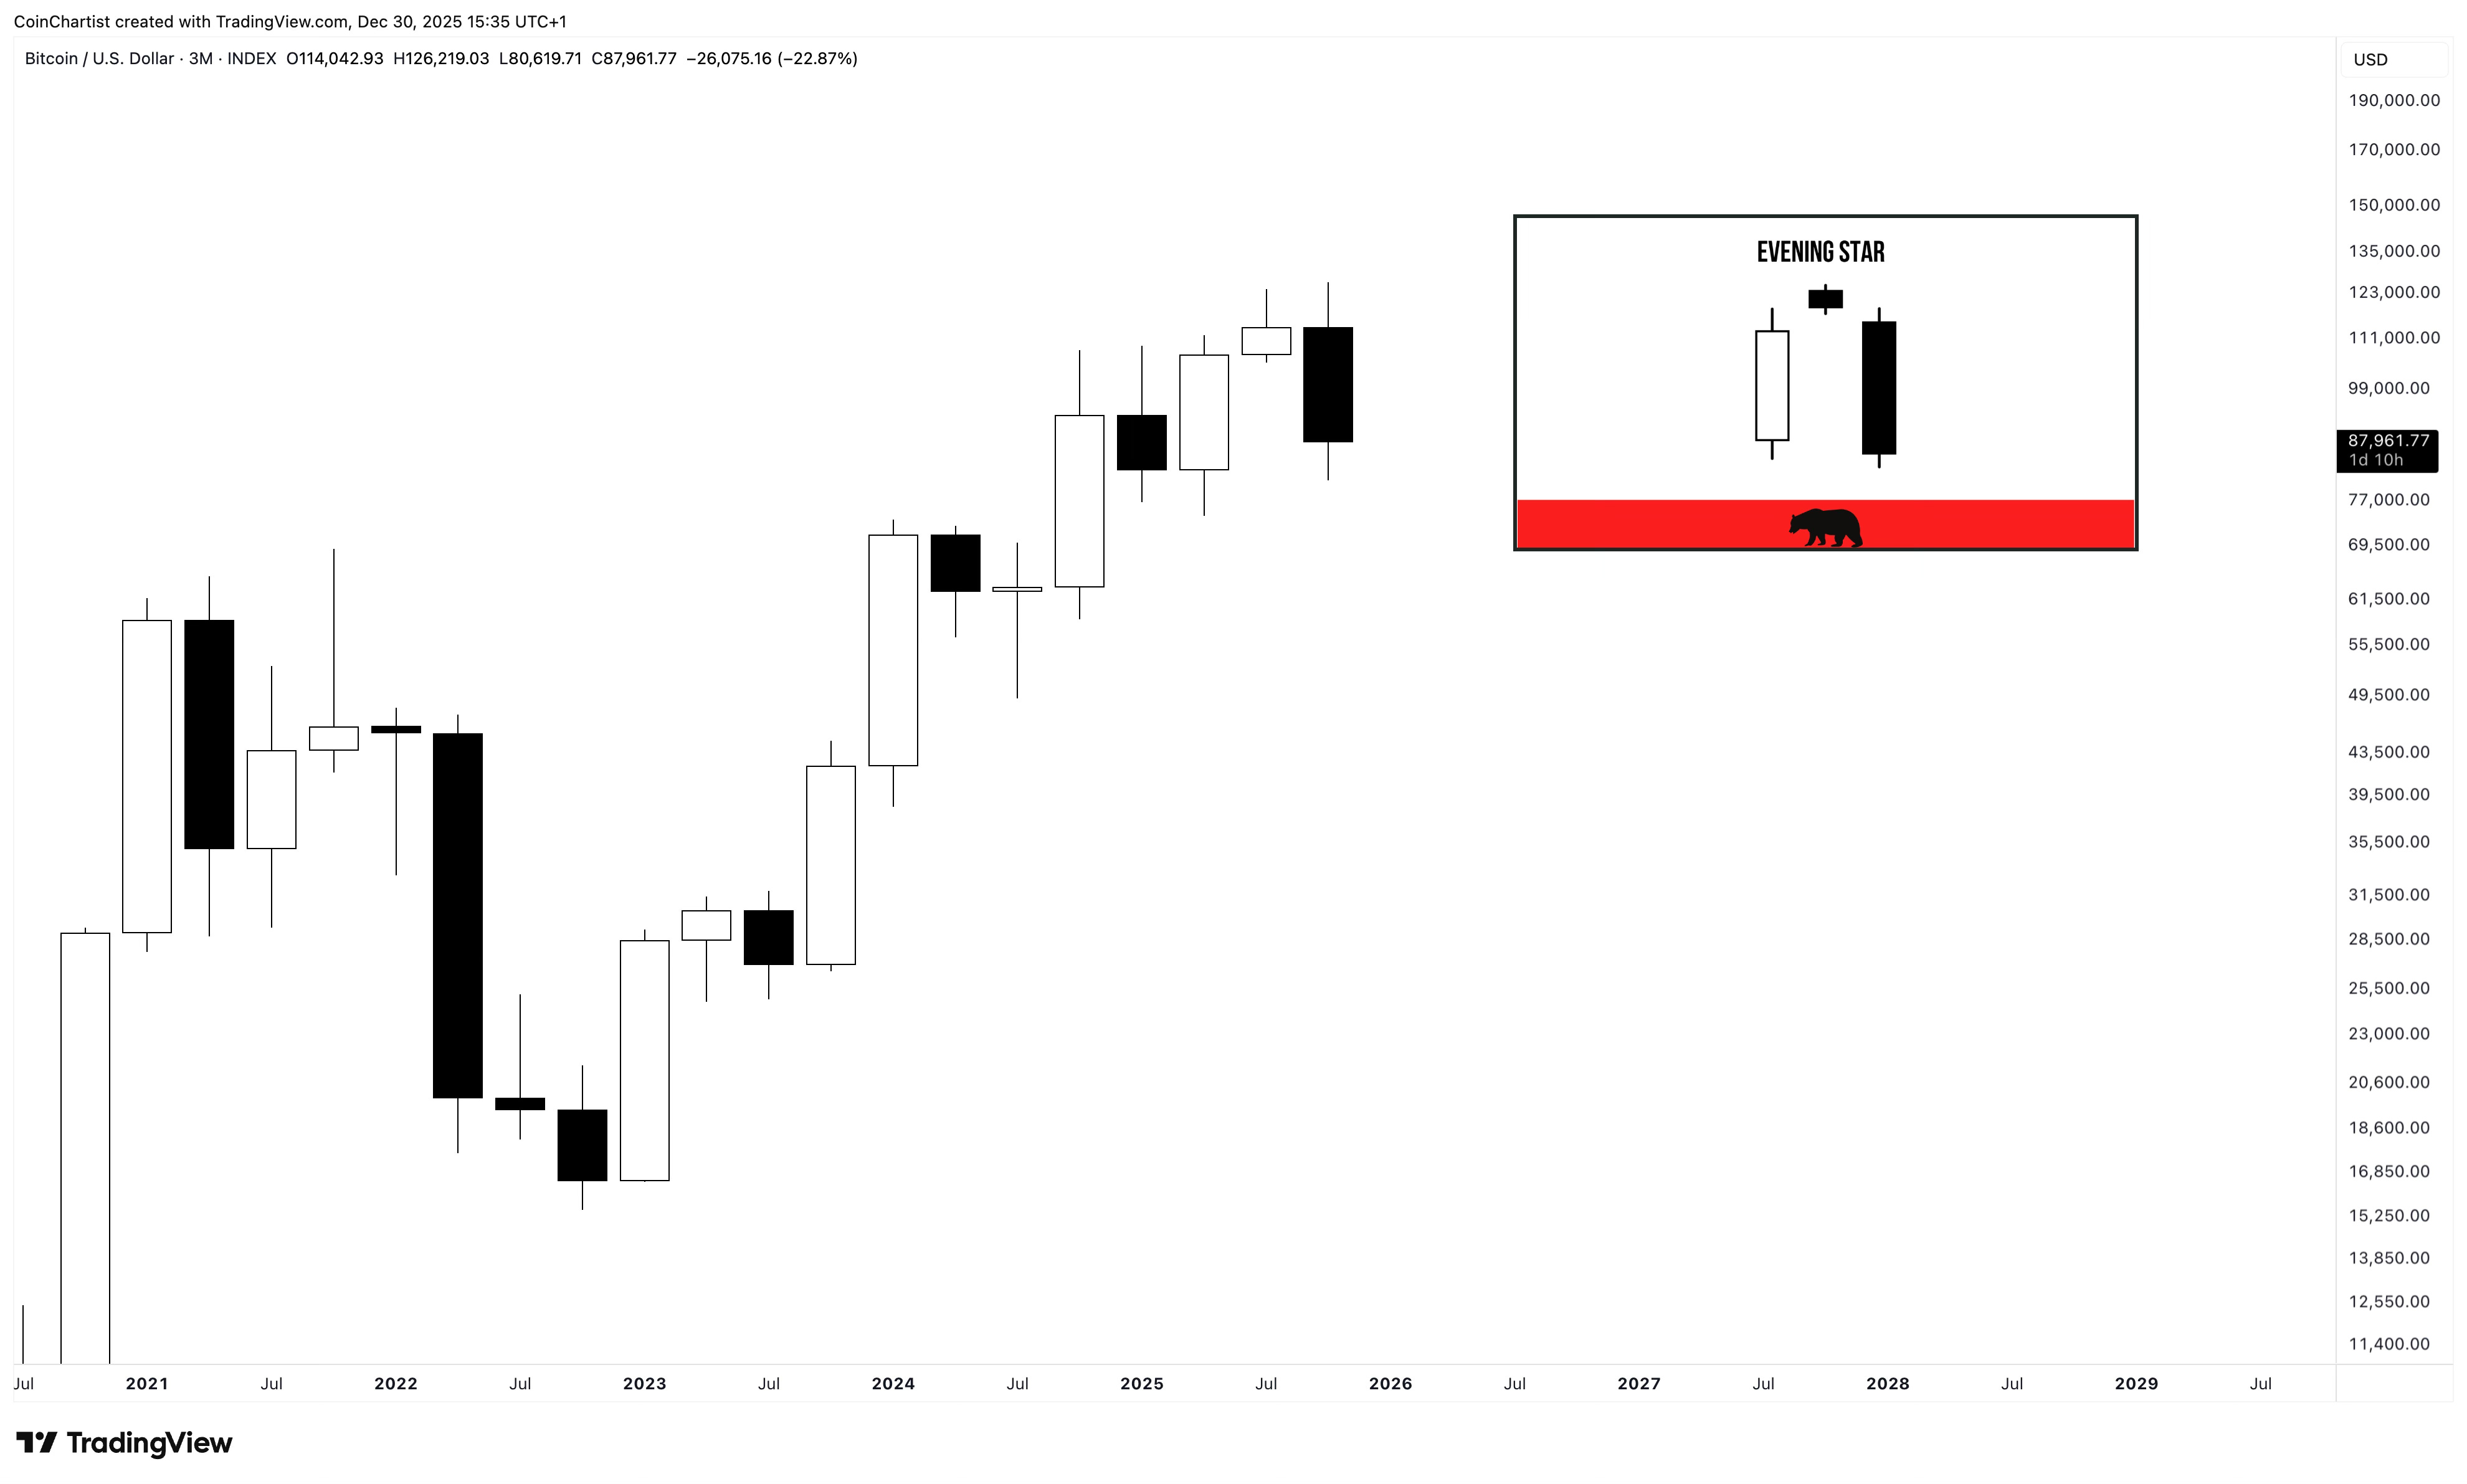
The Evening Star has appeared at what might be the top of the recent bullish trend. It’s a potential reversal pattern than leads to a reversal 72% of the time. Even worse, the downtrend it produces typically ends 6 to 10 candles after the pattern. Because these are quarterly candlesticks, that could mean it takes between one and a half years to two and a half years to find the final bottom.
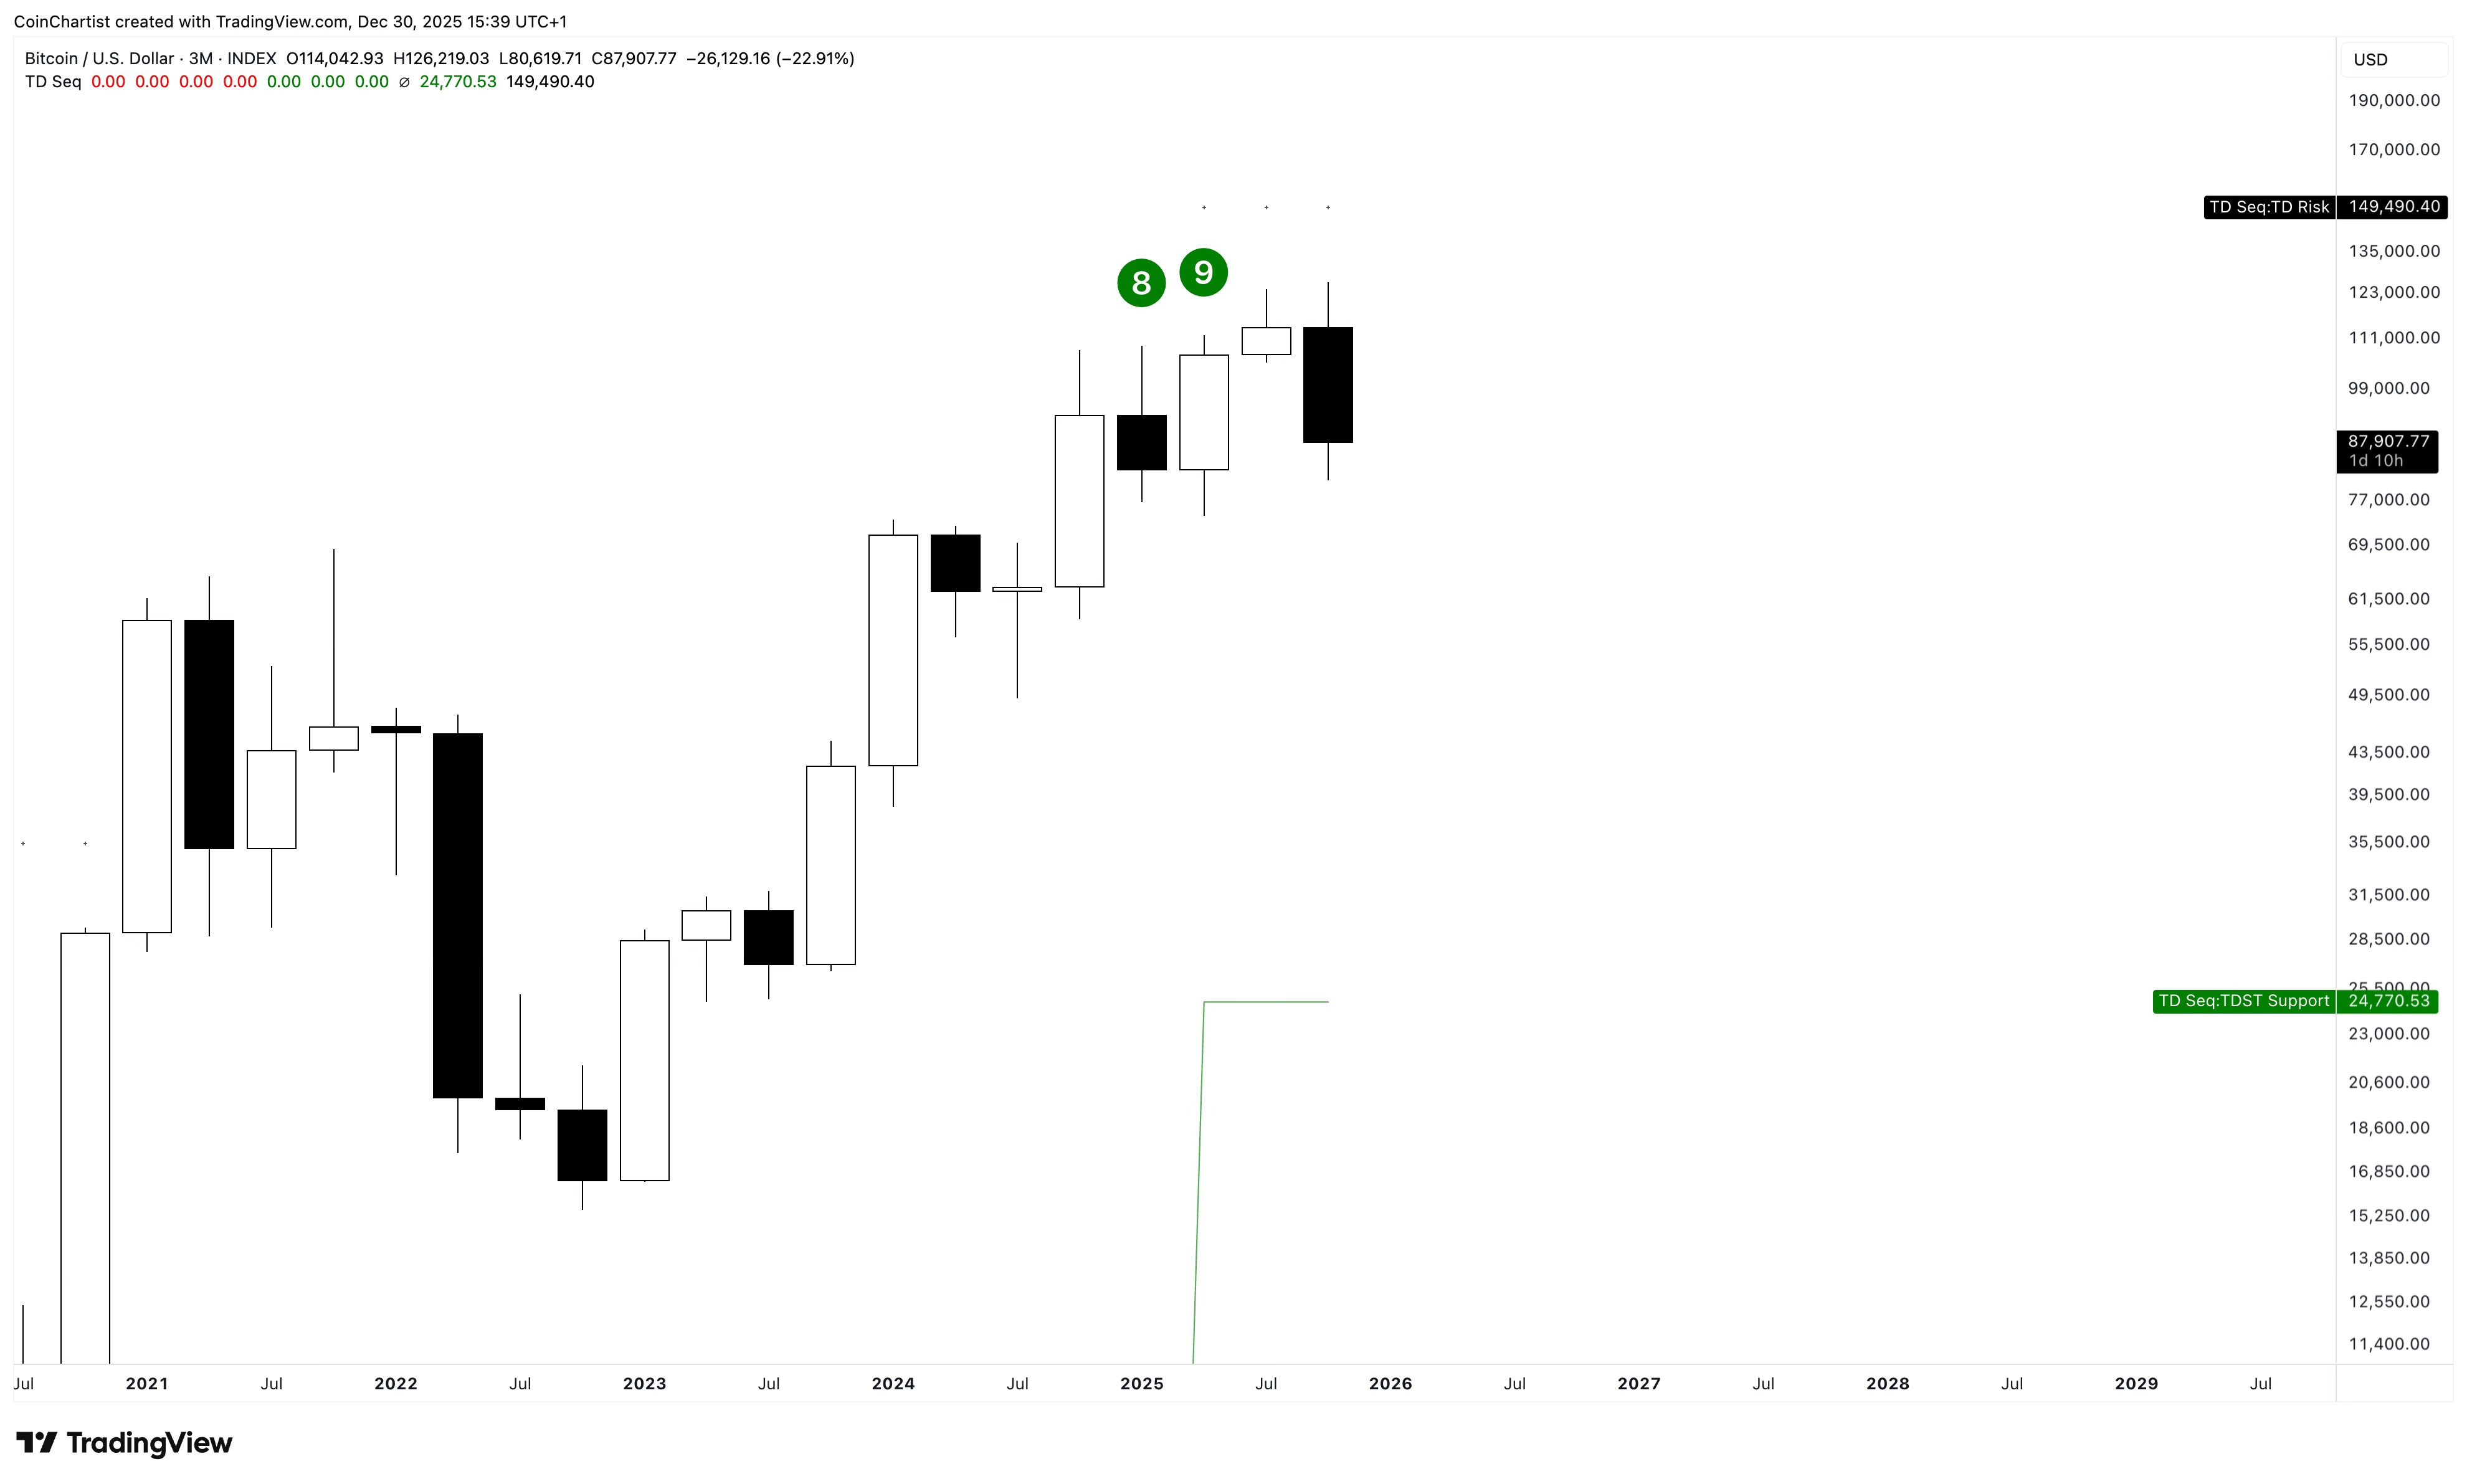
The pattern consists of a large white up candle, a pause forming a Doji, and then a large black candle erasing the prior up candle. This is also why the Doji on the yearly is potentially dangerous. The large white up candle triggered a perfected TD9 sell set setup — a market timing signal that often nails tops and bottoms accurately. TDST support is at $24,000.
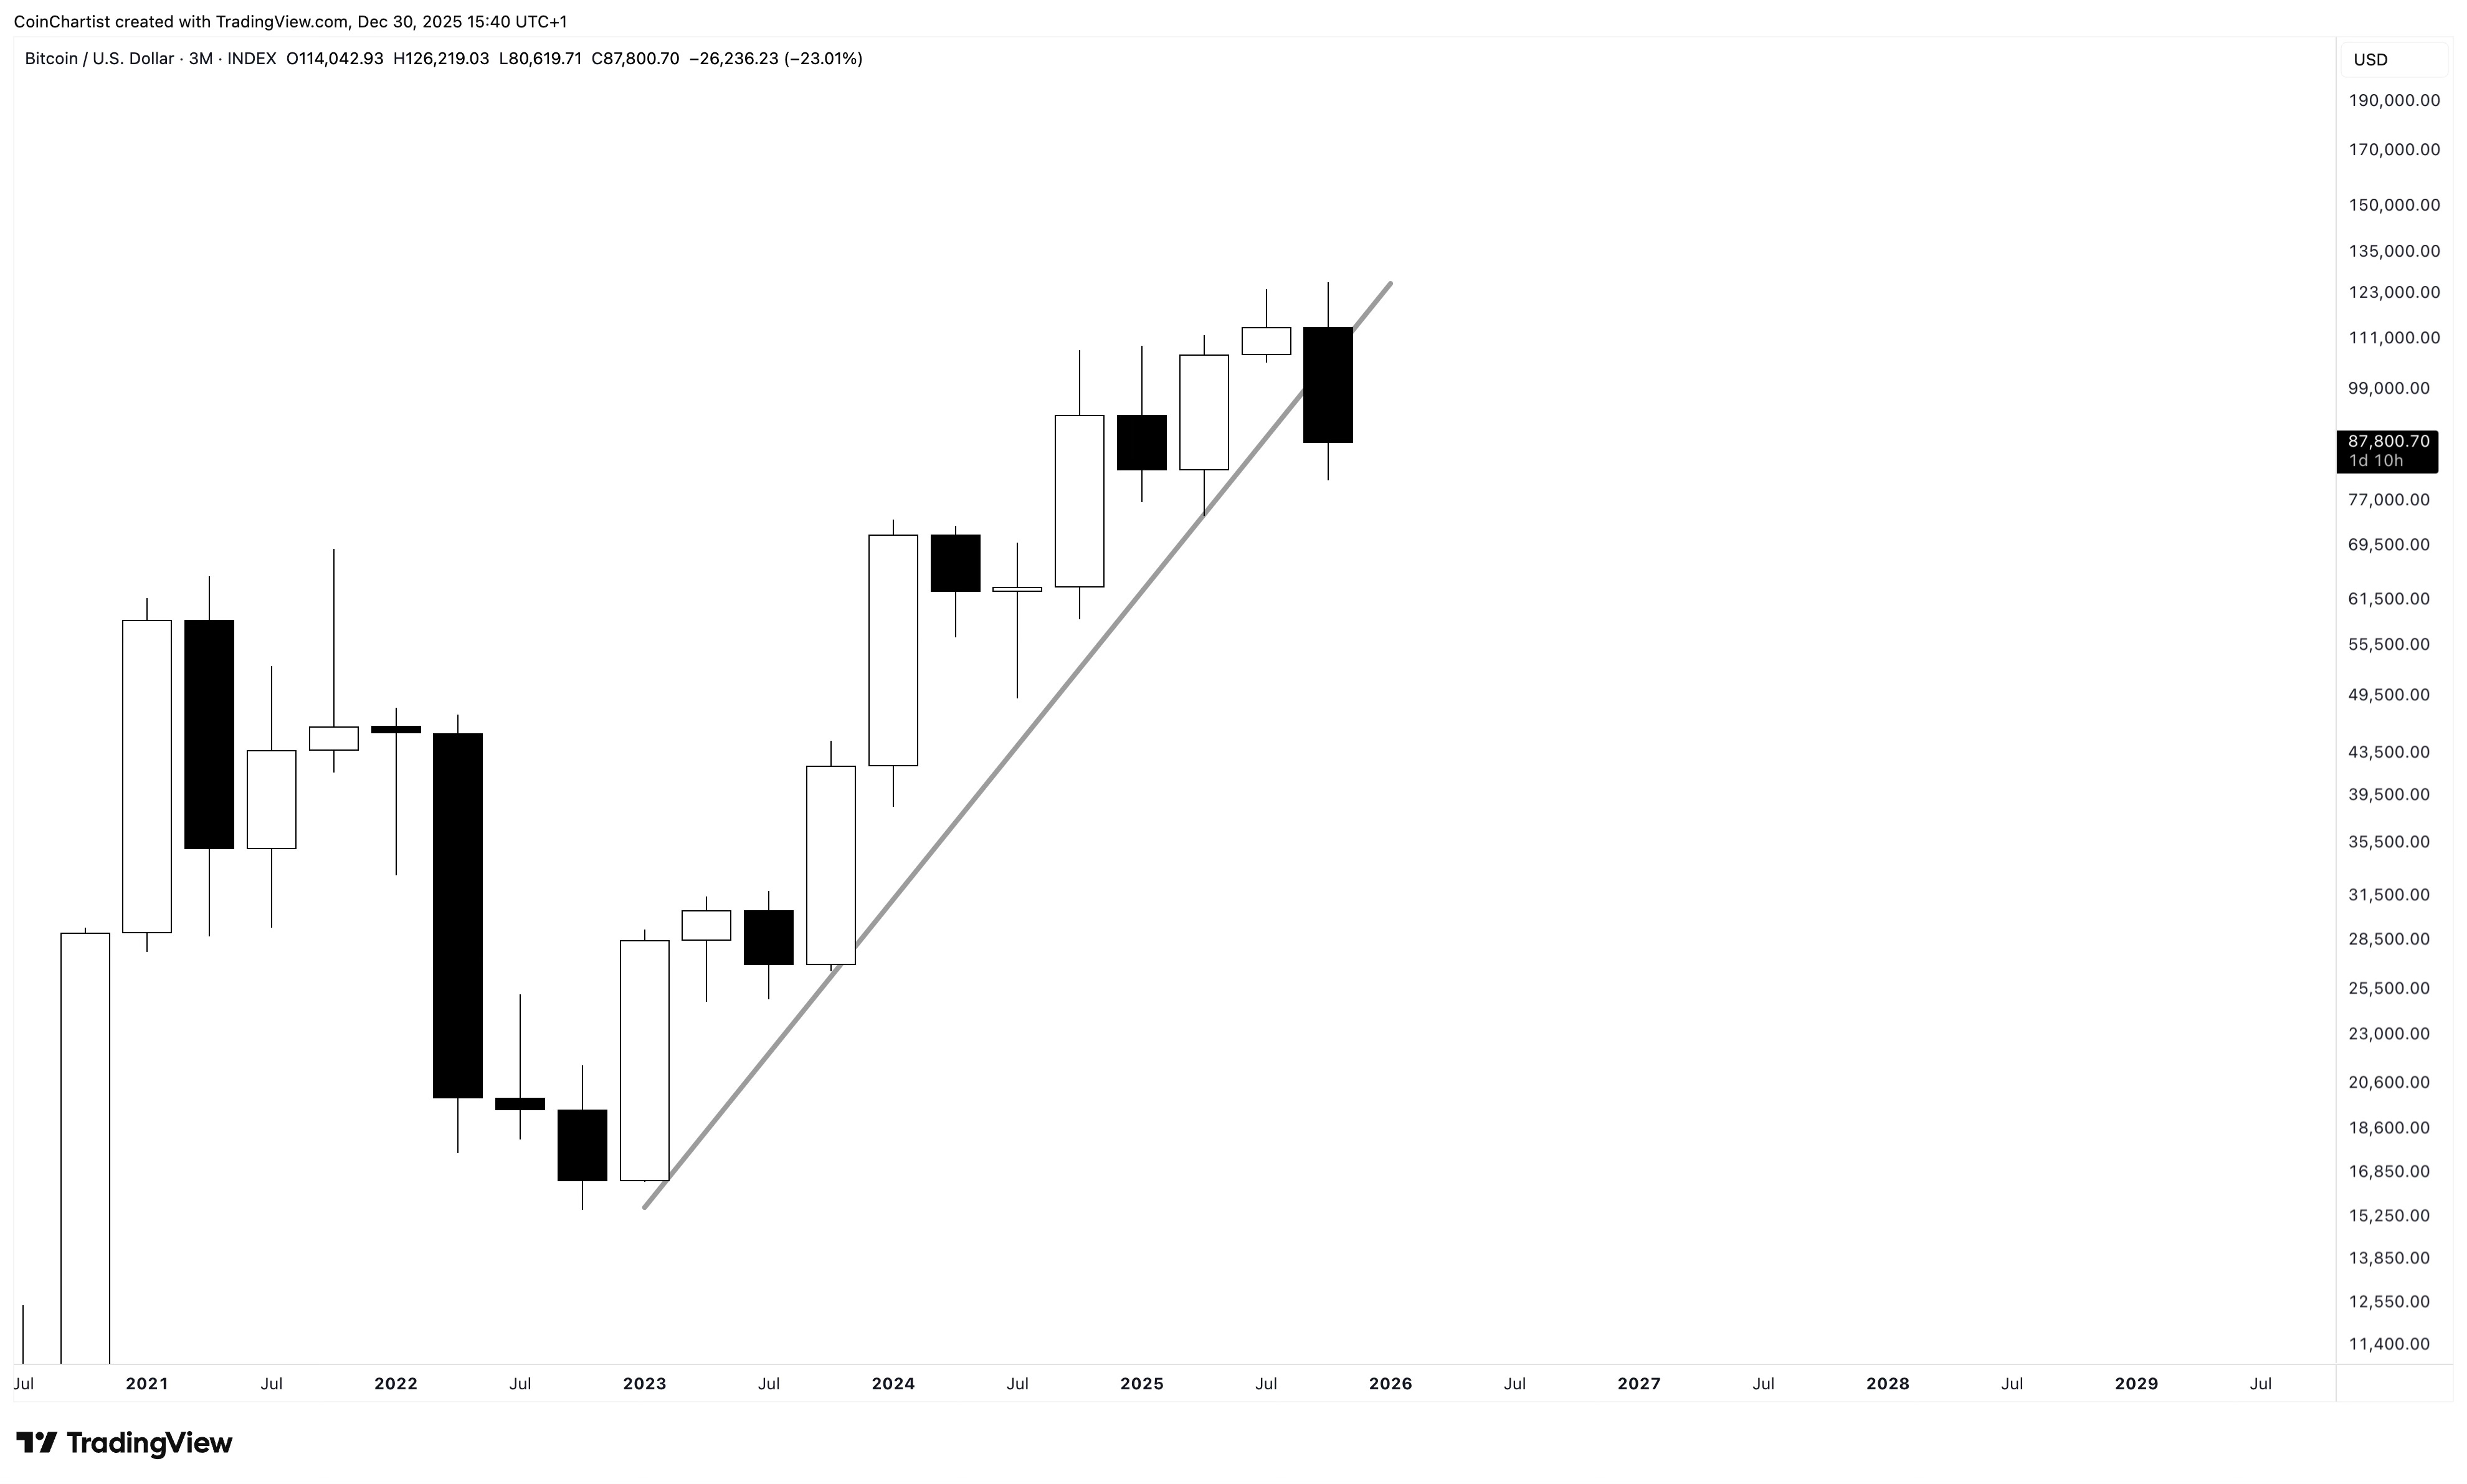
An Evening Star pattern is even more potent when a trend line breaks down. Losing the trend line adds confirmation that a trend change could occur.
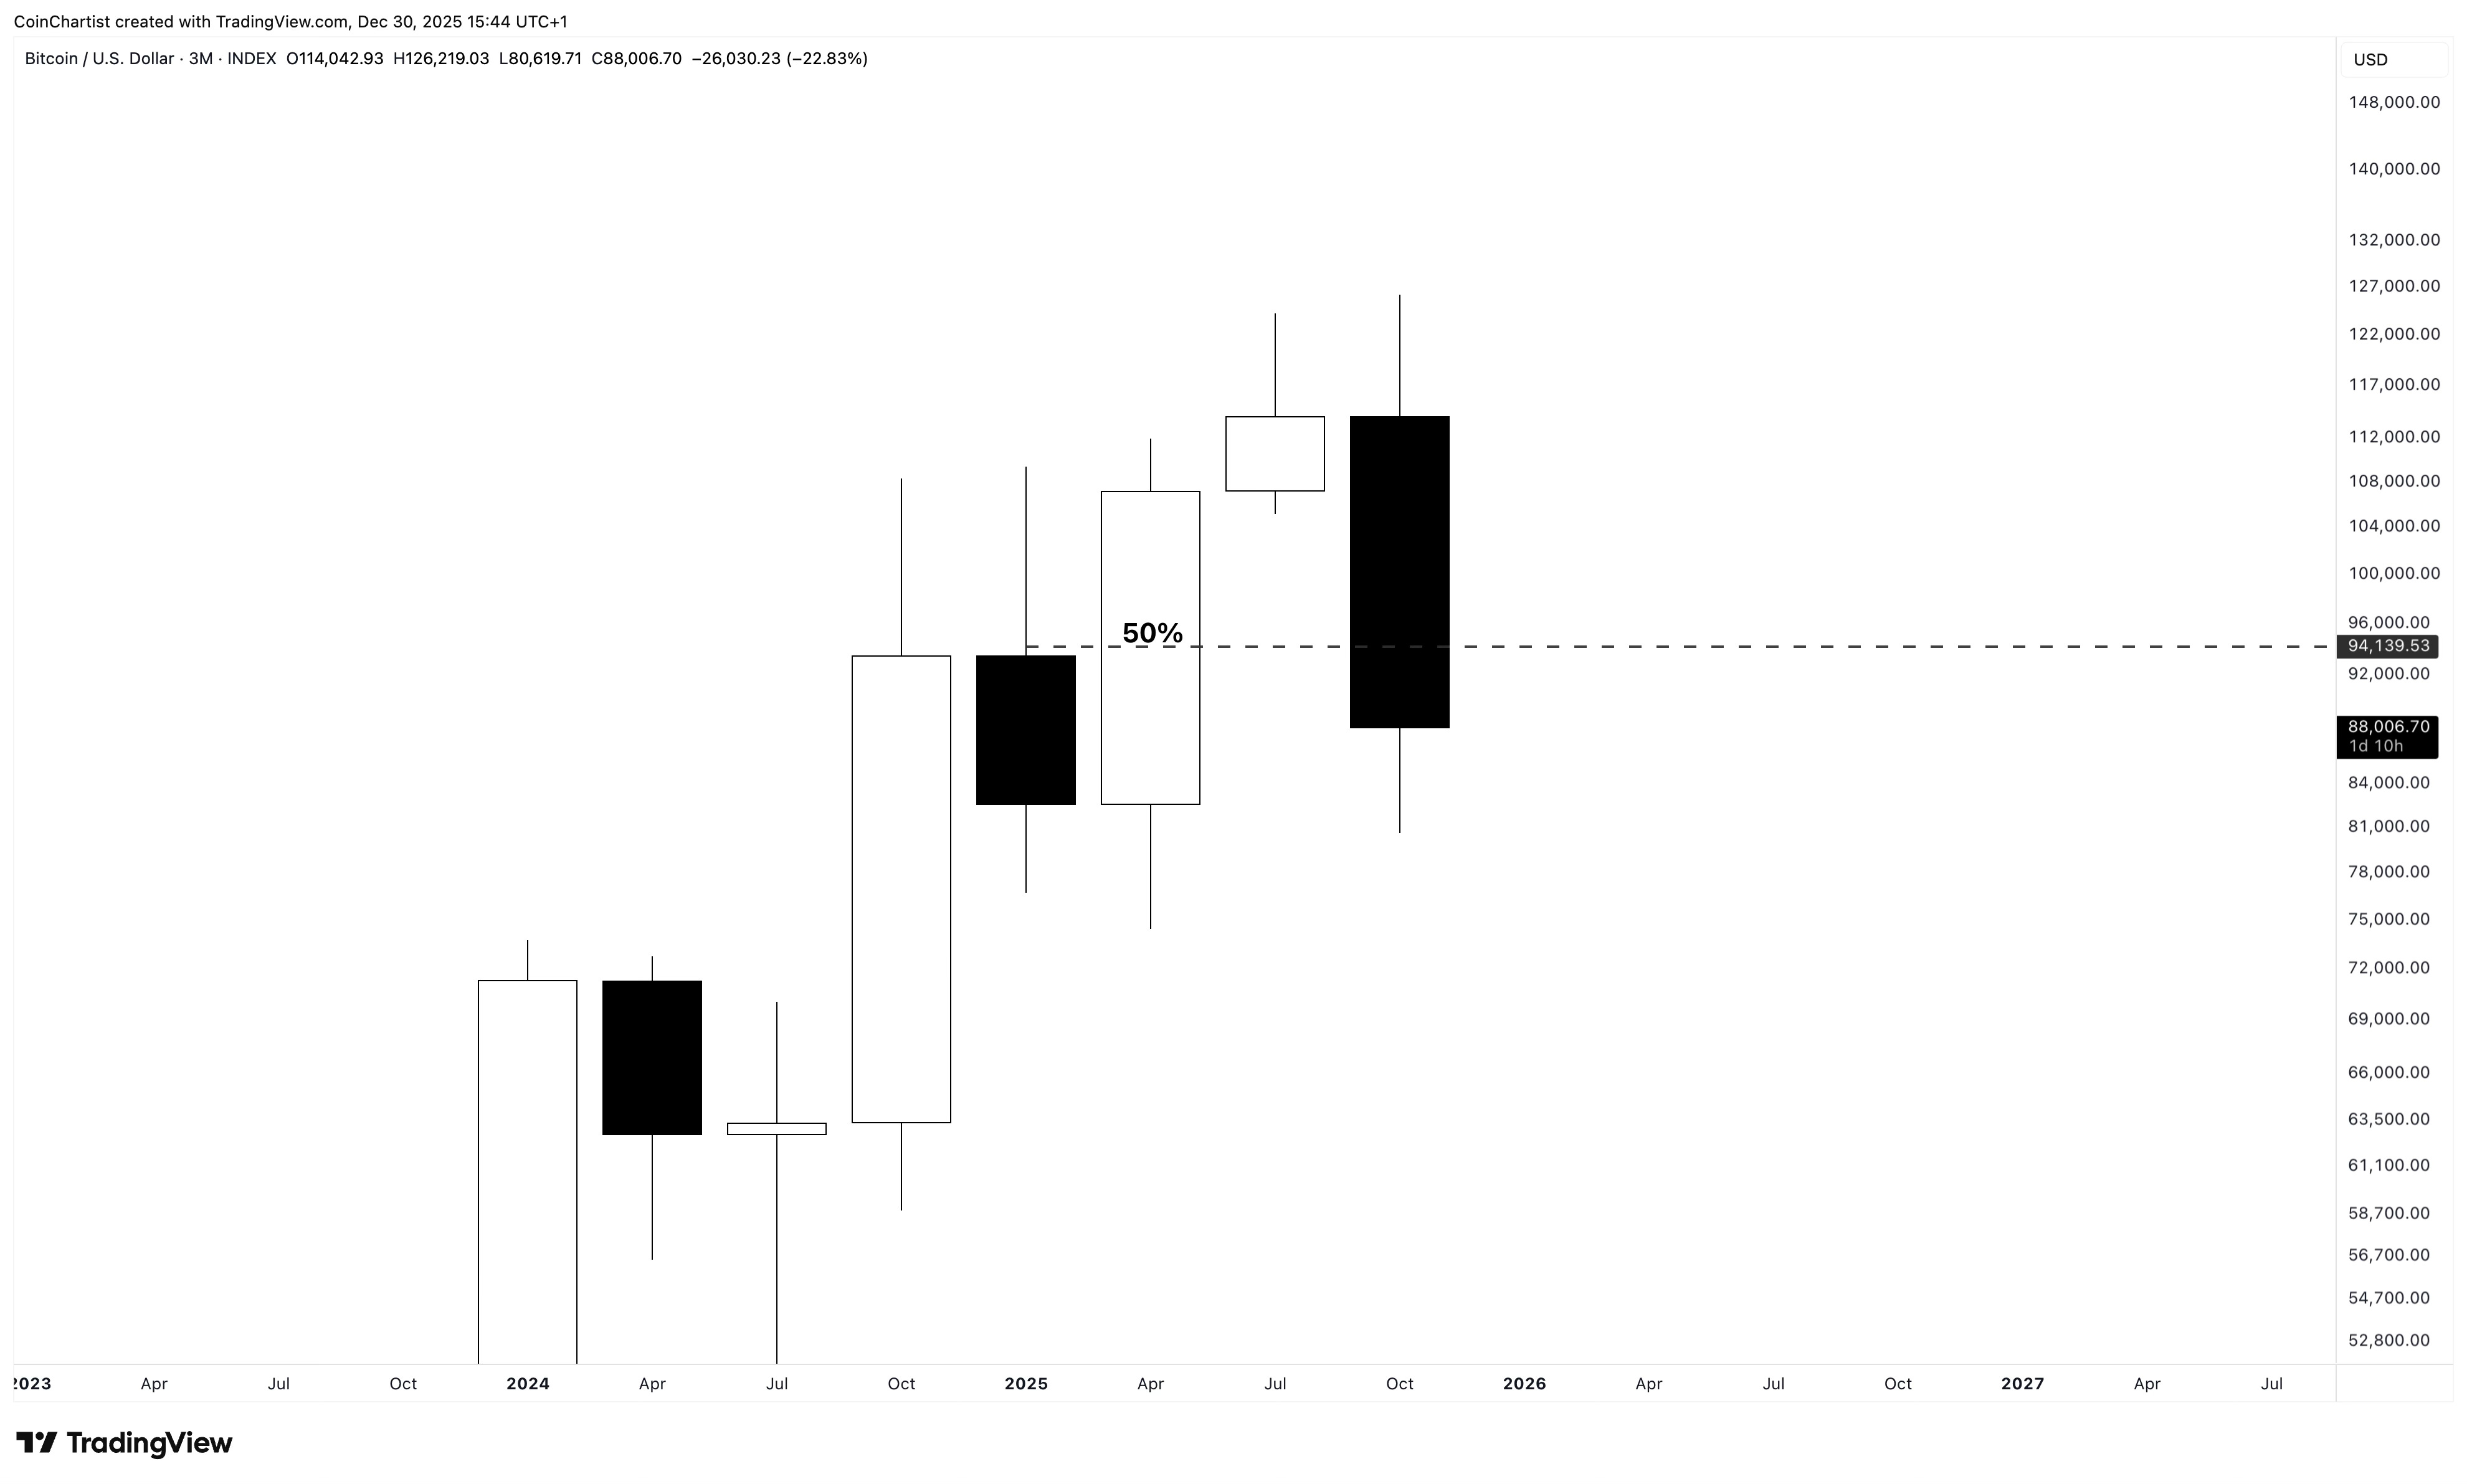
A quarterly close tomorrow night below $94,000 would close the black candle below the 50% sell trigger. This isn’t quite “confirmation” but just a trigger to take action. Confirmation comes during the next 3 to 5 candlesticks. At some point in 2026 a lower timeframe lower low would act as the confirmation needed on the quarterly.
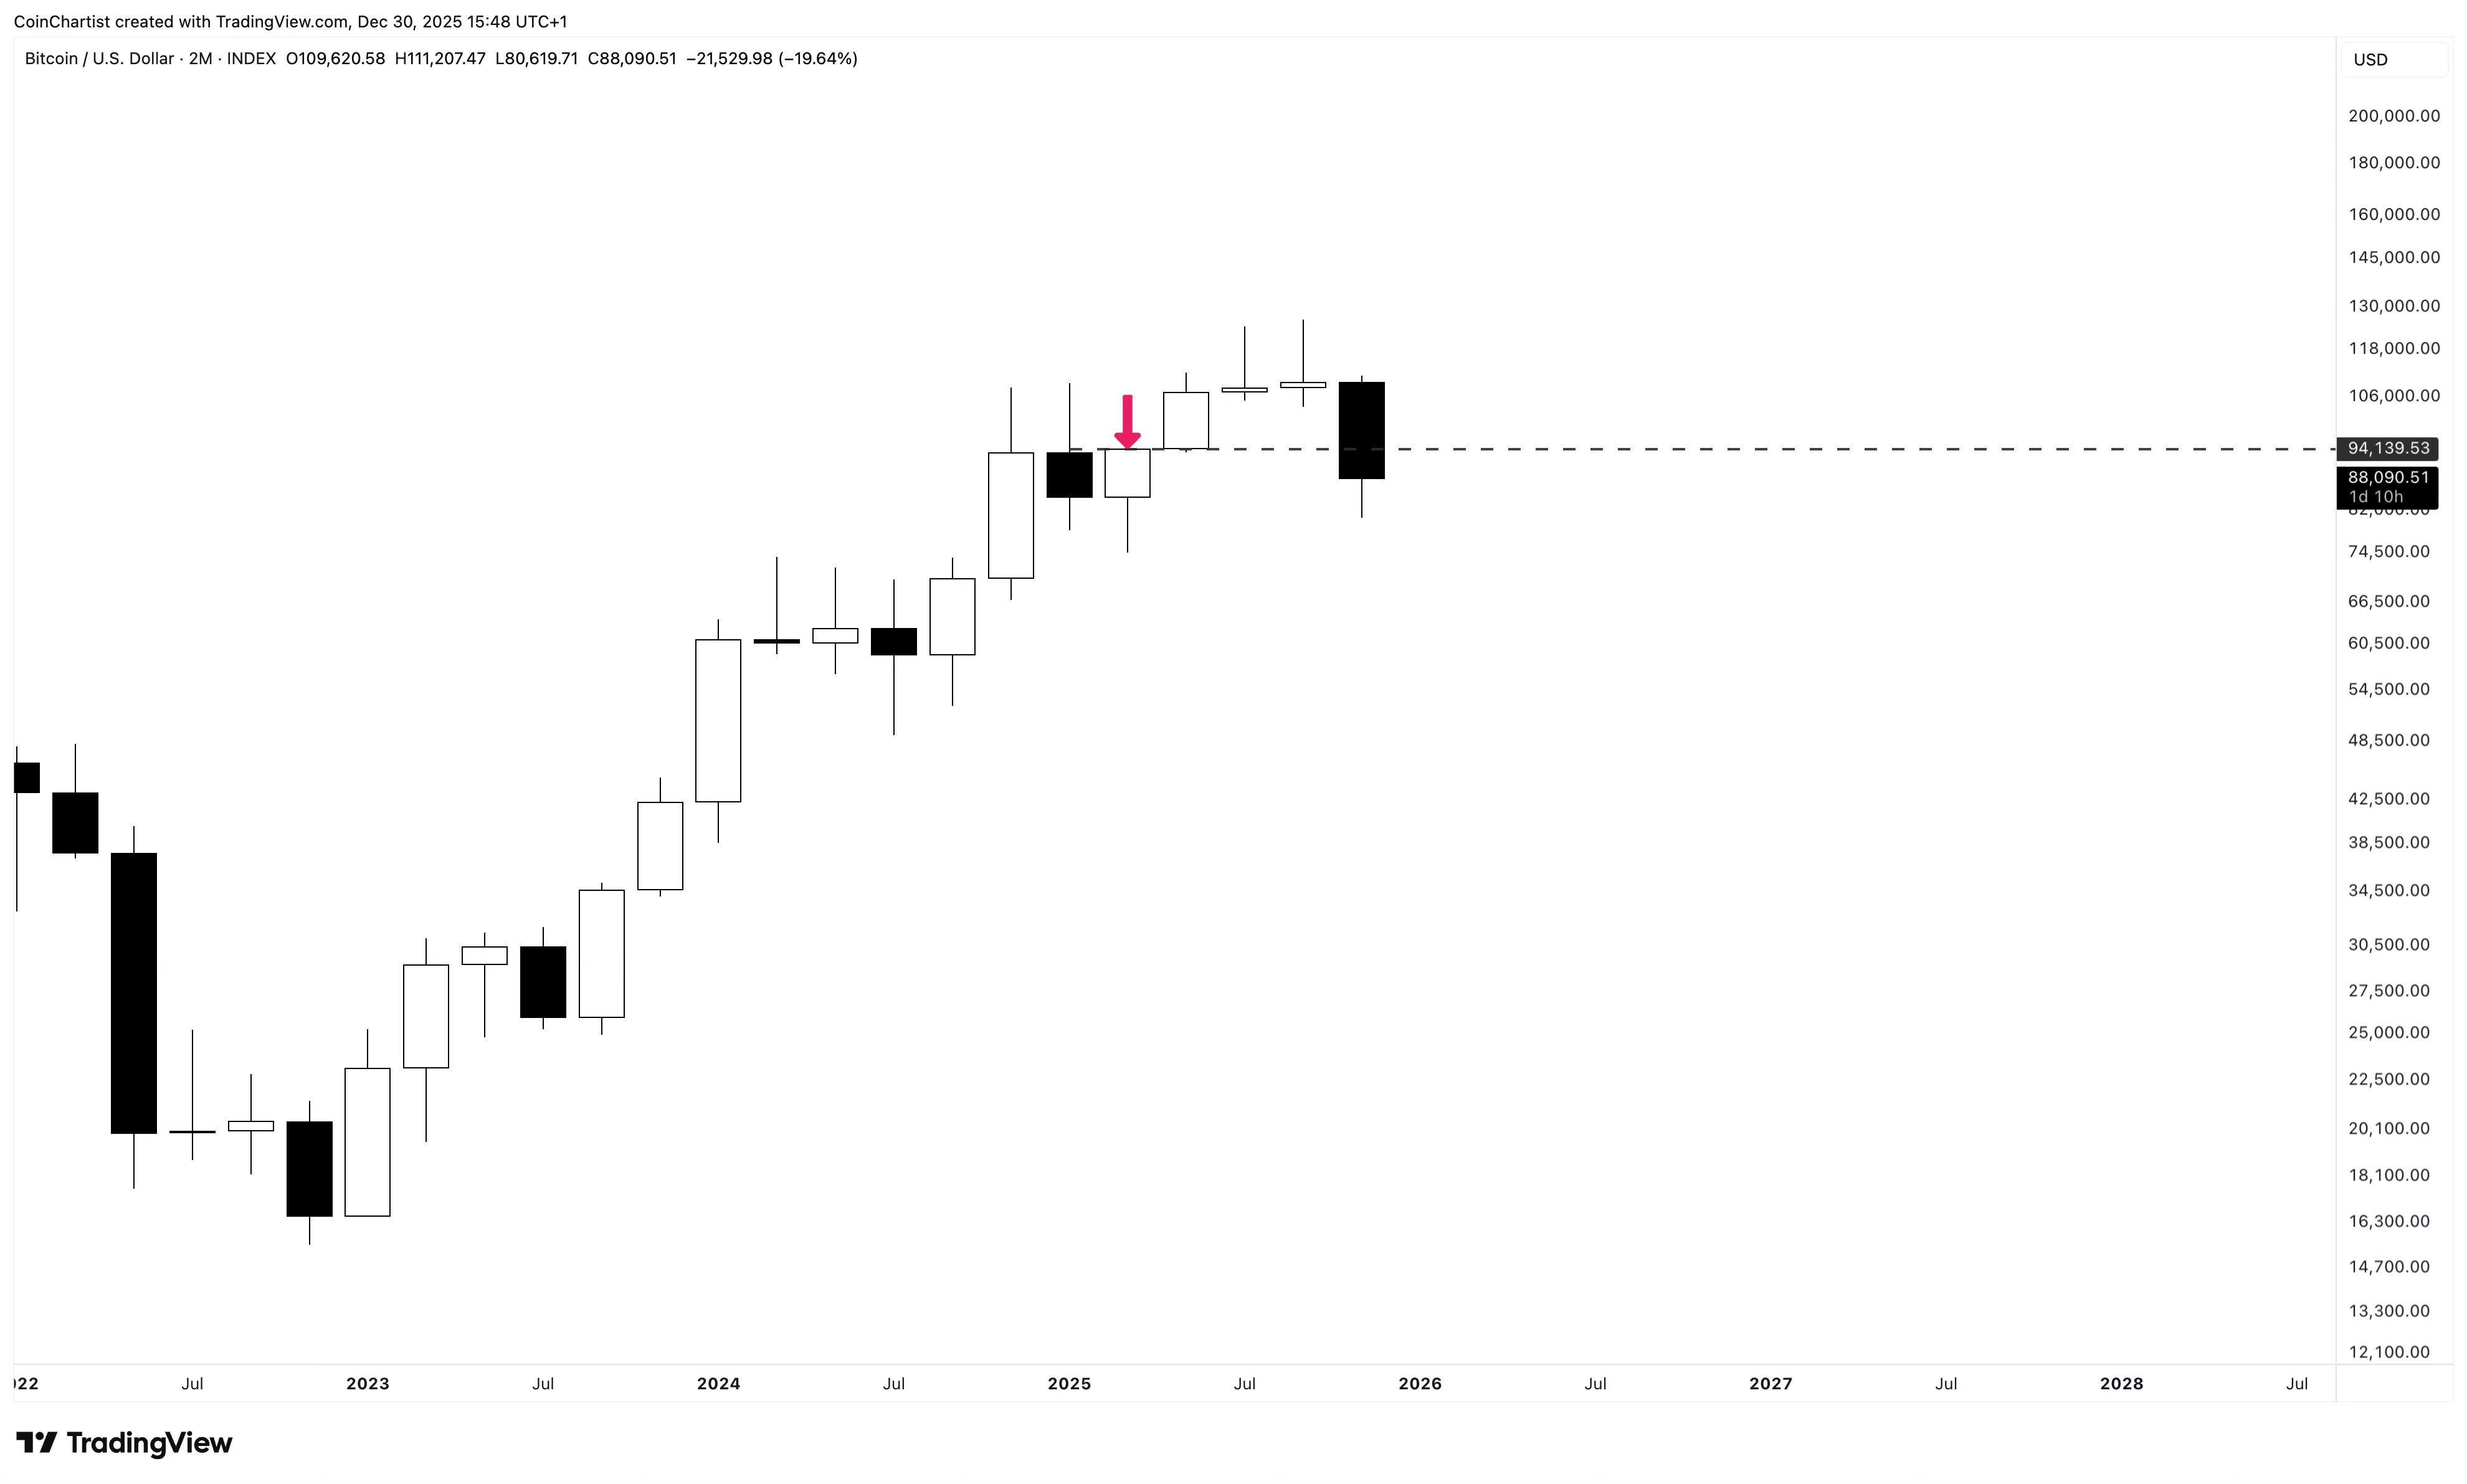
Moving down a timeframe we can see how the 2M interacts with the same price level.
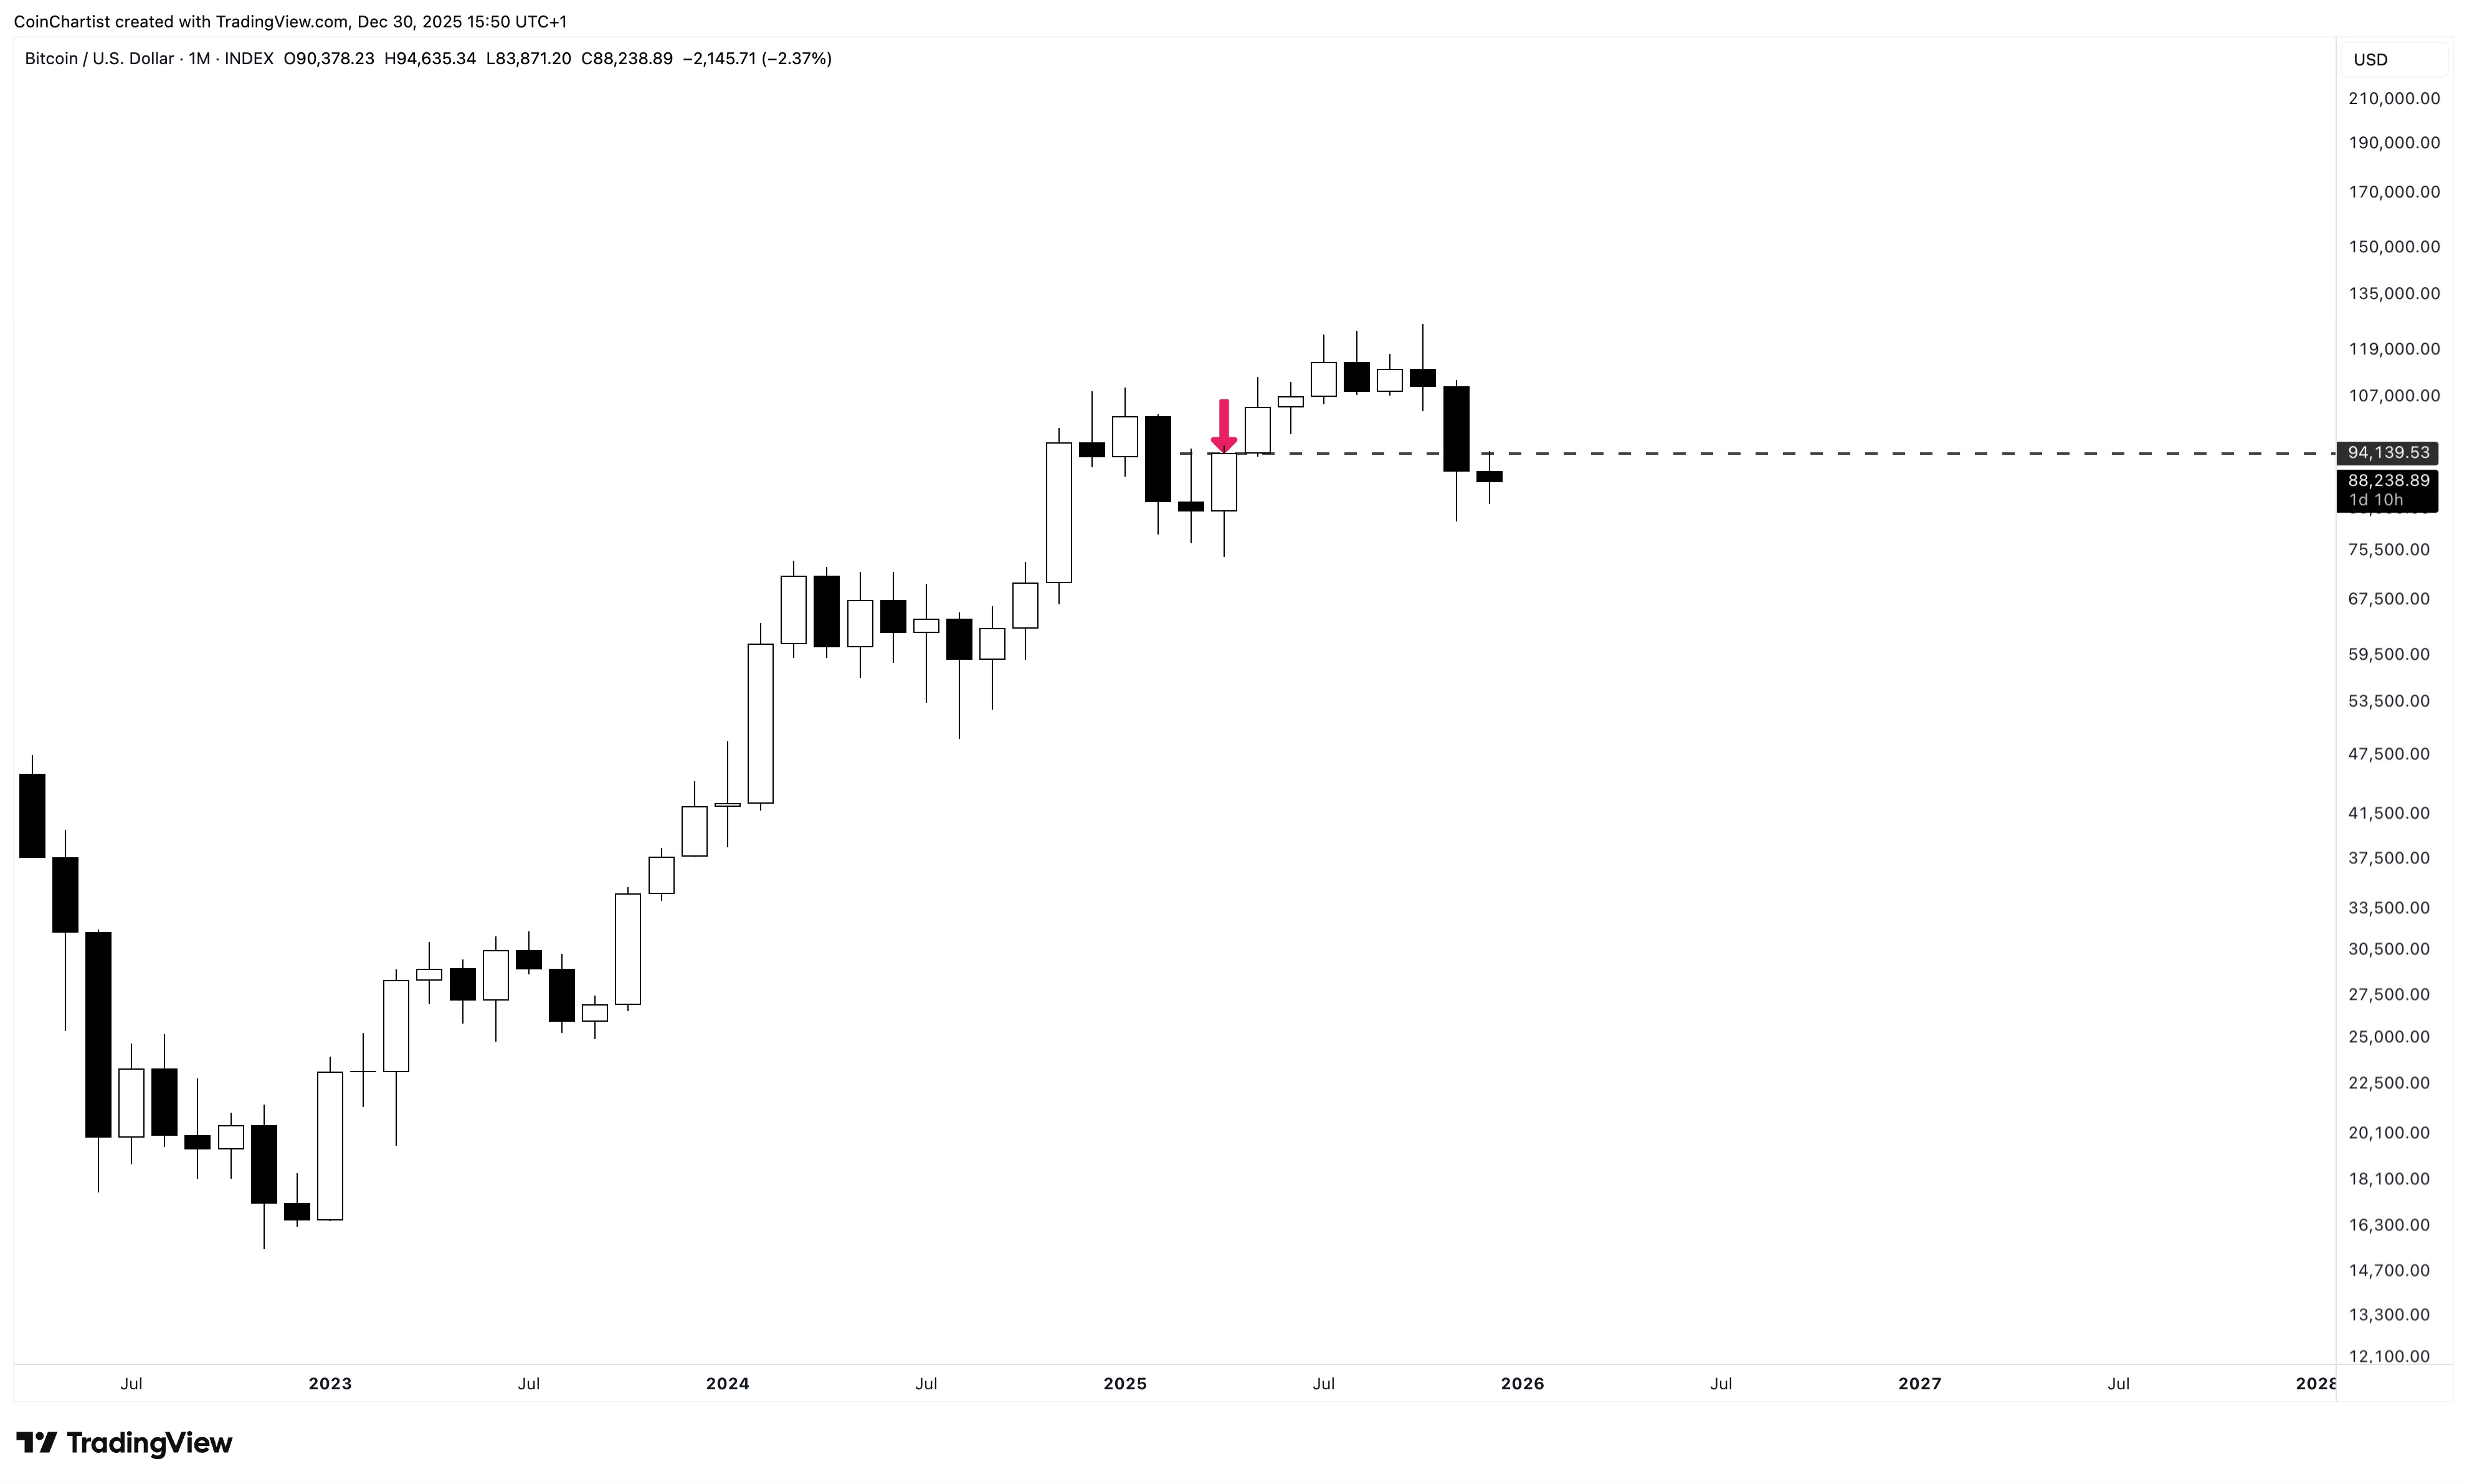
As we move lower, we can see the 50% trigger is also the high of the April monthly candle body. The current December monthly is also Doji, showing indecision. This sets up a bull trap in January, but a possibly negative end to Q1 2026.
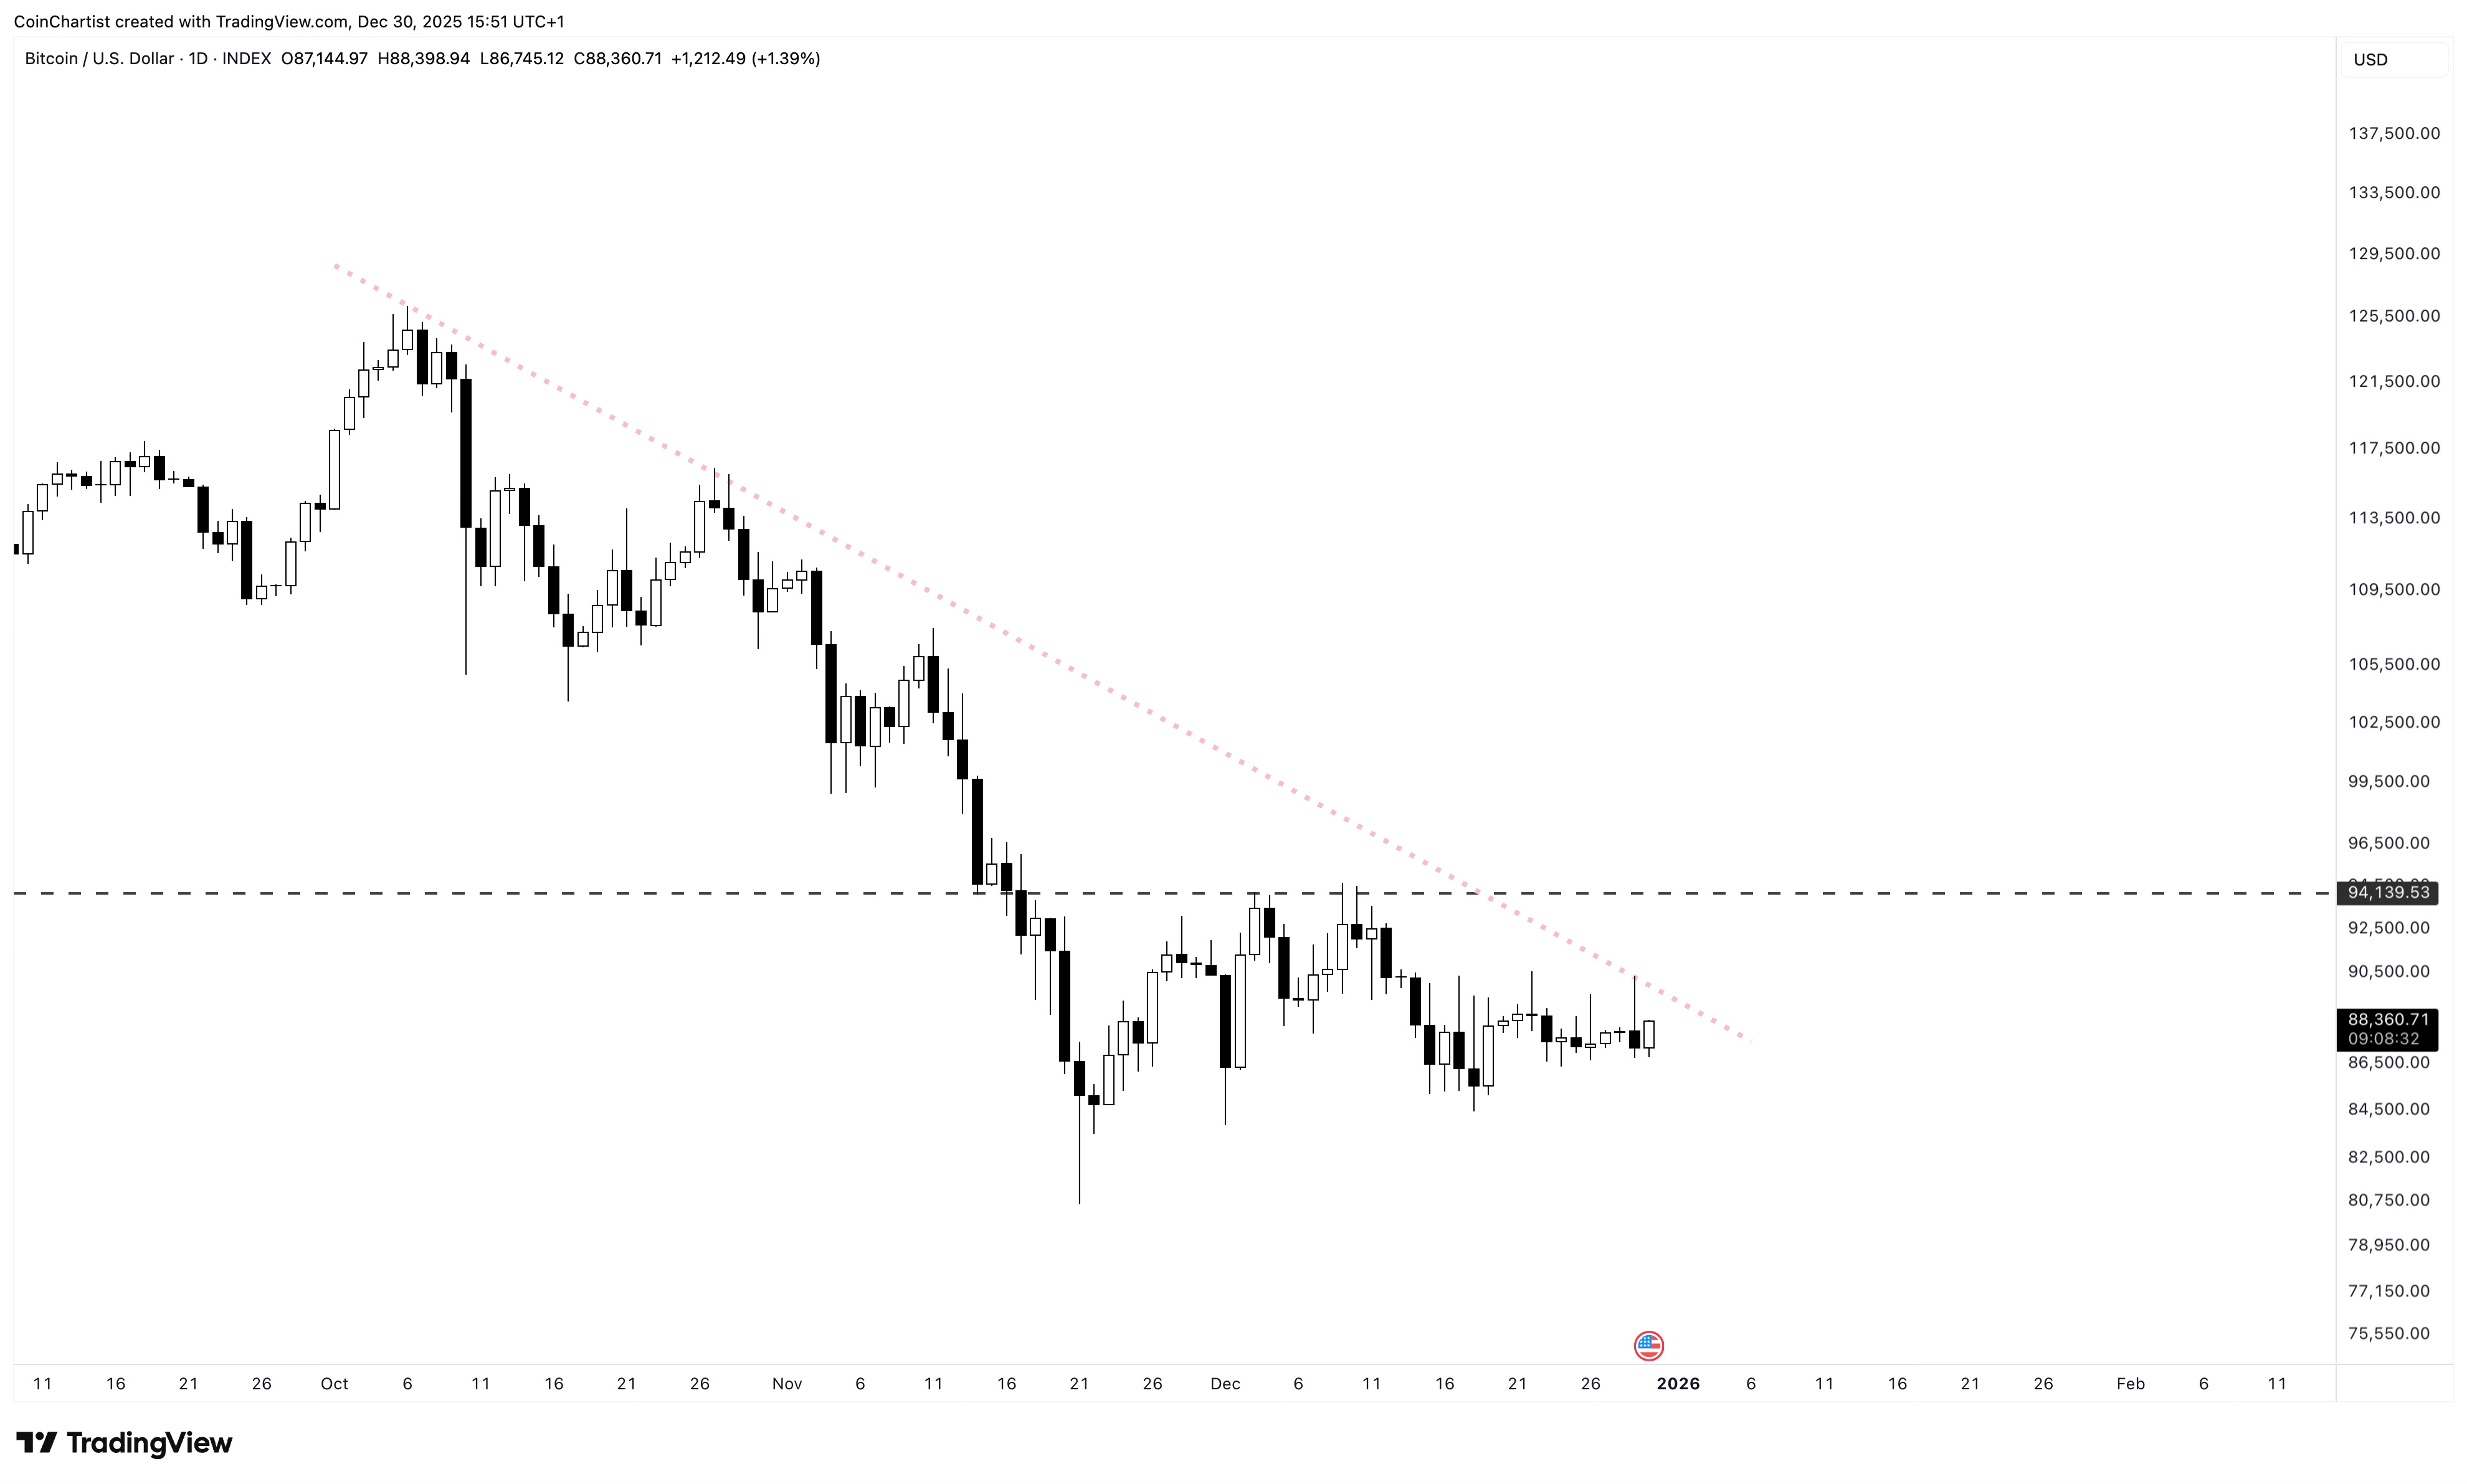
For now, the daily is trying to break out of a local downtrend and make a run for the 50% trigger, marked as a dashed horizontal line on the chart. Unless the breakout happens within the next 24 hours, it should be part of the January bull trap instead.
Making Sense of Macro: Gold, Silver, S&P 500, Business Cycles
The most frustrating part of crypto right now is the abundance of analysts suggesting the business cycle is about to turn up. What about the current state of the economy and market suggests there is confidence of growth ahead? Layoffs, Gold and Silver rising, global leverage unwinding, etc. don’t exactly point to businesses being ready to invest in an extended growth phase. Here’s the truth.
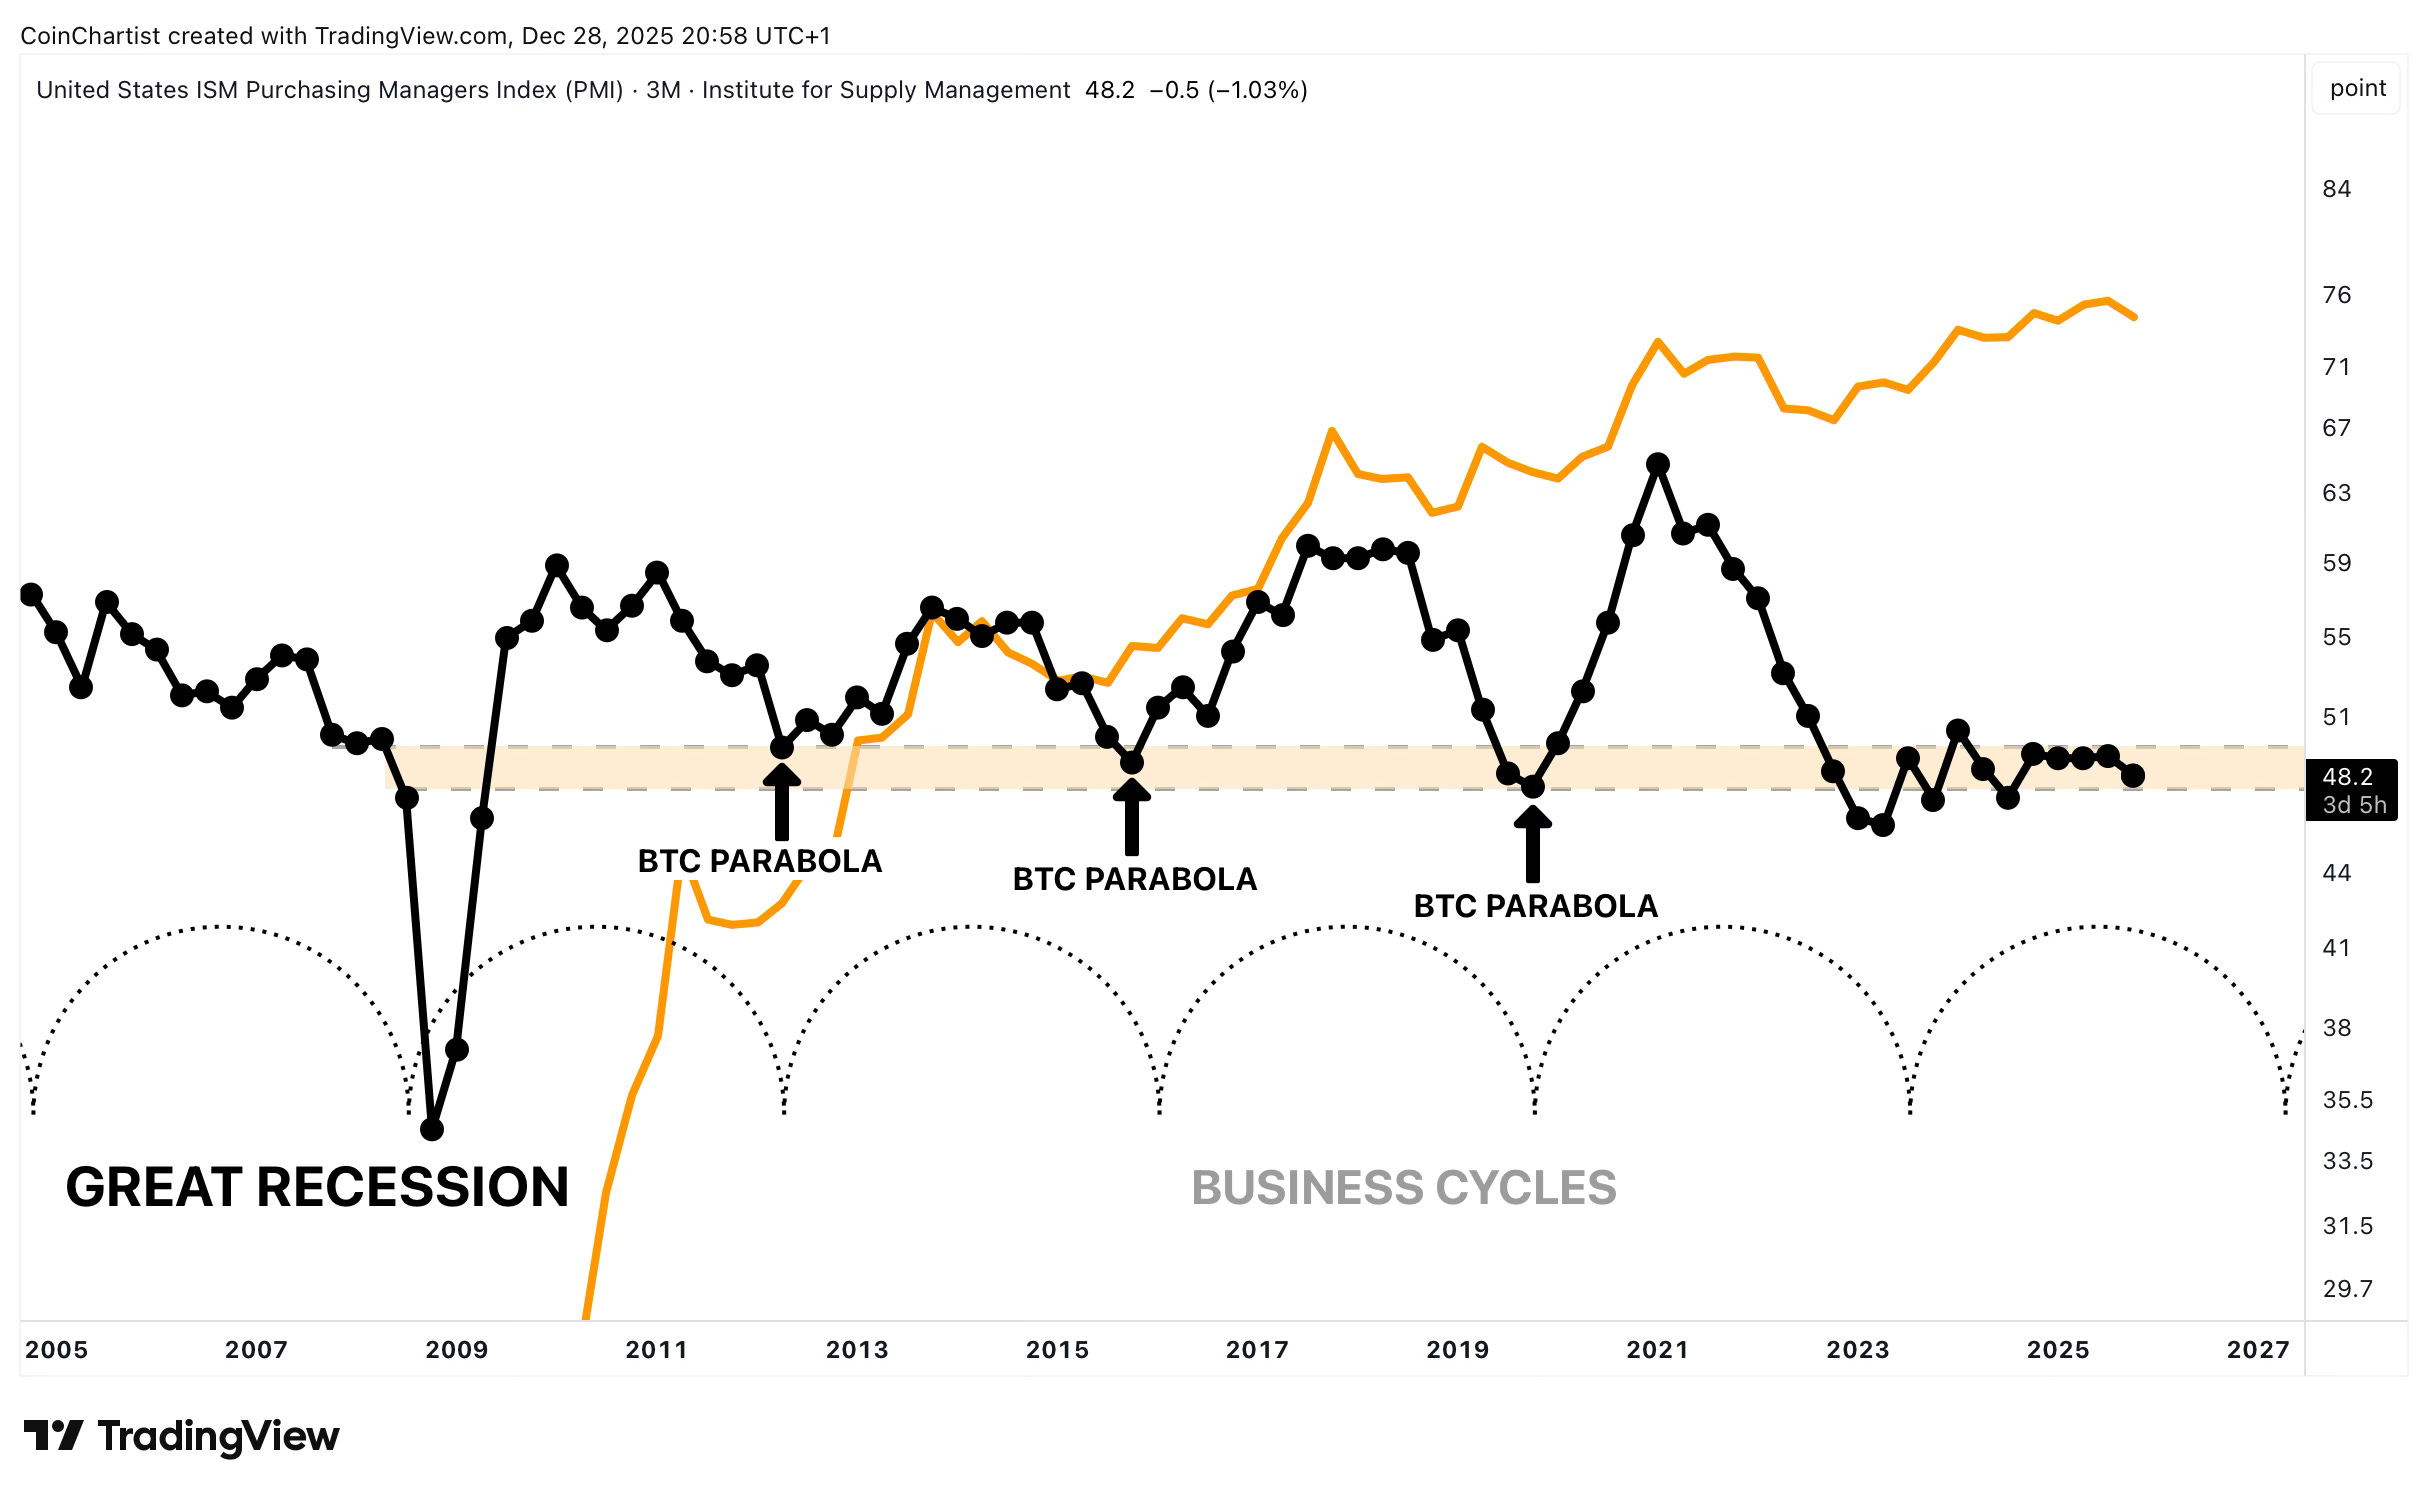
Can the business cycle turn up? Yes. But it doesn’t logically make sense. Crypto analysts live in a Bitcoin bubble-like world. All their math, modeling, etc. is based on Bitcoin since its inception. But Bitcoin was born into monetary abundance and economic growth expansion. Back the truck up a bit on the business cycle charts all these analysts are sharing and it immediately shows that the Great Recession is left off everyone’s charts. This is probably not even them cherry-picking the chart — they just only know a post-Bitcoin world. Furthermore, cyclical behavior suggests the business cycle never quite turned up and is due for a low — not a high. Cycle theory looks for rhythmic lows that can be synchronized over time (more on this later).
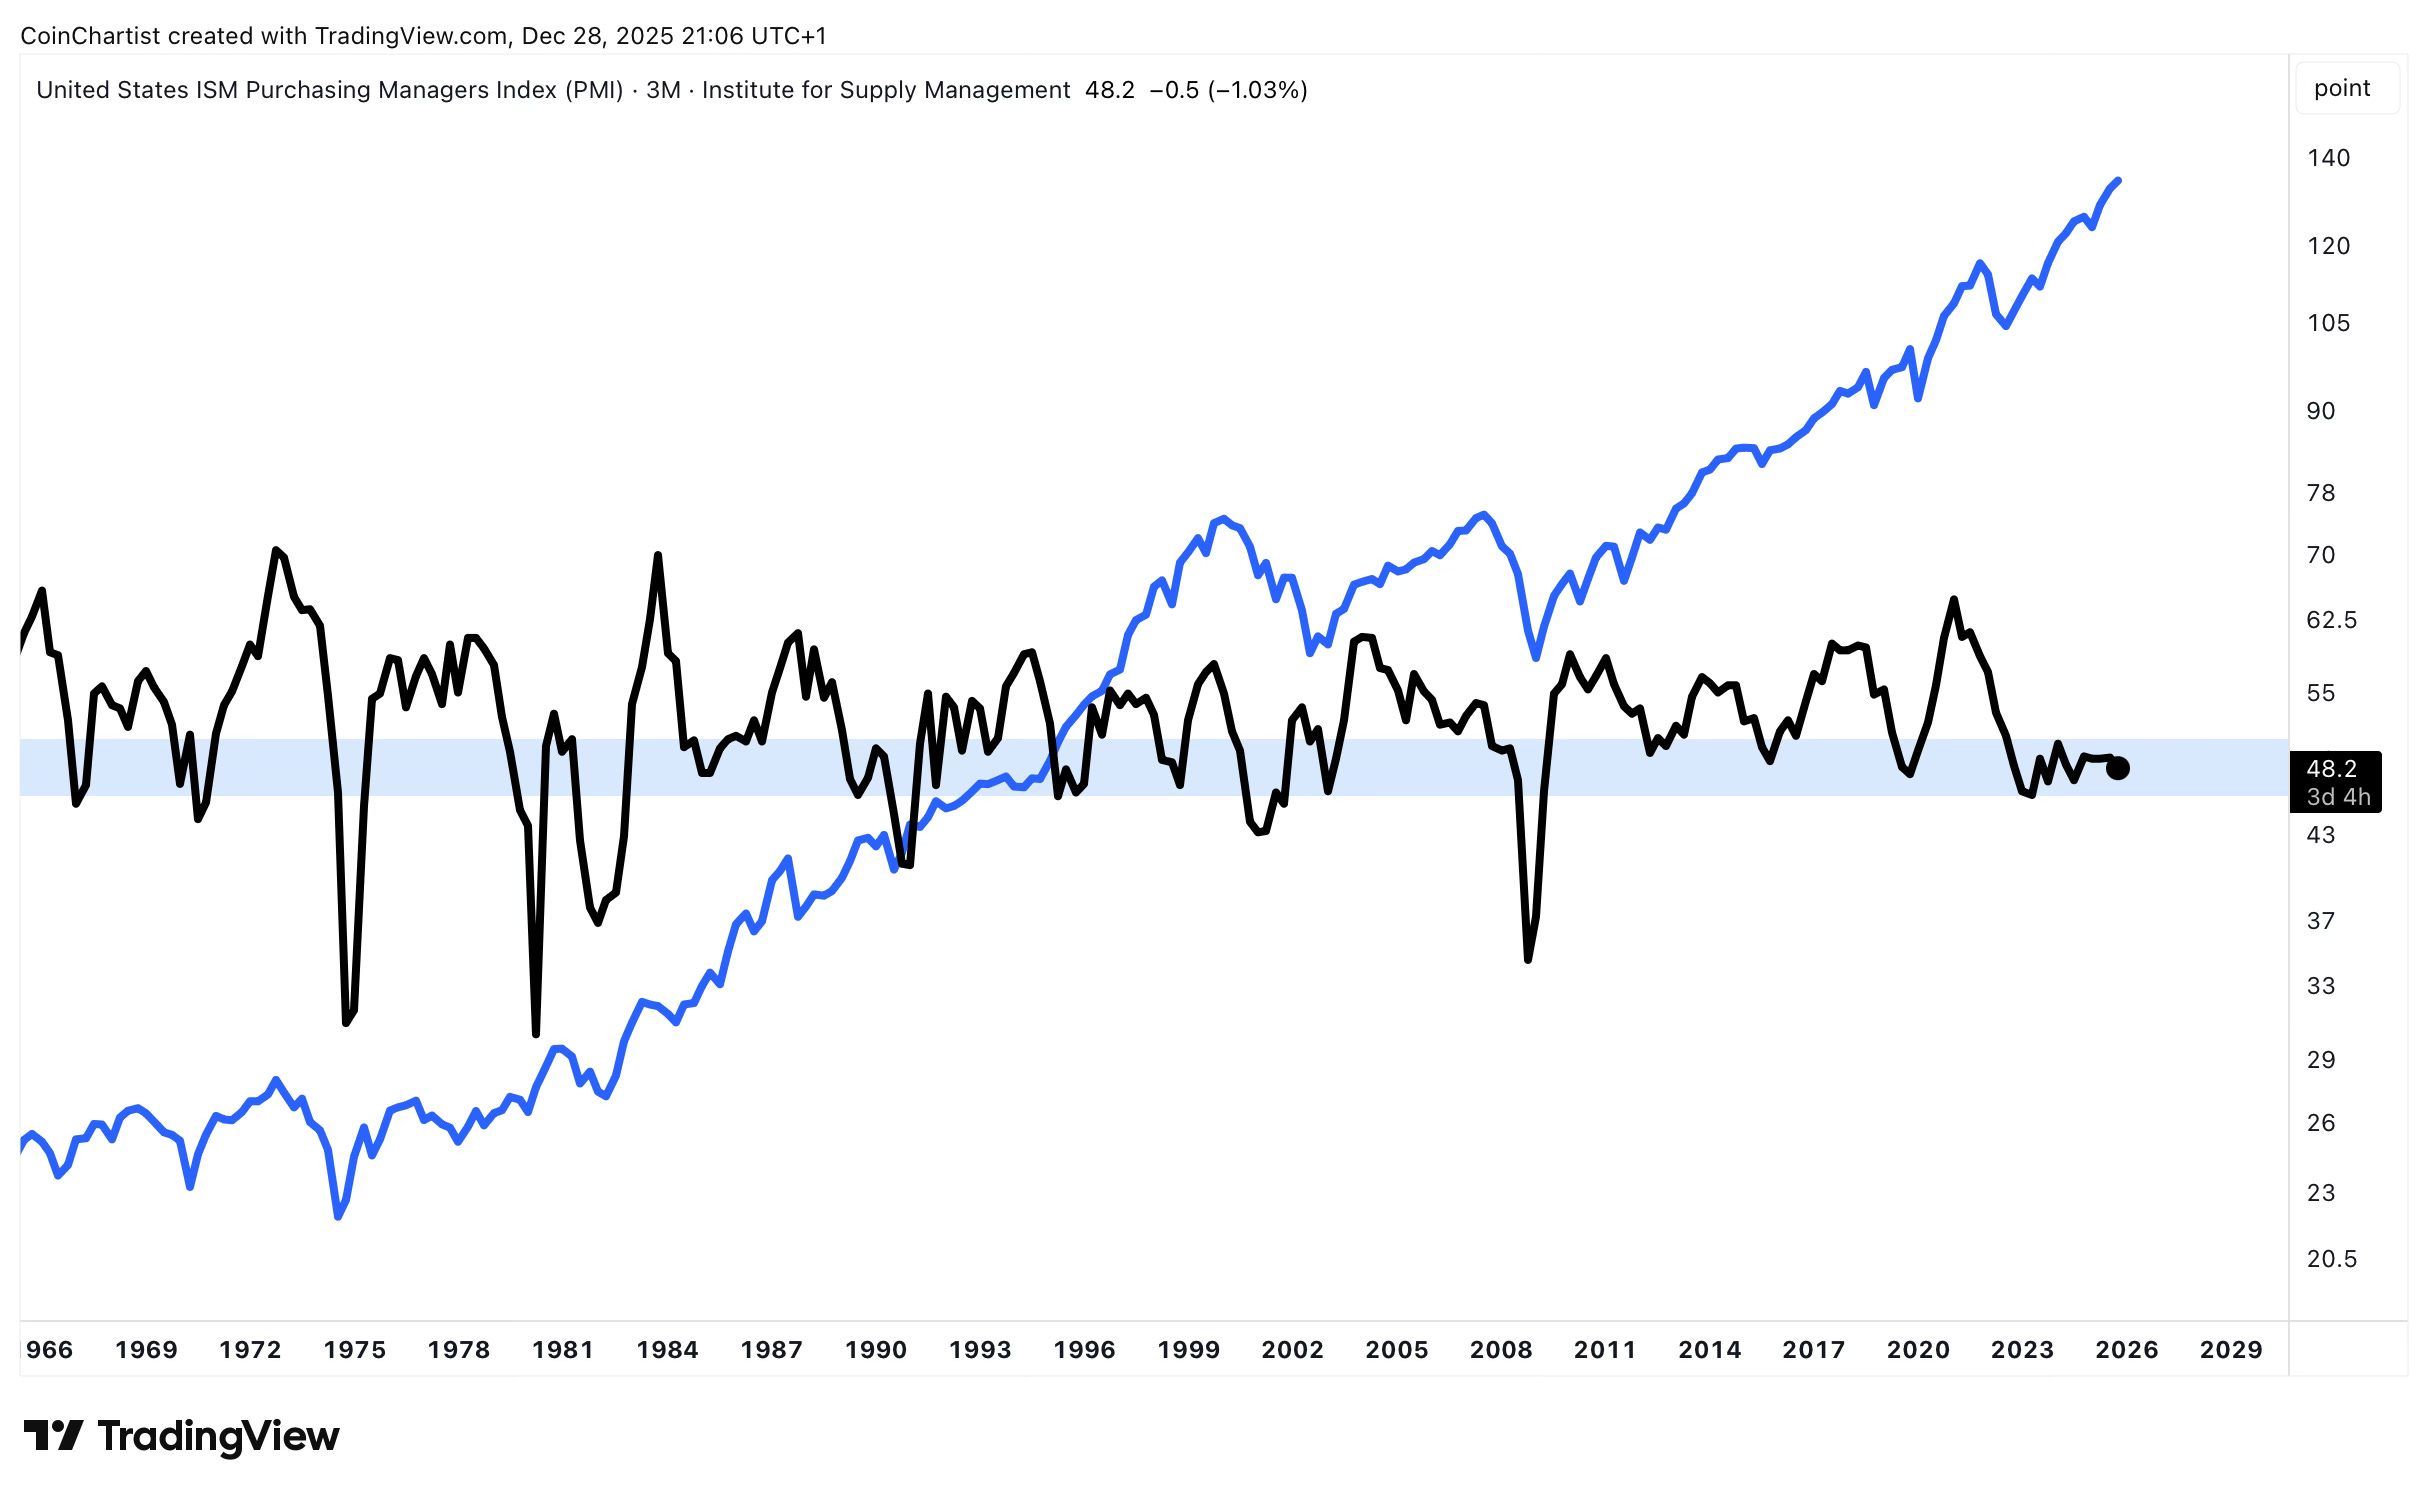
ISM — the Purchasing Manager’s Index — is what most analysts are measuring. Or the Copper/Gold ratio. The above shows ISM with the S&P 500 superimposed over it to highlight that when the index falls below the blue zone, the stock market corrects — because the business cycle turned down even further.
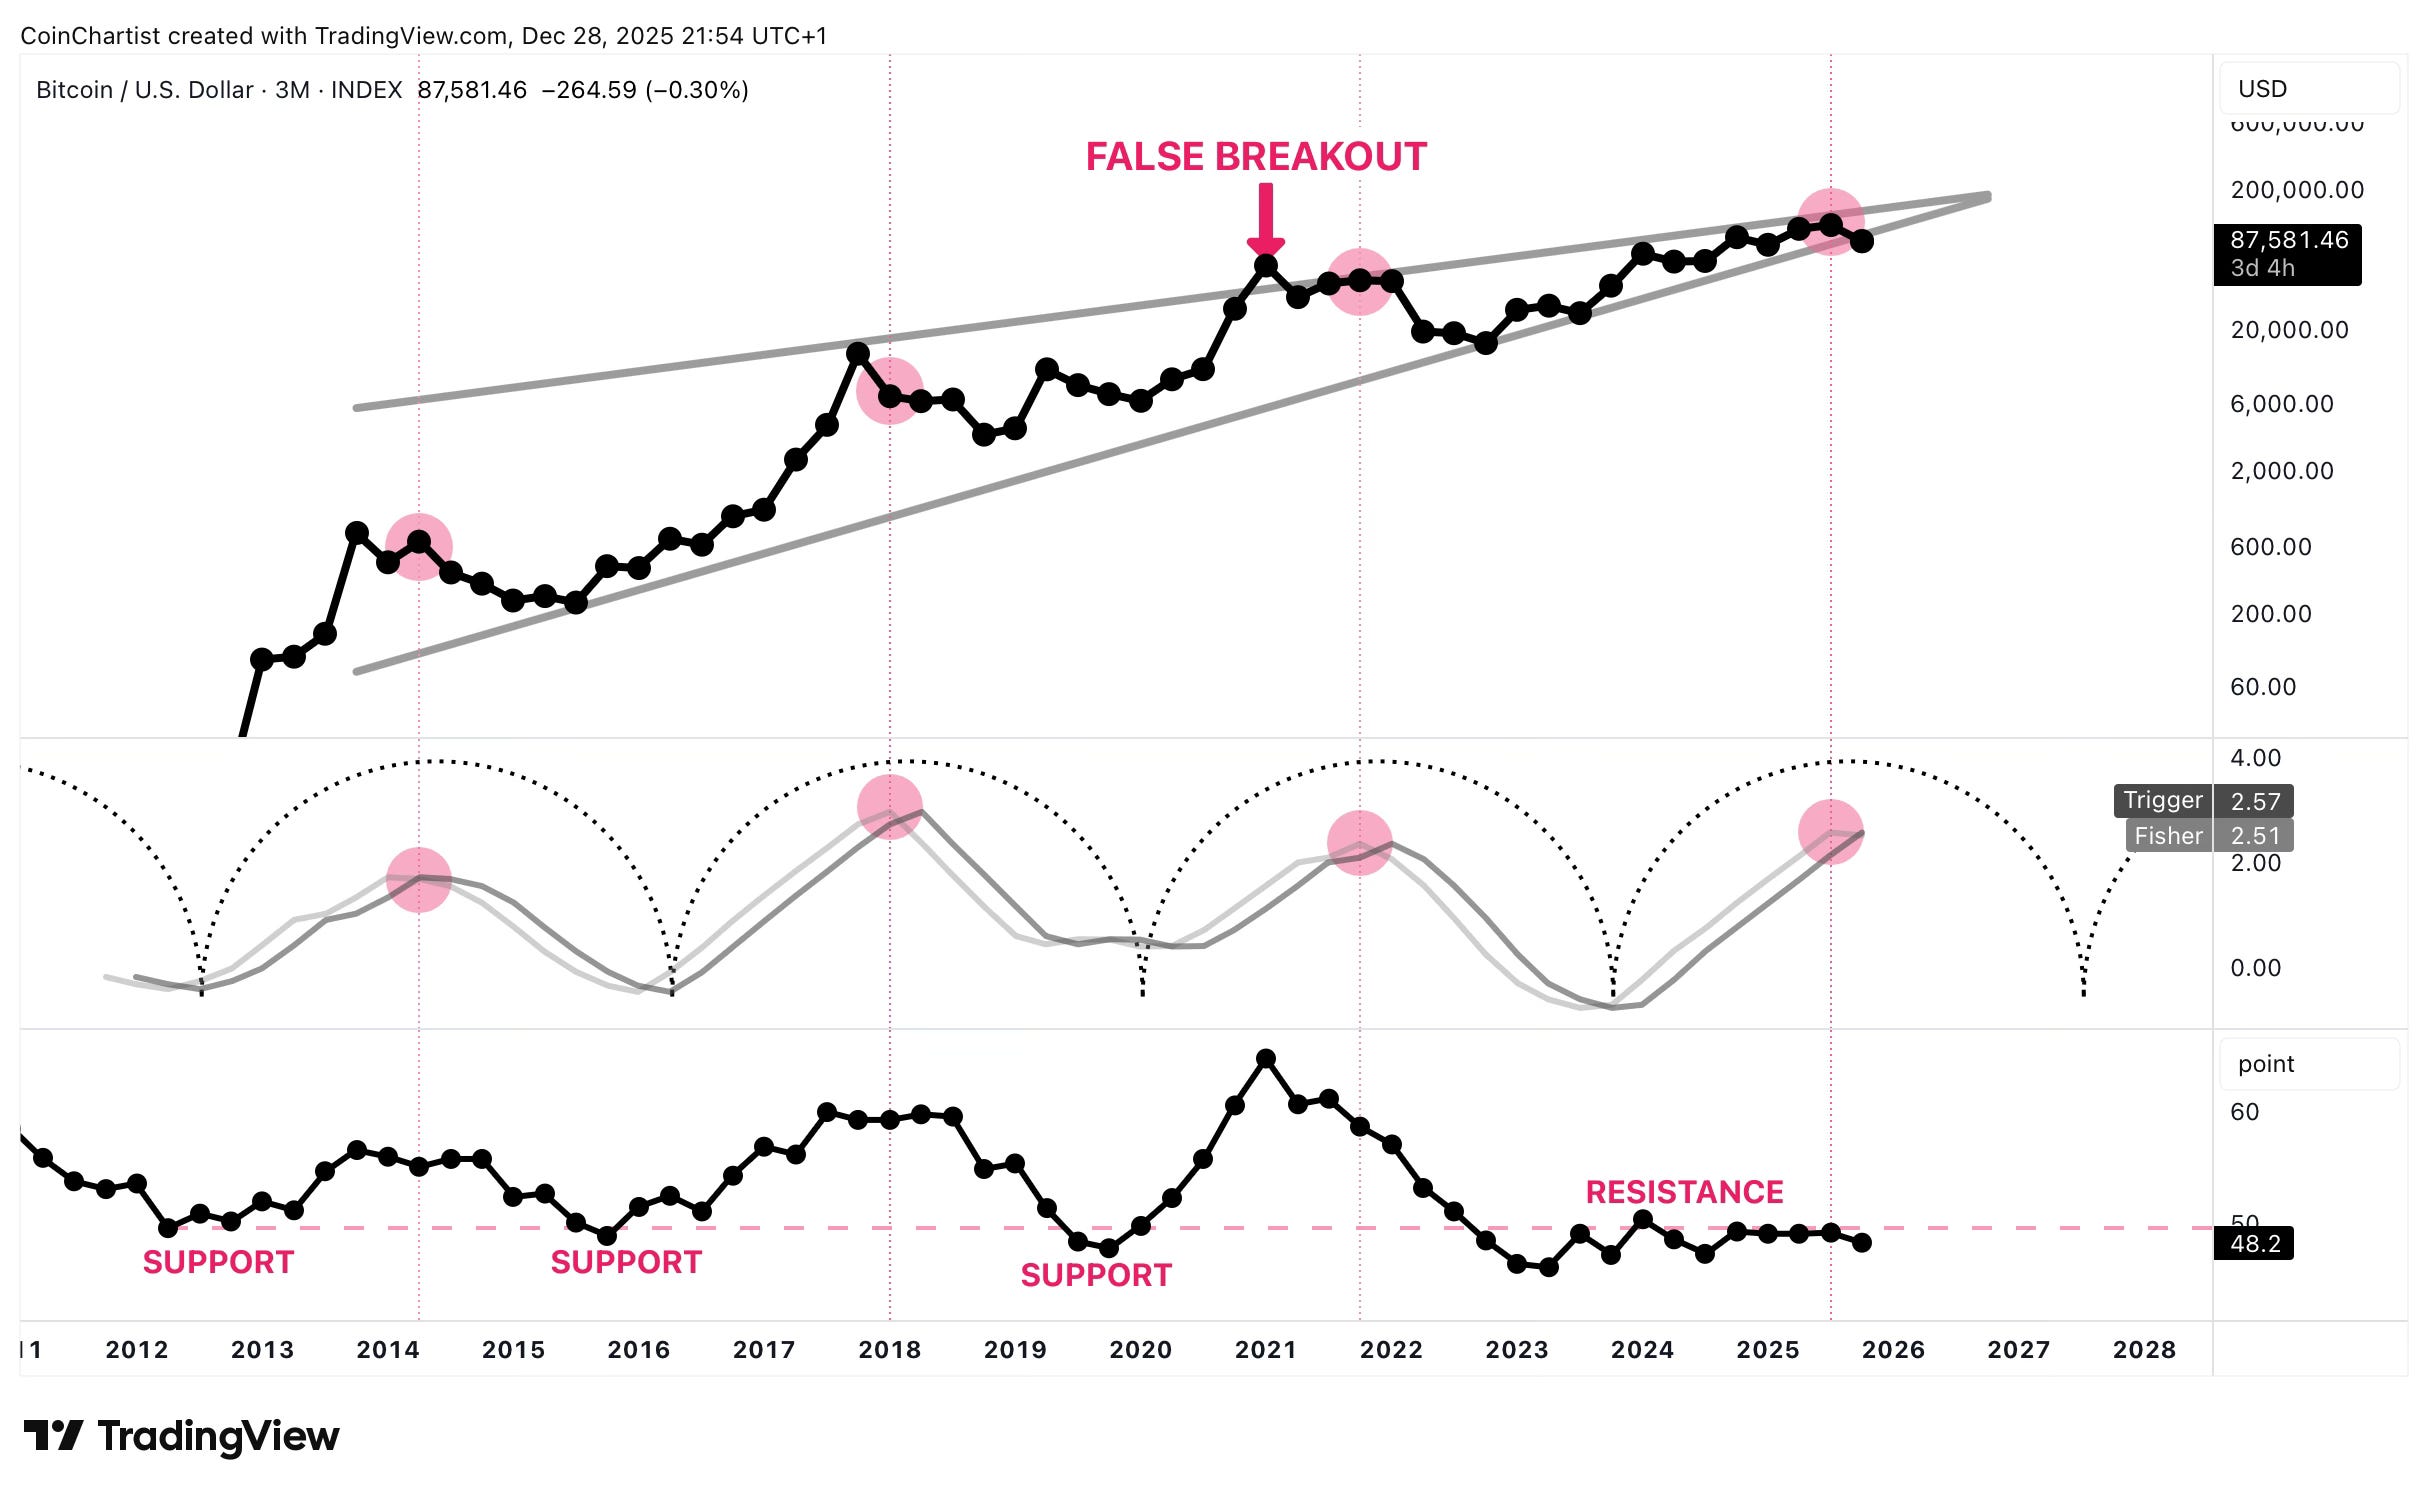
ISM over time looks like it is turning support into resistance. Layer in Bitcoin’s cyclical behavior and we can see the lack of a real business cycle is the reason for the lack of a parabolic rally, blow off top, or altcoin season. Risk-appetite isn’t there.
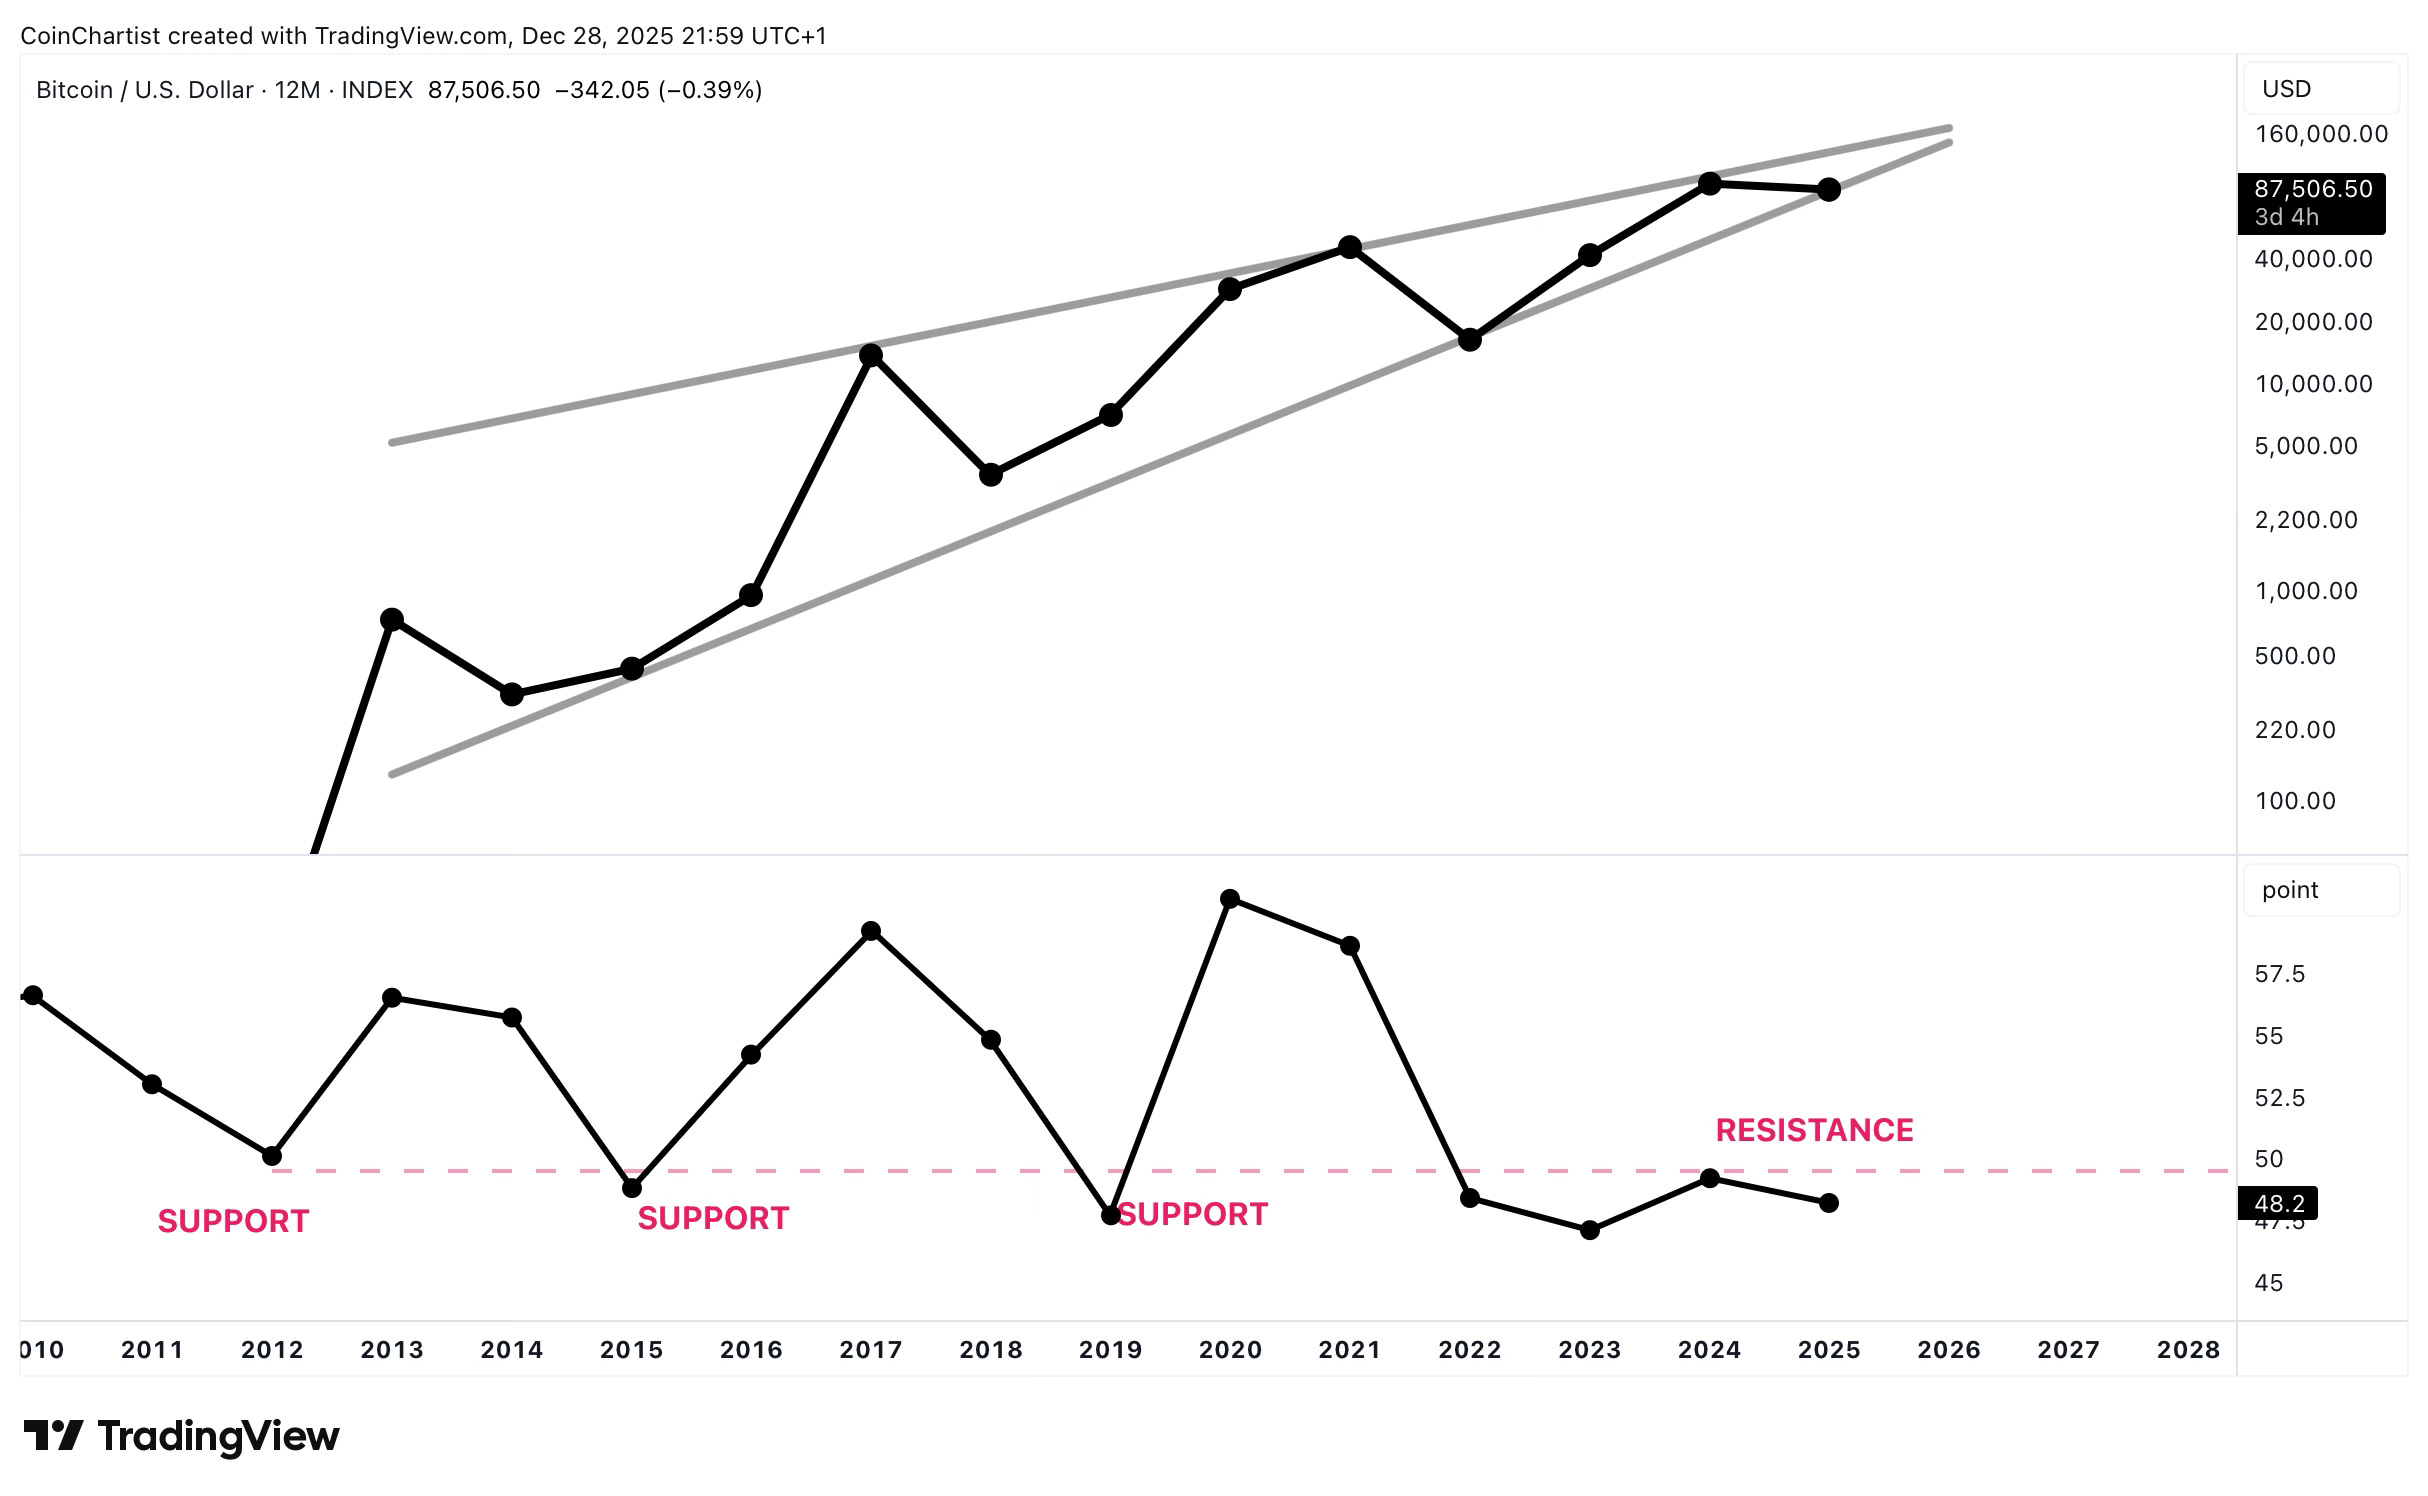
The yearly line chart with markers makes the entire situation seem that much more bleak. Bitcoin appears ready to break down from that wedge brought up earlier, just as the ISM moves downward as it did during the Great Recession.
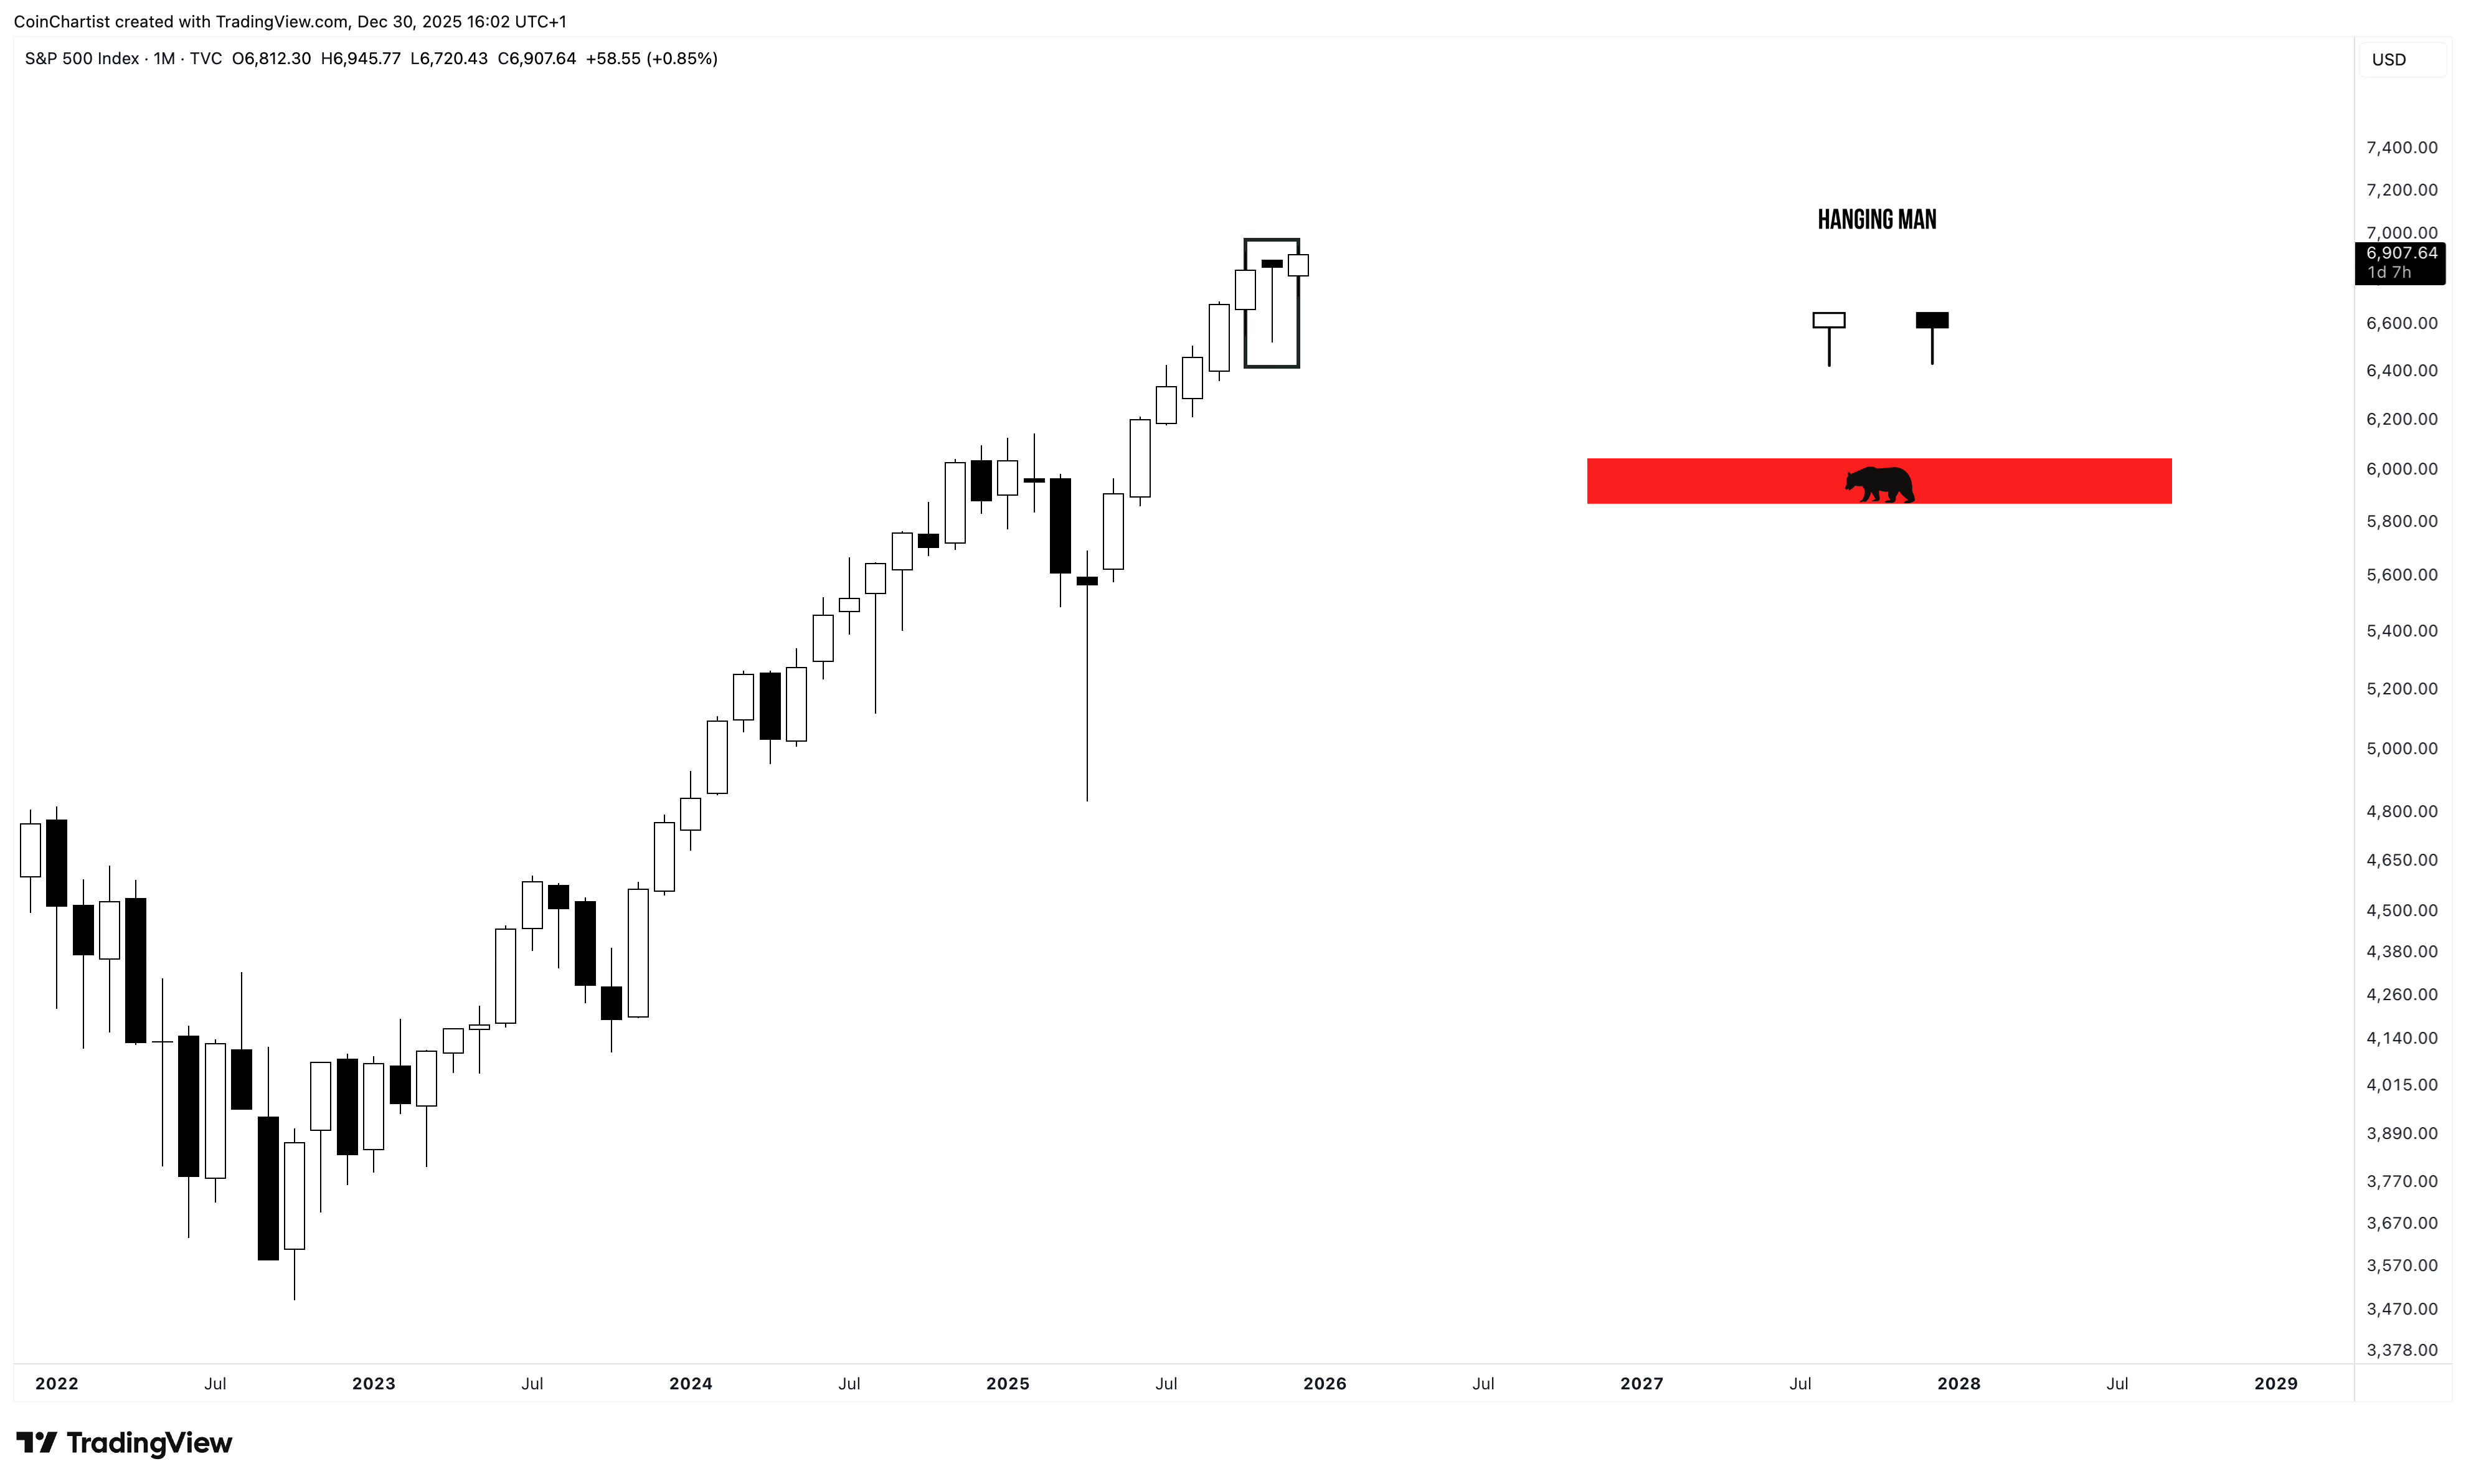
The S&P 500 doesn’t look as dire as Bitcoin on the yearly or quarterly. But the monthly closed with a Hanging Man last month, and that could be a warning sign that a bigger reversal is coming in the stock market as well.
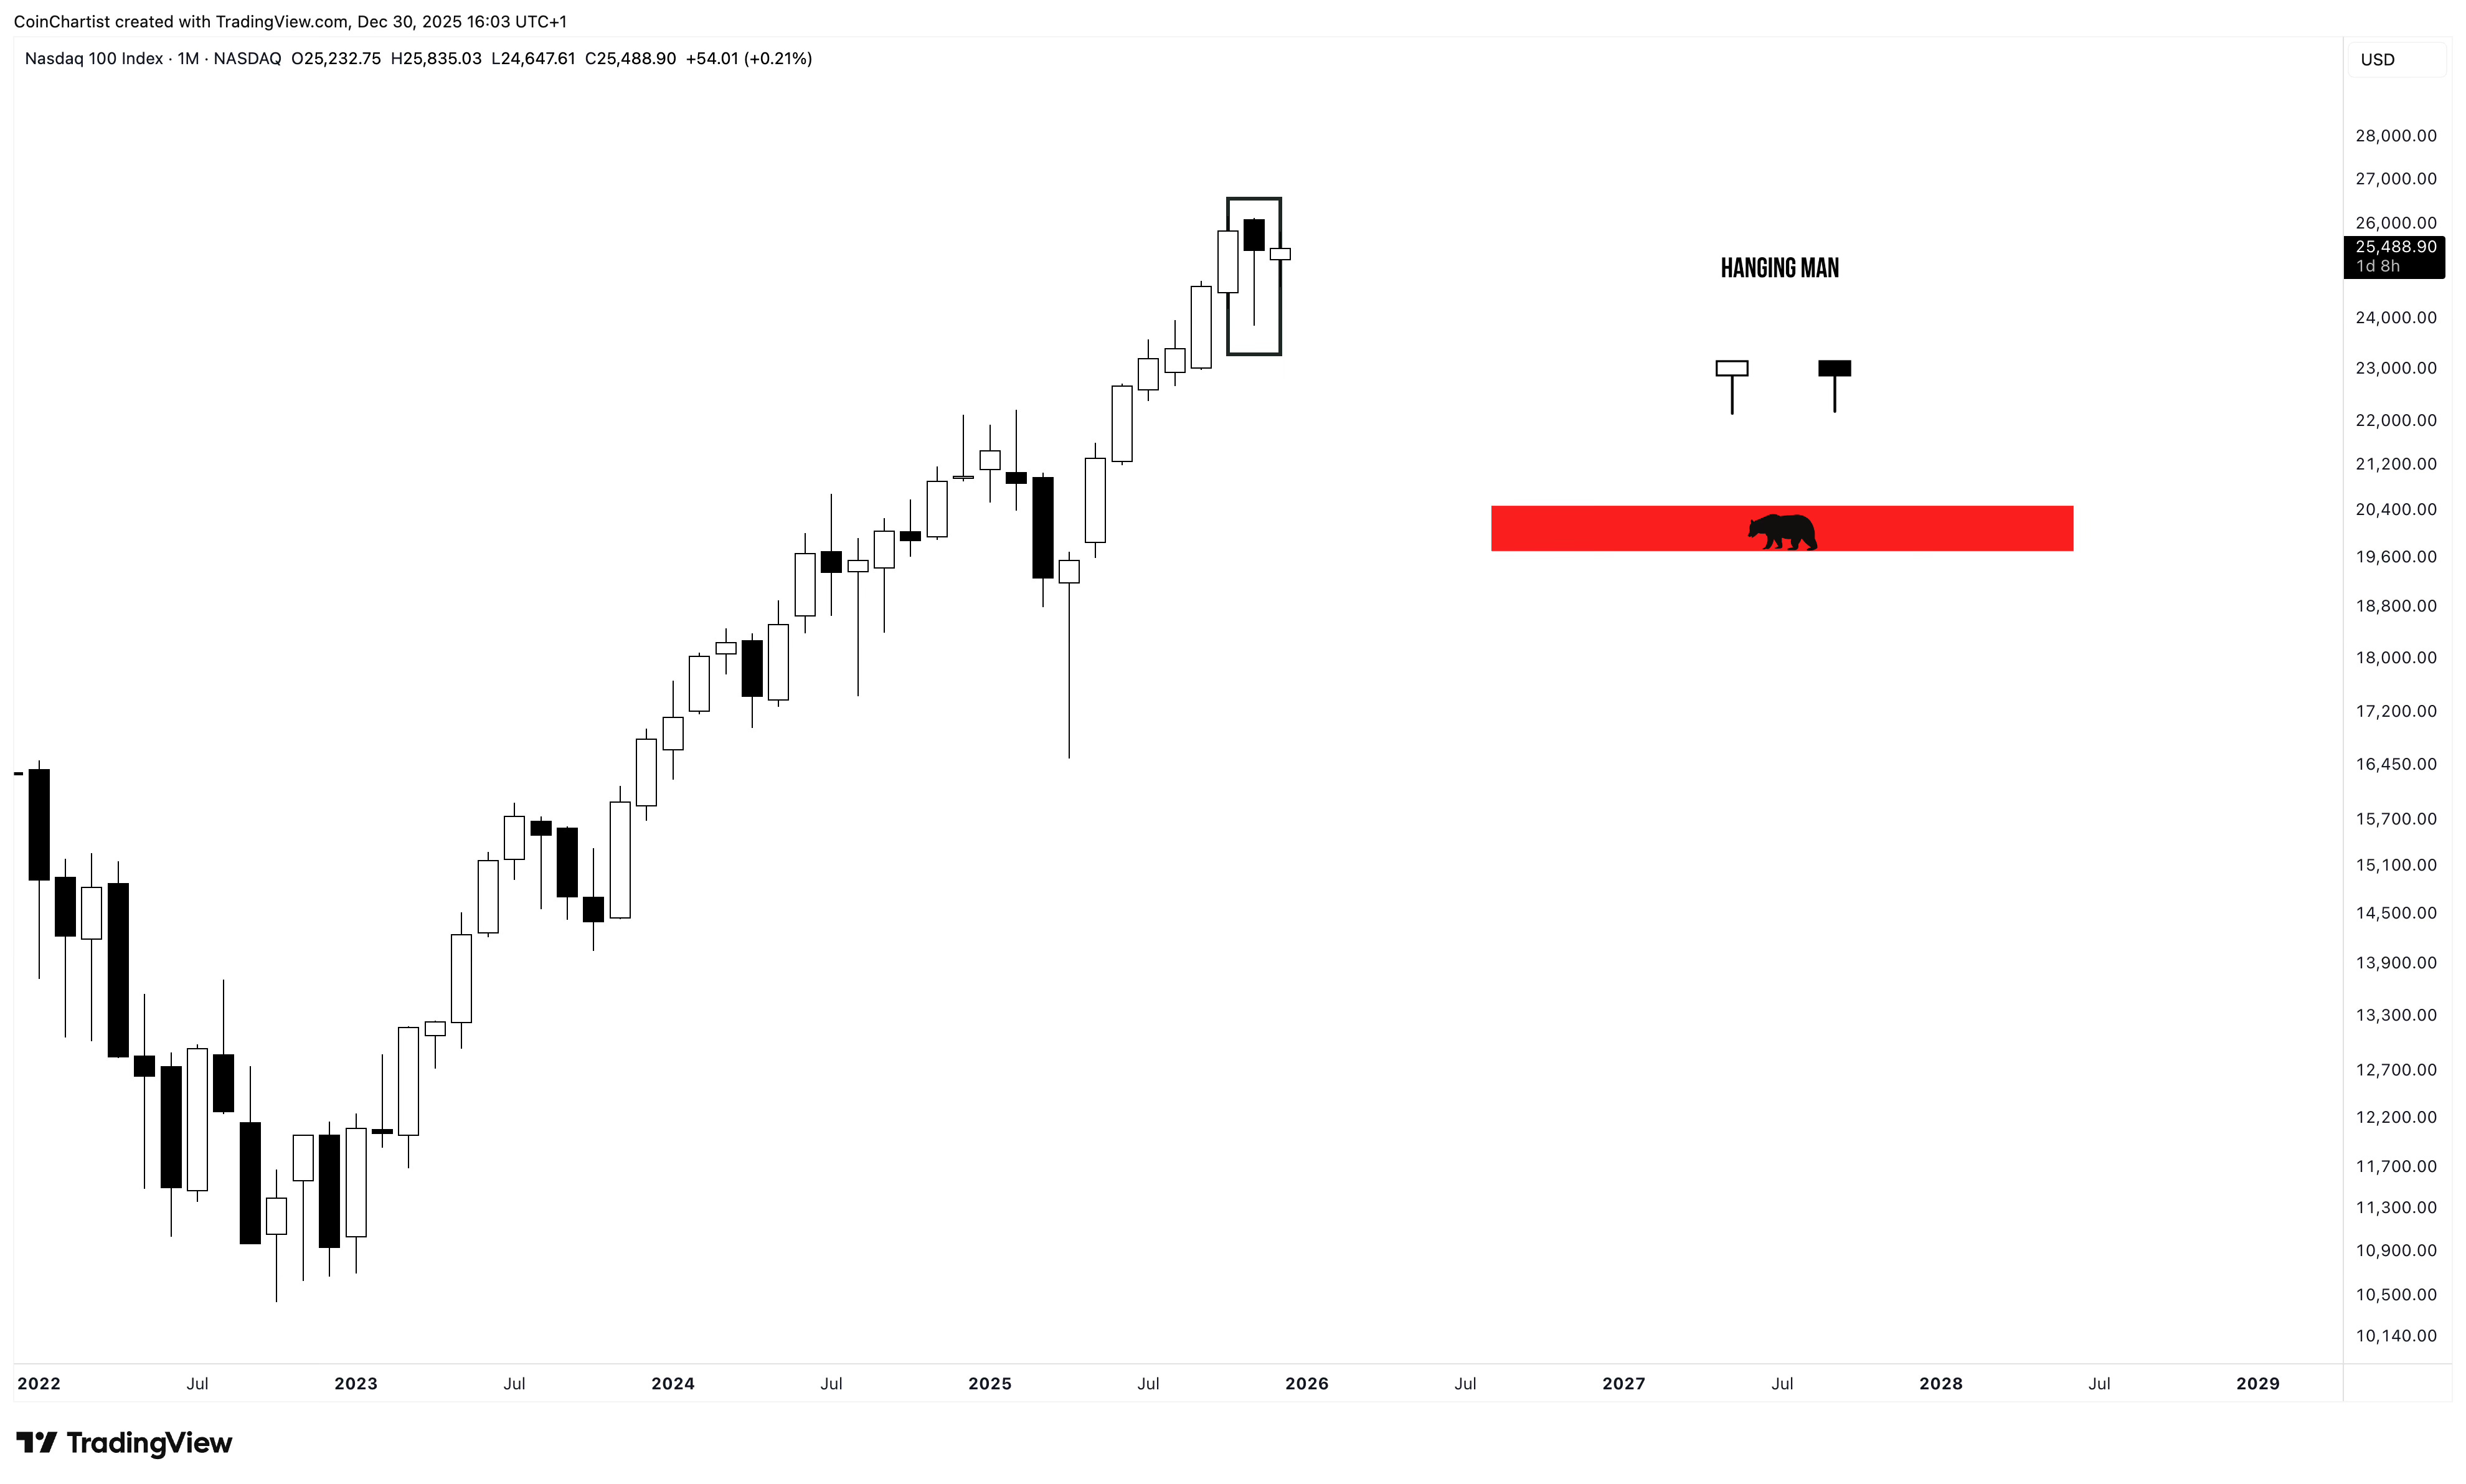
The same pattern is visible on the monthly Nasdaq, showing that tech stocks are possibly in danger of further correction.
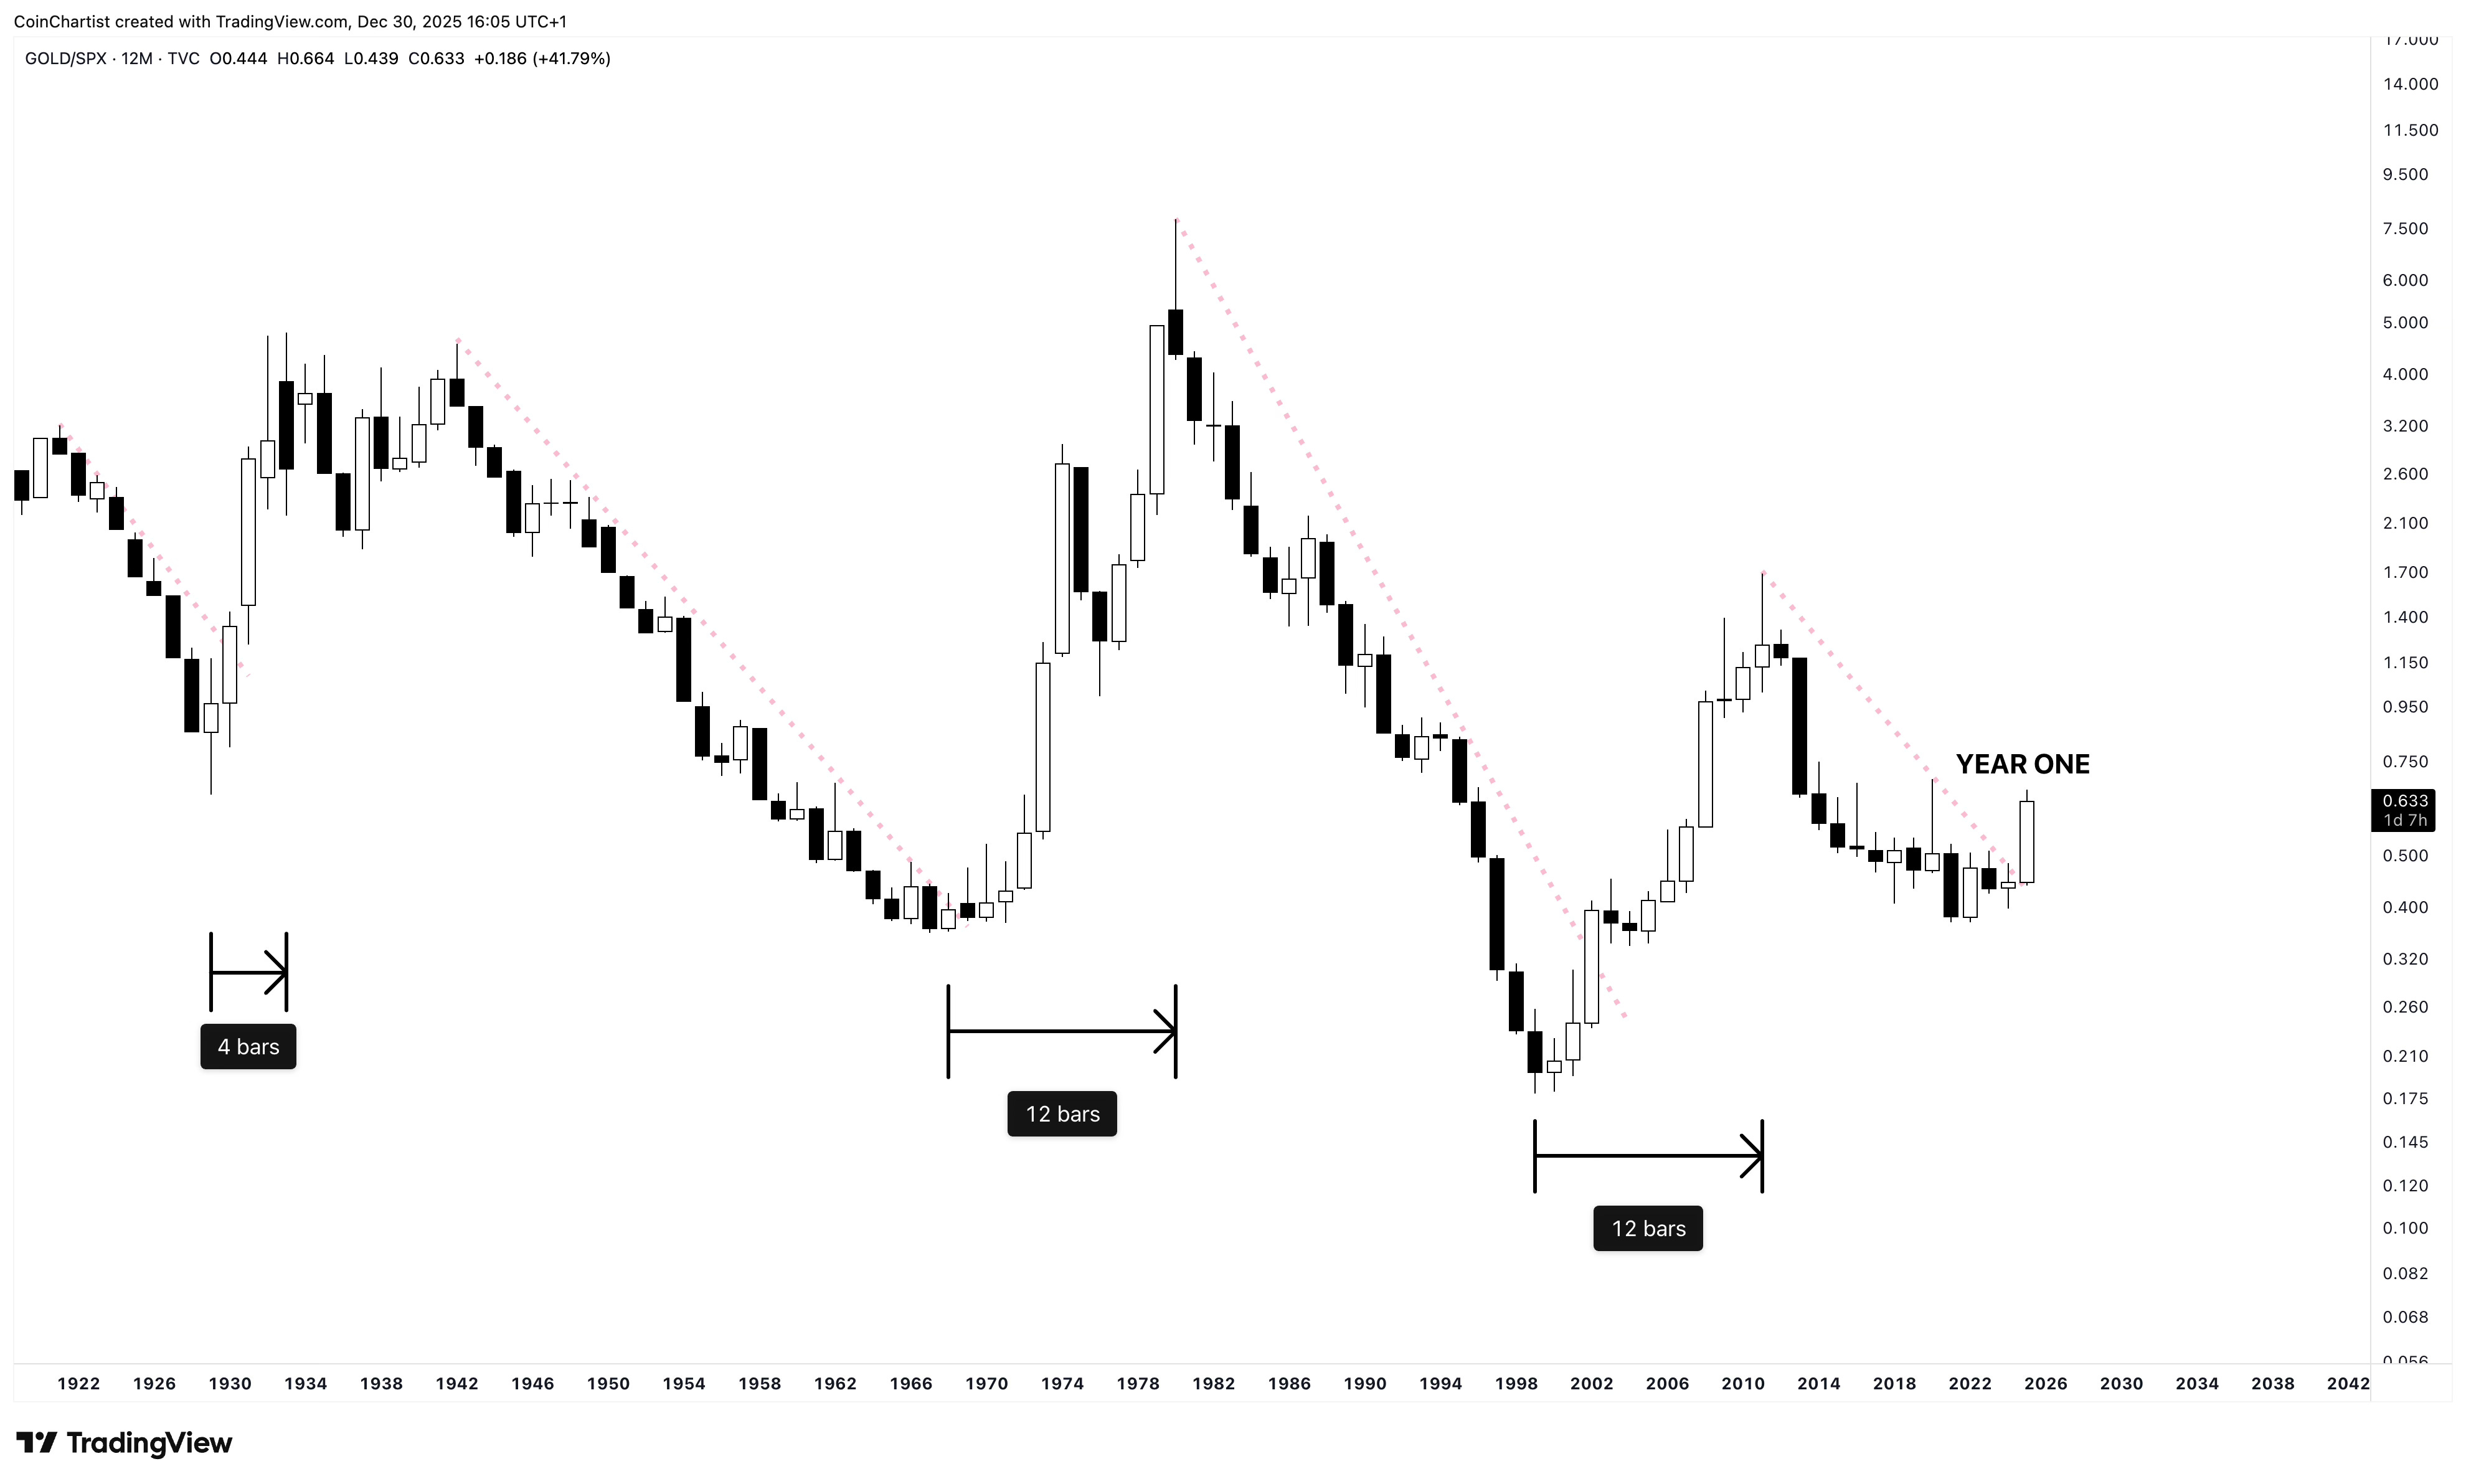
The stock market might not perform very well for up to a decade. The Gold/S&P500 ratio has only just broken out from a downtrend line. Past downtrend breakouts happened for 4 years around the Great Depression, 12 years during stagflation, and 12 years around the dot com bubble and Great Recession. It’s hard to imagine this secular shift from soft assets to hard assets ends anytime soon. This represents a change from hope-based stock market growth due to positive trade outlook, to fear-based commodity hoarding as countries reconsider their natural resources amidst trade uncertainty.
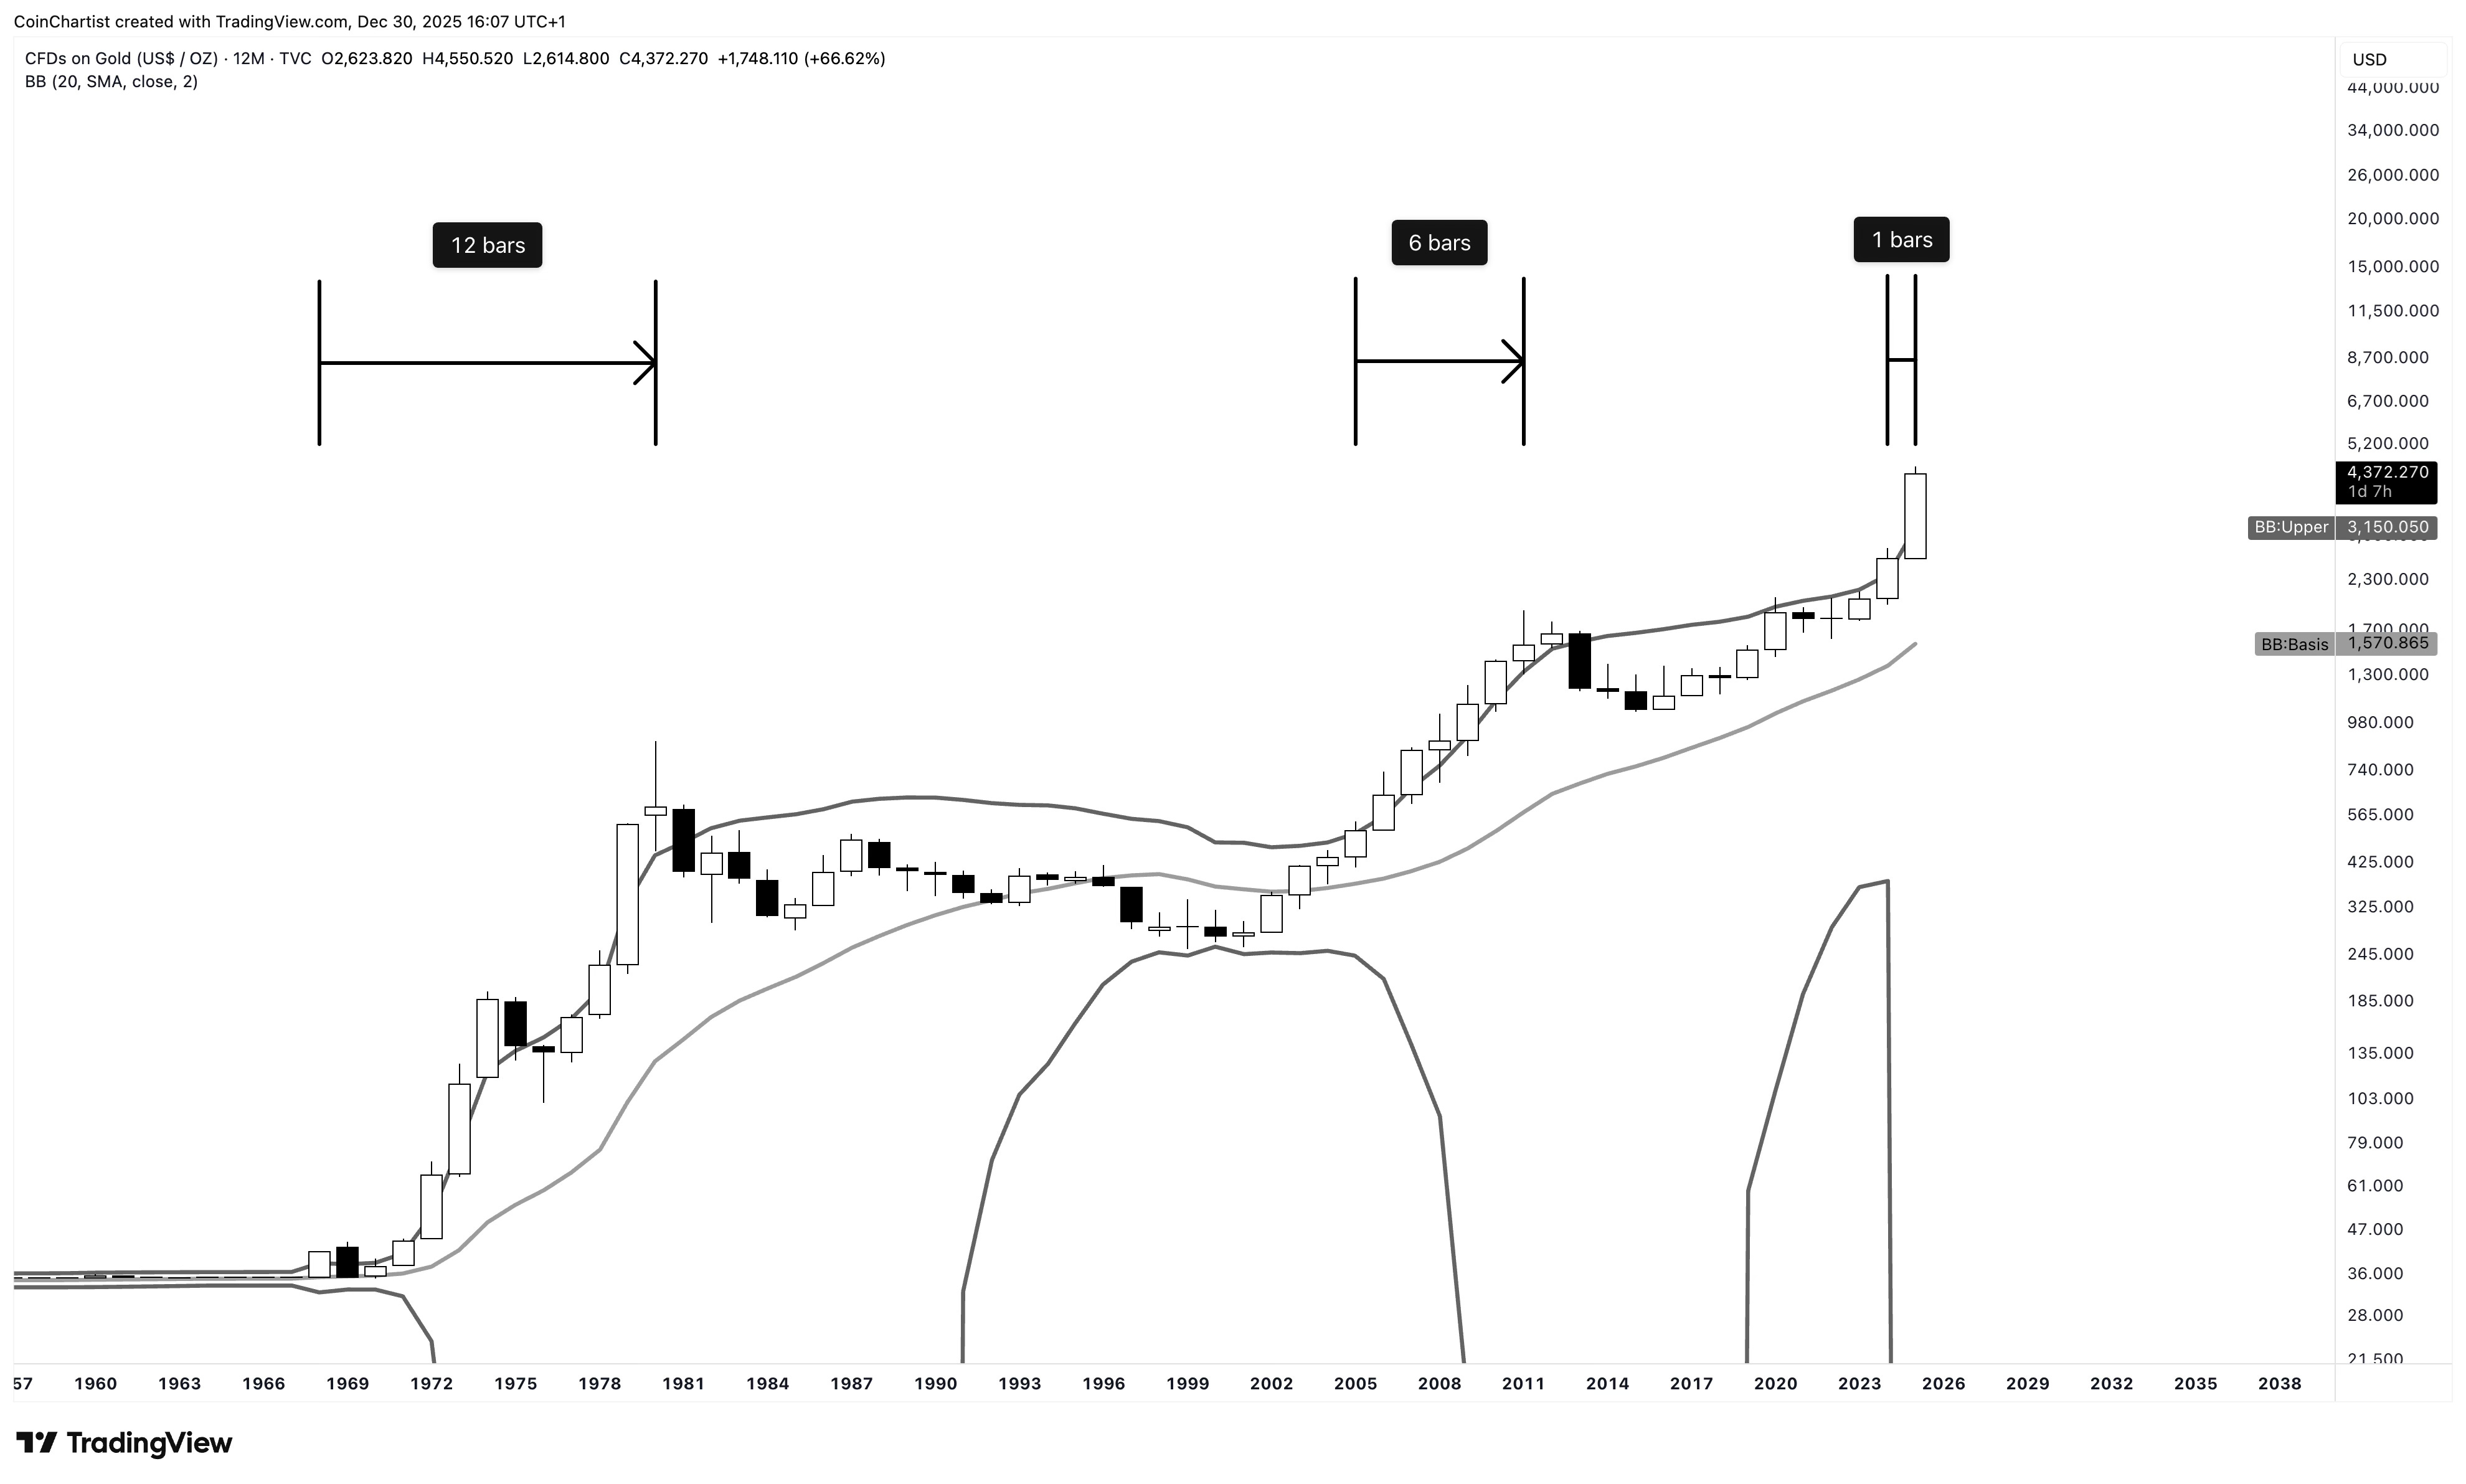
The yearly Gold chart shows the second year above the upper Bollinger Band post-squeeze. In the past these trends have lasted for nearly a decade.
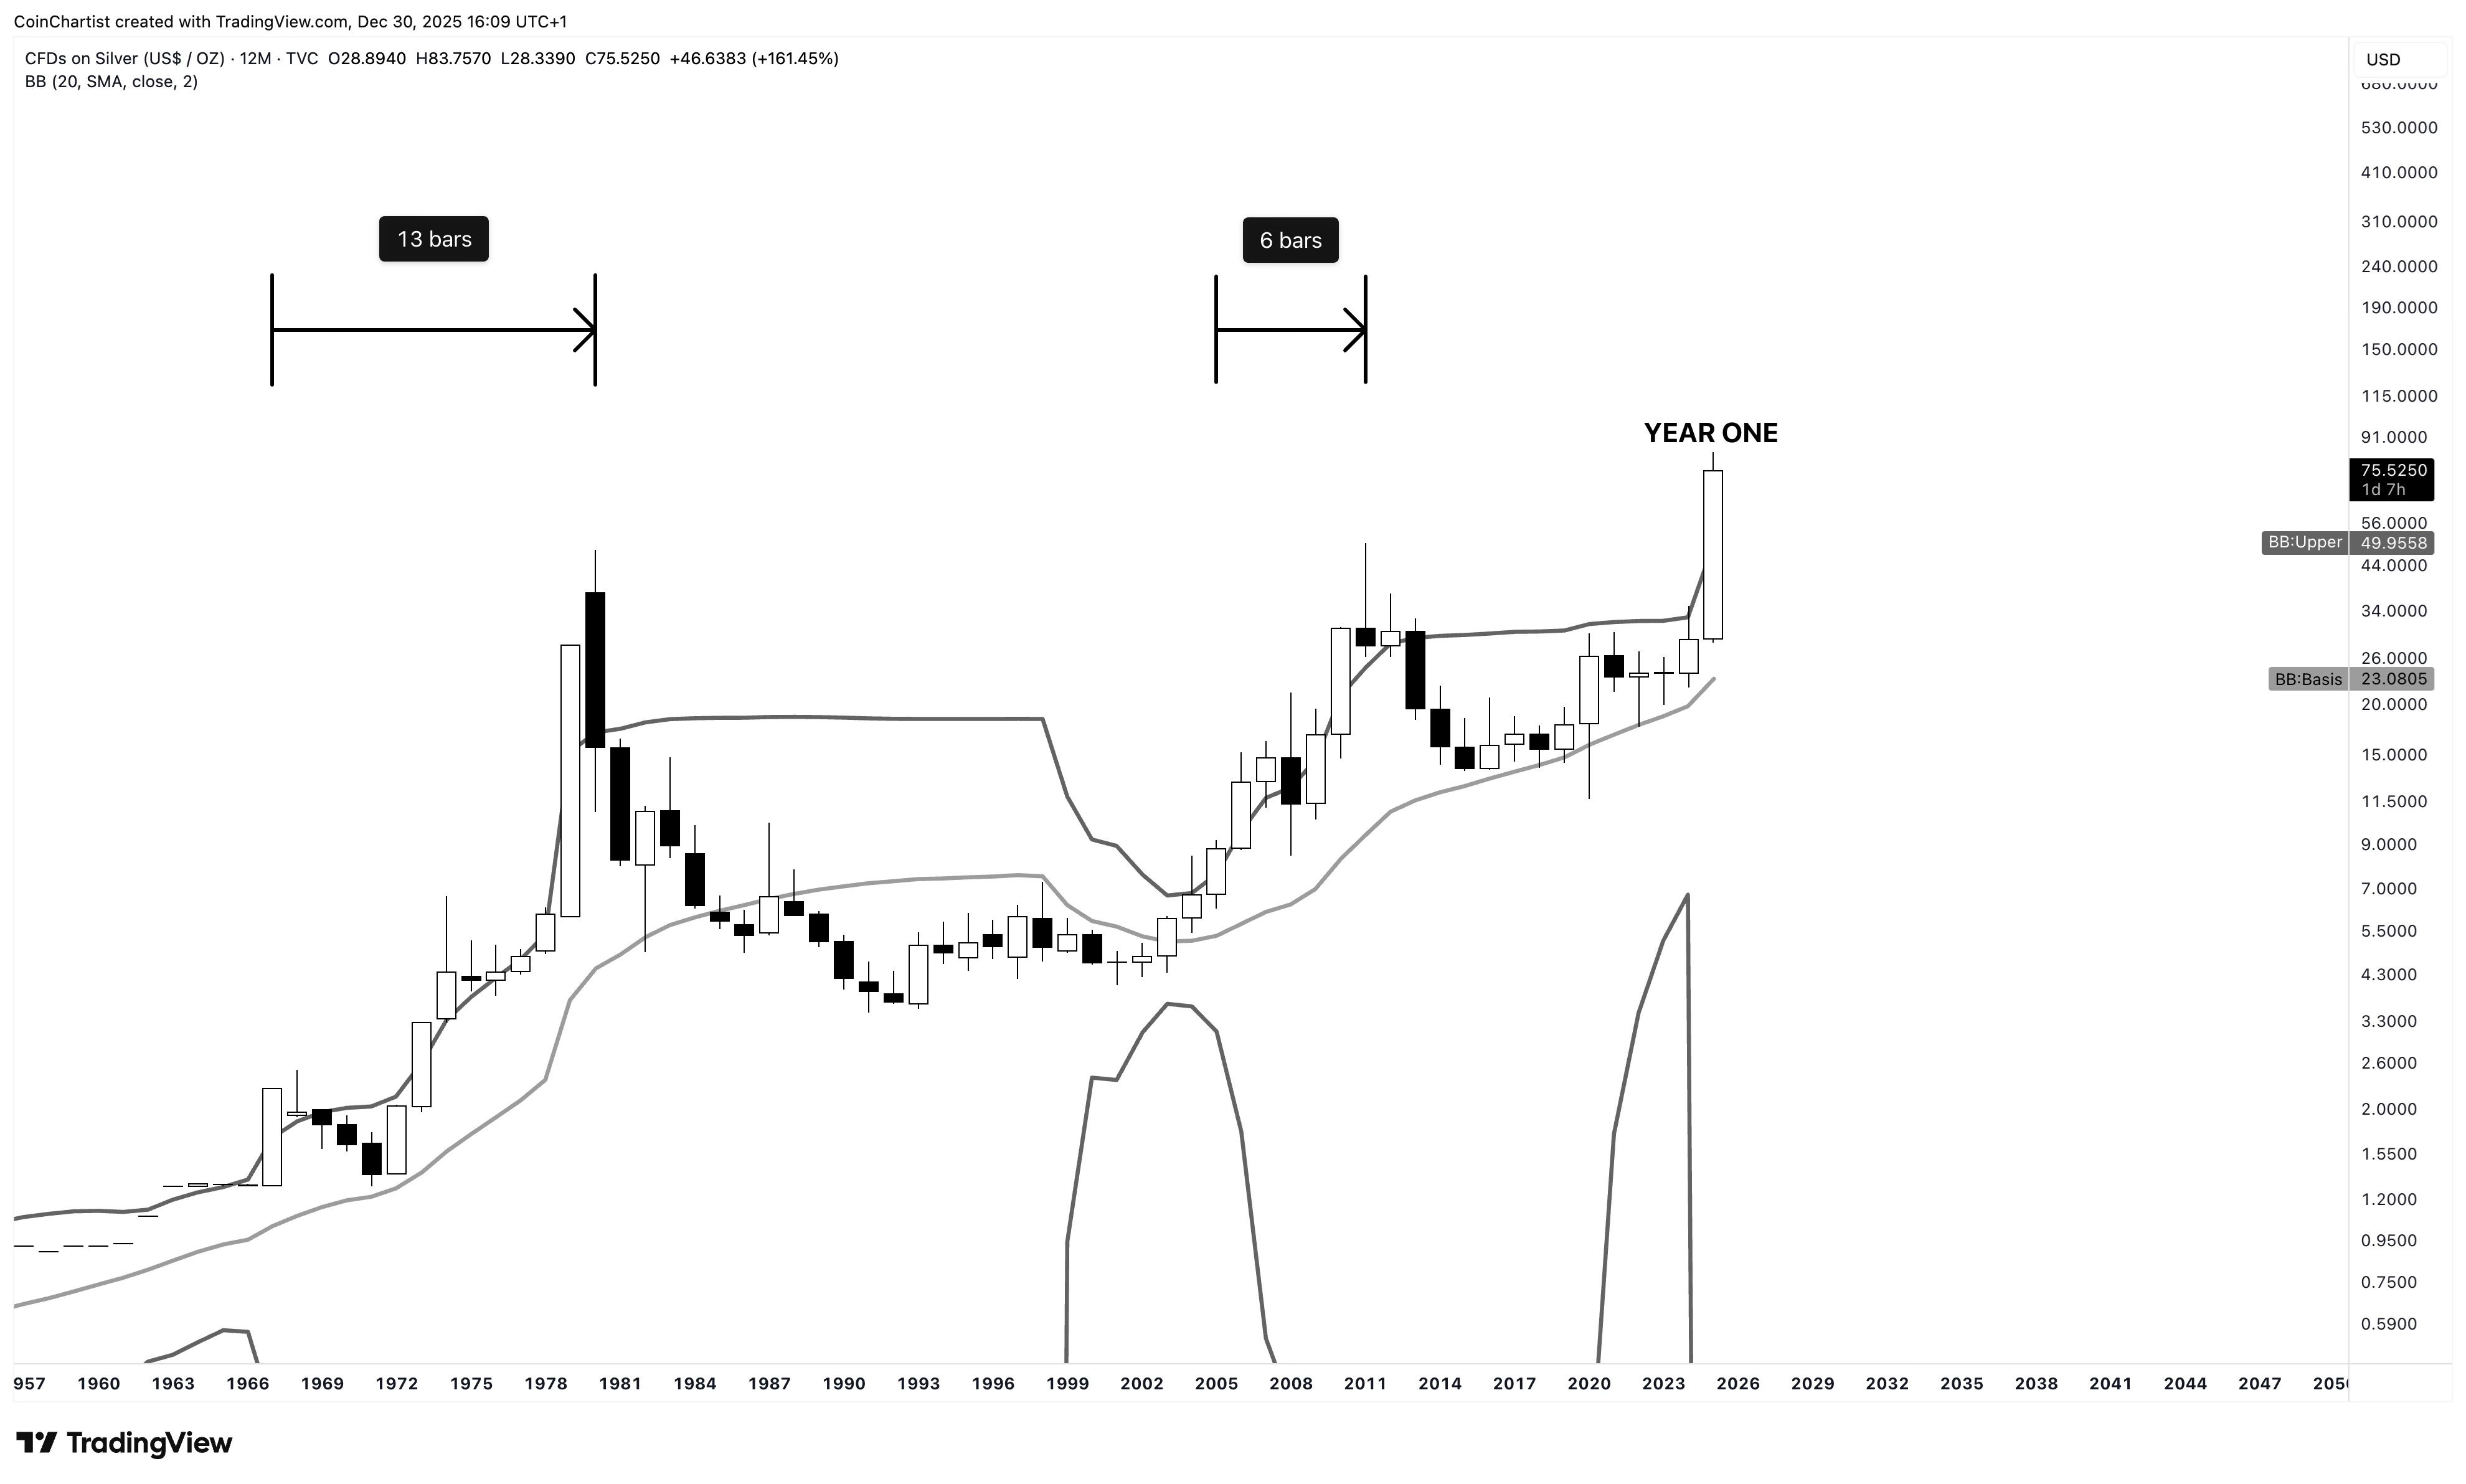
The same can be said about Silver, except Silver is on year one of the breakout. Crypto bystanders seeing Silver outperform even altcoins is confusing. They expect pullbacks like crypto and shorter trends. But rather than a 4-year cycle, Silver broke out from a 40-year downtrend. The uptrend won’t be over in a year or a few months. This is a major global event.
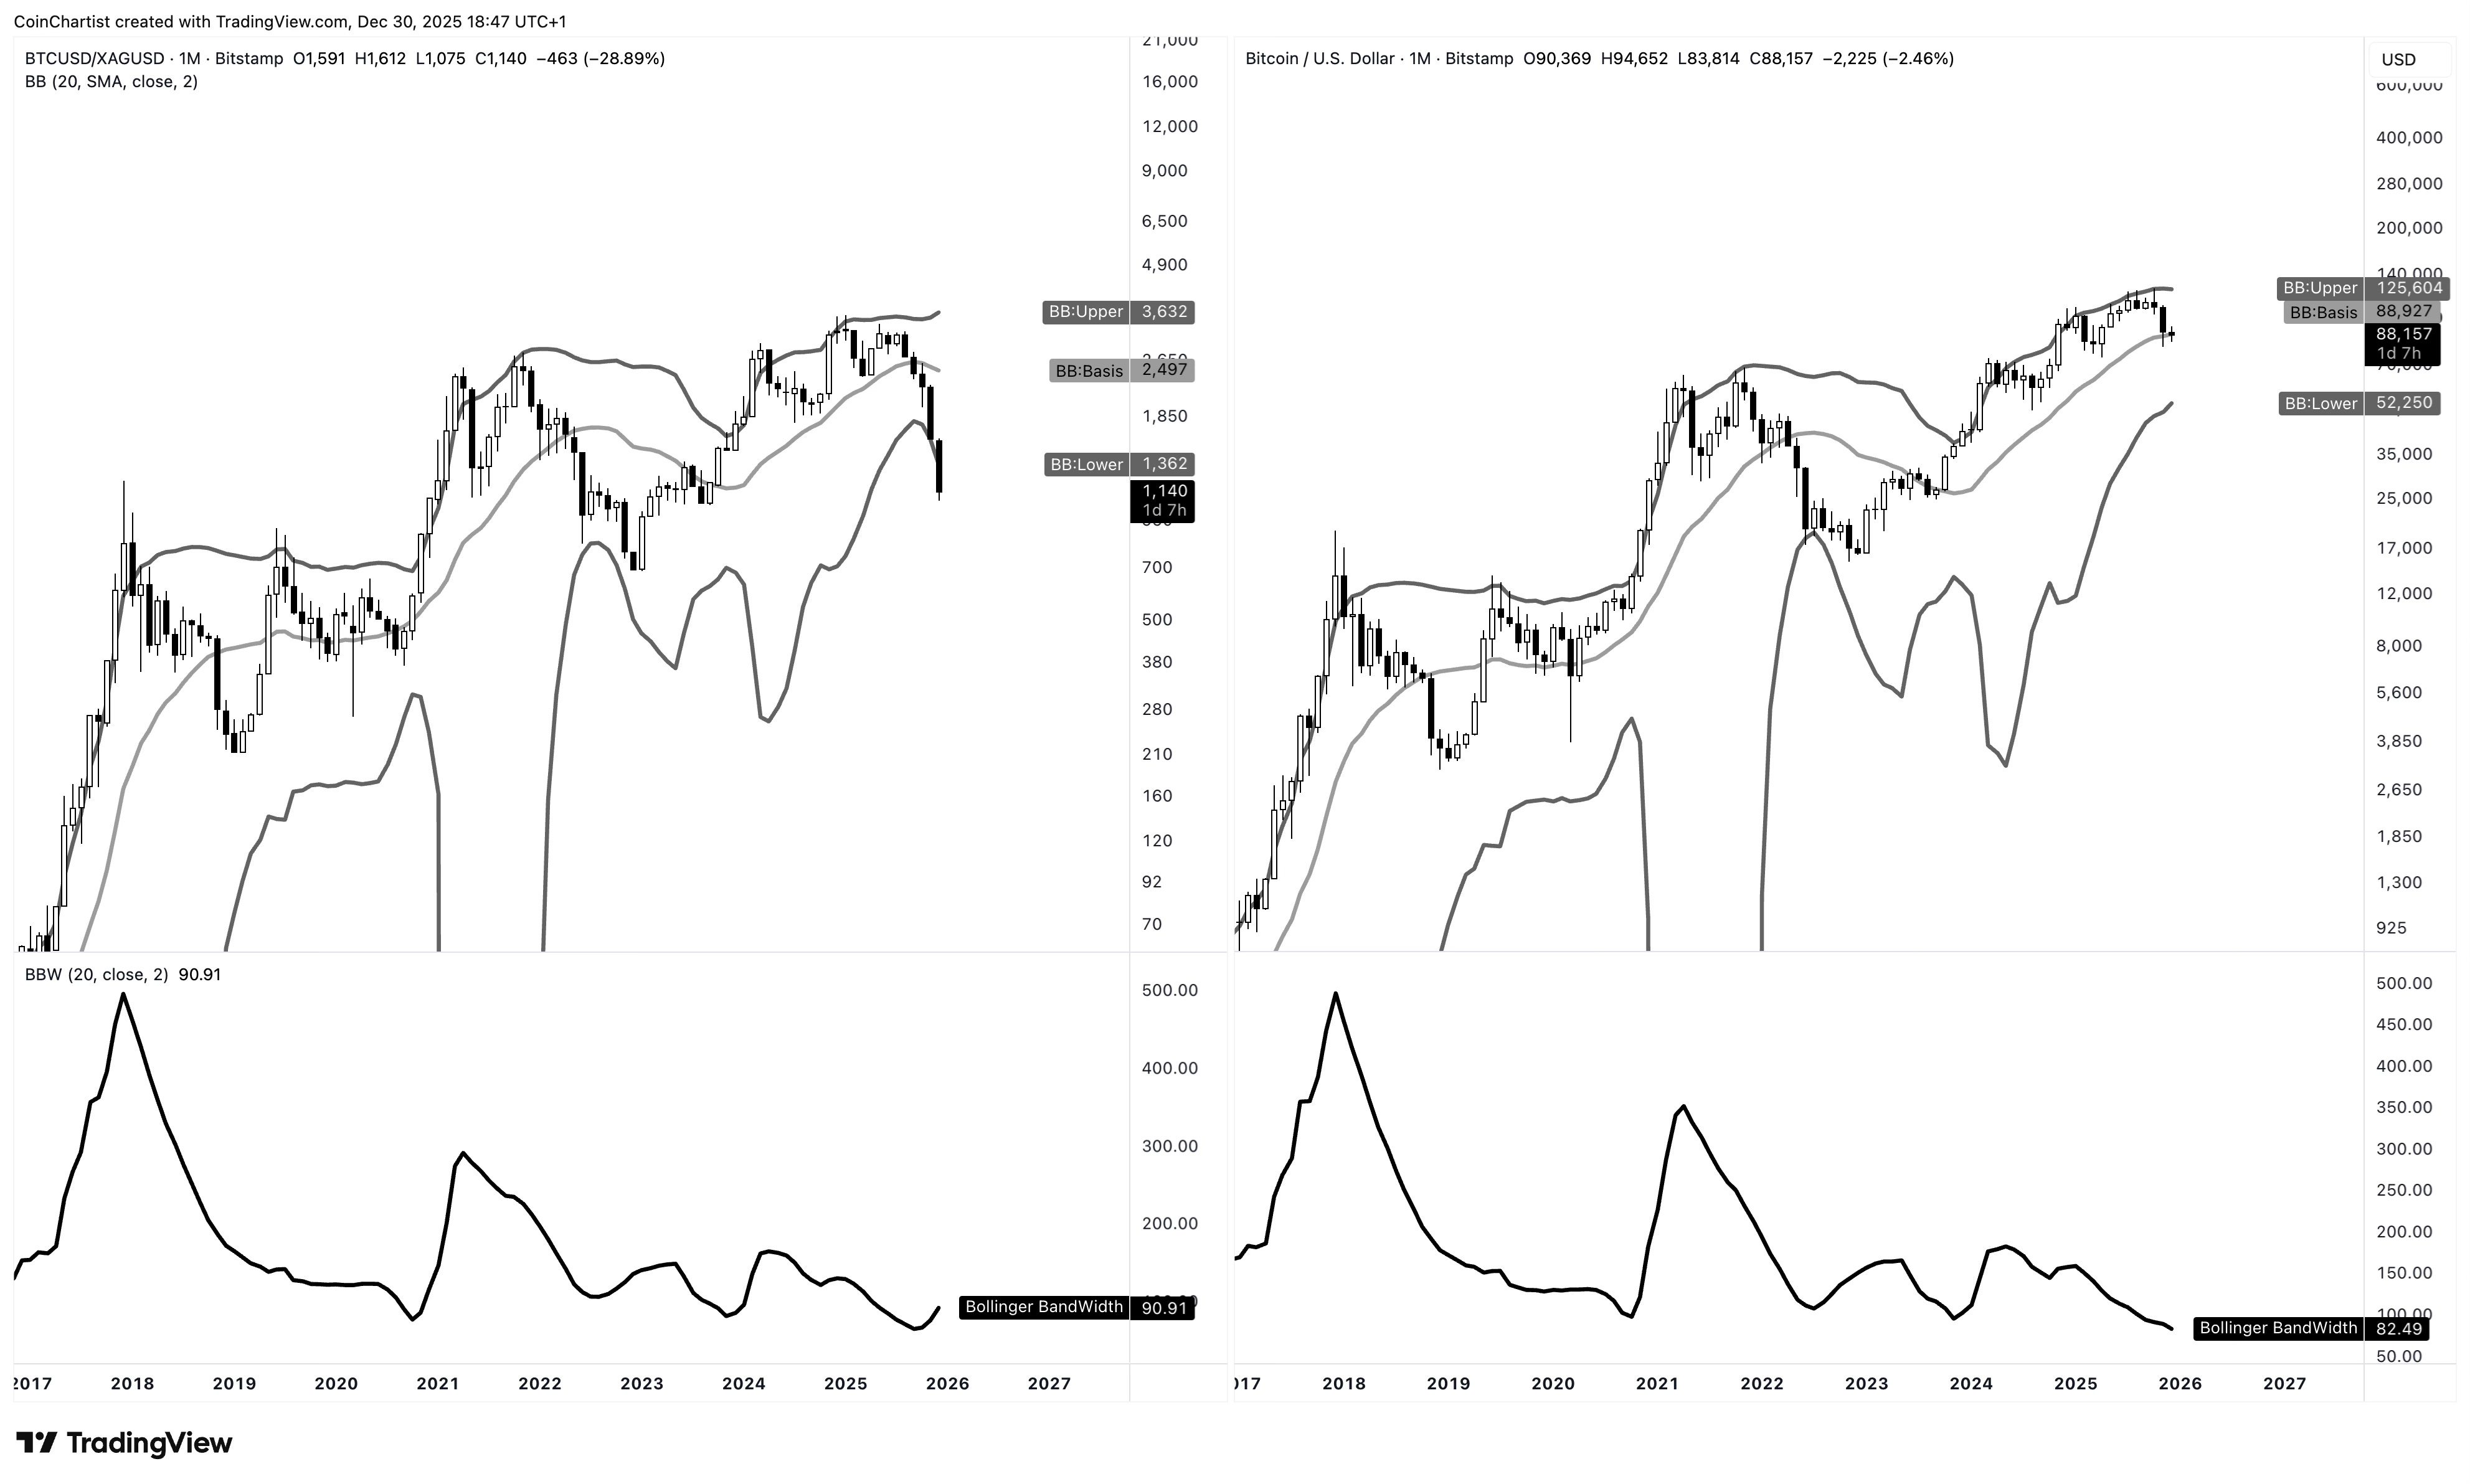
Let’s hope that the Bitcoin/Silver ratio isn’t showing us what’s going to happen to the BTCUSD chart. Both were previously at the tightest BandWidth reading ever. The BTC/XAG ratio is now expanding and is back at 2017 levels price wise. This would take Bitcoin back below $20,000 comparatively.
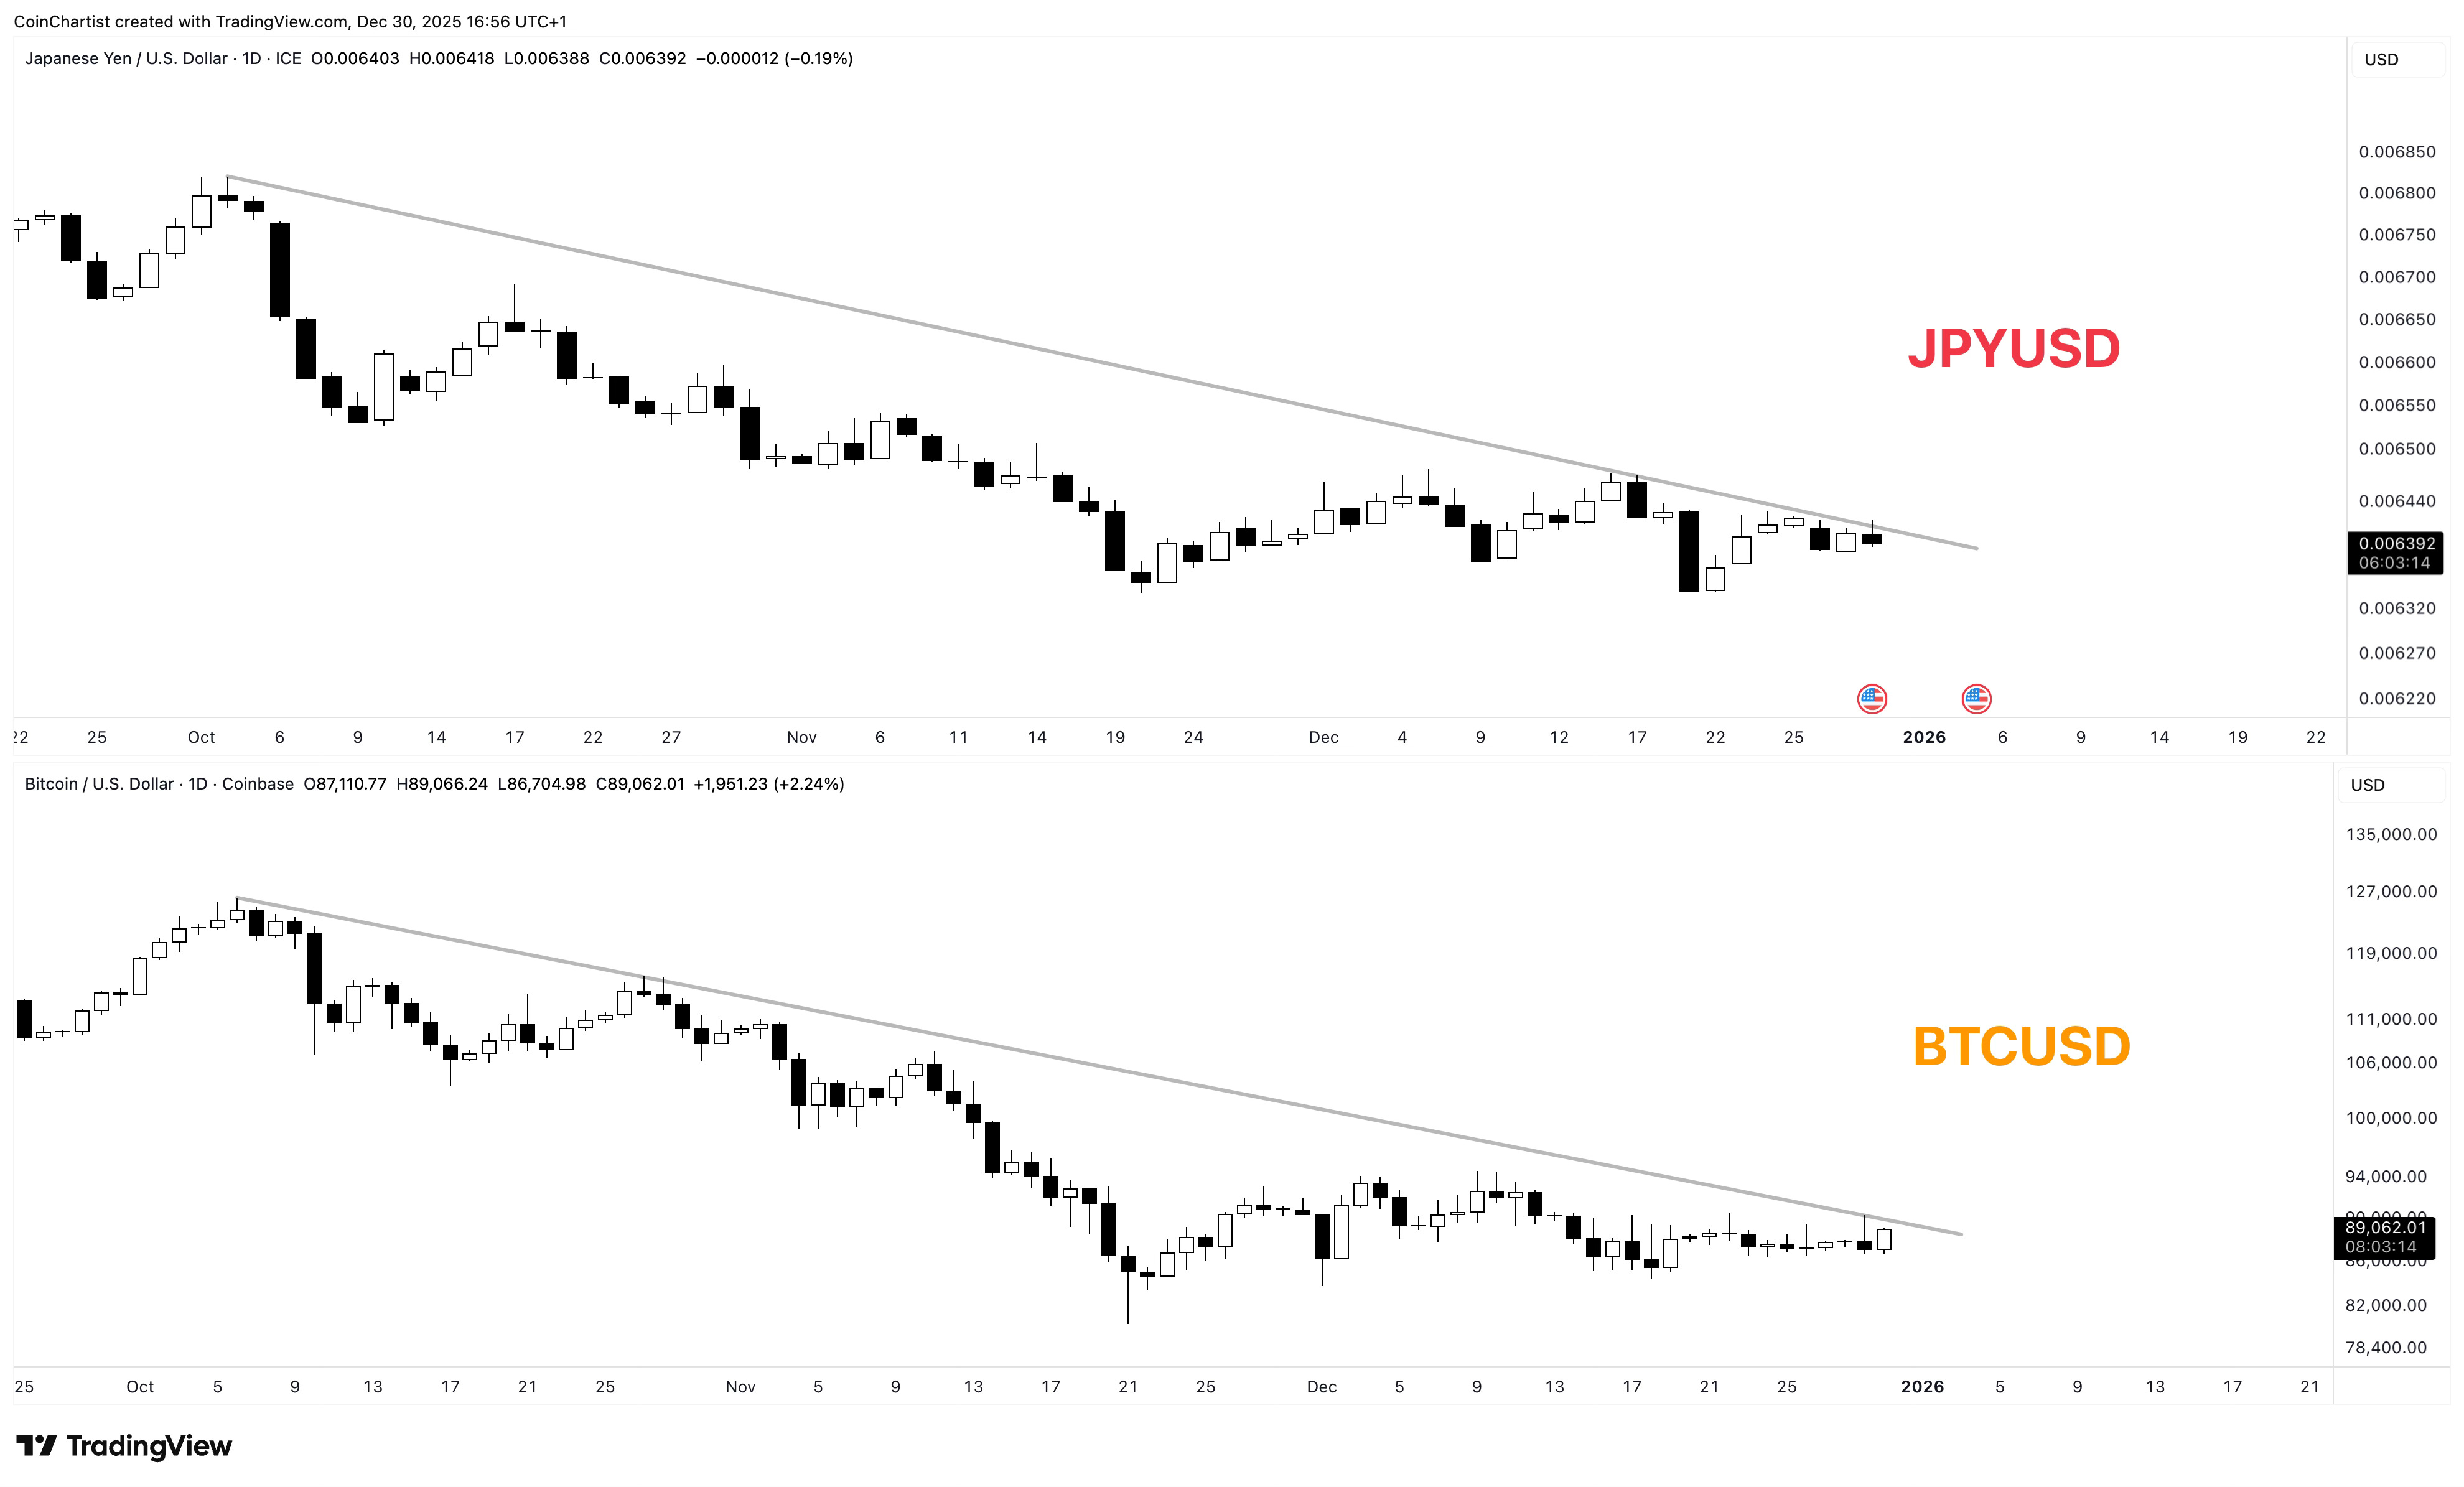
A lot of this is driven by the US dollar strengthening as the Yen carry trade unwinds. Bitcoin is following the Yen as a risk-asset trading against the dollar.
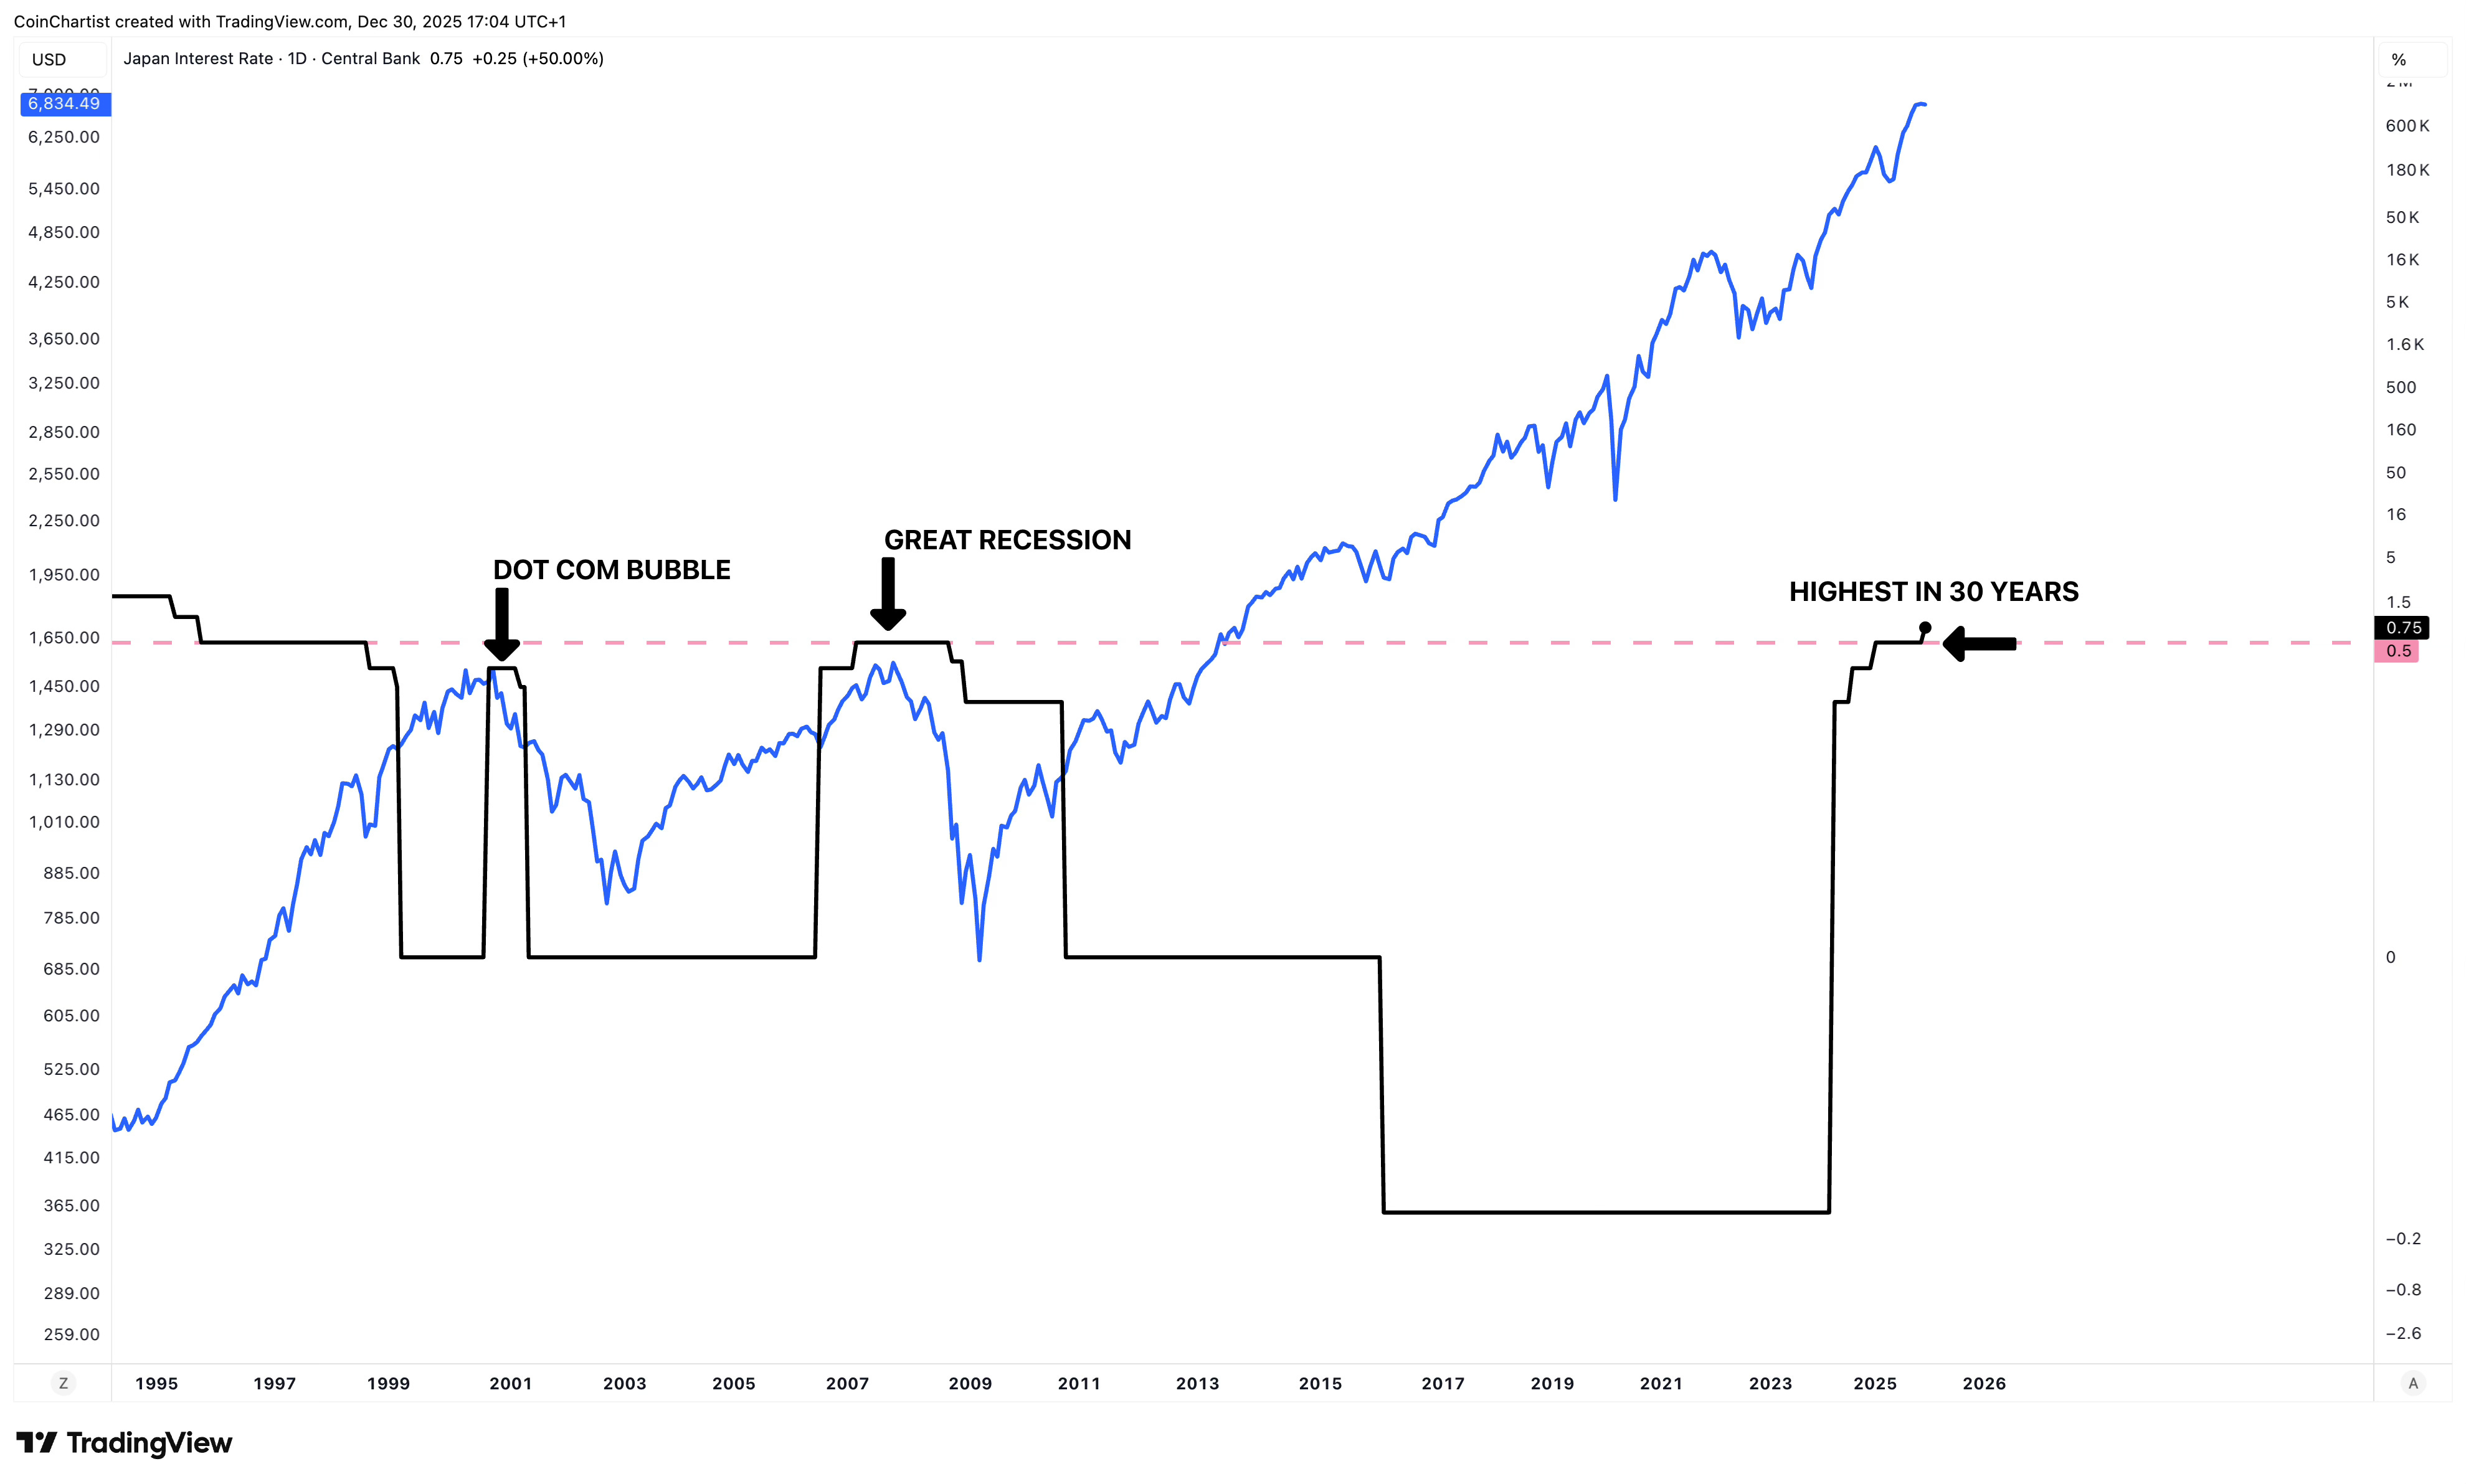
Japan raising its interest rates is a lot bigger deal than most in crypto understand. Rates are the highest in the past 30 years and a new higher high was made for the first time since the Great Recession. The level we just pushed above had in the past coincided with the dot com bubble burst, and the Great Recession. This is clearly an important level that just got flipped. More risk unwinding may occur as a result.
How Hurst Cycles Point to a Change in Trend Direction
Technicals in Bitcoin look bad. Macro supports a negative economic outlook. But what do cycles say, and how bad can things get?
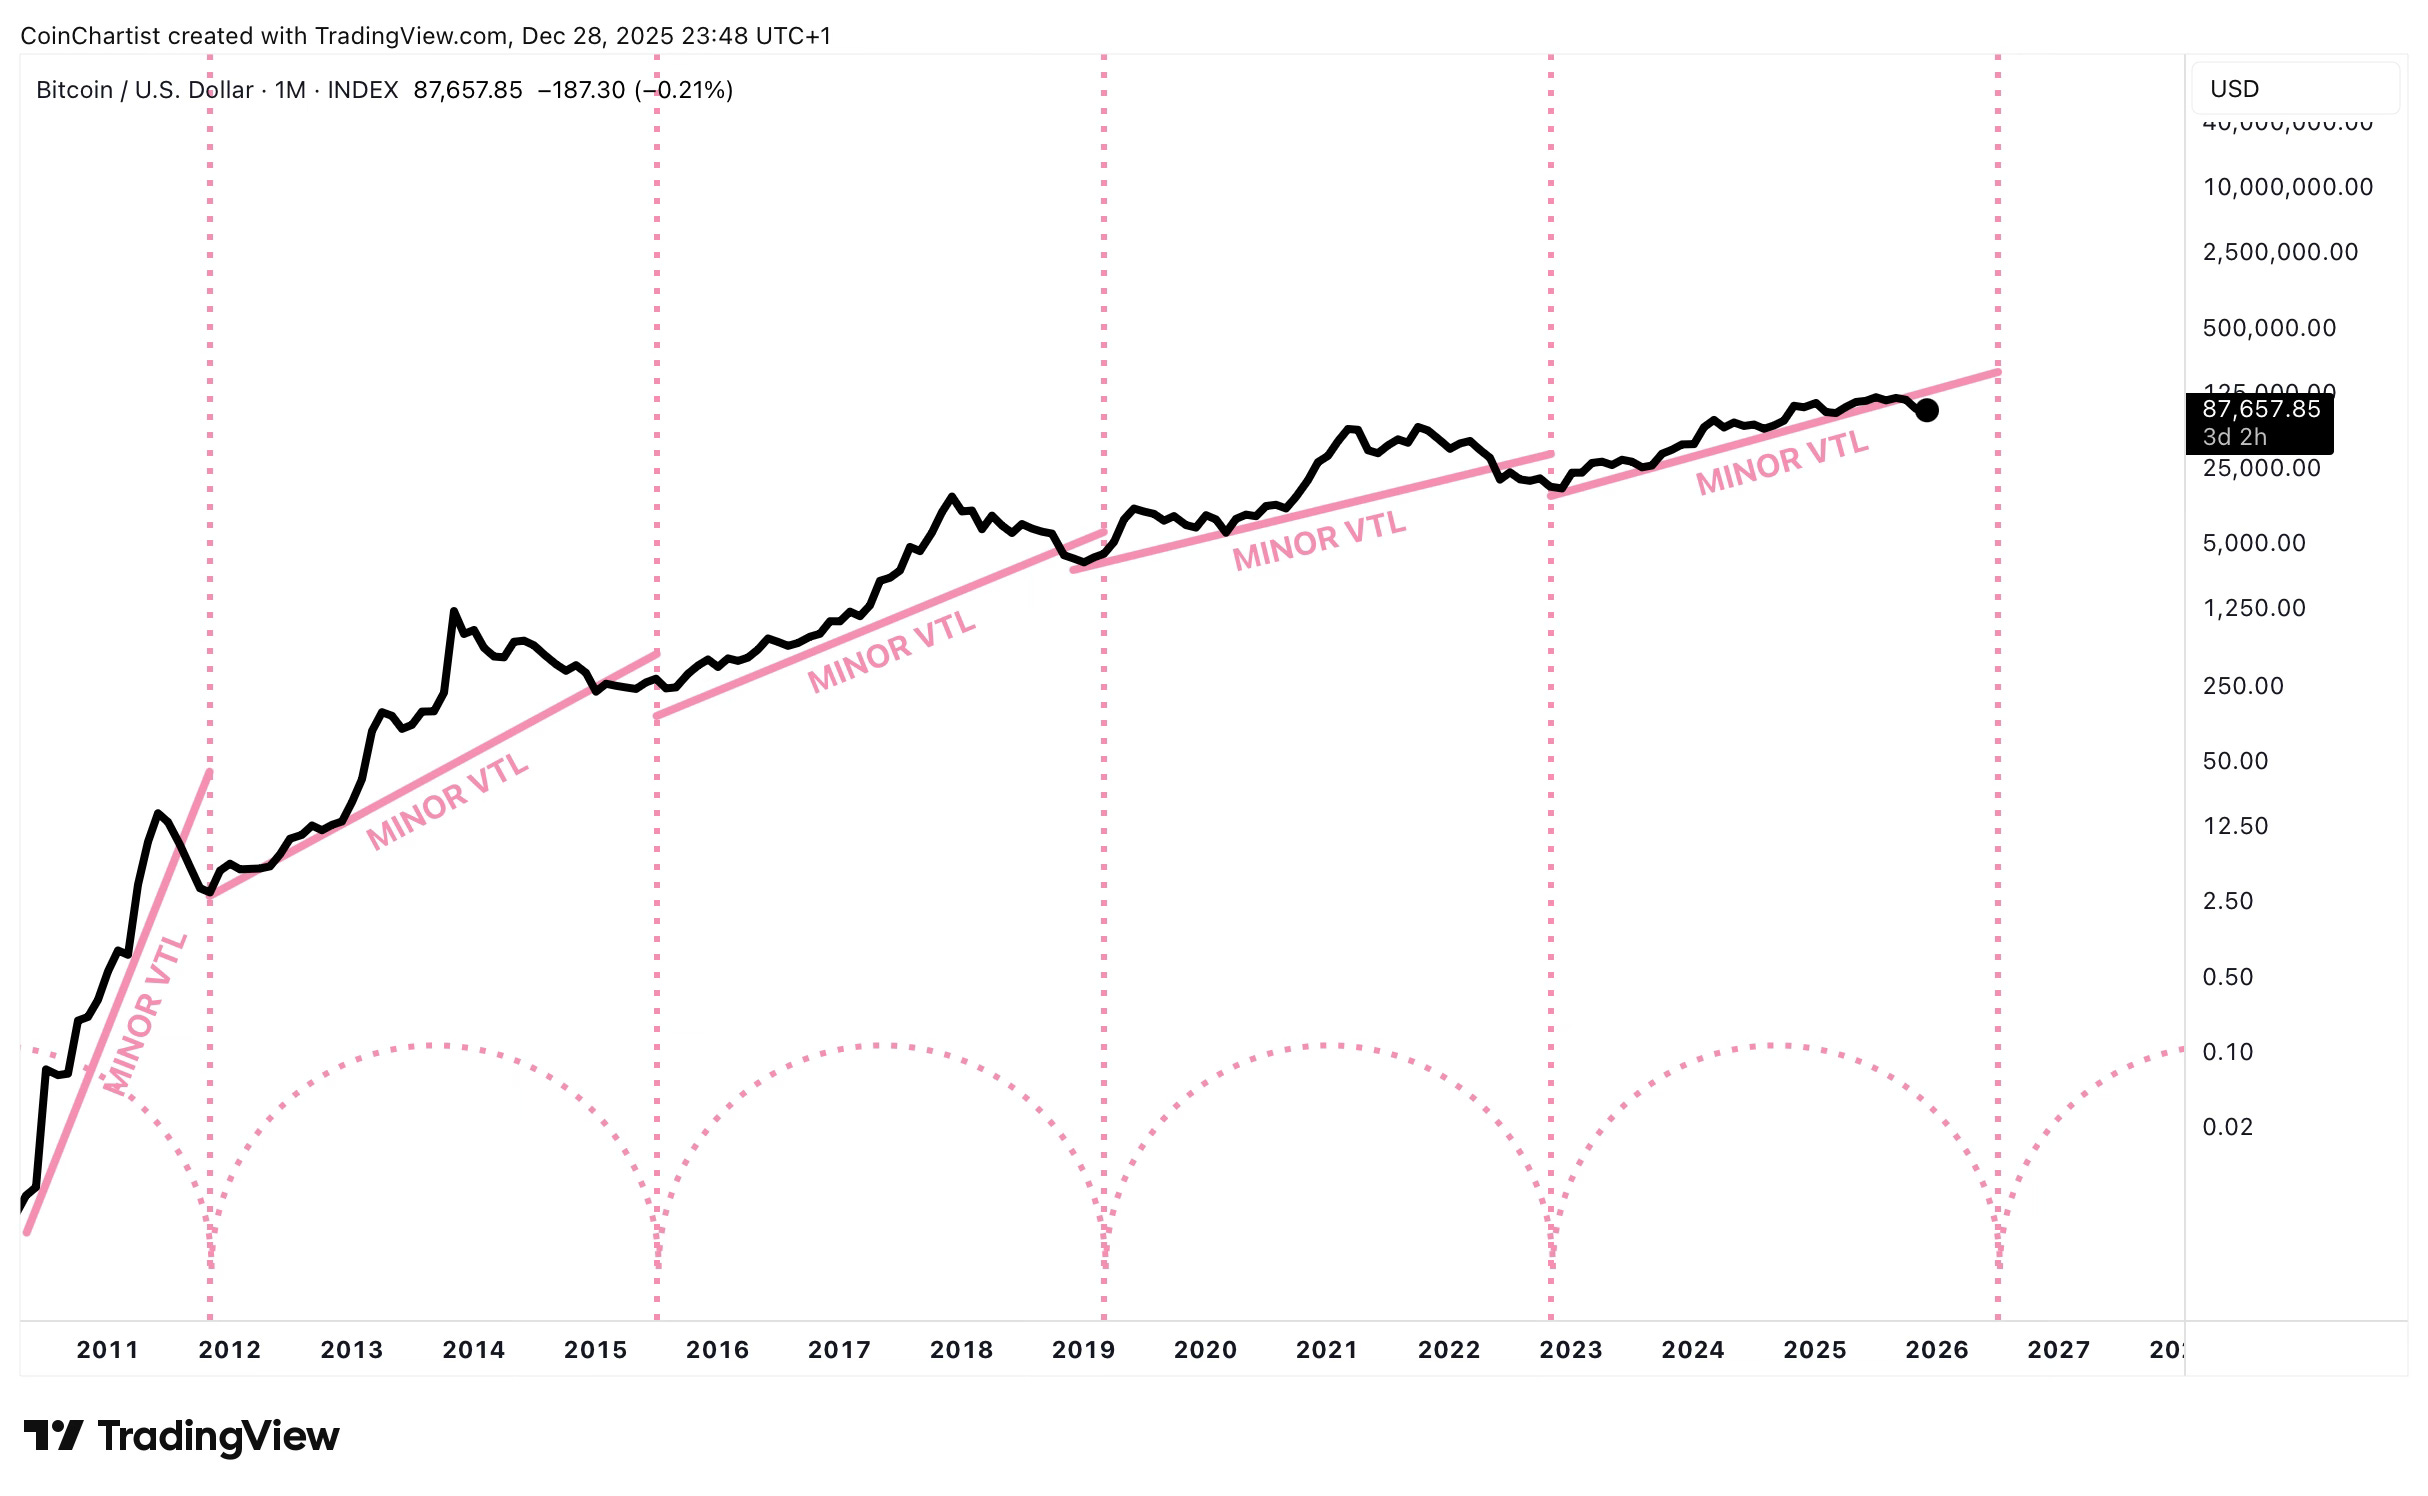
No, the four-year cycle isn’t dead. It ended on time, as it always has. Hurst Cycle Theory looks to synchronize recurring rhythmical troughs. The practice looks for a cyclical trough only when a valid trend line (VTL) breaks down. When it breaks we can begin to anticipate a low near the proximity of the semi-circles. This behavior exists on the chart today and has all along. The valid trend line was lost and we can start to anticipate a bottom.
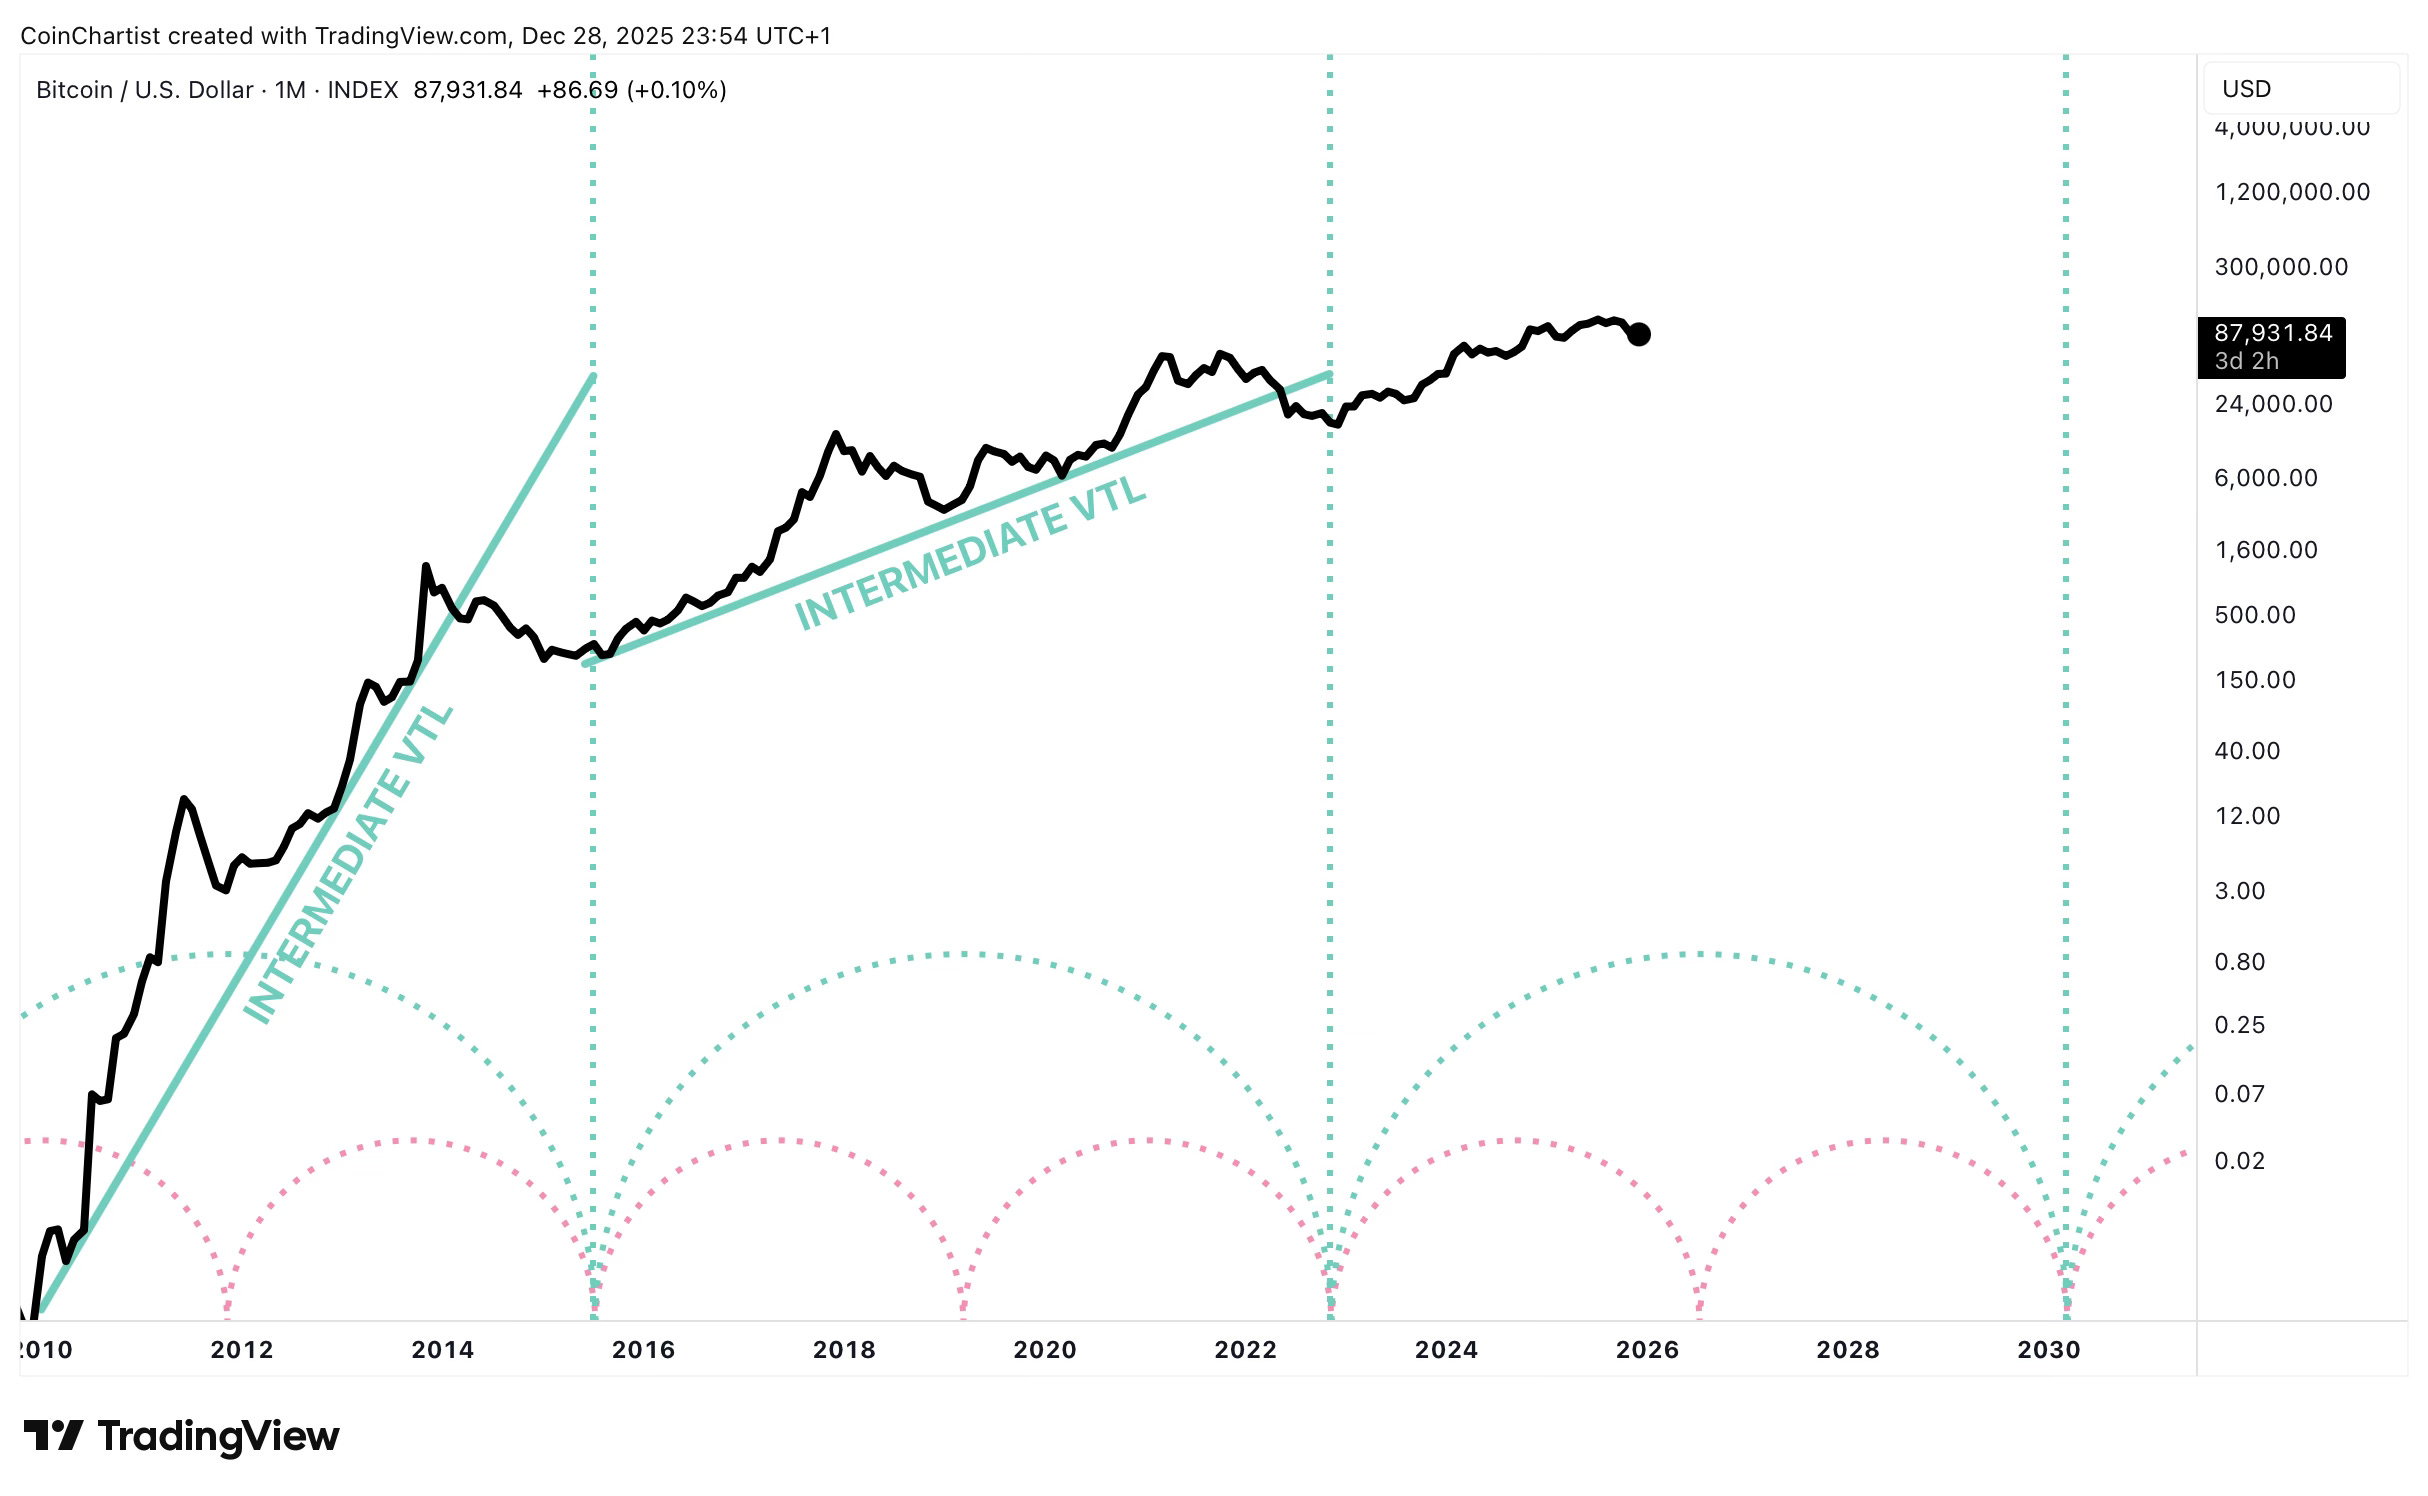
Four-year cycles aren’t the only thing driving Bitcoin. There’s an eight-year cycle as well. When these VTLs broke down, it resulted in exchange insolvencies (Mt.Gox, FTX). Other four-year cyclical bottoms didn’t have the same impact.
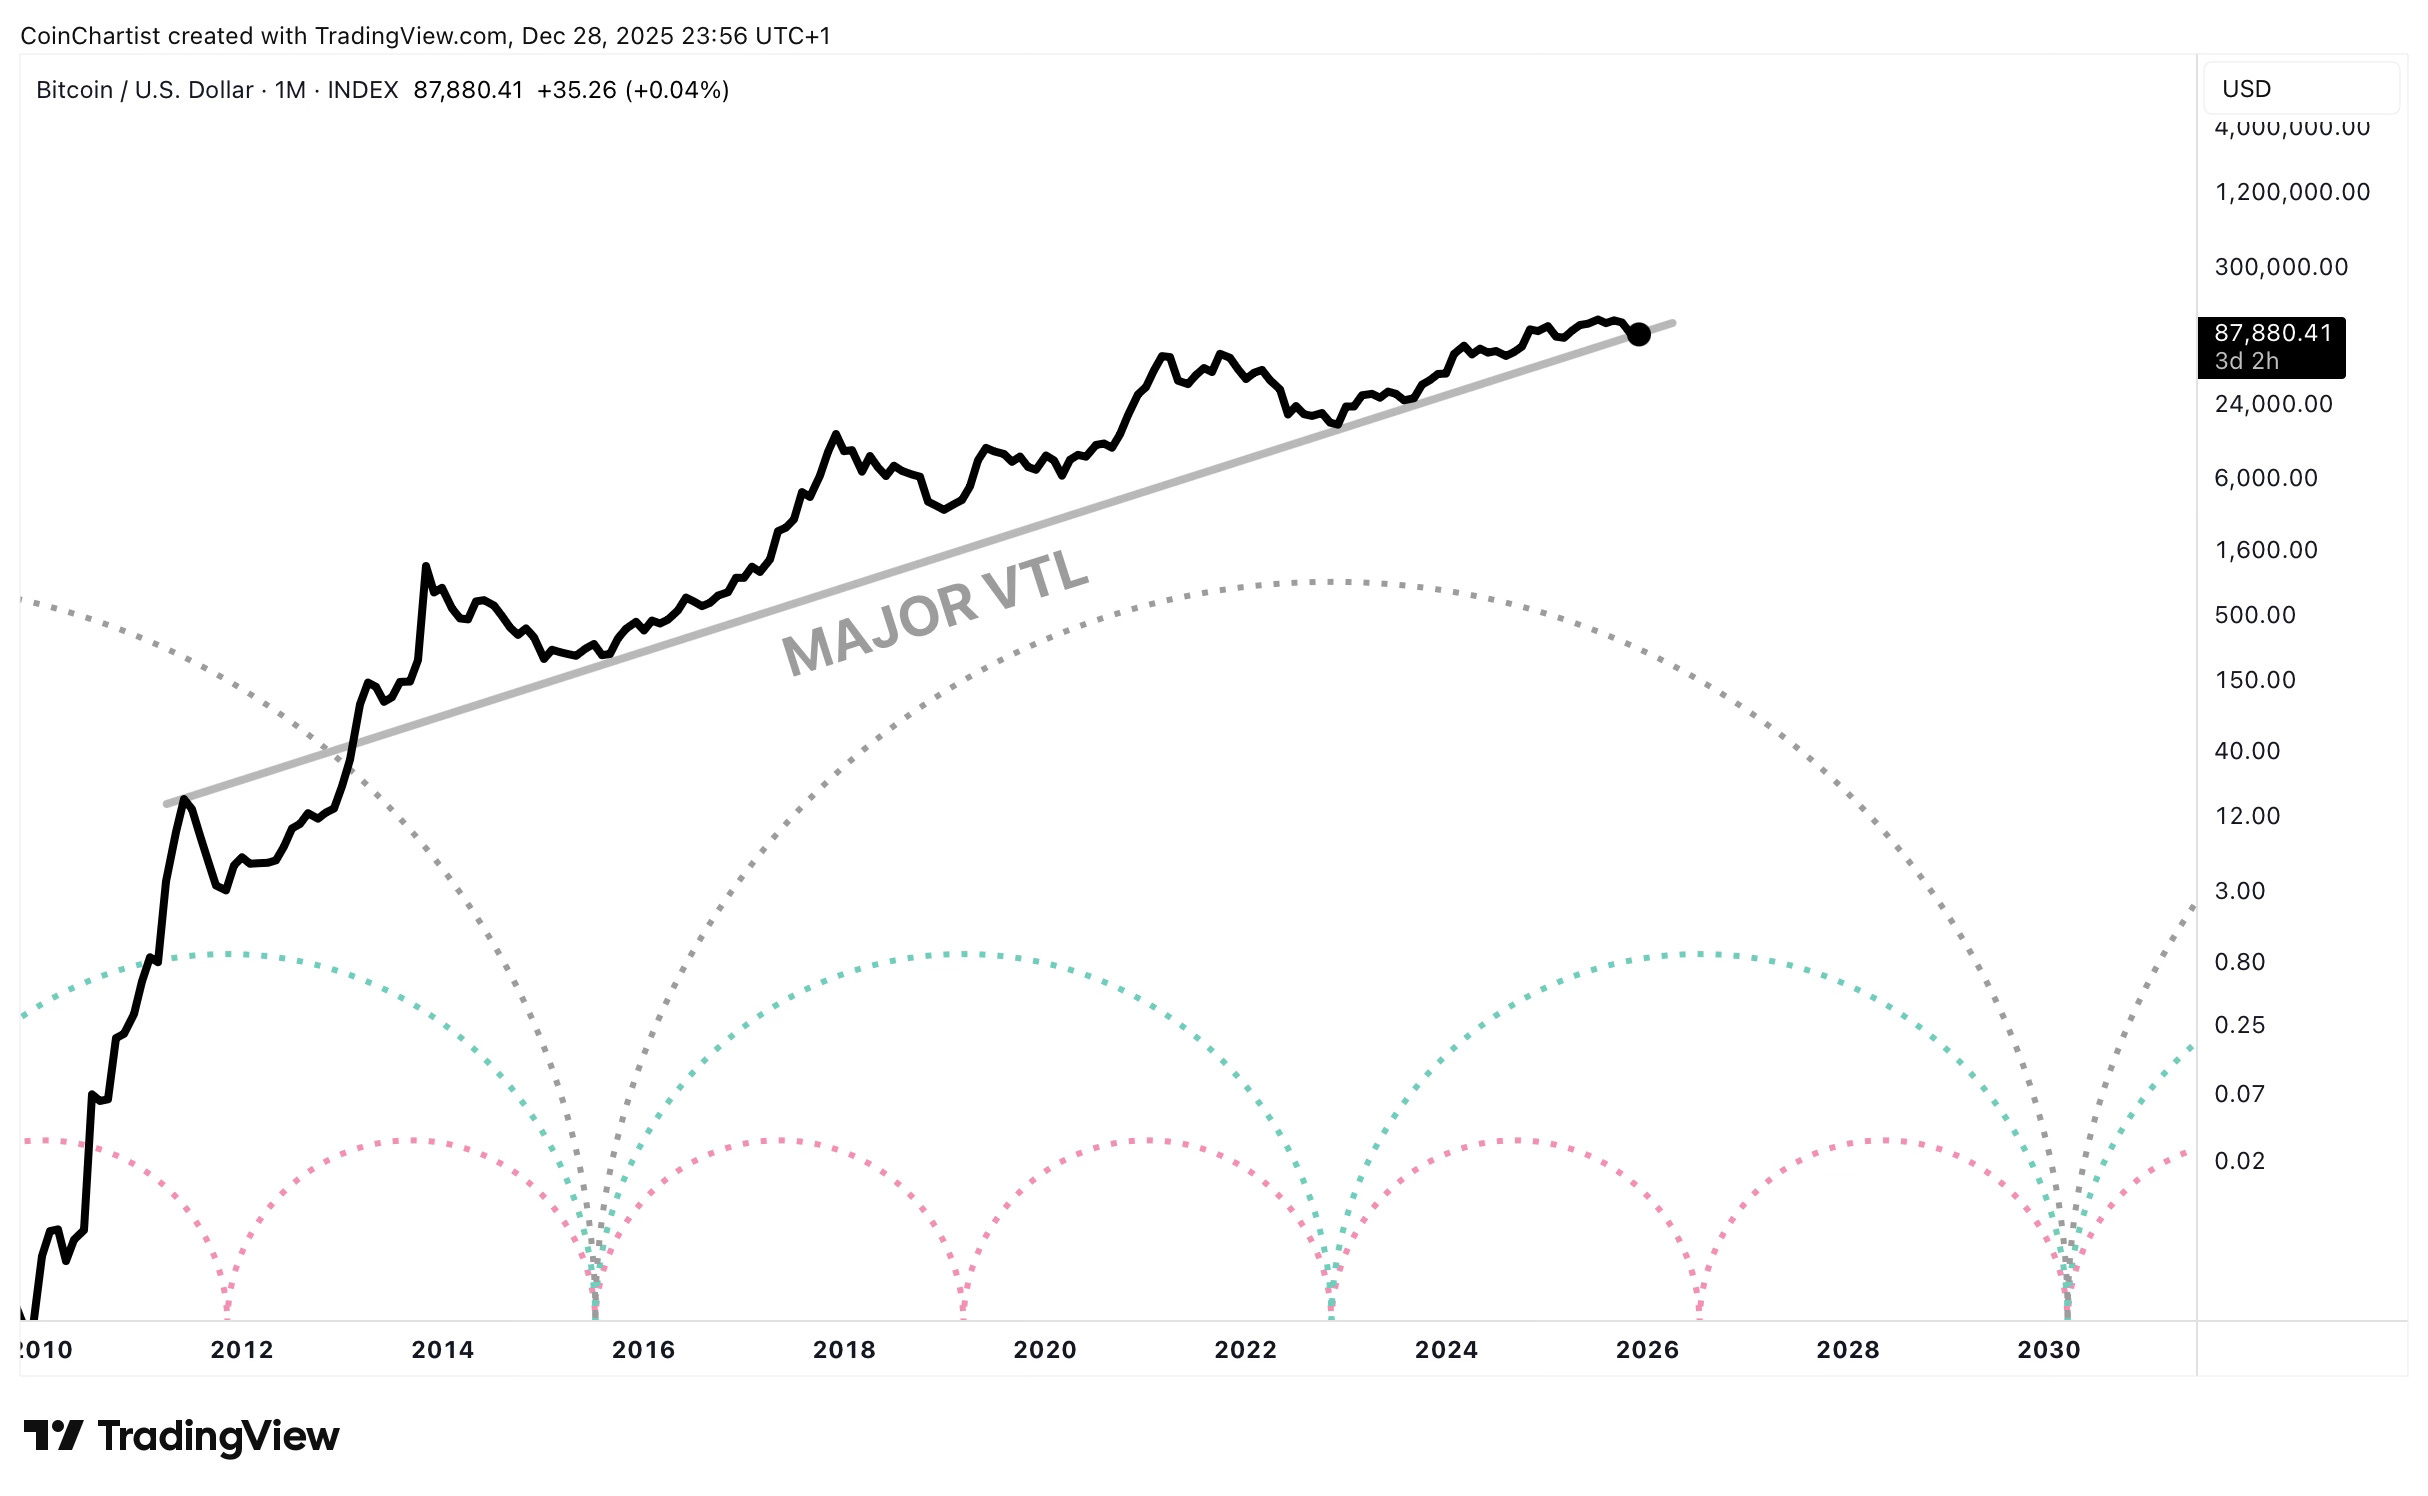
Within each larger cycle are smaller intra-cycles. Inside a 16-year cycle, we could have two eight year cycles and four four-year cycles. Bitcoin might be losing its longest-standing VTL yet. Meaning we could see the worst bear market yet. If you notice, there’s at least one more four-year cycle left before the 16-year concludes. That would imply the next Bitcoin cycle produces the first ever lower high, resulting in even more lost confidence. The next four-year trough after that would coincide with the end of the 16-year and another eight-year cycle. Synchronicity suggests that because so many cycles are coming to an end, the weight of them all summed up can lead to a very ugly situation.
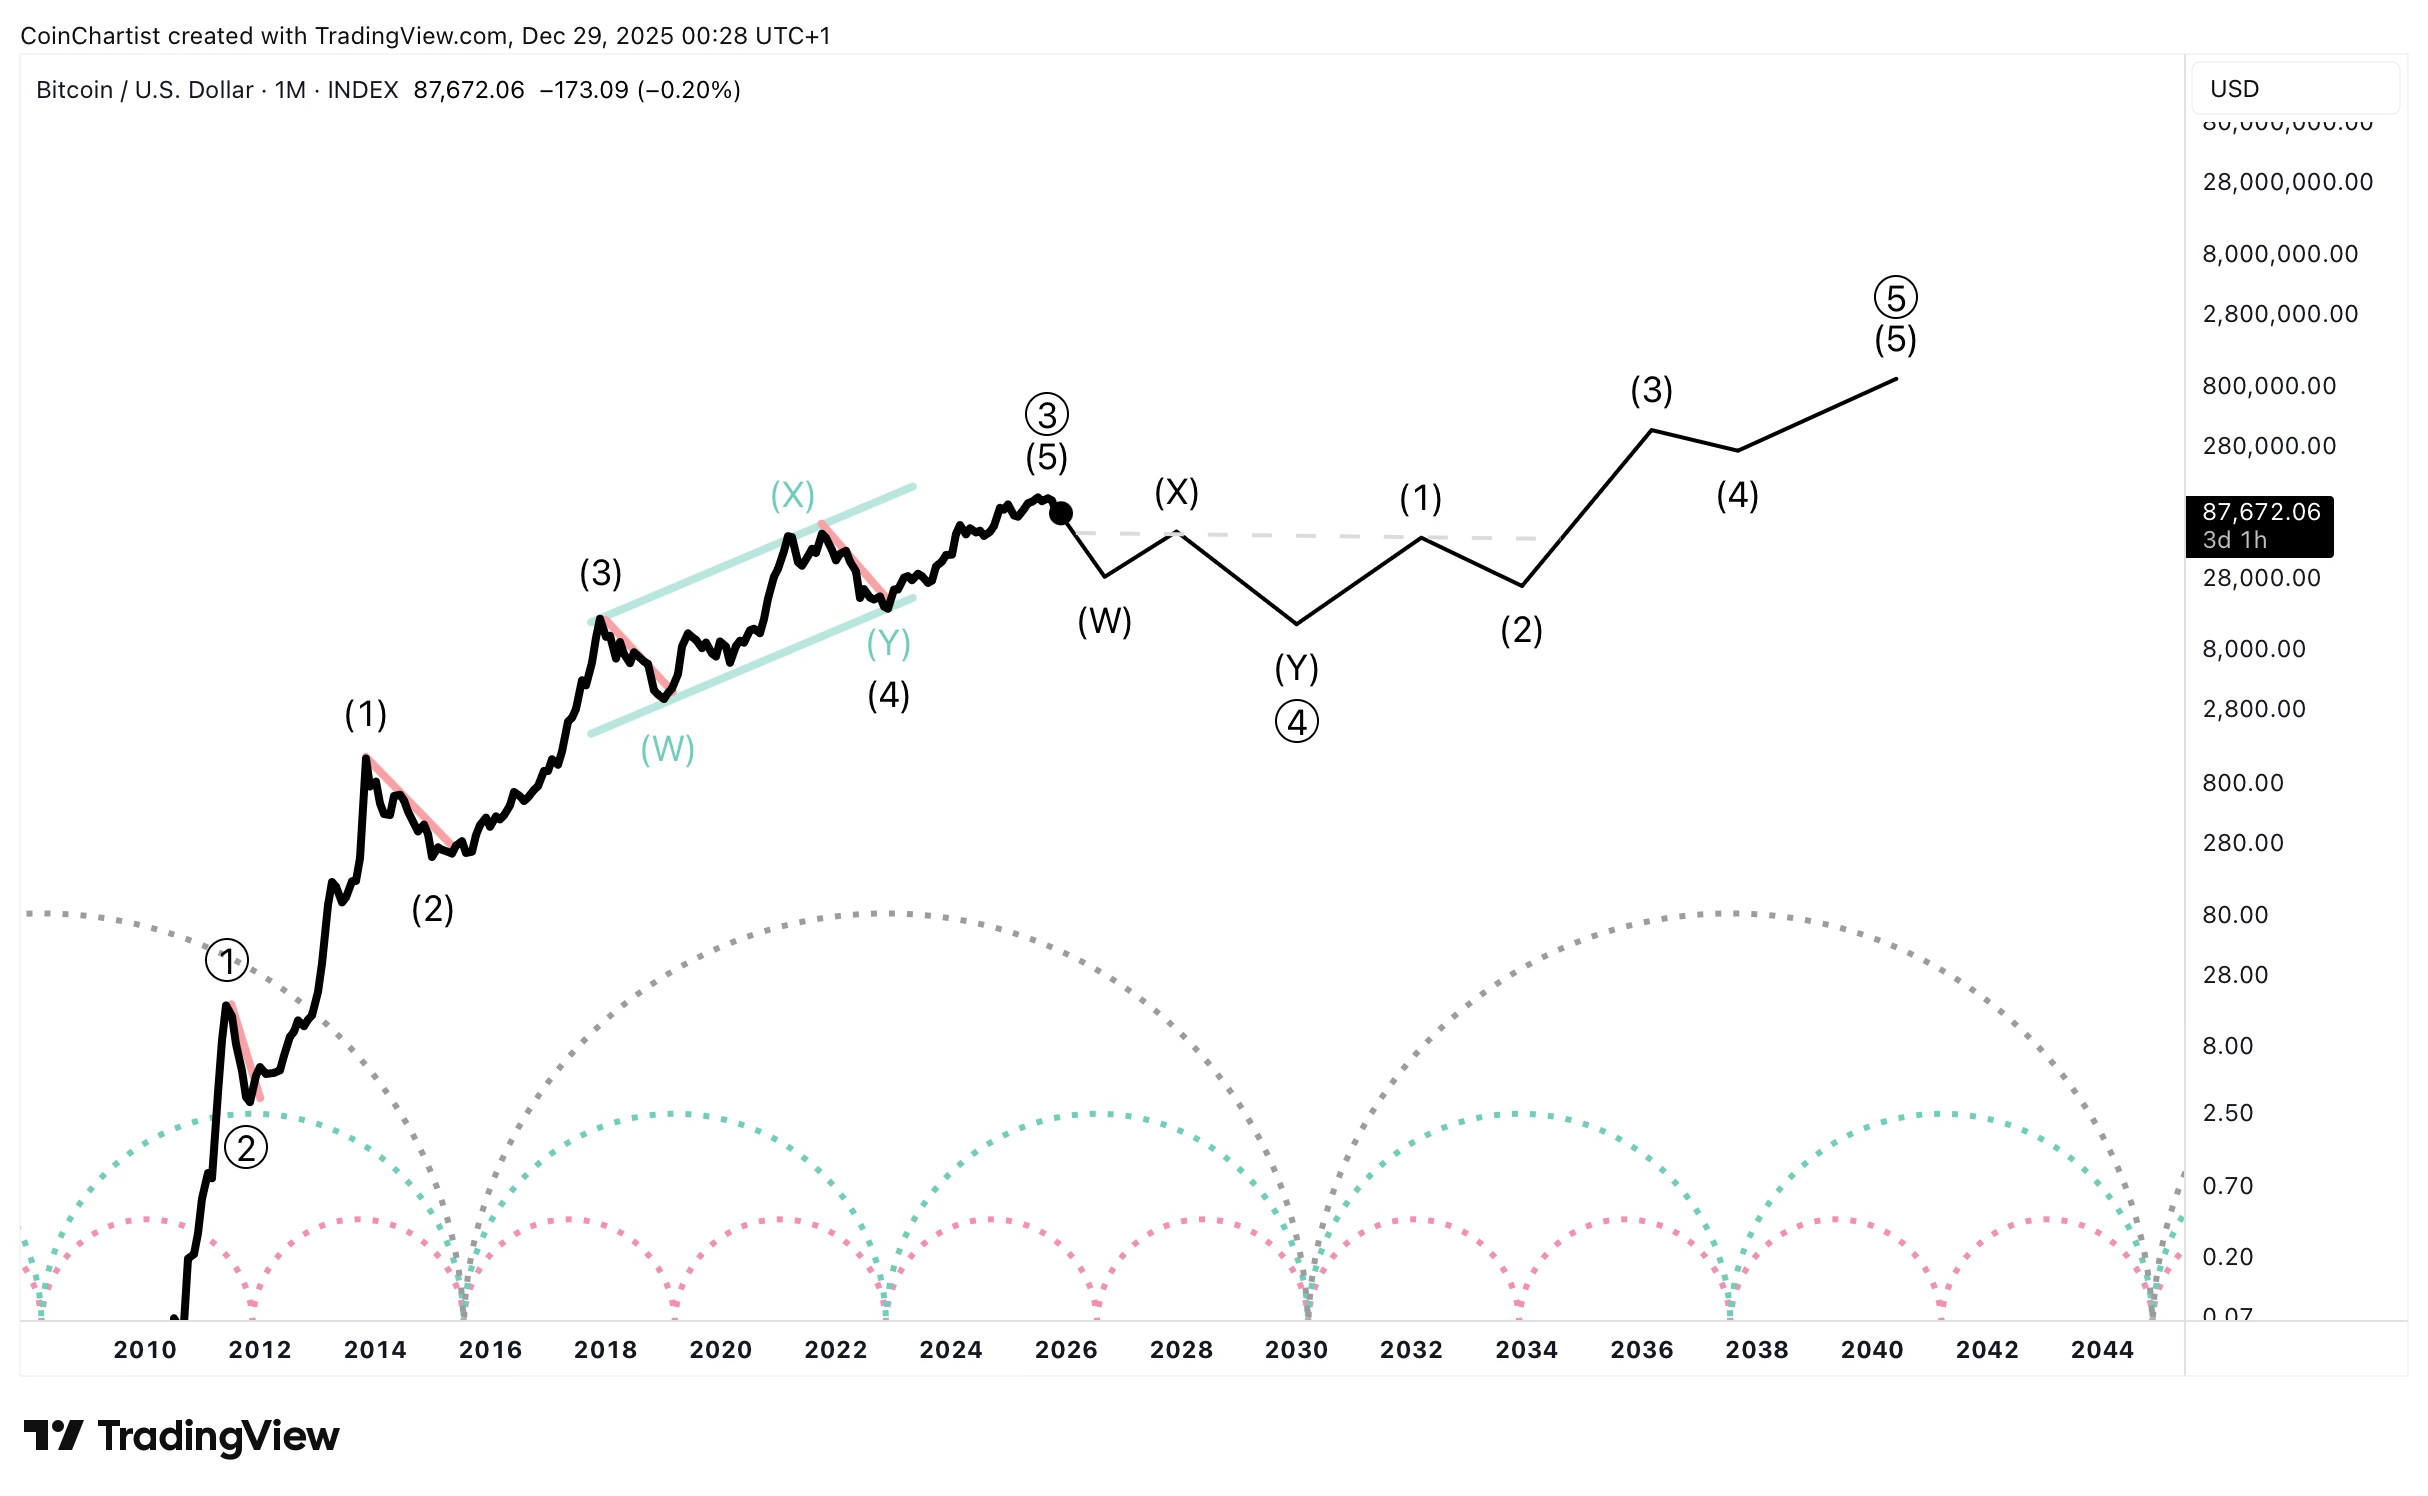
The most destructive cyclical troughs often produce the most growth thereafter. As long as Bitcoin isn’t broken by quantum computing, it should recover just fine and keep on trending towards $1M per coin. It is just becoming an adult, rather than a teen, and it is going to go through some changes first.
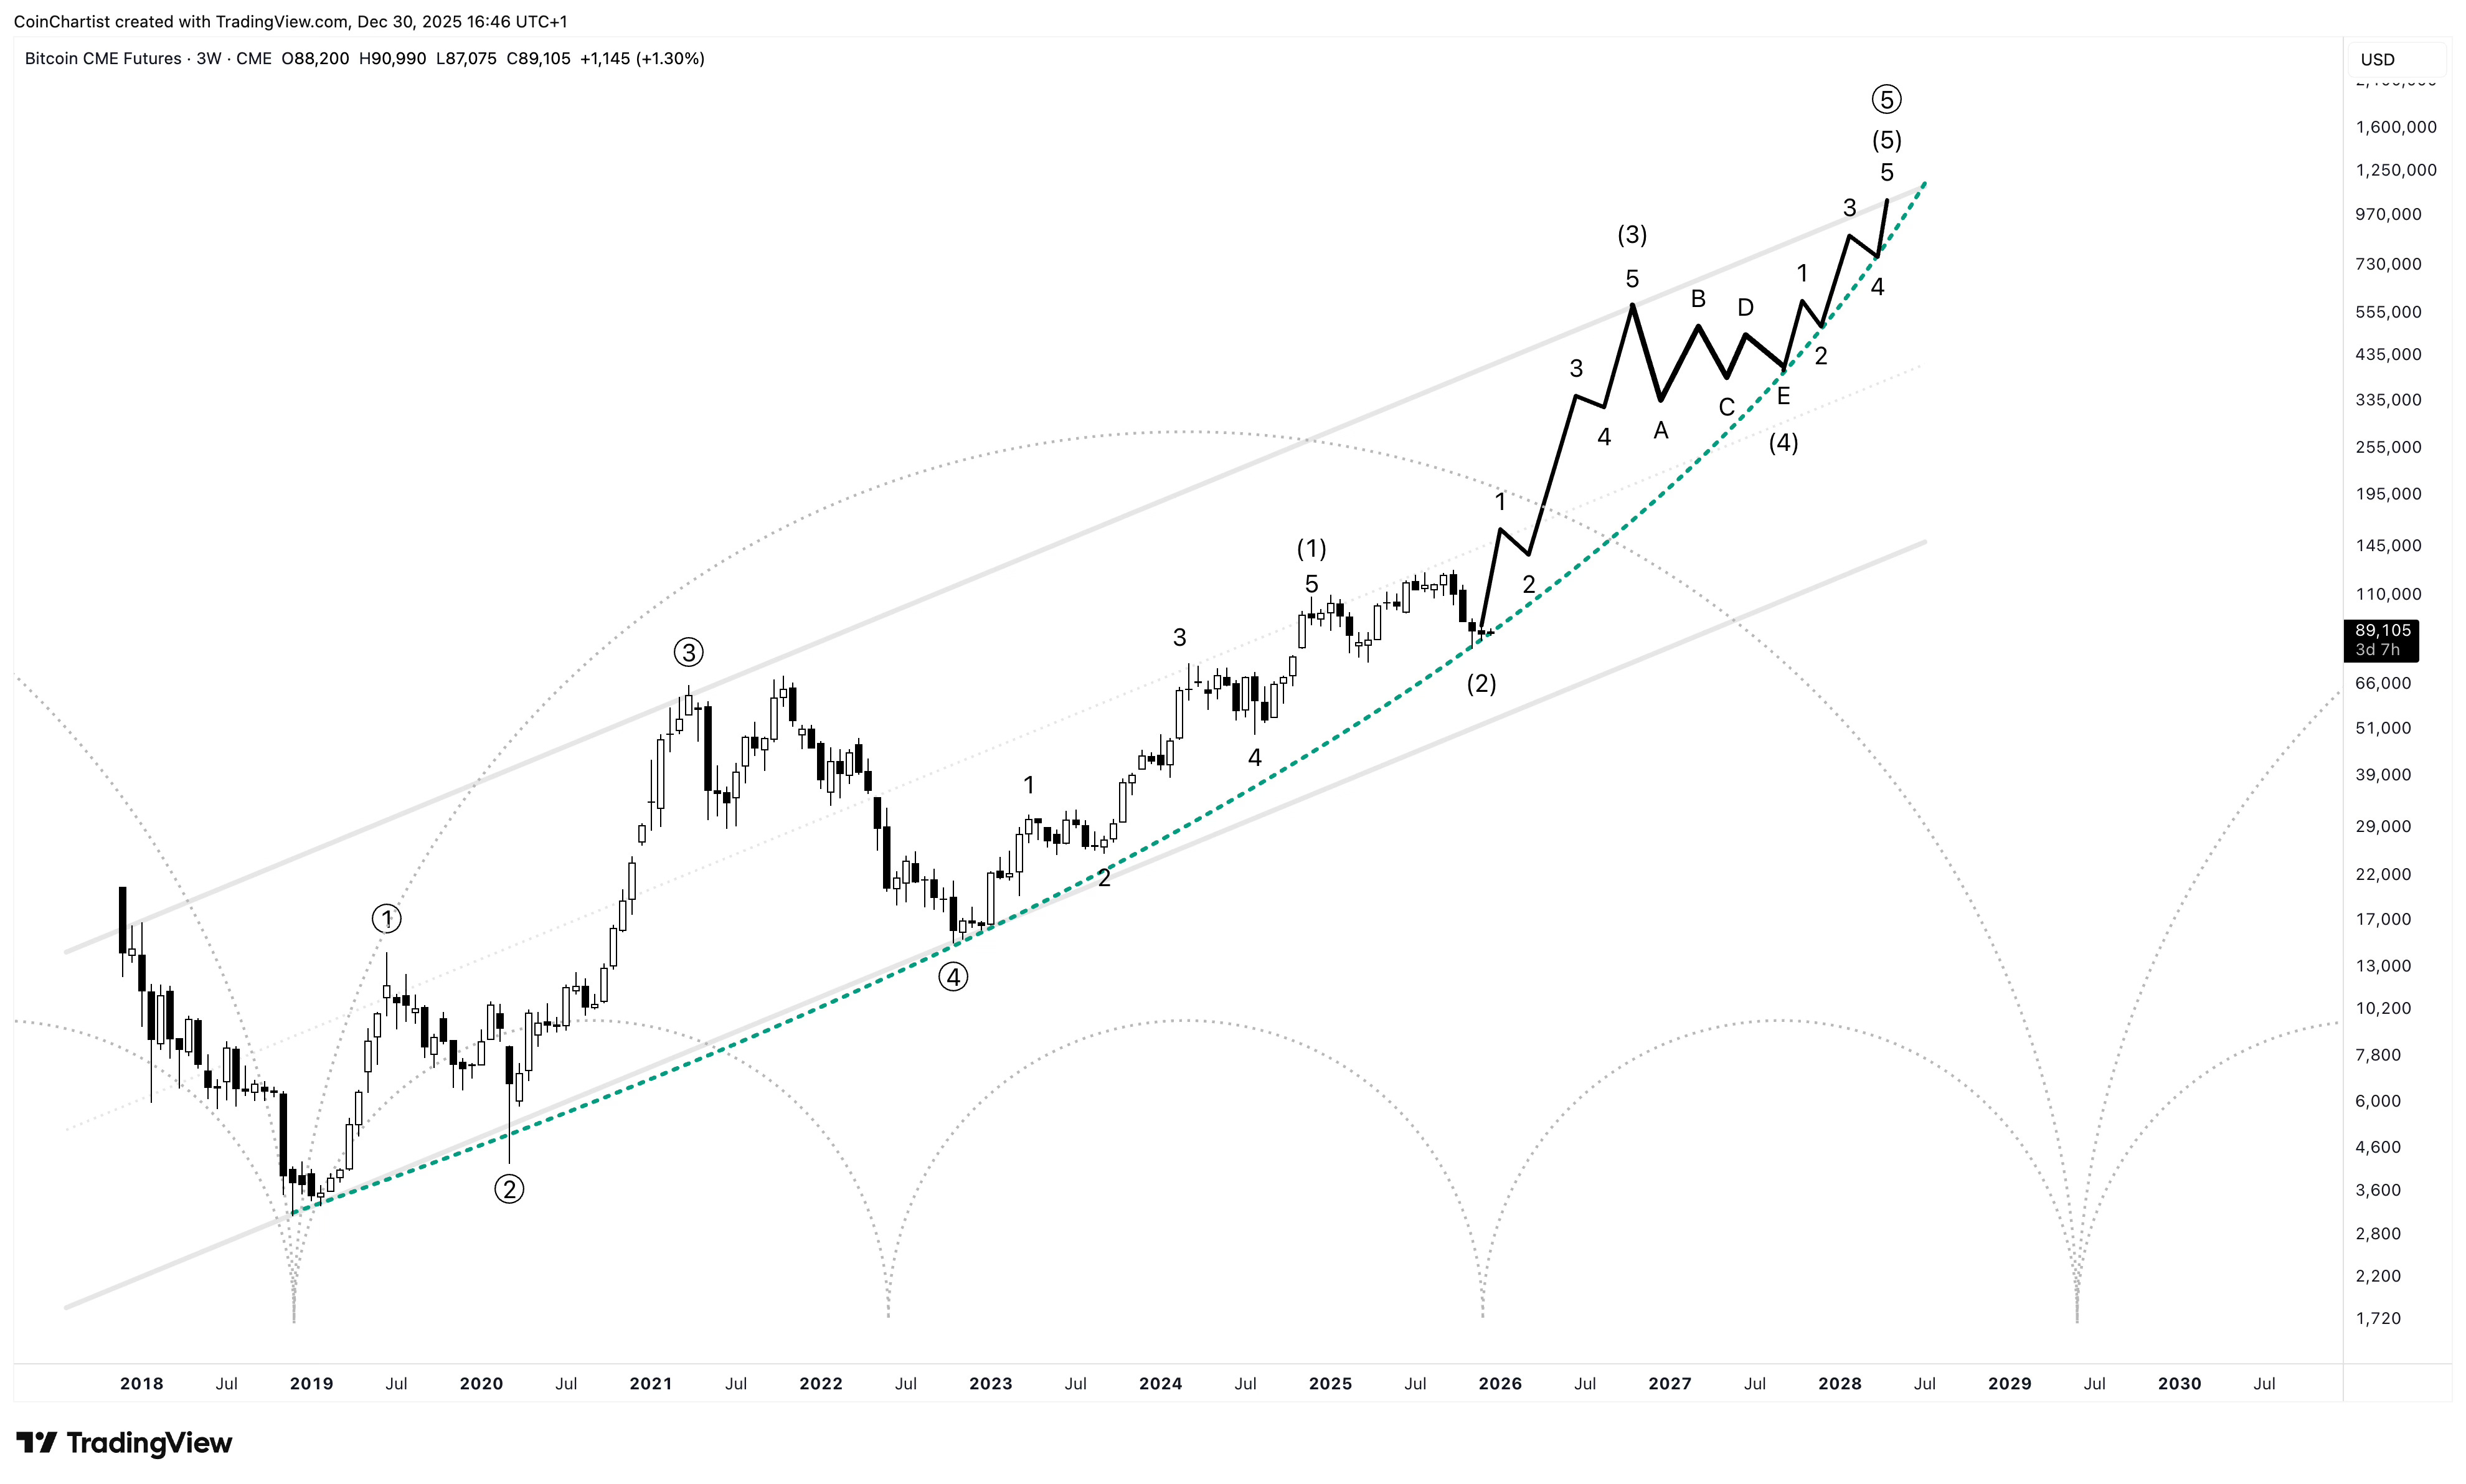
Of course, I want to look at all sides of things and the only other alternative I could find for Bitcoin cyclically, is the BTC CME chart. Real parabola would need to start building from current levels and push to the top of the channel. The only way I see this happening is if the Federal Reserve turns on the money printer and resumes Quantitative Easing. Otherwise macro and technicals don’t really support such an outcome.
Avoid Altcoins at all Costs Until the Storm has Ended
Ending Bitcoin analysis on Elliott Wave counts is fitting, because that’s where we should start next for altcoins.
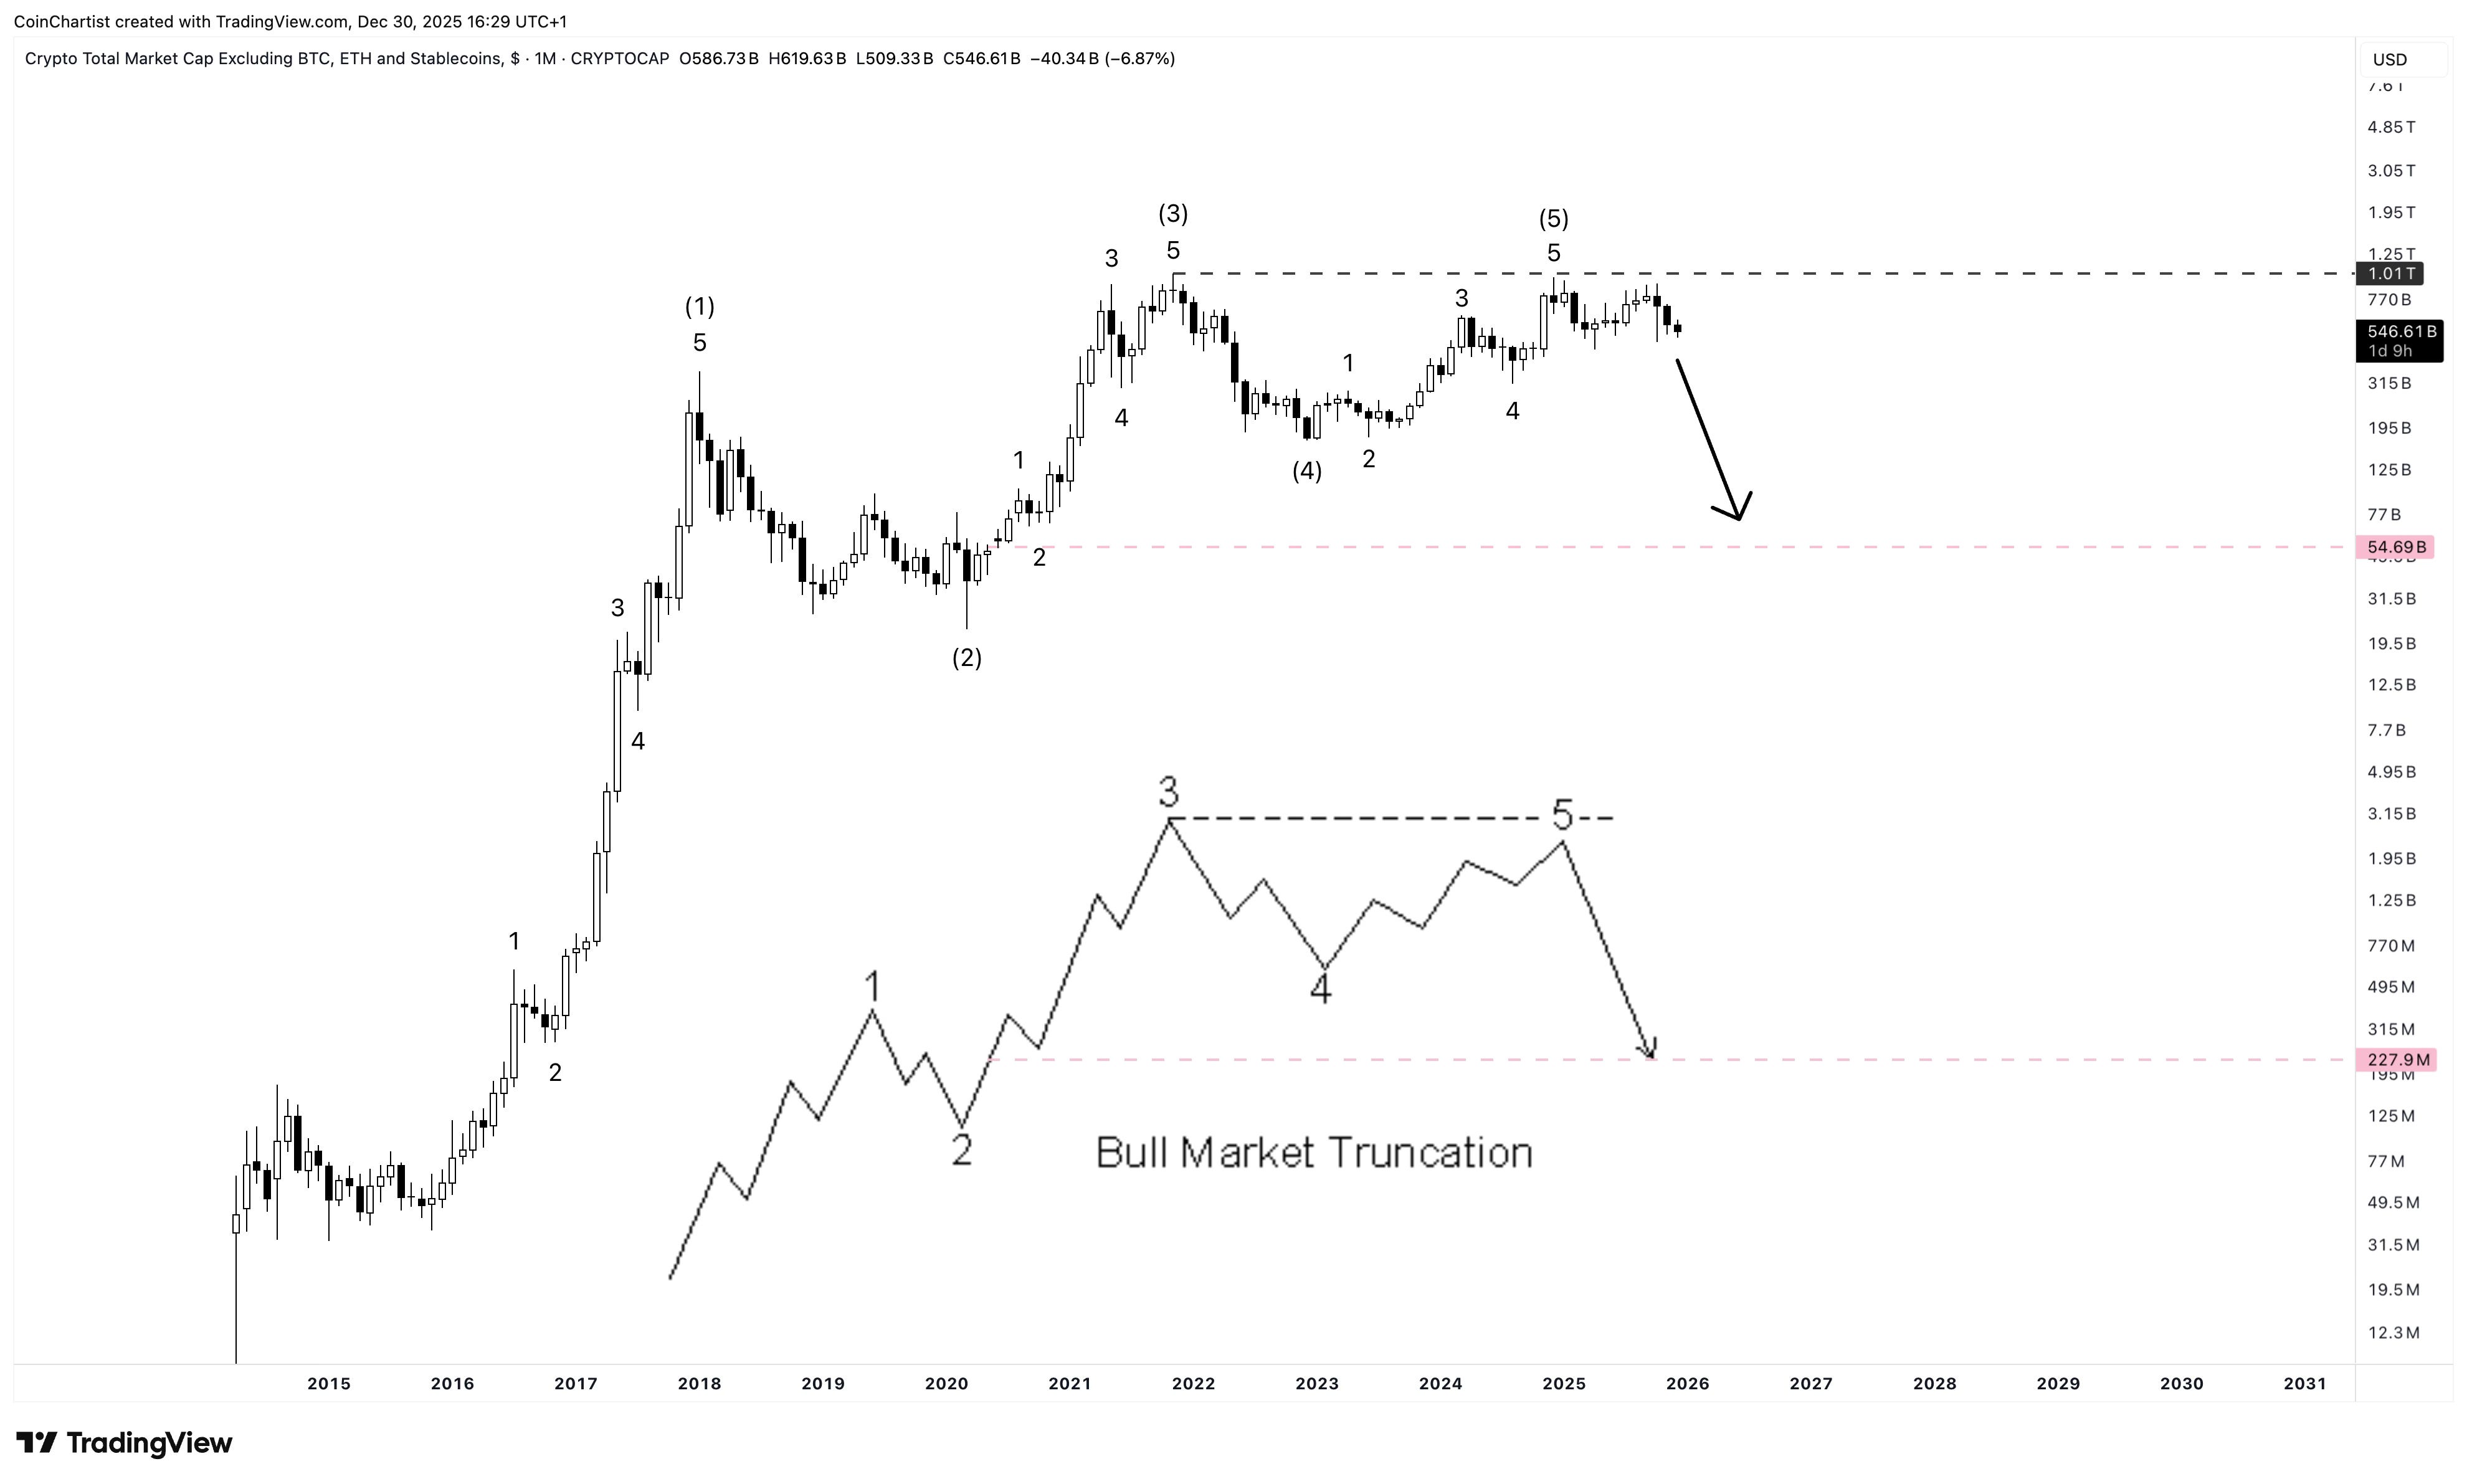
What you see here is TOTAL3ES representing all altcoins while excluding stablecoins. Altcoins as an index, never made a higher high over the 2021 peak. The latest bull market still shows a five-wave structure, hinting at “bull market truncation” in the larger degree wave 5 placement. When this happens, the asset or index often plummets in the other direction violently
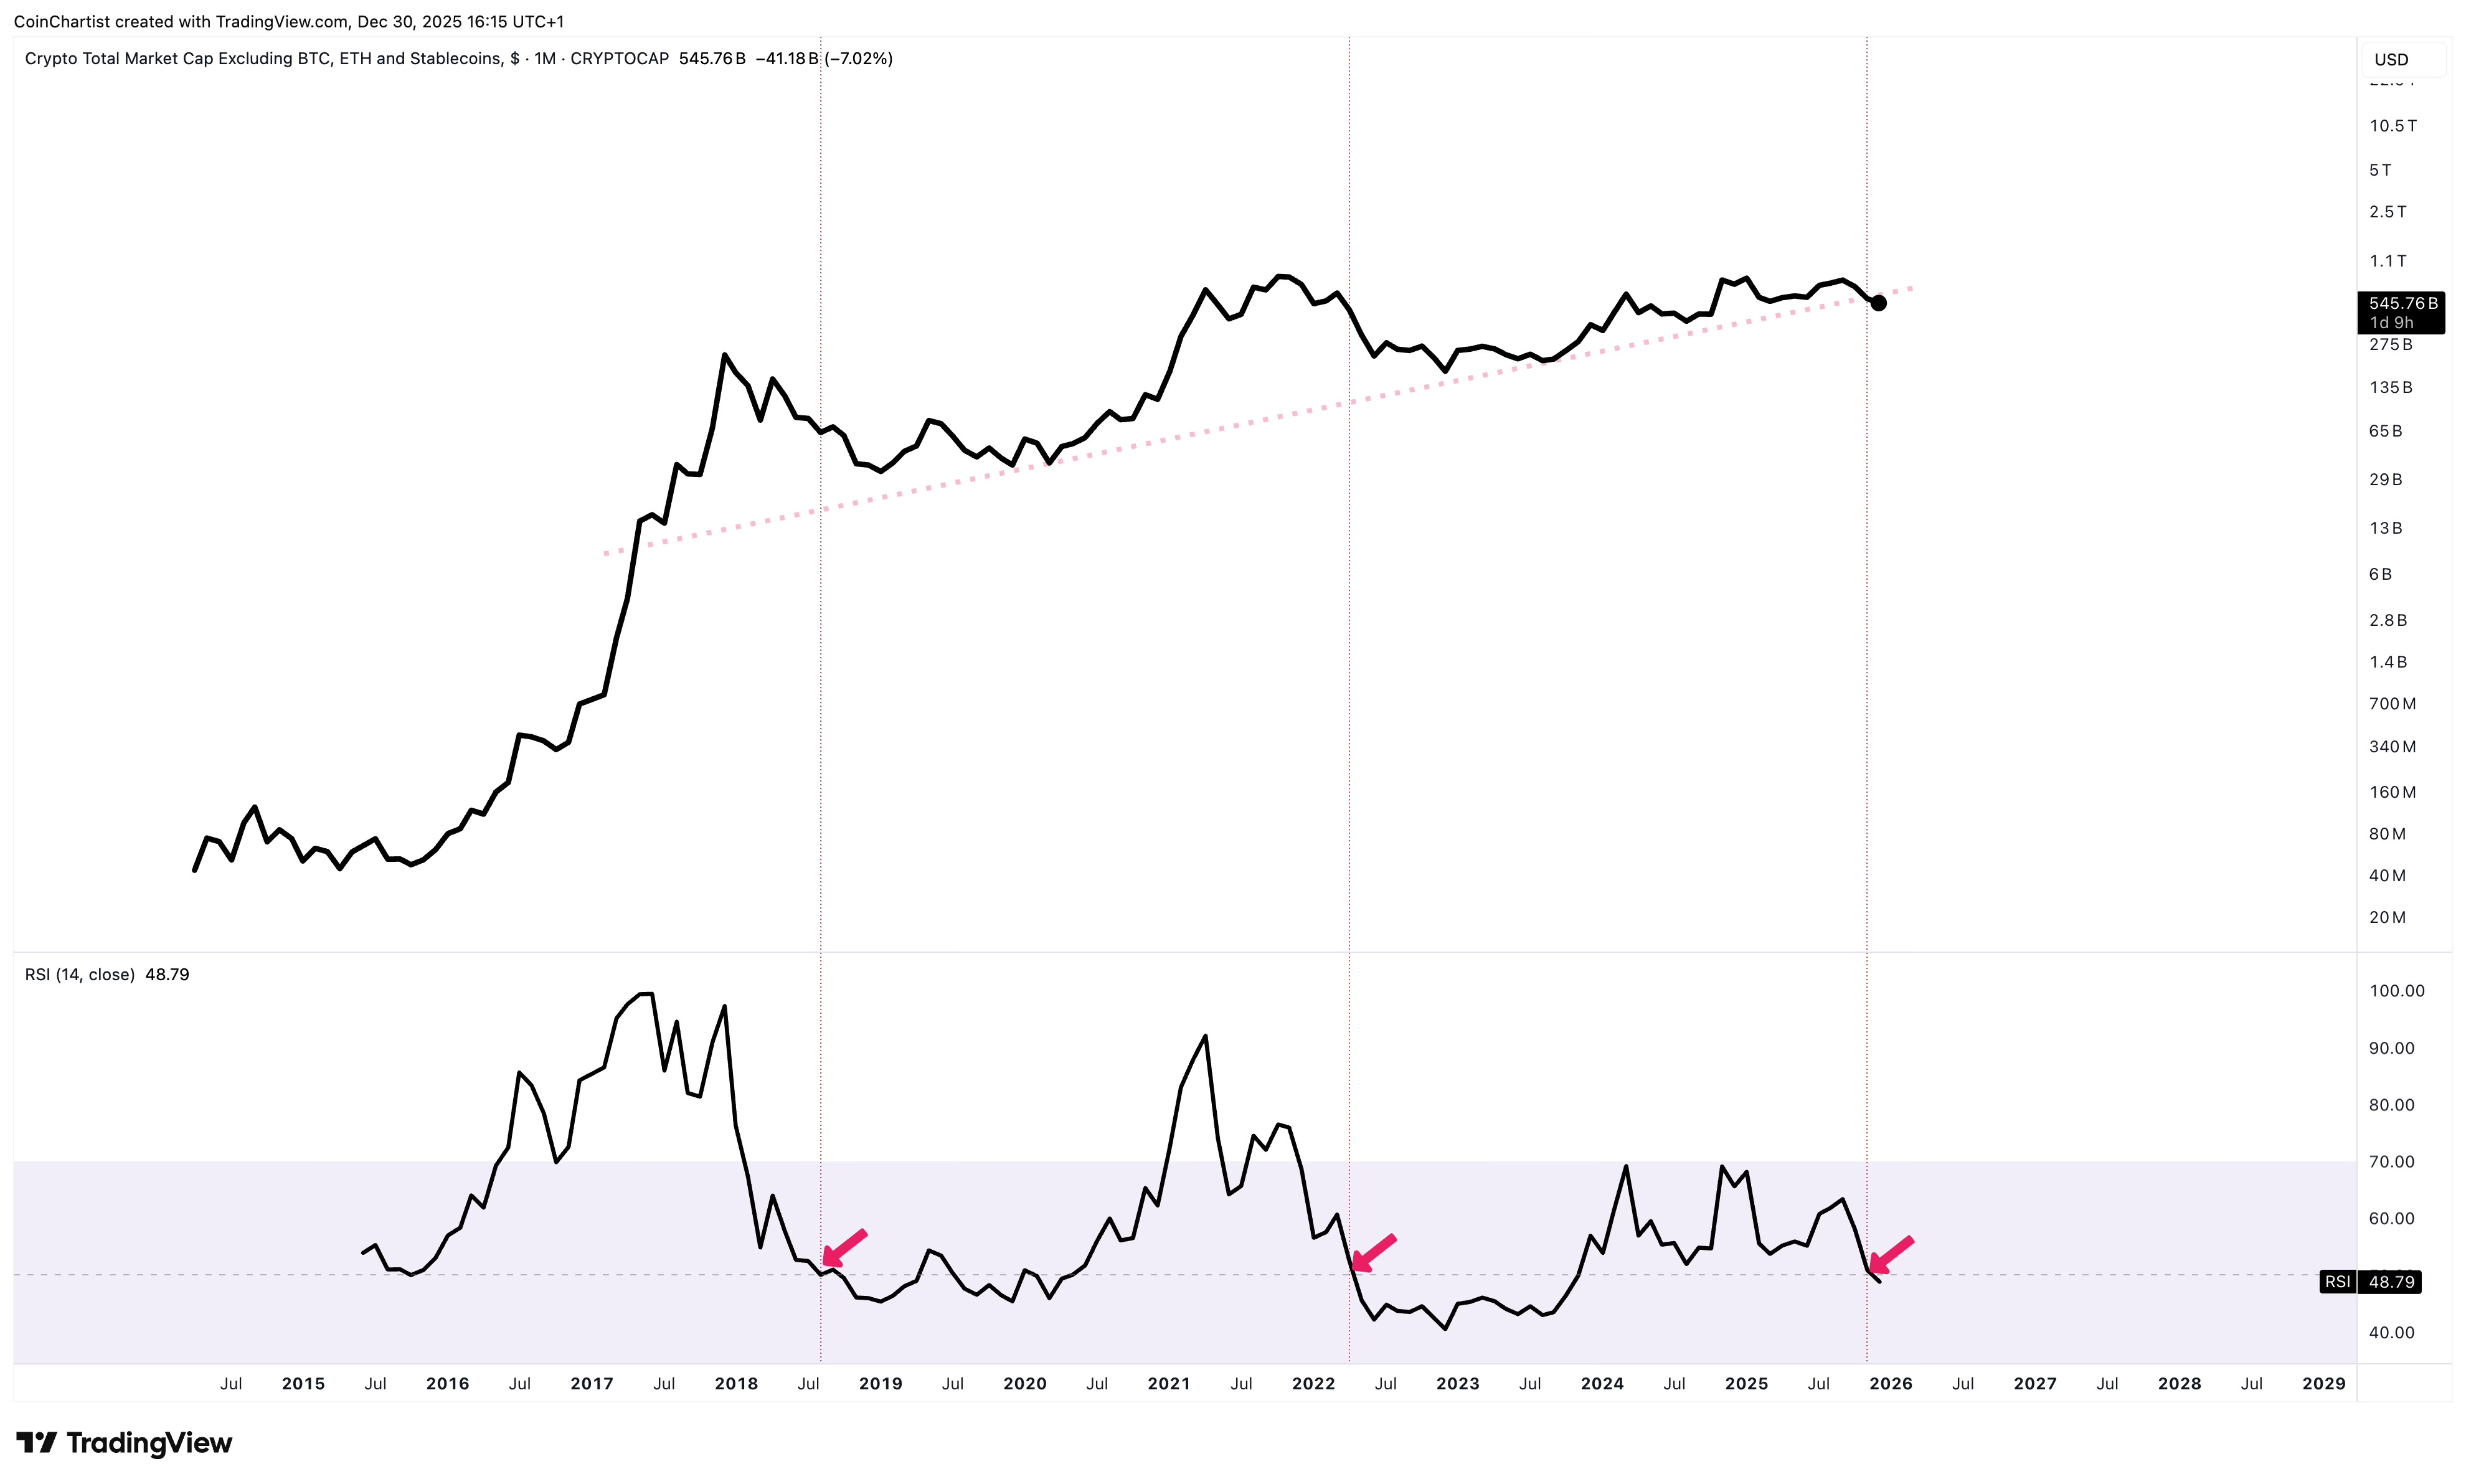
A long-term trend line is at risk of breakdown. And it is happening just as the monthly RSI is about to fall below 50. This is a confirmation signal that the bear market is about to escalate. RSI has never fallen below 30. I think it does before this is over.
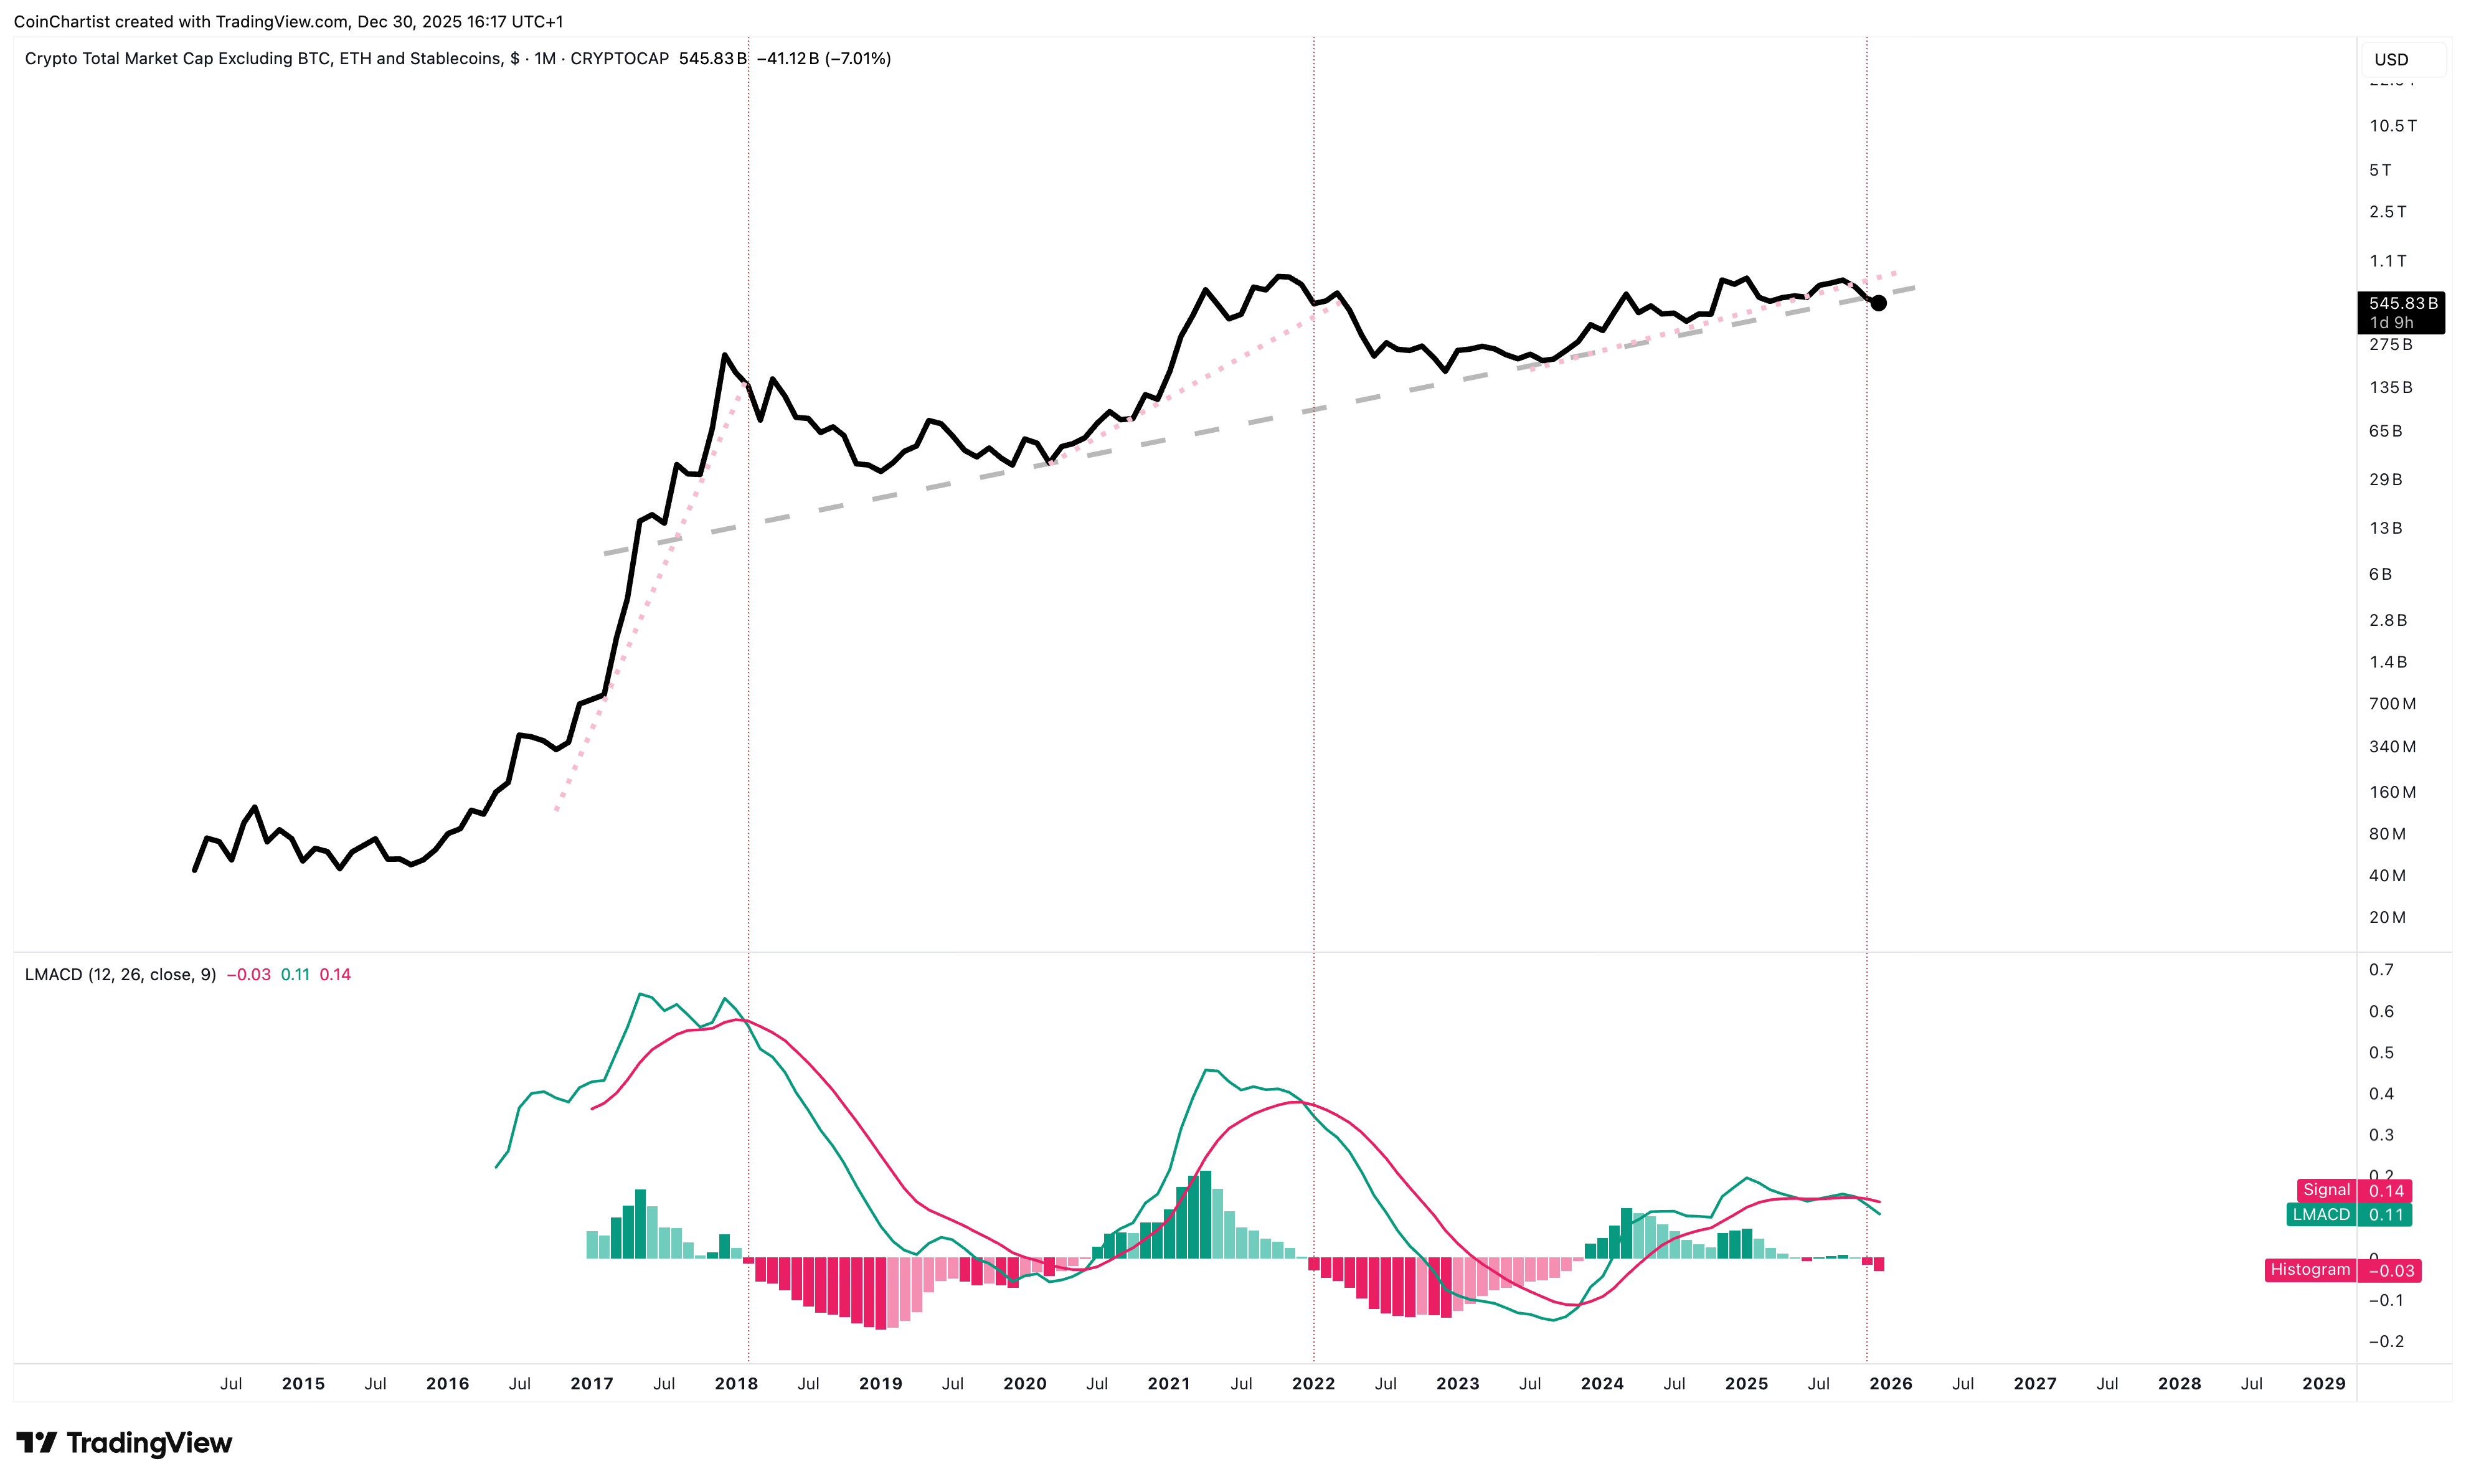
The LMACD has crossed bearish and is about to confirm the second red tick on the histogram, highlighting increasing bearish momentum. These crossovers are always associated with major momentum changes. The momentum change is just starting, yet altcoins are already so weak.
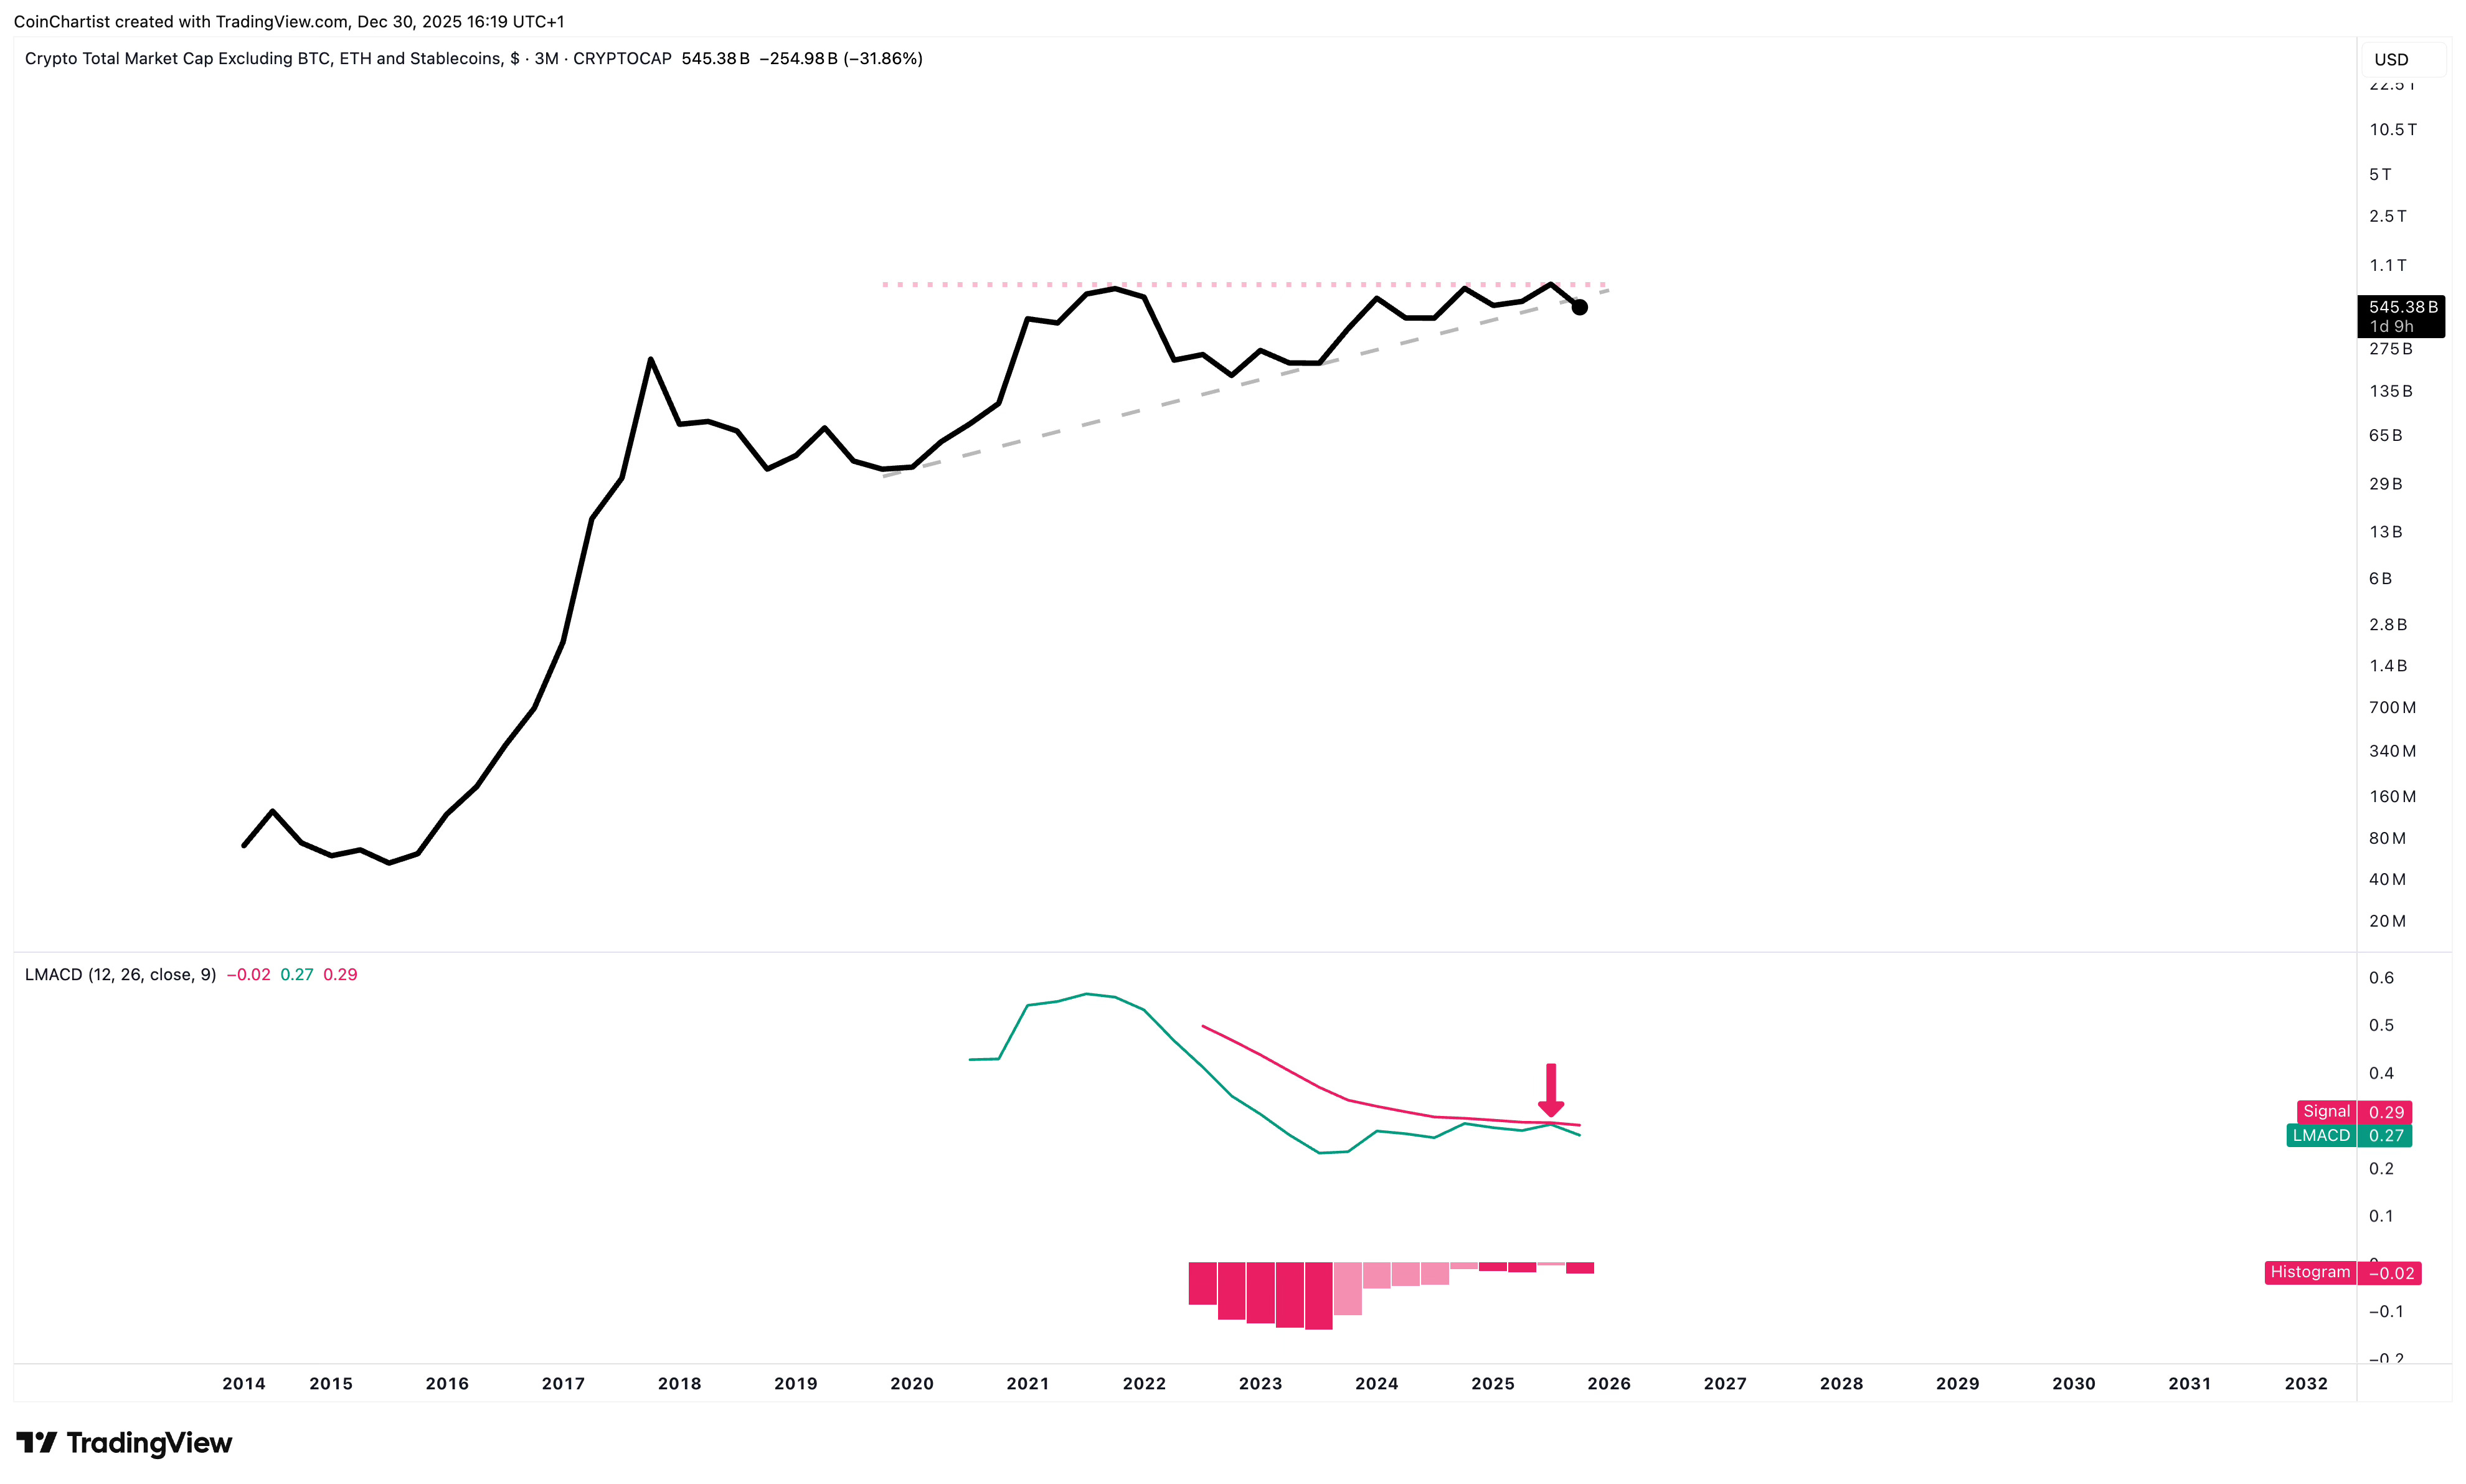
Even the quarterly LMACD shows that this latest bull market couldn’t confirm with a bullish crossover. The failure to confirm is starting to drag bearish momentum even lower. It is difficult to imagine a bullish 2026 with momentum looking like this and price pushing down.
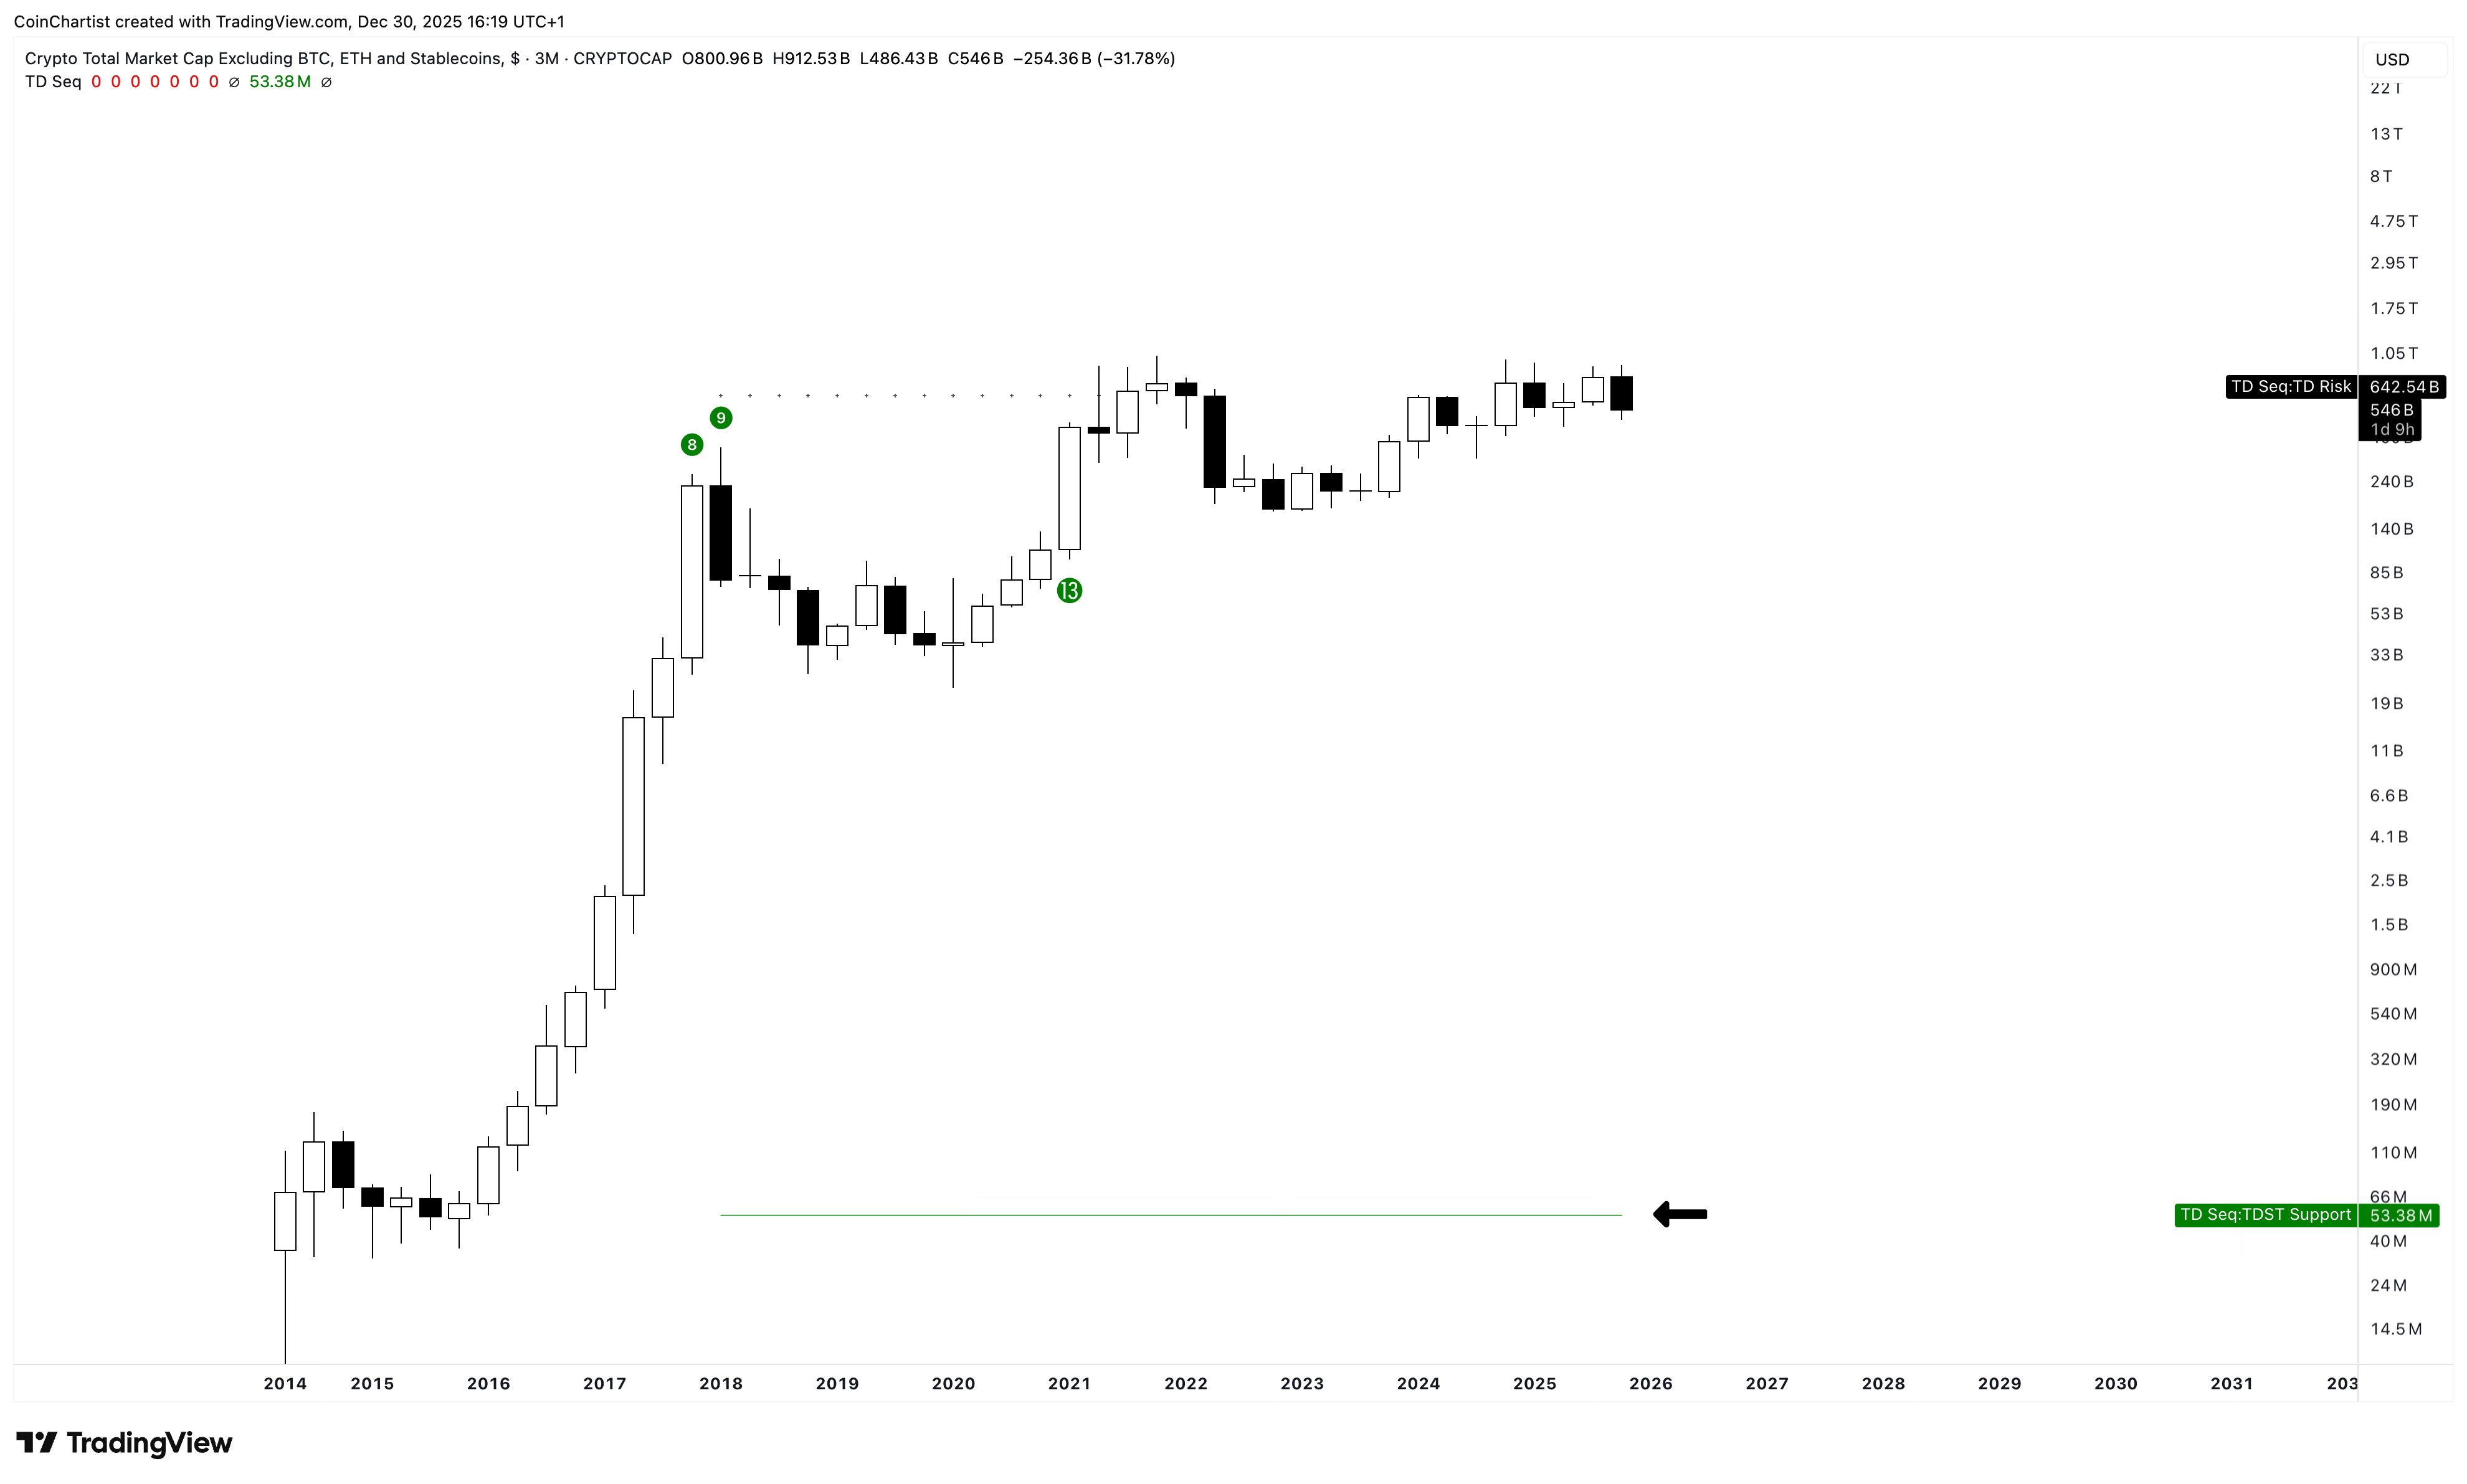
On the quarterly, there’s almost no support in altcoins. TOTAL3ES TDST support is located at $53 million. Not billion. Million. The index is current at $545 billion. What a drop. But don’t fear – that is very unlikely to be hit.
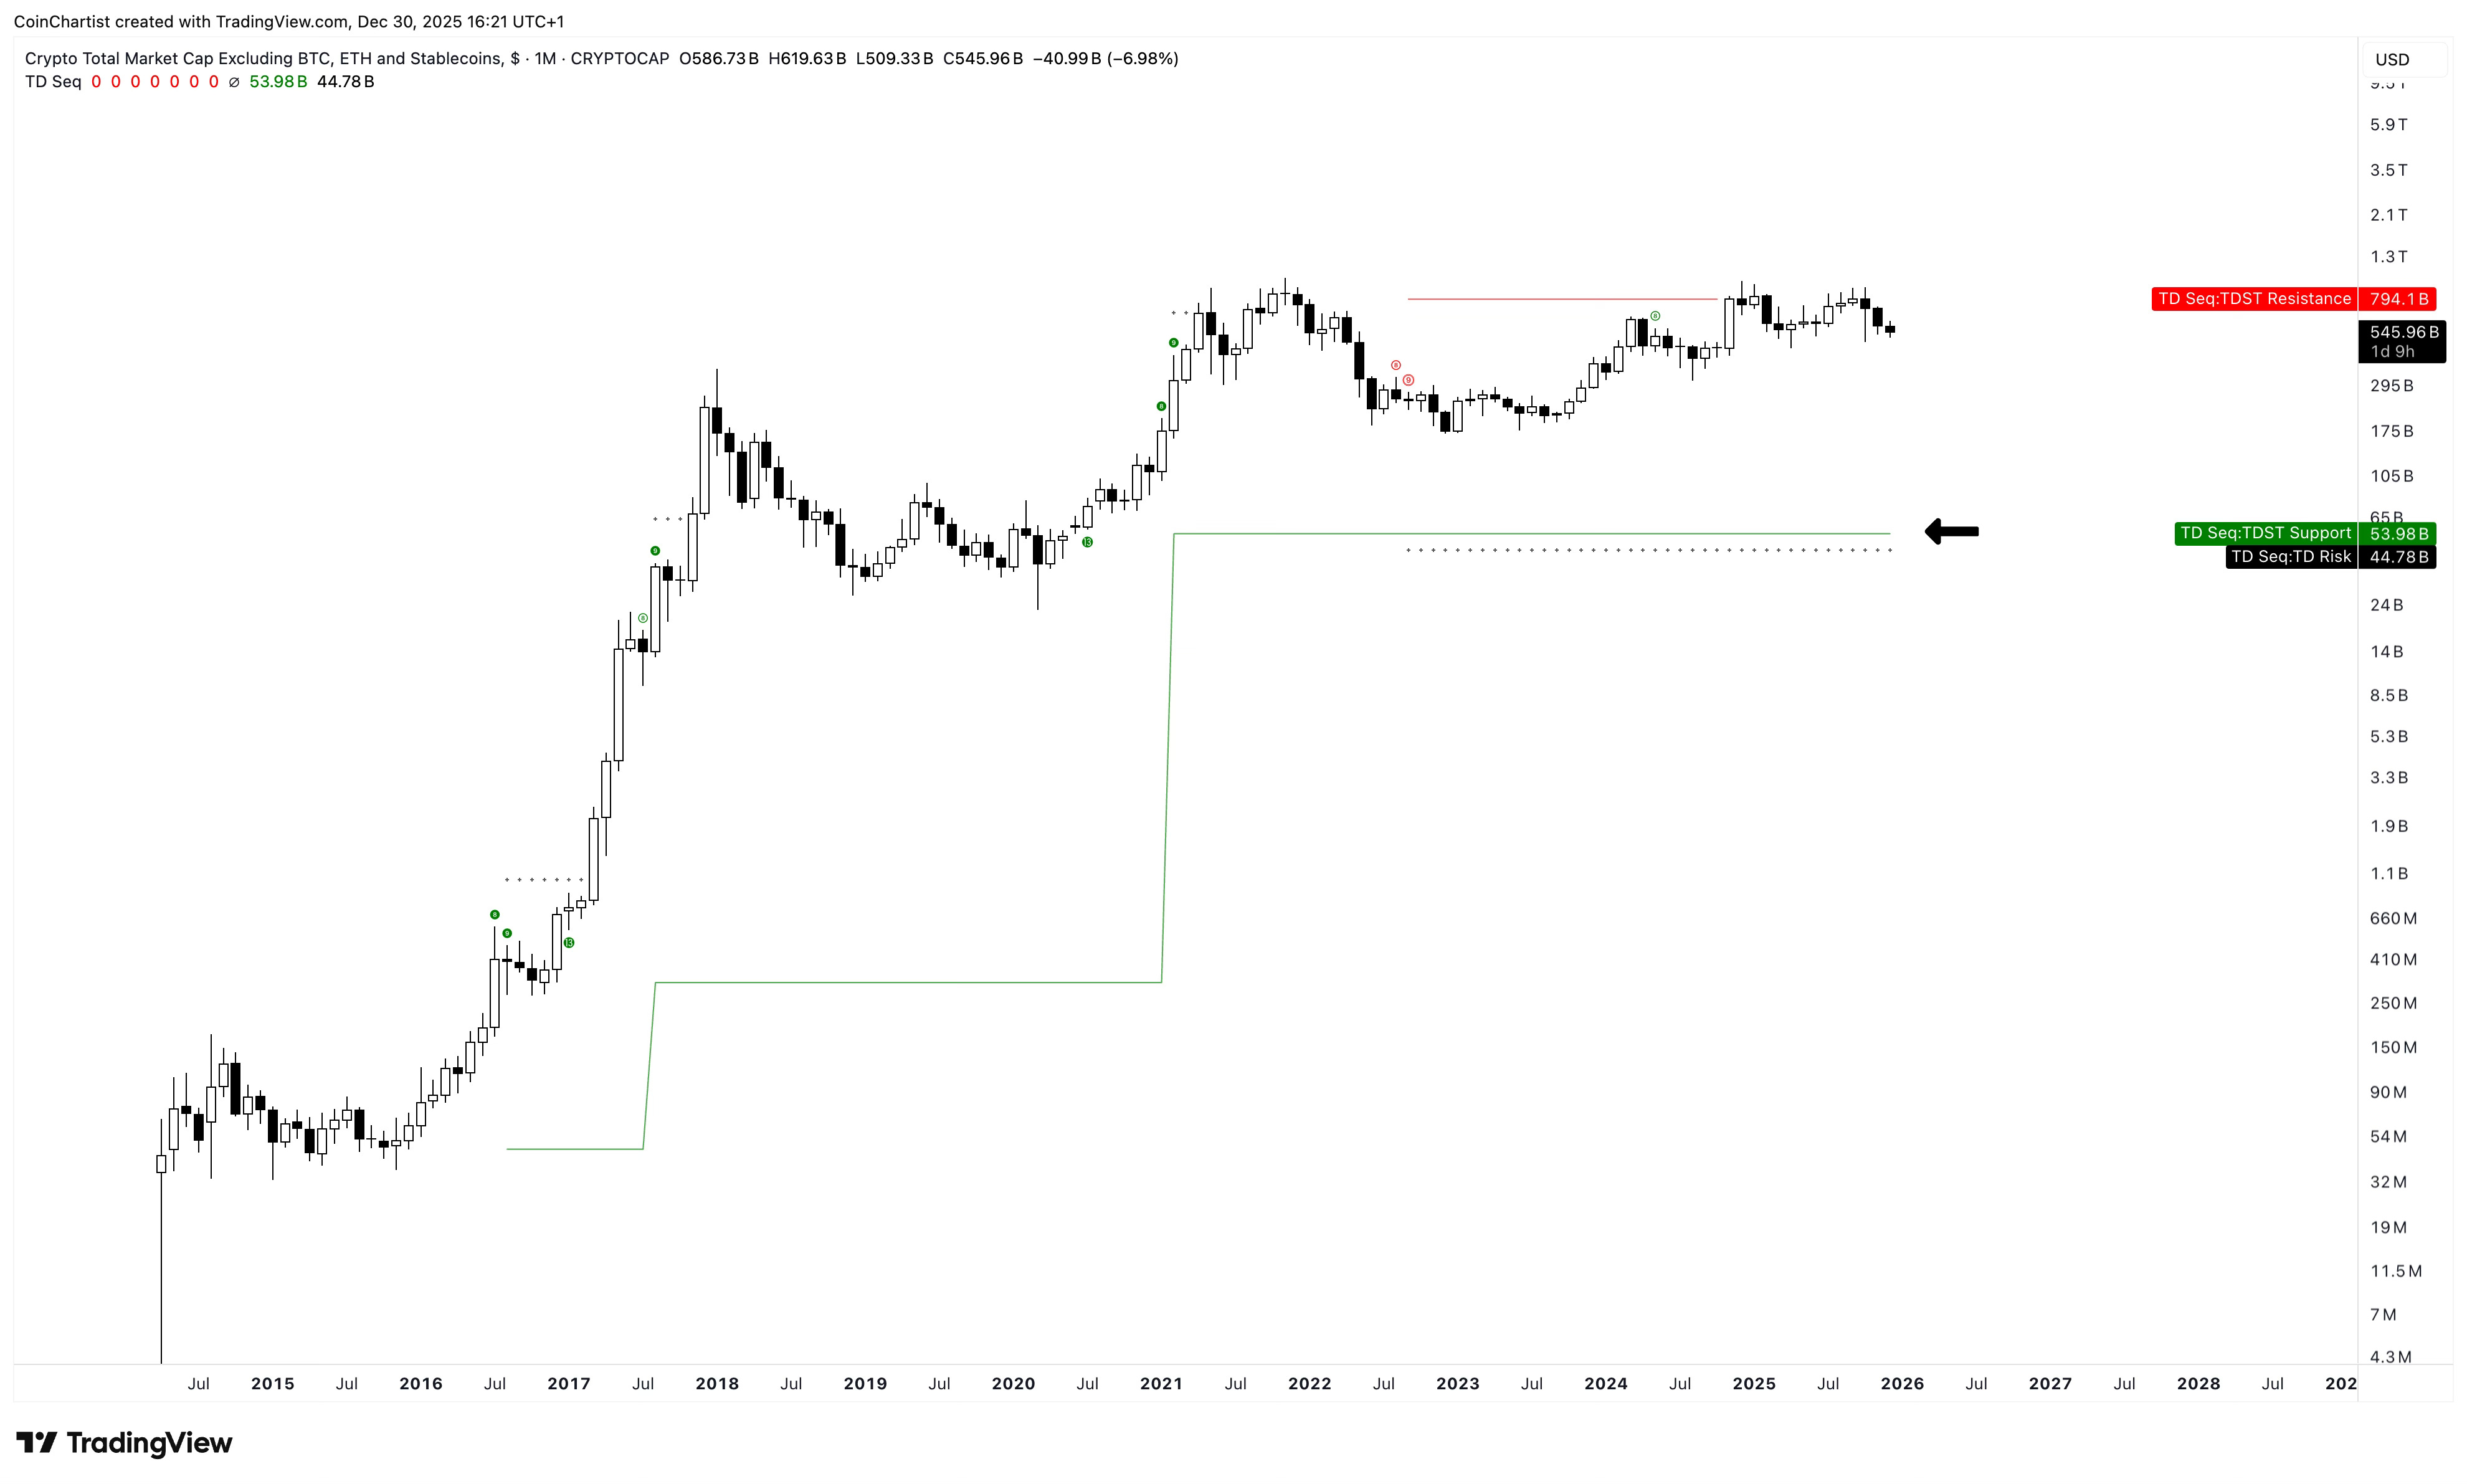
Fortunately, the monthly TS Sequential’s TDST support is at closer to $53 billion. This is still a $490 billion drop, but at least it isn’t back to millions. This area is very possible.
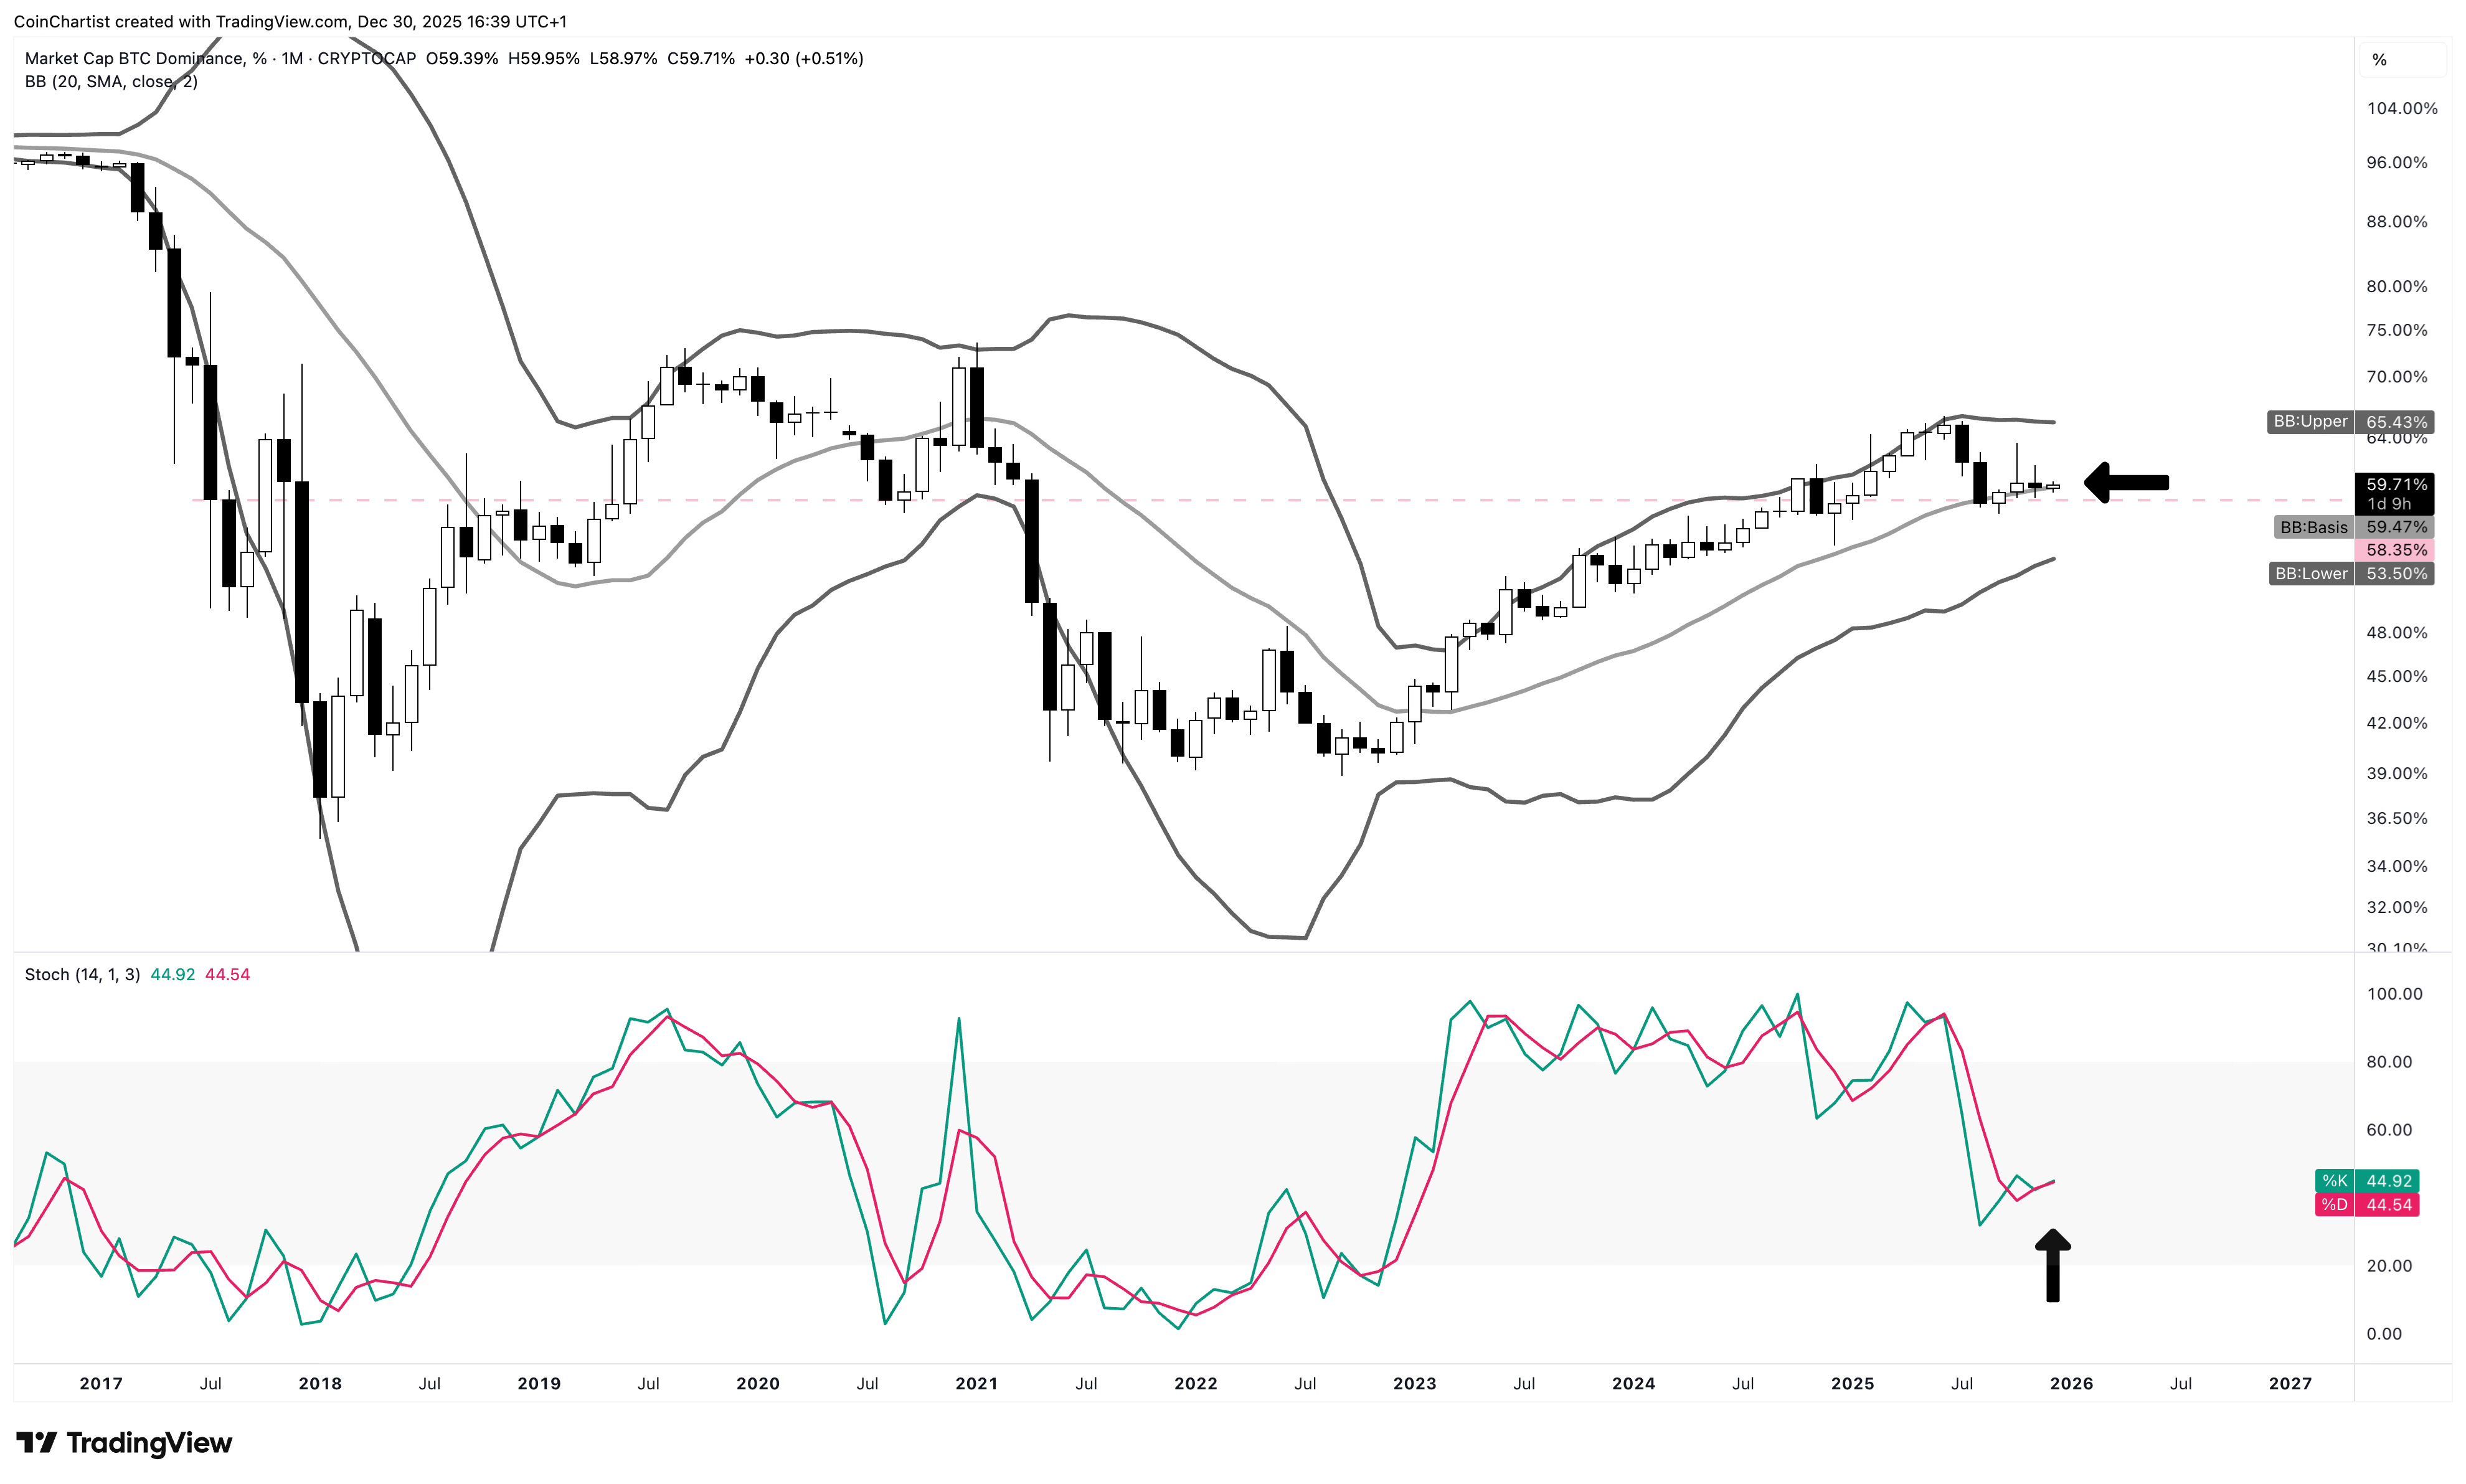
Even Bitcoin Dominance — it shows the Stochastic is turning back upward here. Price is holding above the Bollinger Band basis as the bands begin to narrow and squeeze. This could be a consolidation and compression setup before Bitcoin Dominance goes even higher. That definitely doesn’t scream “altcoin season” is coming to me.
Final thoughts: This is the best, most unbiased analysis I can give you. With Bitcoin potentially entering a bear market, and the bull trend seemingly over, my role as Tony “The Bull” feels complete. It is time for an identity change that better aligns with my personality traits, talents, and the professional direction I want to go in. Anyone can draw a line on a chart or say buy this or sell that. Very few people can tell you where we are in a market cycle based on human emotion, and match that to technical and macro analysis.
I will begin to slowly turn this newsletter into something else entirely. I will be shutting off paid subscriptions, and it will become a much shorter, more frequent email blast. I am sure I will go through a phase of difficulties and challenges as a rebuild from the ashes of what’s left, but I am confident that what I bring to you and the world in the future will be something uniquely valuable. I want to help others improve their ability to tune out noise and make unbiased decisions under pressure. There will always be technical analysis — how I interpret and explain things will be different. Less bull and bear talk, more hope and fear translated into price action.
Across several different belief systems, we are at the end of a larger cycle and at the start of something new. 2025 is the year of the Snake — a year we look at what we’ve outgrown and are going to be leaving behind. “The Bull” served me during Bitcoin’s bear market, but as the trend changed, it left me vulnerable to assumptions about my analysis.
The analogy here is actually very fitting for Bitcoin. Bitcoin is shedding its old skin and becoming something else. When Bitcoin was born, it was the promise of privacy, anti-censorship, anti-government involvement with money, etc. It initially appealed to early tech adopters, the curious, drug dealers, cypherpunks, and those who wanted to “opt out” of the financial system.
Today, it is being integrated into the existing financial system, aligning with government policy, and tax reporting requirements ensure privacy no longer exists. Rather than a pseudonymous figure at the forefront of Bitcoin – we have a lunatic tech bro CEO who drove his company into the ground in the past to the tune of a 99.9% loss after the dot com bubble.
At the same time, Bitcoin has some hurdles to face in the future, and the market is always forward-looking. It is no coincidence that Google revealed its quantum computing breakthroughs just as Bitcoin topped in October 2025, just like it bottomed in November 2022 around when ChatGPT was announced. This is a less direct correlation, but it was clear that ChatGPT’s emergence would lead to an AI bubble and lift risk-assets, Bitcoin included. The AI narrative led to three years of bullish price action – how many years of bearish price action could quantum computing lead to? I sense we are about to find out, starting with 2026.
Thank you for being a CoinChartist VIP premium subscriber.
Remember to leave a comment, hit like, or restack this content.
Please feel free to contact us with any issues or inquiries by emailing coinchartist@gmail.com.
-Tony Severino, CMT
Your bearish calls have been on point these past 6 months. Keep up the great work.
Solid technical breakdown here. The Gold/S&P ratio argument is pretty compelling when you look at past secular shifts lasting 4-12 years. What's interesting is the 16-year cycle stuff because it reframes whats happening as a larger structural shift rather than just another 4-year halving cycle. The section on buisness cycle indicators turning support into resistance felt spot-on too, especially when everyone kept expecting ISM to just bounce back.