#25 | Impulsive Behavior
Why Bitcoin could be on the cusp of its most bullish phase, and a strategy to go long.
Issue #25 of CoinChartist (VIP) overview
Bitcoin is above $30,000 and aiming for new 2023 highs
Chainlink and Solana revive the altcoin market, save Ethereum
Which altcoin is next to pop? Find out which coin
Has Bitcoin entered the impulse phase? A deep dive into relative strength
BTC already breaks out against the stock market and gold
Wave counts help map out what the impulse looks like
Chart class teaches you a simple strategy on how to long the breakout
Remember, a premium subscription comes with access to custom technical indicators like the Raging Bull, Trend Wrangler, and more.
Disclaimer: The information provided in this Substack newsletter is for general informational purposes only and should not be considered as financial advice. Investing involves risk, and past performance is not indicative of future results. Please conduct your own research or consult a financial advisor before making any investment decisions. The newsletter disclaims any liability for losses or damages arising from the use of this information.
Last week’s fake Bitcoin spot EFT approval was enough to get the market to wake up and realize the pent up energy just waiting to release upon the real approval. It appears to have prompted a wave of “rumor” buyers, who are buying BTC now to later sell the news. Because Bitcoin is a speculative asset still, this could lead to prices becoming detached from reality very quickly.
Bitcoin is less than $1,000 away from the upper Bollinger Band on the 1W timeframe. At this price, BTCUSD will also make a new 2023 high. Most importantly, this will complete the “Head Fake” setup we saw unfold starting in August. Bitcoin failed to close outside the lower Bollinger Band, and is now bouncing back toward the upper Band. A close above it confirms a breakout and its direction, much like October 2020.
Learn more about the Bollinger Bands here.
BTCUSD has closed a weekly candle above the Tenkan-sen (blue). The Tenkan-sen and Kijun-sen (maroon) are crossed bullish, and price is above both spans which is a bullish sign. There is now very little resistance overhead, aside from the top of the cloud at over $40,000 per coin.
Learn more about the Ichimoku here.
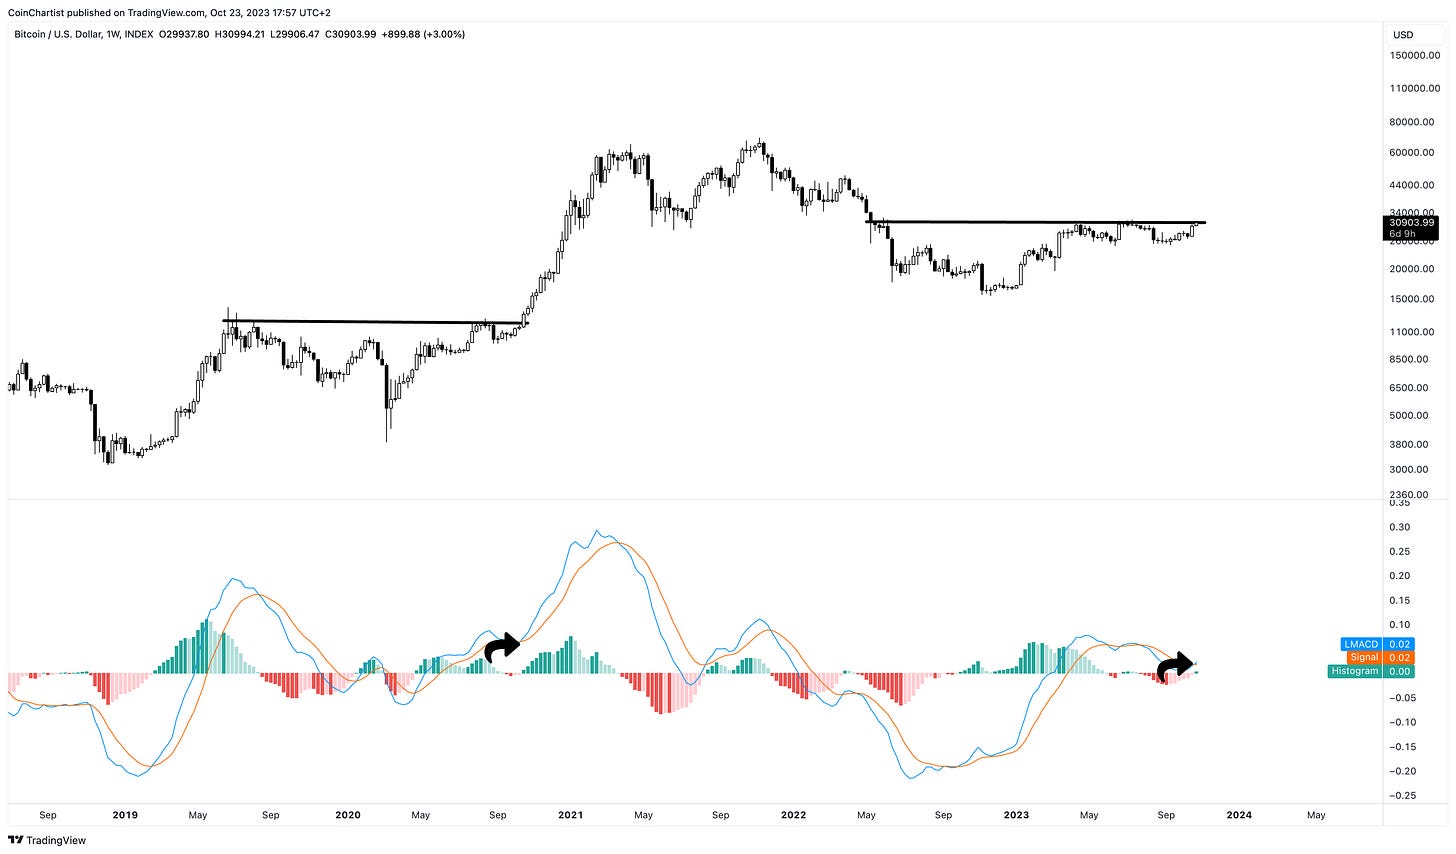
The weekly LMACD has crossed bullish while above the zero line. This should lead to a bullish move as long as momentum continues upward. Crossovers are notoriously contested, however, so we could see some type of mid-week selloff and reset, which I’ll discuss further in the Wave Watch section. However, it might be too late for bears altogether and Bitcoin might keep on cruising higher with very little stopping in between.
Learn more about the MACD here.
We’ll know at the end of the month if Bitcoin is able to cross bullish on the True Strength Index. In the recent special edition, Revulsion, I explained this was going to be an important signal that the bull run is starting. It could trigger as soon as the November open or sooner if BTCUSD continues higher.
This week, despite the strength in Bitcoin, the talk across crypto was about Chainlink and Solana – two of last week’s top performers. Chainlink rallied more than 40% in a matter of a few days, with Solana not far behind. Both of these coins have been covered extensive in the last several issues.
Solana, easily one of the most hated coins of the final stages of the bear market given its ties to FTX, is starting to thaw from crypto winter at a faster pace than other coins. Importantly, the Raging Bull indicator has turned on for the first time since the peak in late 2022. Solana has been in a downtrend since. Note that the last time the candlesticks turned yellow, Solana had a shocking price rally where it did 500% ROI at first, then 17,000% ROI in total.
The same can be said about Chainlink, which once again just had a 40% rally. Onlookers might fear they’re too late to buy in, but the last time the Raging Bull indicator lit up in 2019, Chainlink did 700% in the near term, and more than 9,000% in total. This might not be a setup to sleep on.
Chainlink’s connection to DeFi and as a blue-chip altcoin helped save Ethereum at the last moment. Ether been flirting with a catastrophic breakdown. If the Raging Bull lights up like it has on Chainlink and Solana, Ethereum will make a run for the top trend line instead of falling out of the bottom line.
The next coin that I feel is ready to pop is Fetch. FET was my best performer in what I called the January Effect Experiment, where I invested in a handful of altcoins at lows based on a recurring, Presidential cycle-based opportunity. I expect it be a stand out performer again soon enough. Waiting for the Raging Bull to turn on would help confirm increased bullishness in the altcoin.
Upgrade to premium to receive access to the Raging Bull. It is the best tool for spotting bull market breakouts in crypto.
The Raging Bull indicator was designed using the Relative Strength Index to help indicate when Bitcoin or other assets are in a bull market, and more importantly, and impulsive like trend. The RSI was selected to highlight “strength” in the asset. Using the RSI itself, let’s take a look at Bitcoin’s developing impulse.
An impulse is a phase in a trend where buyers or sellers overwhelm the other side and price moves rapidly in one direction. Bitcoin tends to only behave like this, when the RSI stays consistently overbought. The BTCUSD daily just pushed into overbought territory, but now its gotta stay there for an extended duration to remain in an impulse.
The same must happen across increasingly higher timeframes. The 3-day is only just now joining the fun. The last major impulse lasted roughly 90 days, suggesting that the rally, if one is truly beginning, could last through January of next year.
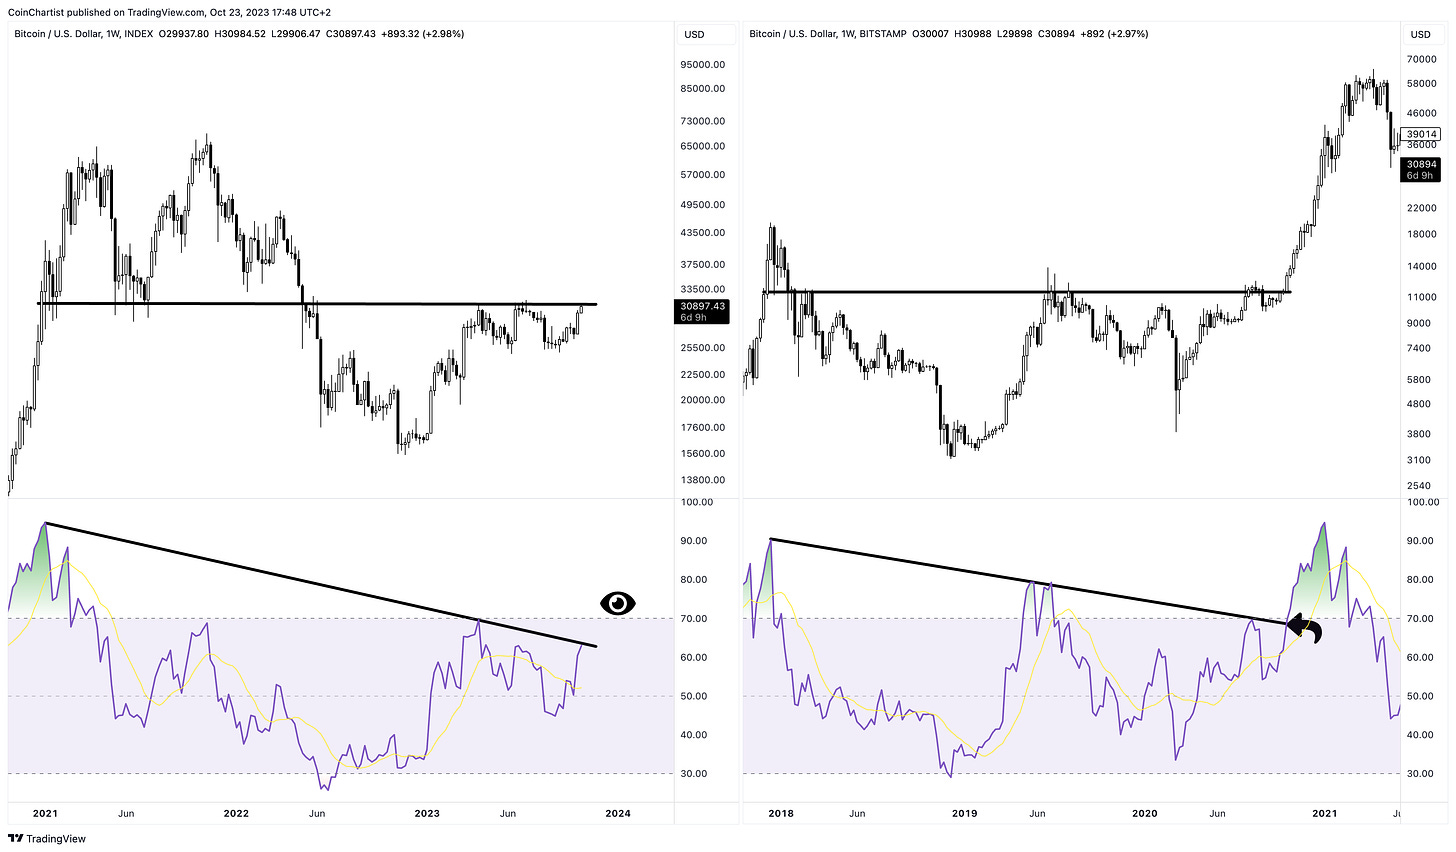
Bitcoin hasn’t reached overbought levels yet on the weekly, which is one of the final timeframes that must join in on the impulsive action. BTCUSD weekly is brushing up against a RSI downtrend line. In 2020, once this was broken, it was off to the races. Will this happen once again?
That’s it for free content. Premium subscribers get the following:
BTC already breaks out against the stock market and gold
Wave counts help map out what the impulse looks like
Chart class teaches you a simple strategy on how to long the breakout
Remember, a premium subscription comes with access to custom technical indicators like the Raging Bull, Trend Wrangler, and more.
Keep reading with a 7-day free trial
Subscribe to CoinChartist to keep reading this post and get 7 days of free access to the full post archives.


