

#33 | New Beginnings and Change
Find out why a Dragonfly Doji in Bitcoin could be a sign "something positive is on the horizon."

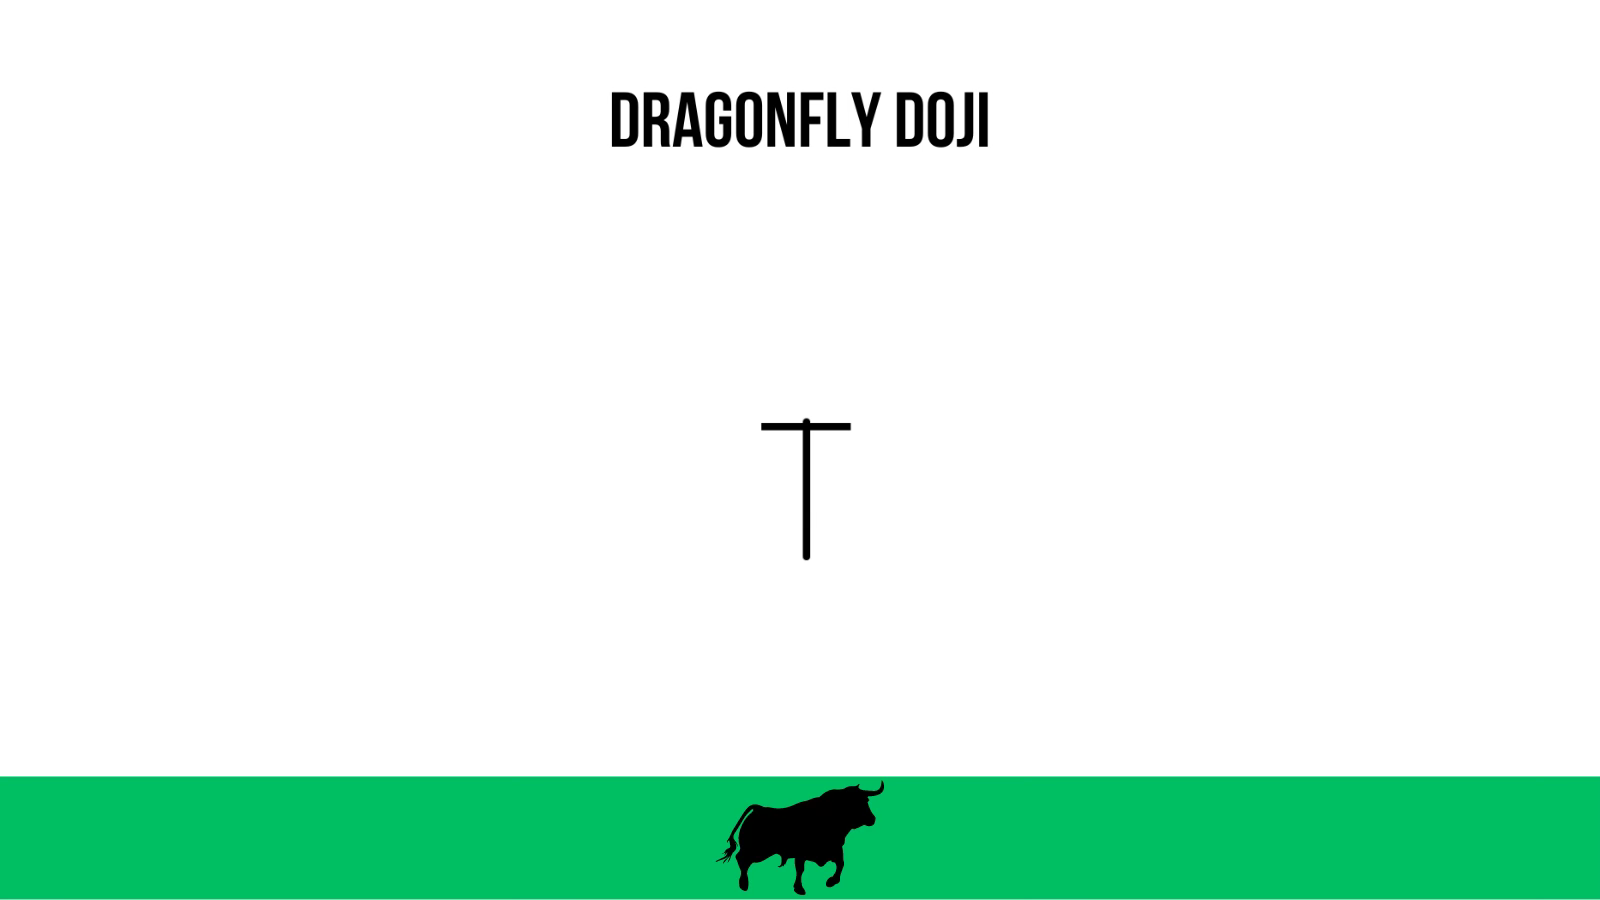
This week’s most important signal is a possible Dragonfly Doji forming on the weekly. The dragonfly itself symbolizes “good luck, new beginnings, and change.” In the Bible, seeing a dragonfly is considered a good omen, reminding. you to “live in the moment” and “embrace change". In Native American culture, the dragonfly symbolizes “swiftness,” “motion,” and “change.” Does this important bullish candlestick signal point to dramatic change in the cryptocurrency market?
Issue #33 of CoinChartist (VIP) overview
Can Bitcoin bulls avoid bearish confirmation?
A study on the monthly Relative Strength Index
“Bullseye” top signal in Bitcoin still hasn’t triggered
Altcoins are about to leave accumulation
One new altcoin pick from the VIP community
Soaring stock market and a death cross in the dollar
The most in-depth Wave Watch in months w/ updated wave counts
Remember, a premium subscription comes with access to custom technical indicators like the Raging Bull, Trend Wrangler, and more.
Disclaimer: The information provided in this Substack newsletter is for general informational purposes only and should not be considered as financial advice. Investing involves risk, and past performance is not indicative of future results. Please conduct your own research or consult a financial advisor before making any investment decisions. The newsletter disclaims any liability for losses or damages arising from the use of this information.

Bitcoin’s Bearish Engulfing candle over a week ago was the talk of the crypto space, and rightfully so. The bearish reversal candlestick pattern has a high success rate in altering the trend. However, any candlestick pattern must confirm with follow through to be valid.
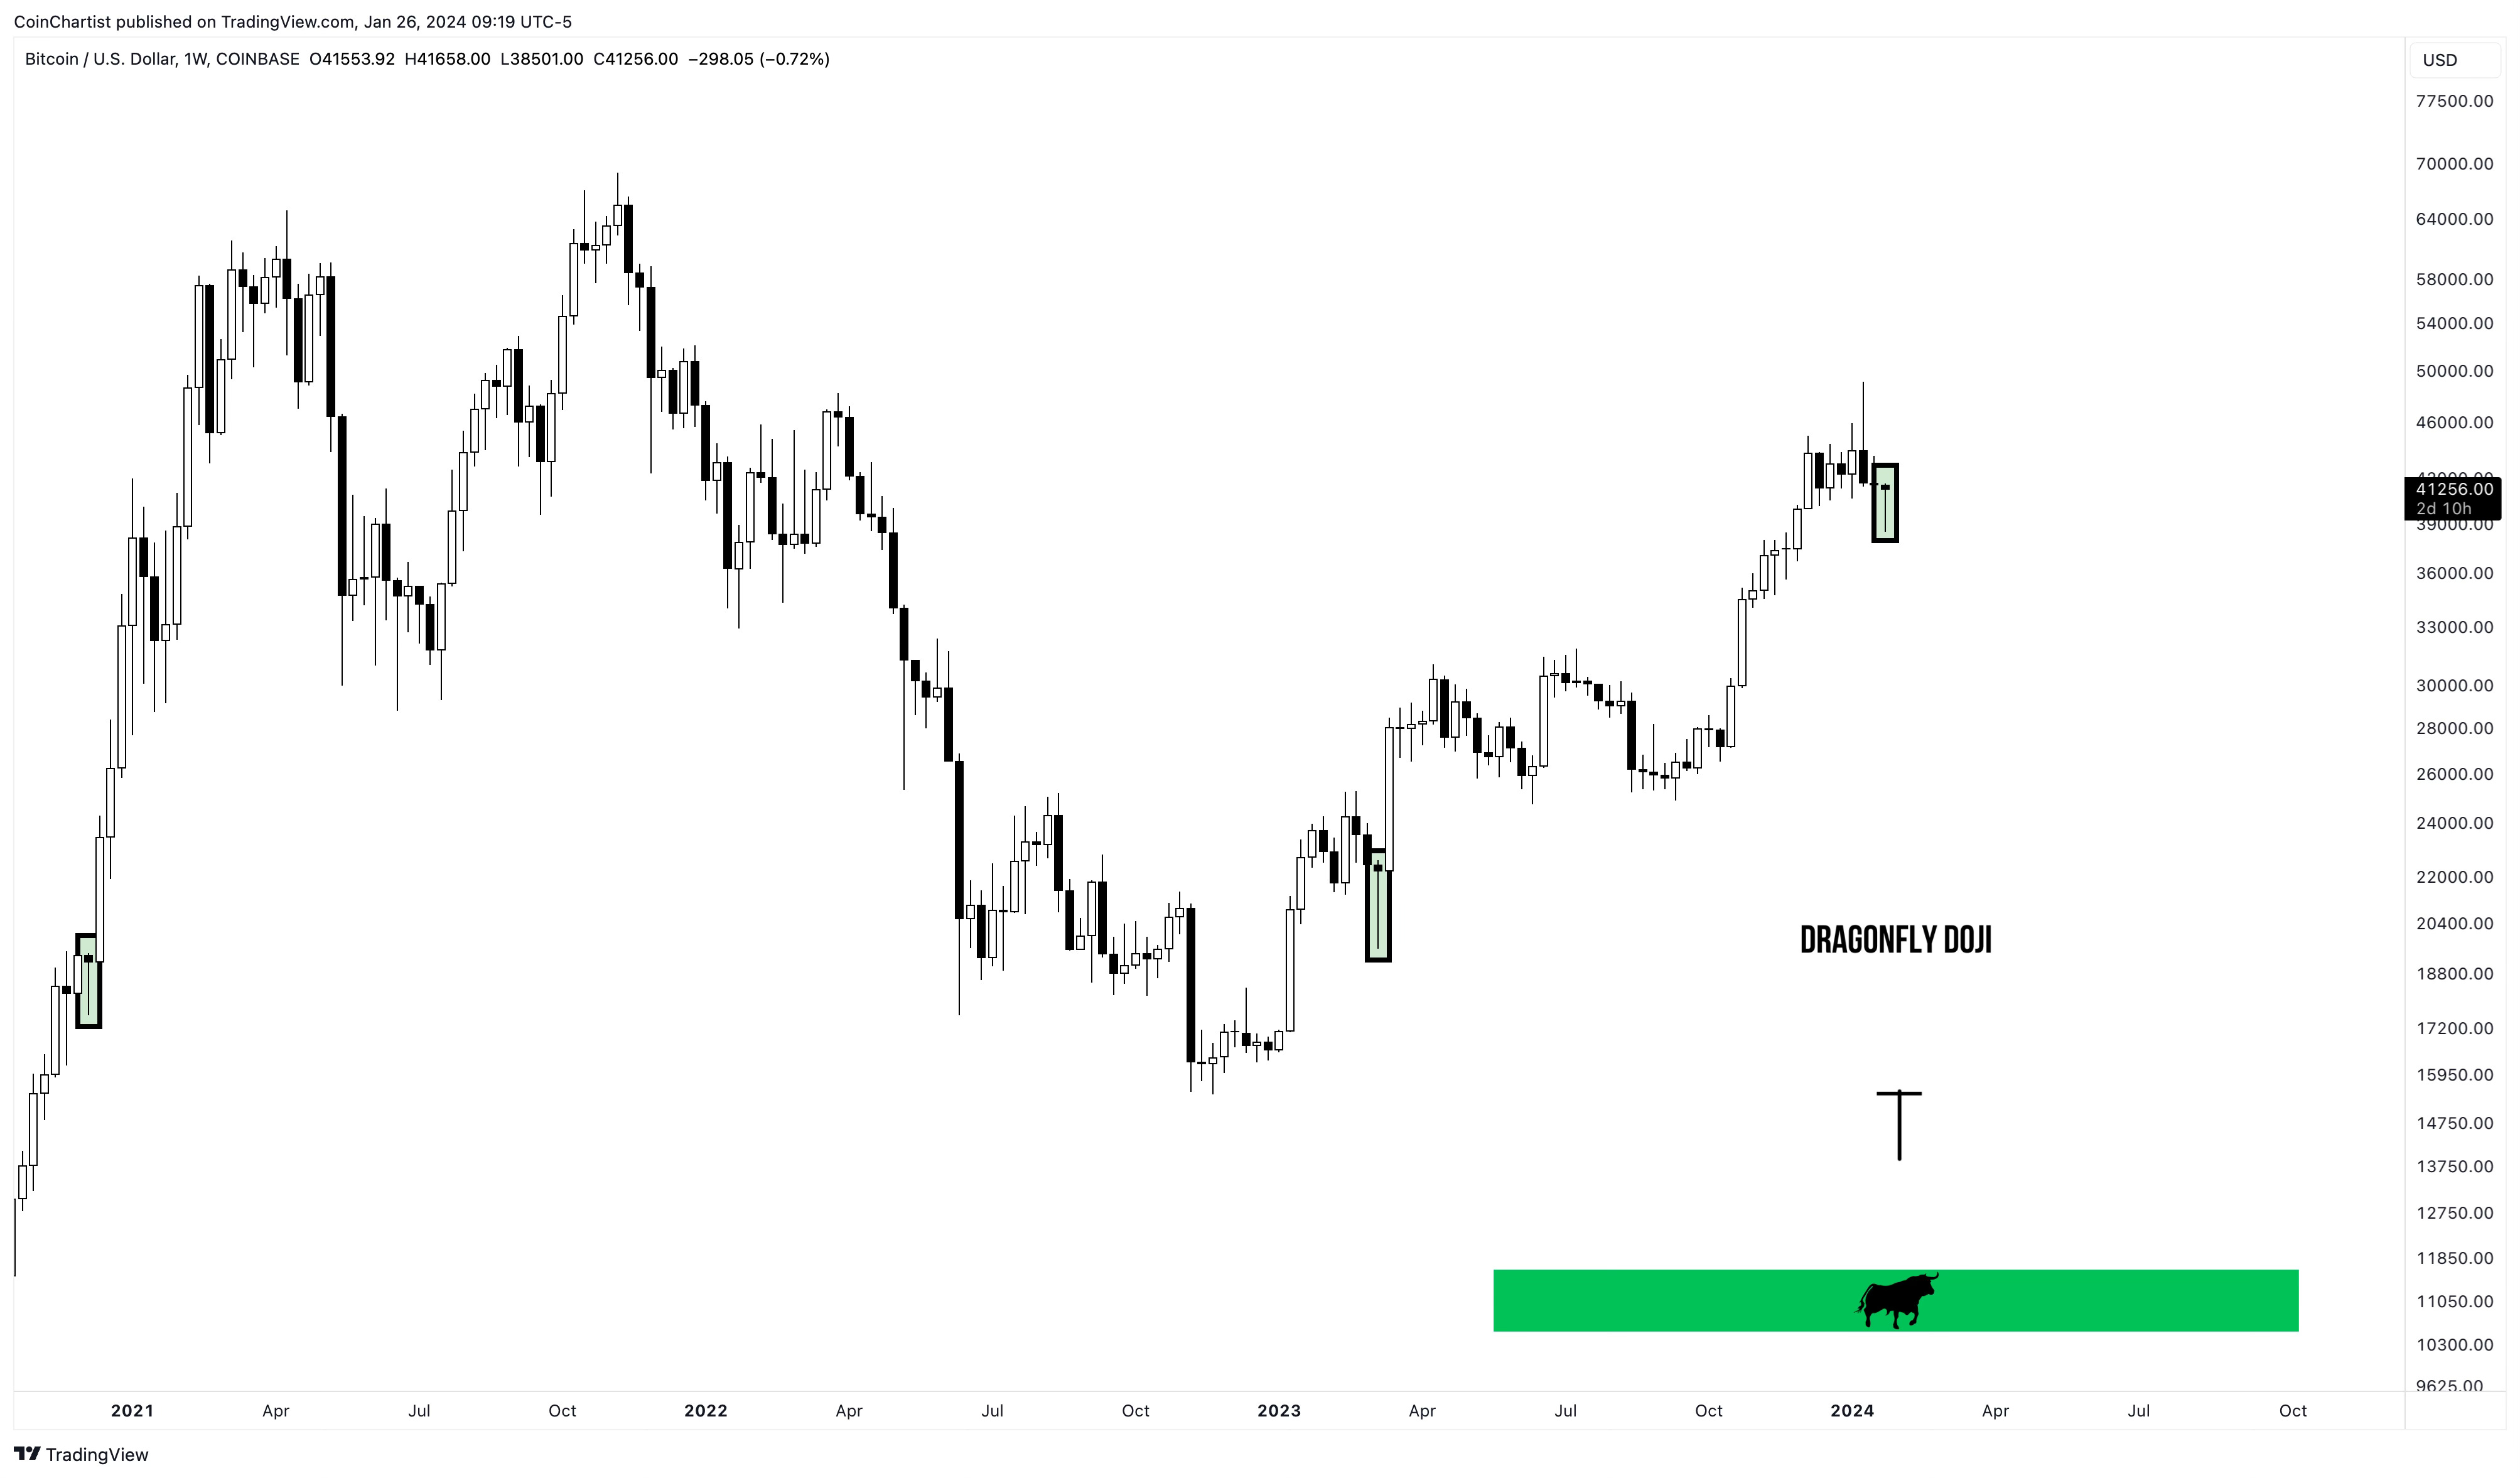
The week after the Bearish Engulfing candle, BTCUSD paused to form a Doji. On the second week, all this week, Bitcoin sank below $39,000 potentially bringing the necessary follow through bears were hoping for. The long black candle body has since been erased, leaving behind a long lower shadow or wick. This has currently created a Dragonfly Doji. If this candestick still stands by weekly close, Bitcoin’s rally could strengthen swiftly. In the chart above, additional Dragonfly Doji candles are highlighted to demonstrate the bullish potential.
Learn more about the Dragonfly Doji here.
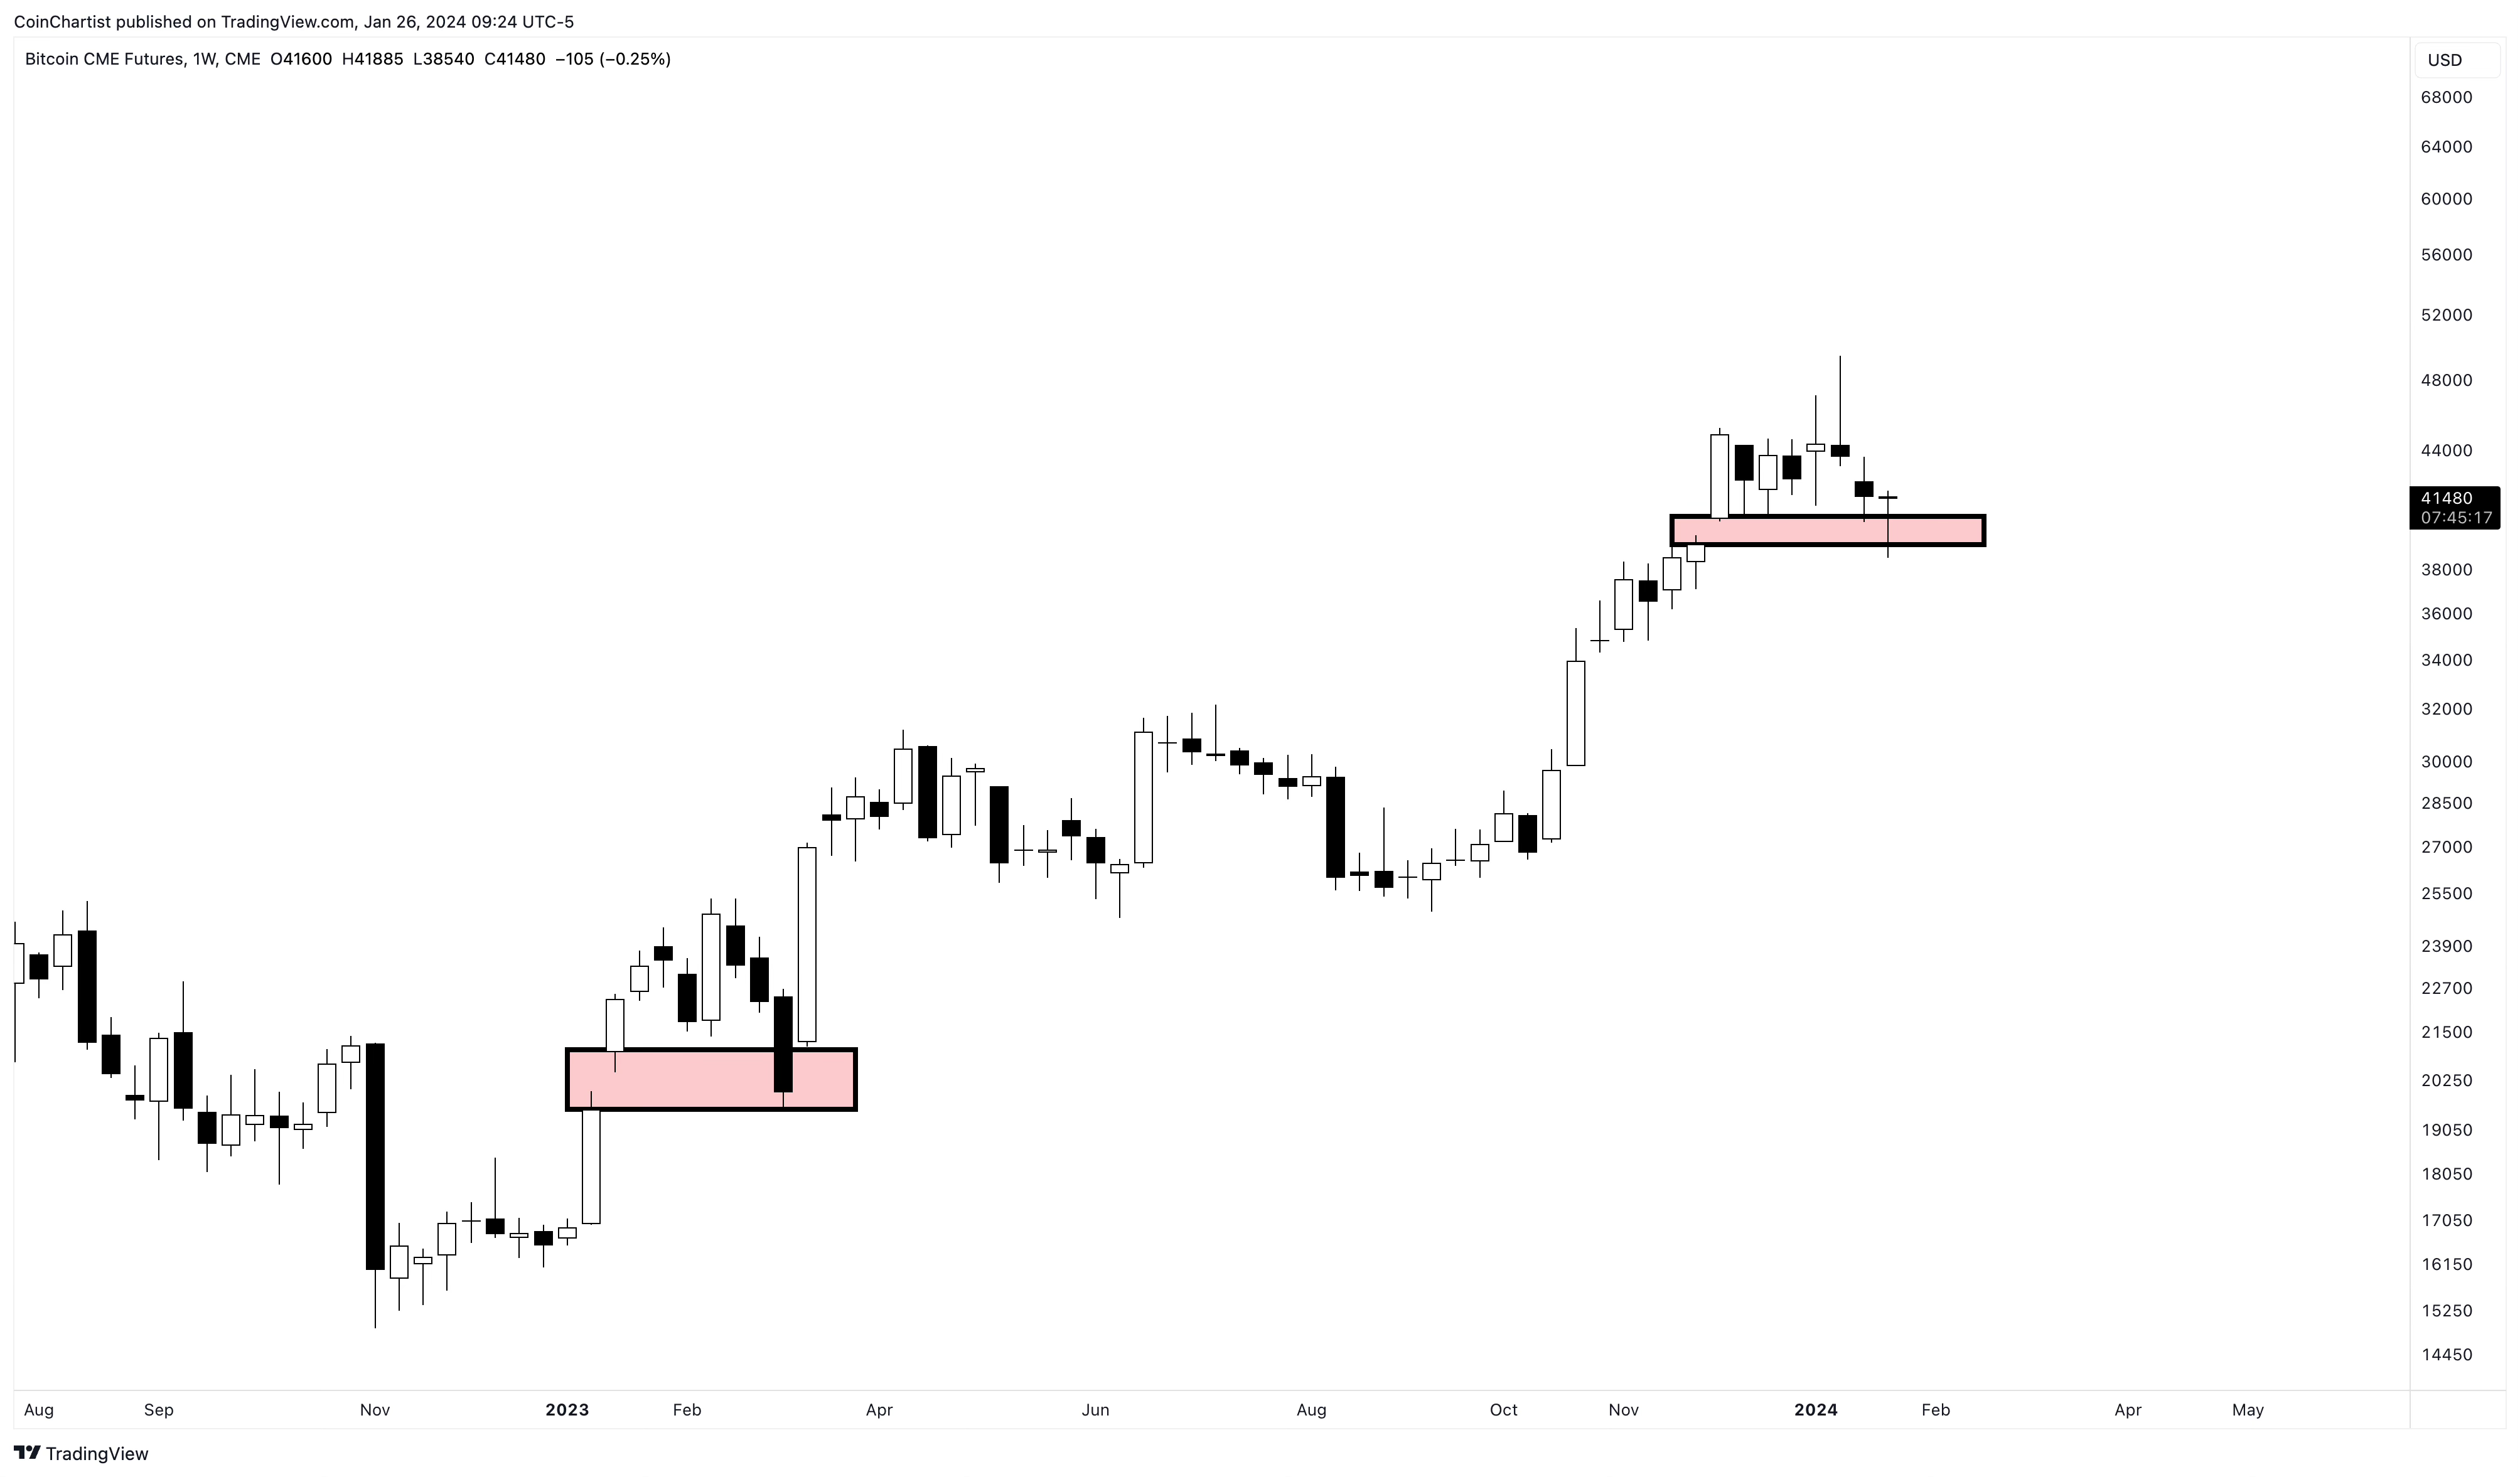
Sticking with Japanese candlestick analysis, the Rising Window or “gap” from last week’s issue was filled, but has continued to hold as support on a closing basis. Also on the chart is the last time BTC CME price action held above a Rising Window on a closing basis. Holding above here continues to prove important.
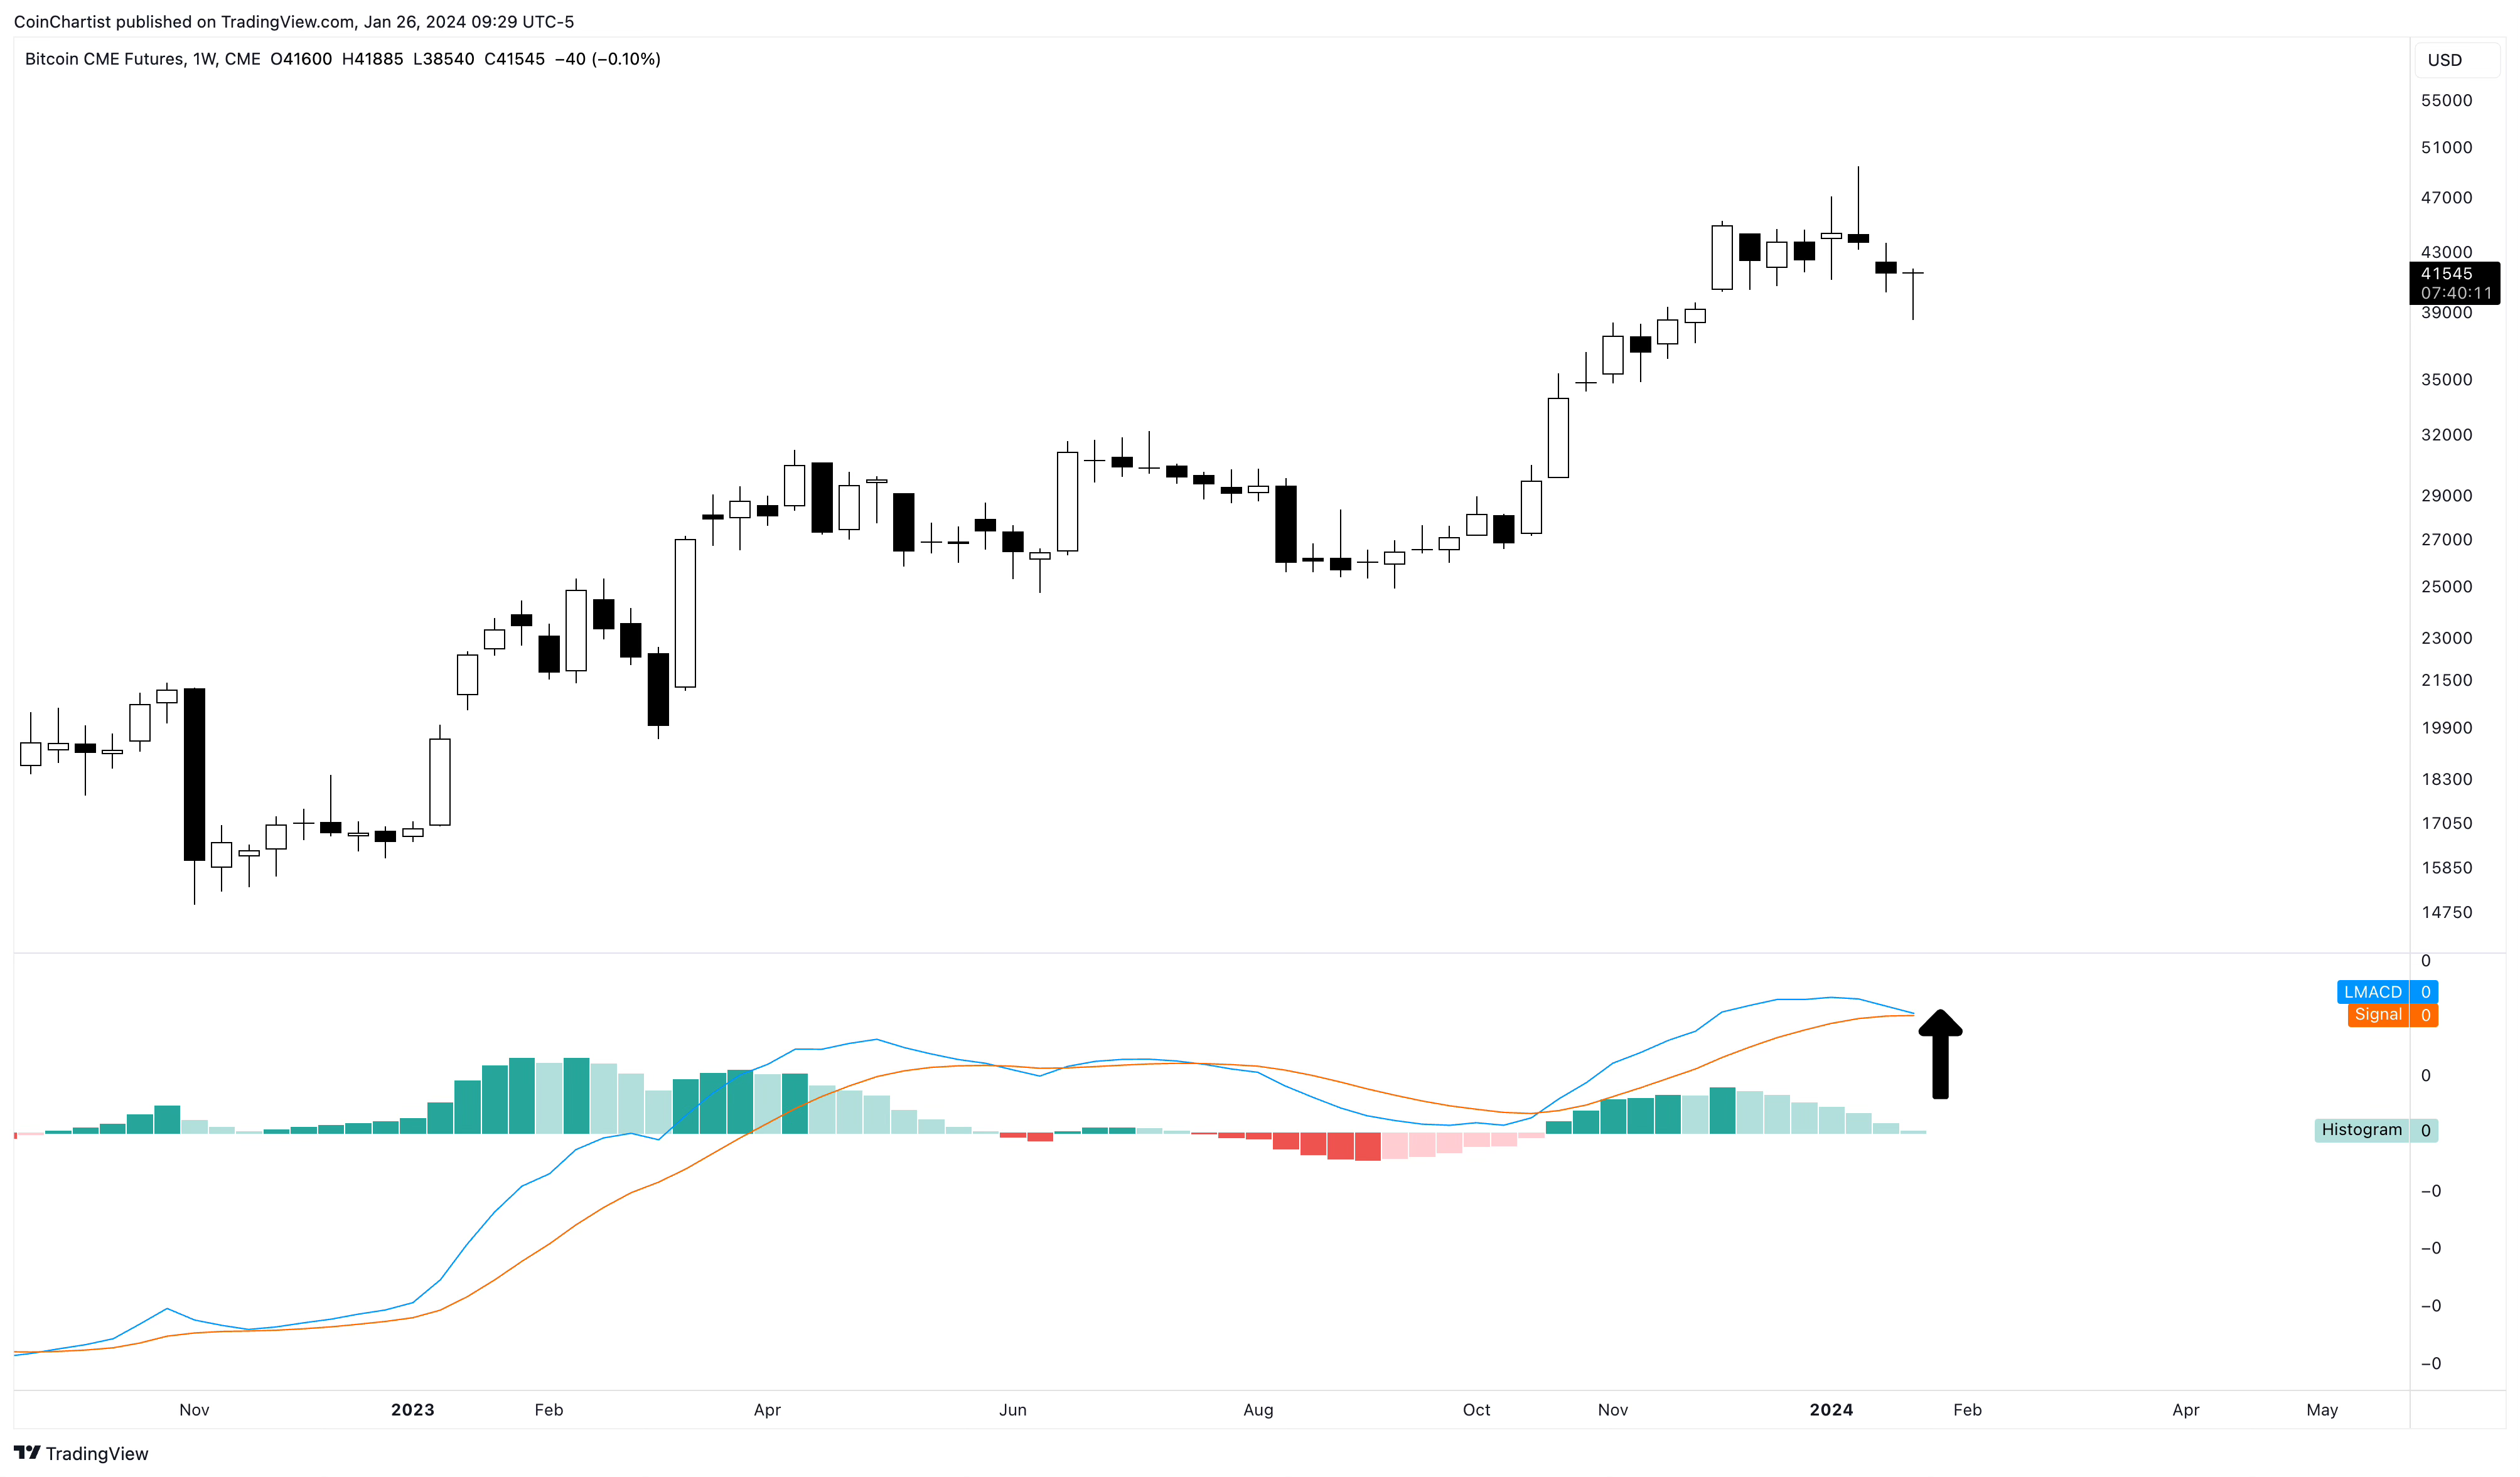
This strong and sudden bullish reaction is happening right as the weekly LMACD was crossing bearish. Diverging upward suggests increasing bullish momentum, which is exactly what Bitcoin and the rest of the crypto market needs for continuation without further correction.
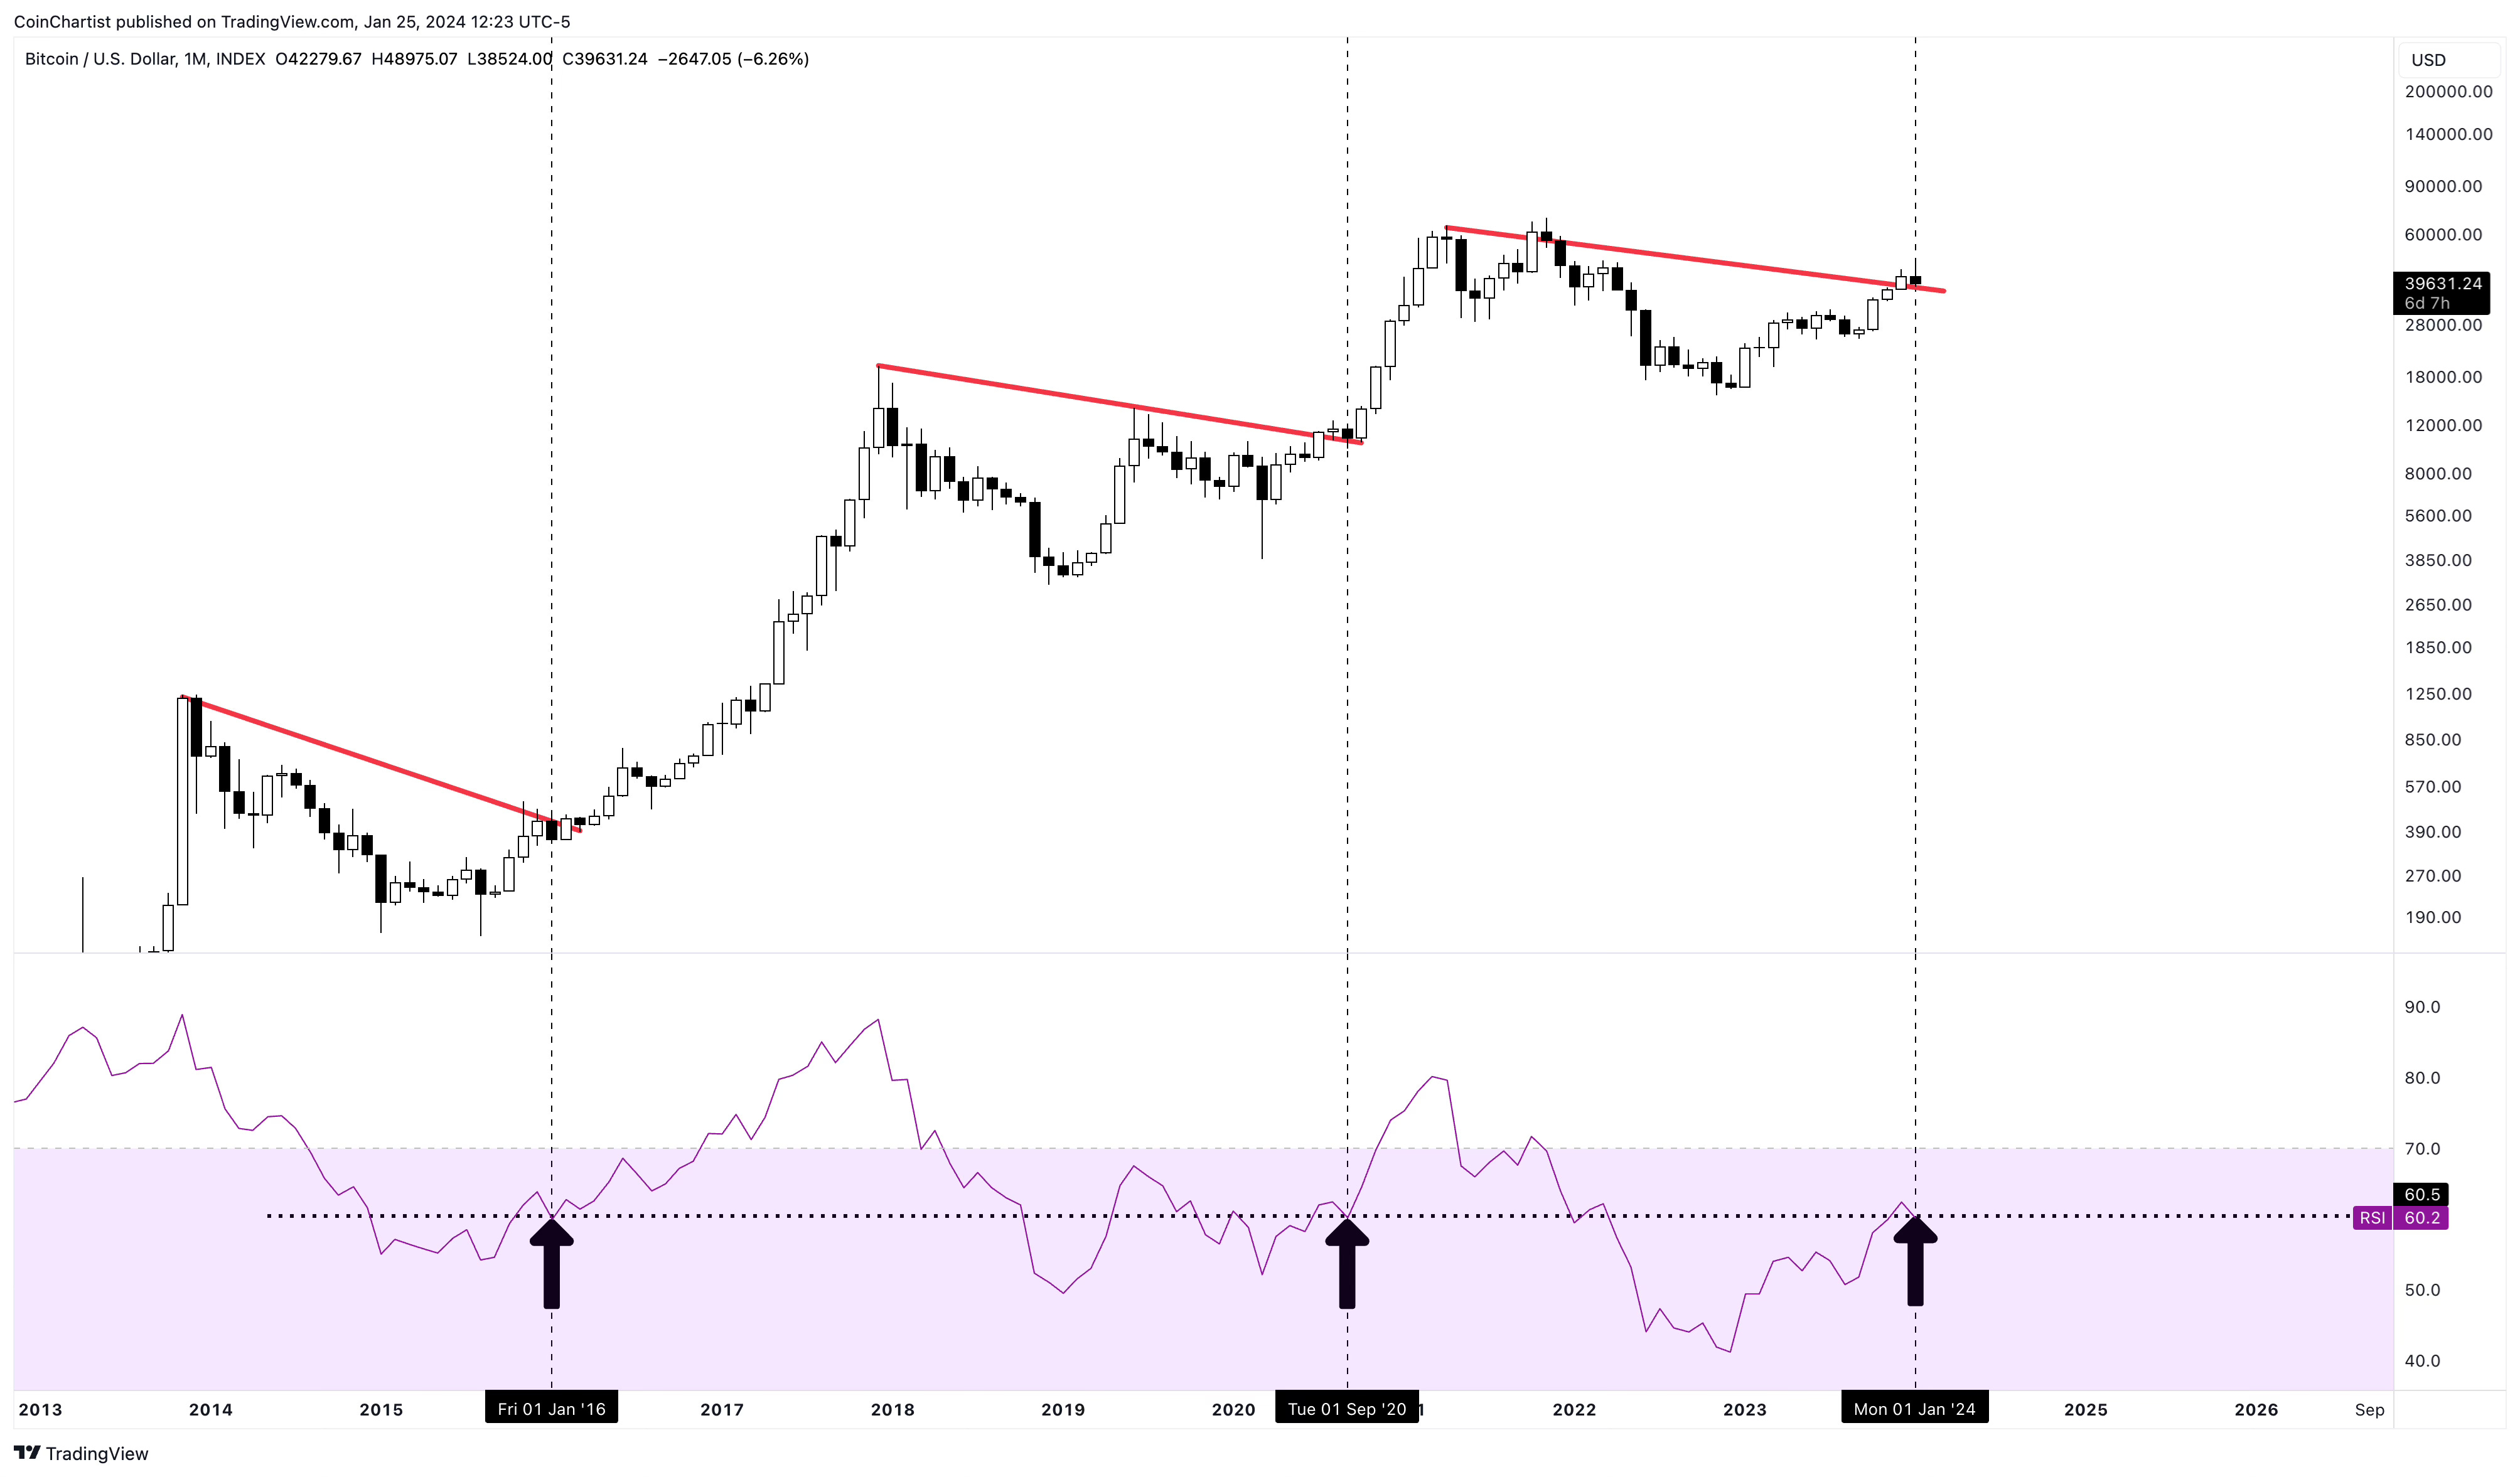
The Relative Strength Index is another momentum measuring tool. On the monthly timeframe, the log-space RSI is retesting the 60 level. Holding above 60 on an RSI retest has sent BTCUSD into overdrive and led to the most bullish advances ever.
Learn more about the Relative Strength Index here.

All CoinChartist VIP subscribers get access to premium technical indicators. [Note: Please contact the email address at the end of the newsletter with your TradingView username if you are missing access.]
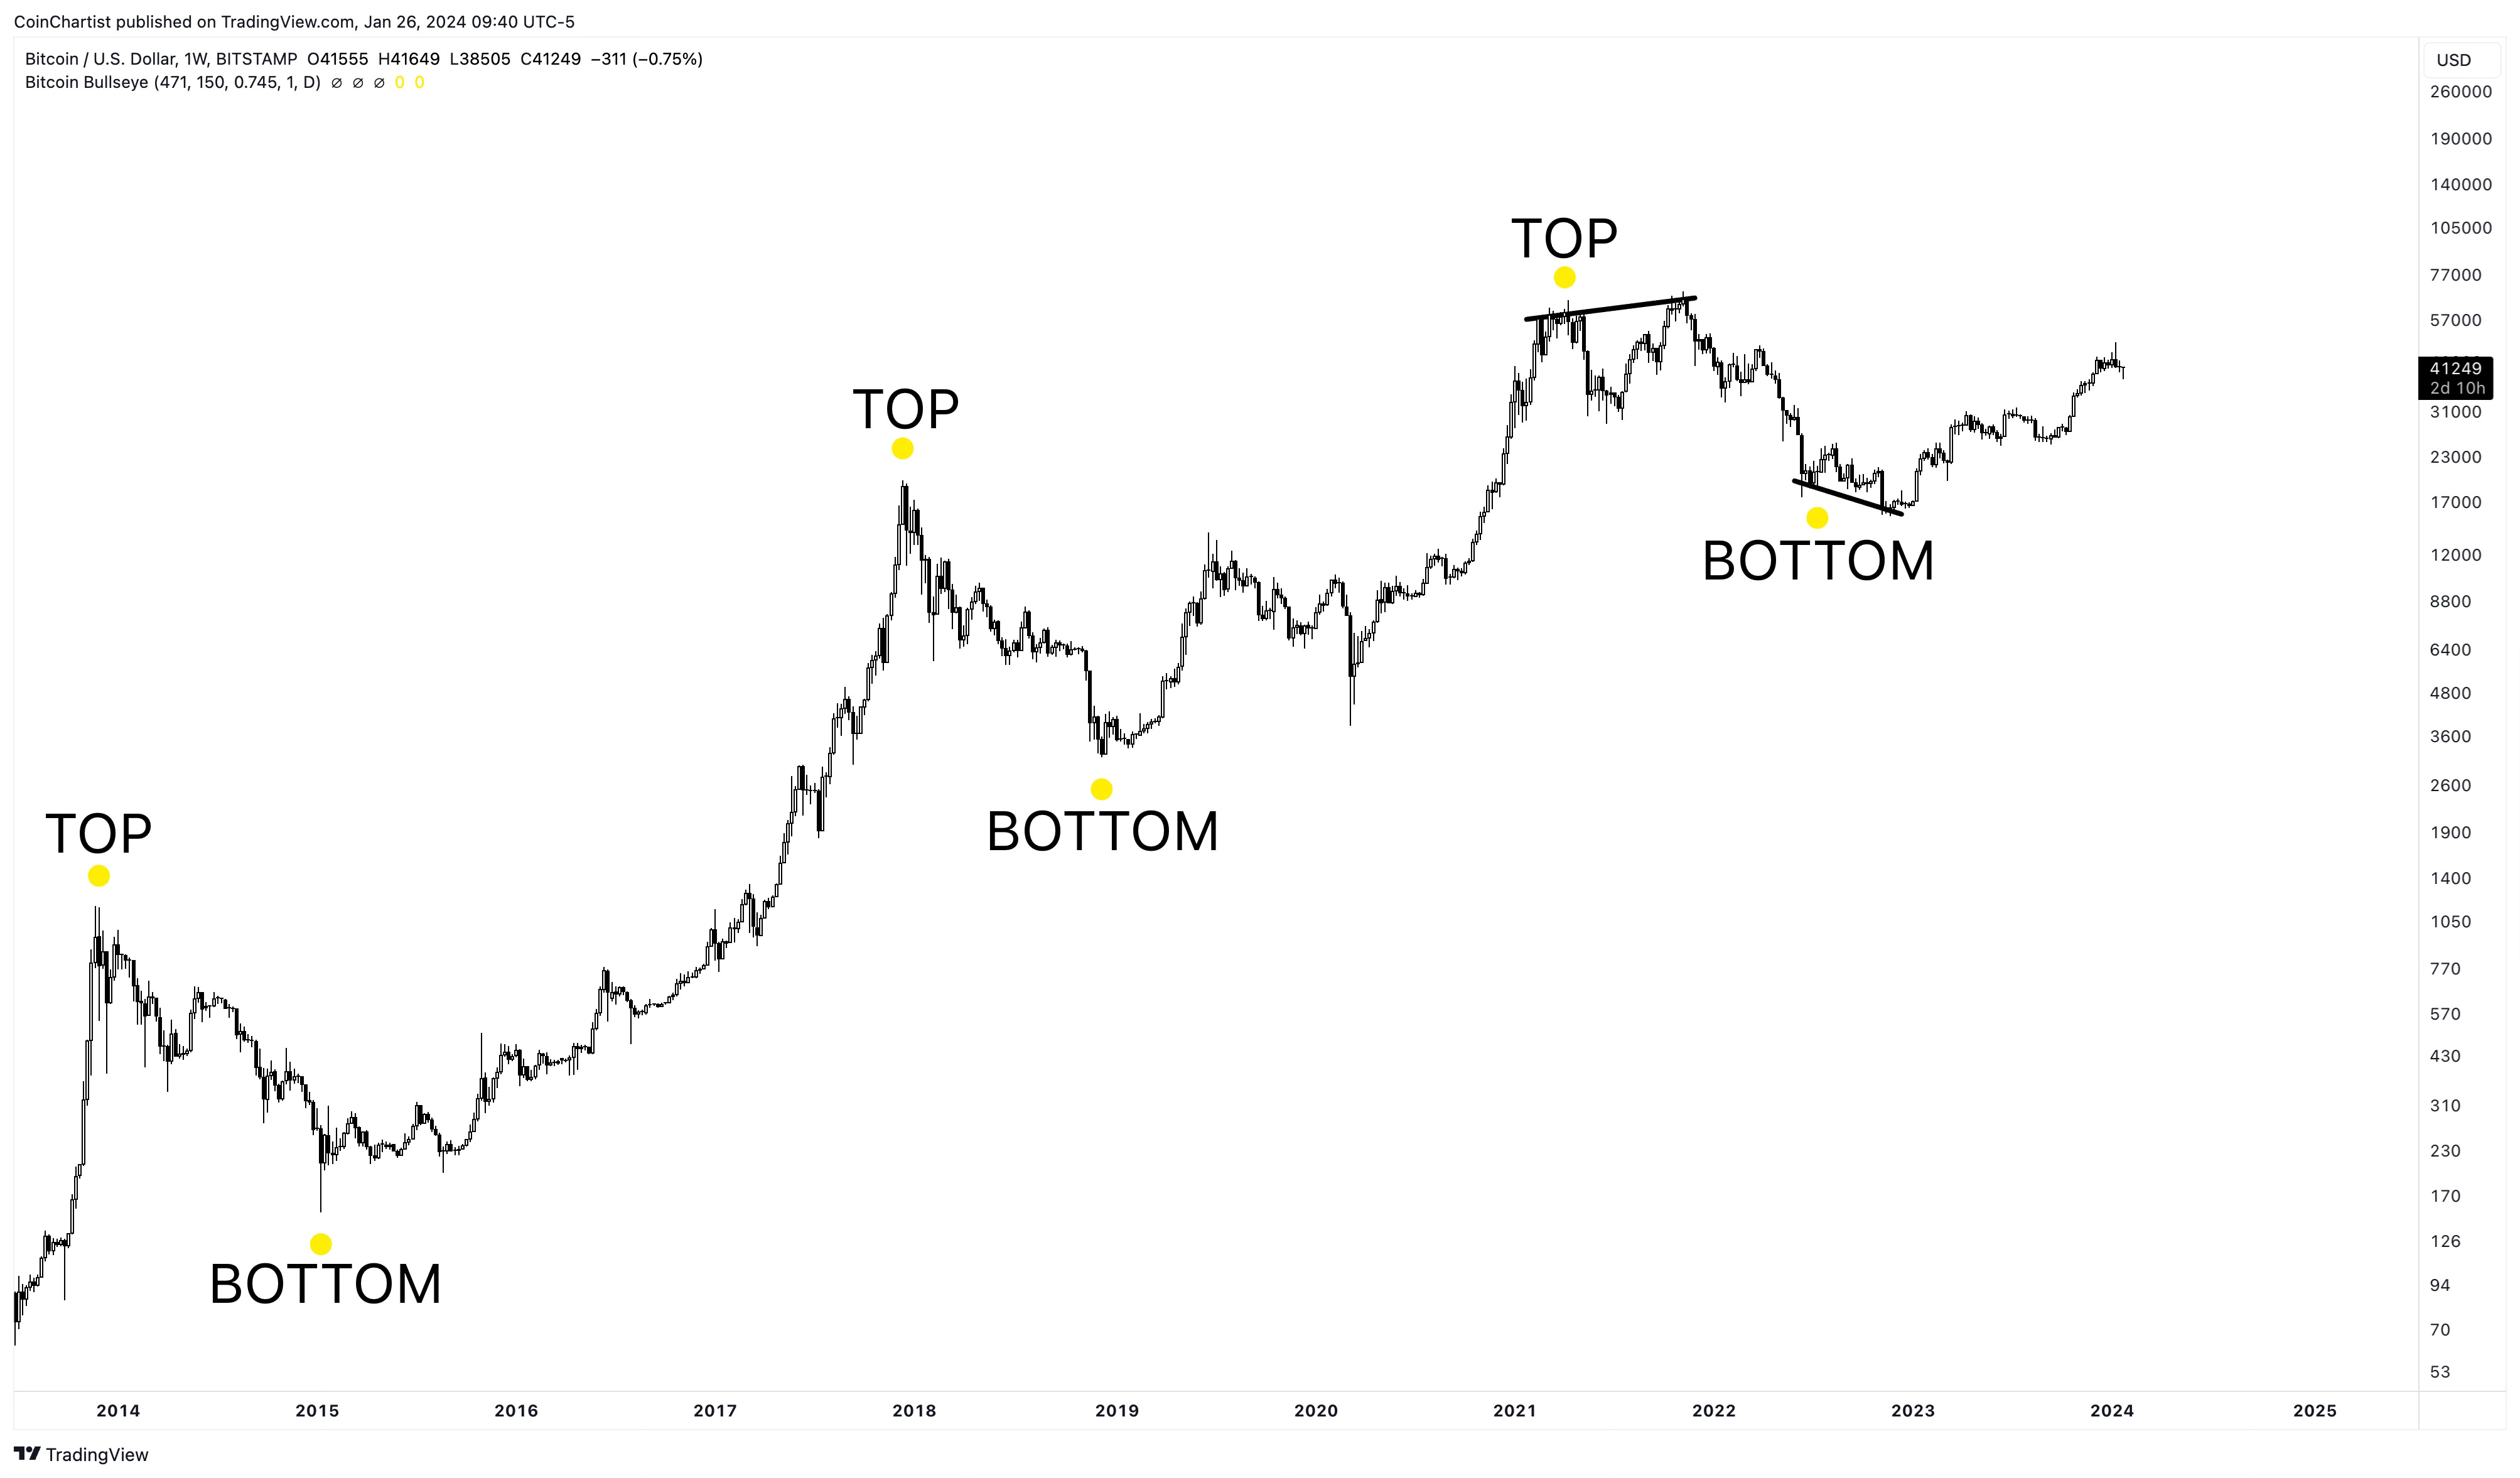
Among those tools are the Bitcoin Bullseye, which was designed to assist with scaling in and out of BTC positions. It is sensitive to divergences, so it is positioned as a tool for scaling in/out versus sniping a top or bottom. But it is more bound to give an early signal, not a late one – and despite what the sentiment might tell you, there is no top signal in sight.
Altcoins are always more volatile than Bitcoin. When Bitcoin sells off, altcoins can suffer 2-3x the damage in drawdown. But the recent corrections across these riskier crypto assets are appropriate after the outsized returns they provided in late 2023. Most signs point to continued to strength in altcoins throughout the year.
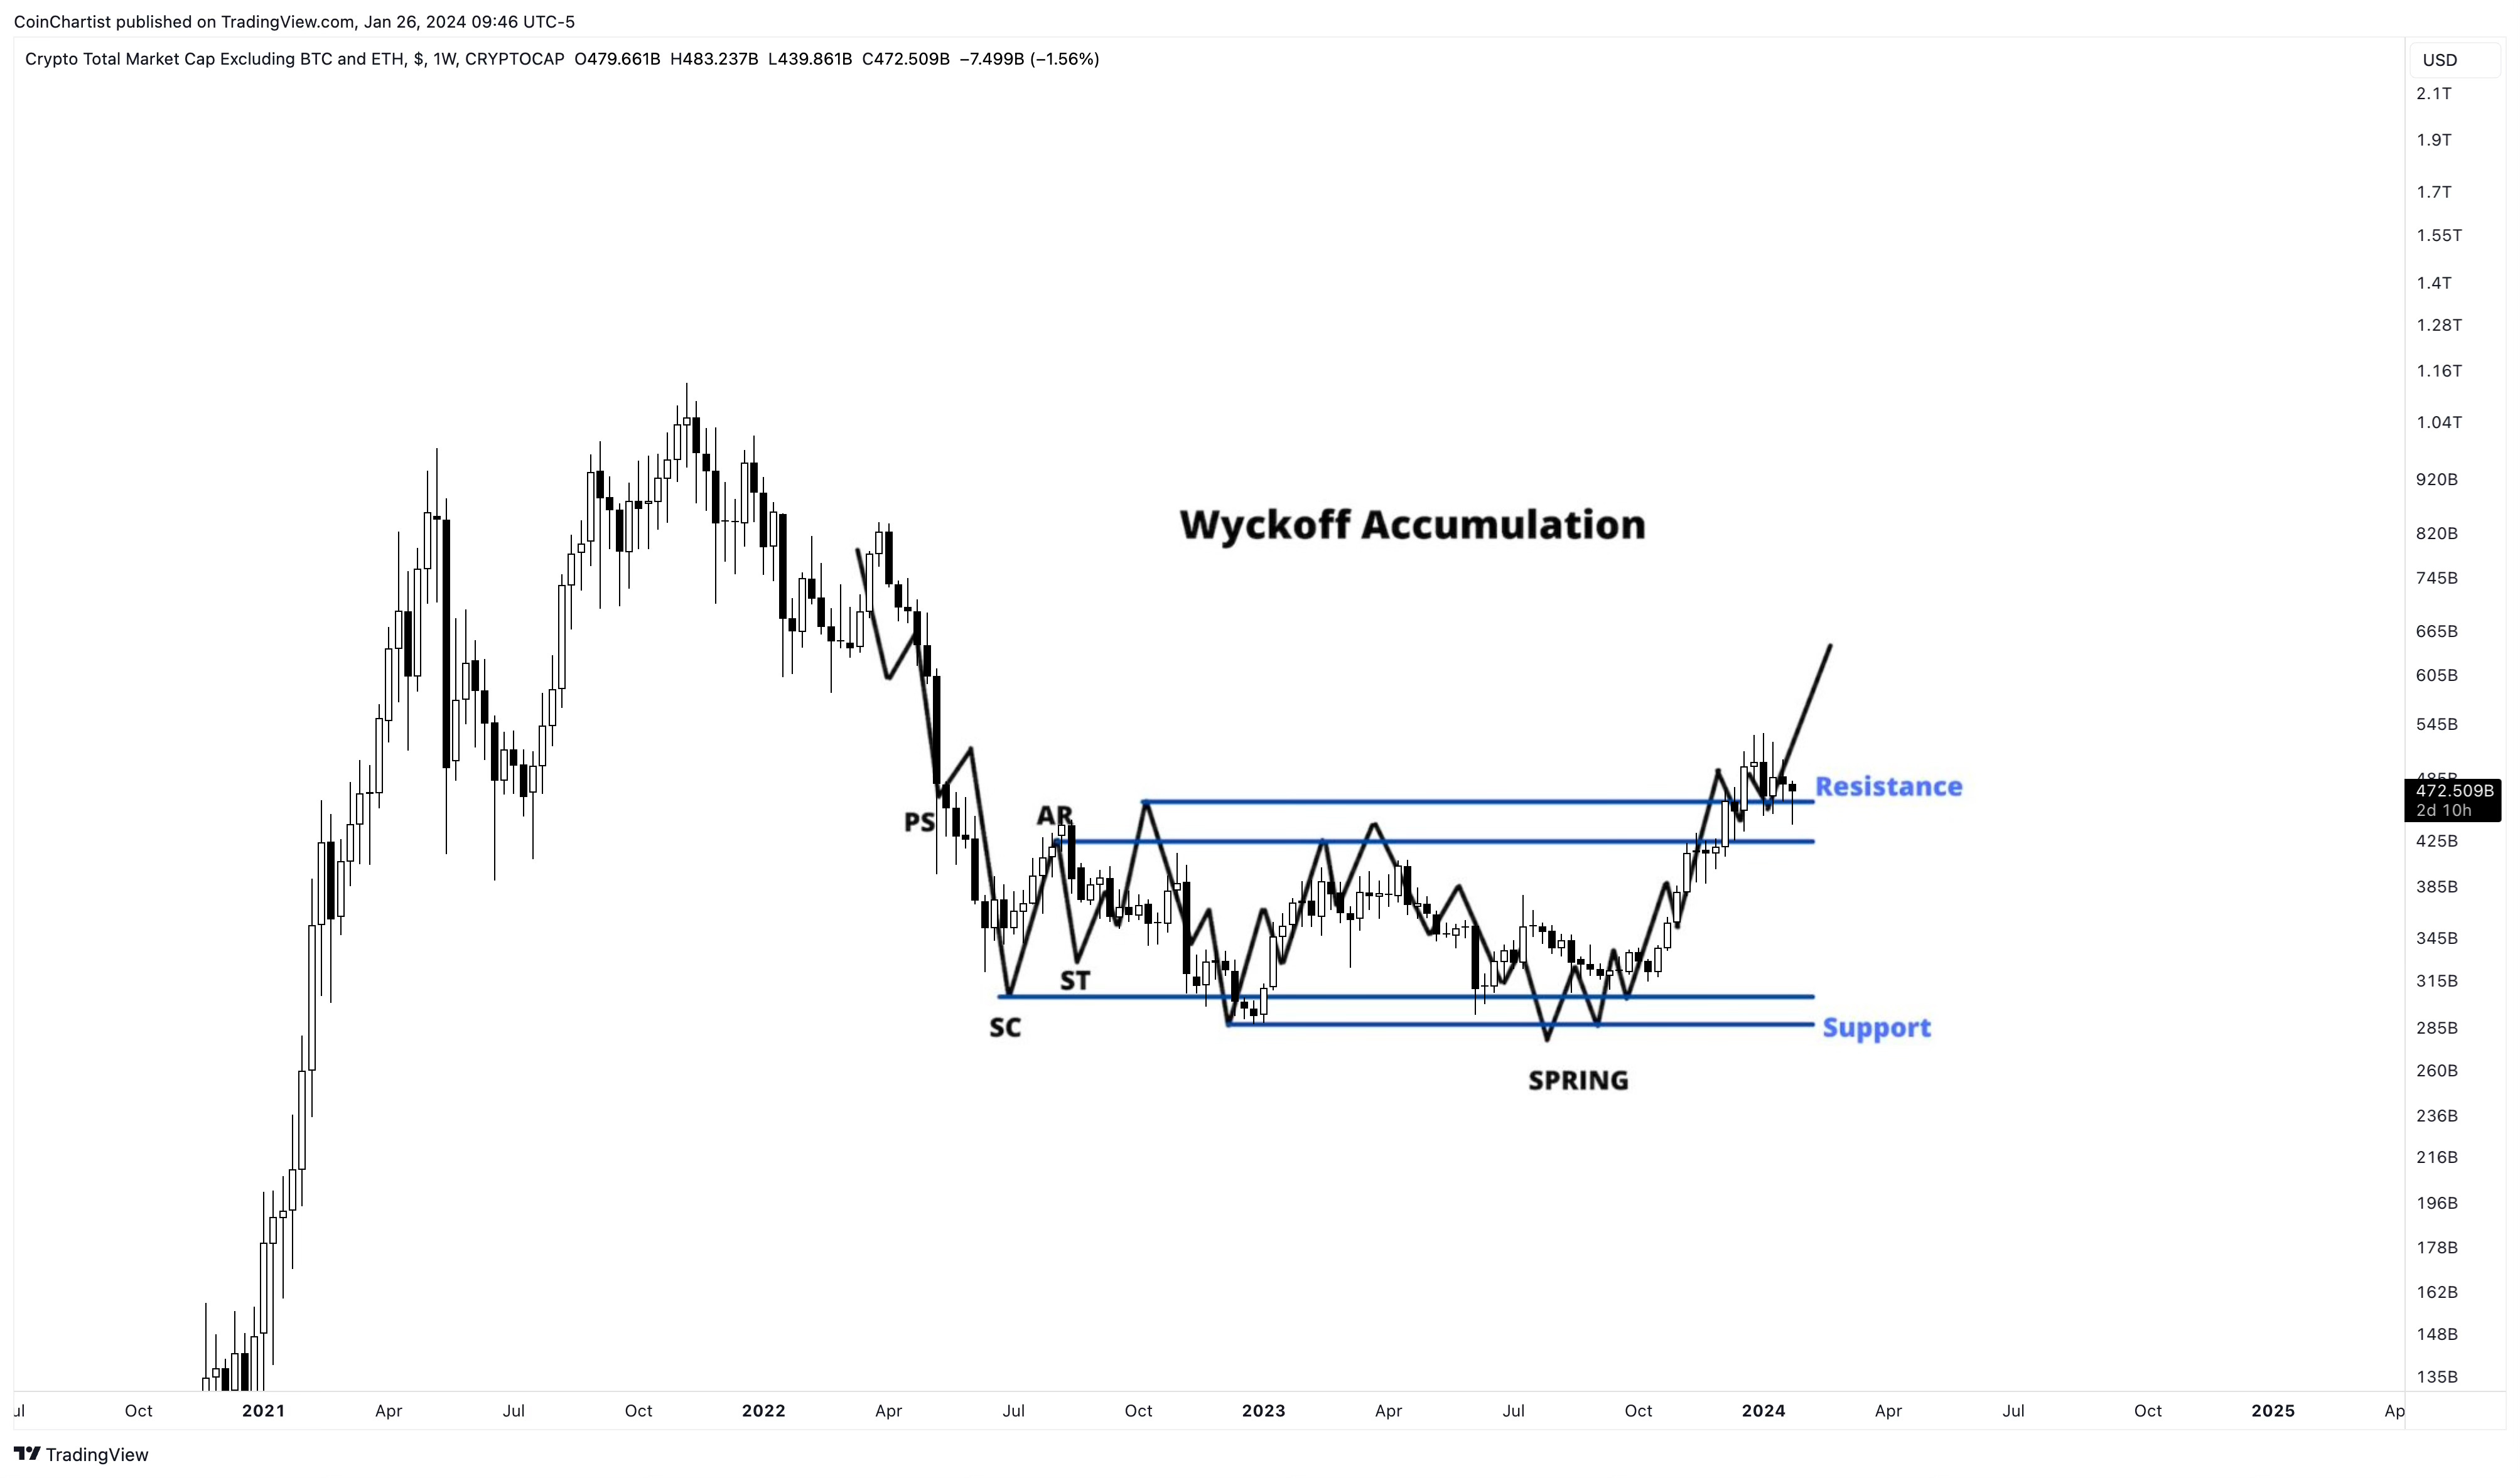
The price action in the TOTAL3 crypto market cap sans BTC and ETH so perfectly resembles the Wyckoff Accumulation schematic that I simply pasted it over the chart versus drawing it out. The same Dragonfly Doji is forming here, right at what would be the highest resistance level now turned support. If this is indeed accumulation in alts, things should pick up soon enough.
That’s it for free content. Beyond the paywall is the following content:
A brand new altcoin pick from the VIP community
Soaring stock market and a death cross in the dollar
The most in-depth Wave Watch in months w/ updated wave counts
Remember, a premium subscription comes with access to custom technical indicators like the Raging Bull, Trend Wrangler, and more.

Note: ONLY CoinChartist (VIP) Founding Member Coin NFTs remain! Sign up for the Founding Member subscription through Substack to secure your favorite. Above you’ll find a list of all currently available coins. Founding Member Coins enable access to a VIP Telegram channel, 1-on-1 TA training with Tony, and more.
Keep reading with a 7-day free trial
Subscribe to CoinChartist to keep reading this post and get 7 days of free access to the full post archives.