#42 | Bearish Interruption
Is a monthly Bearish Engulfing and other signals enough to put an end to the bull run?
Disclaimer: The information provided in this Substack newsletter is for general informational purposes only and should not be considered as financial advice. Investing involves risk, and past performance is not indicative of future results. Please conduct your own research or consult a financial advisor before making any investment decisions. The newsletter disclaims any liability for losses or damages arising from the use of this information.
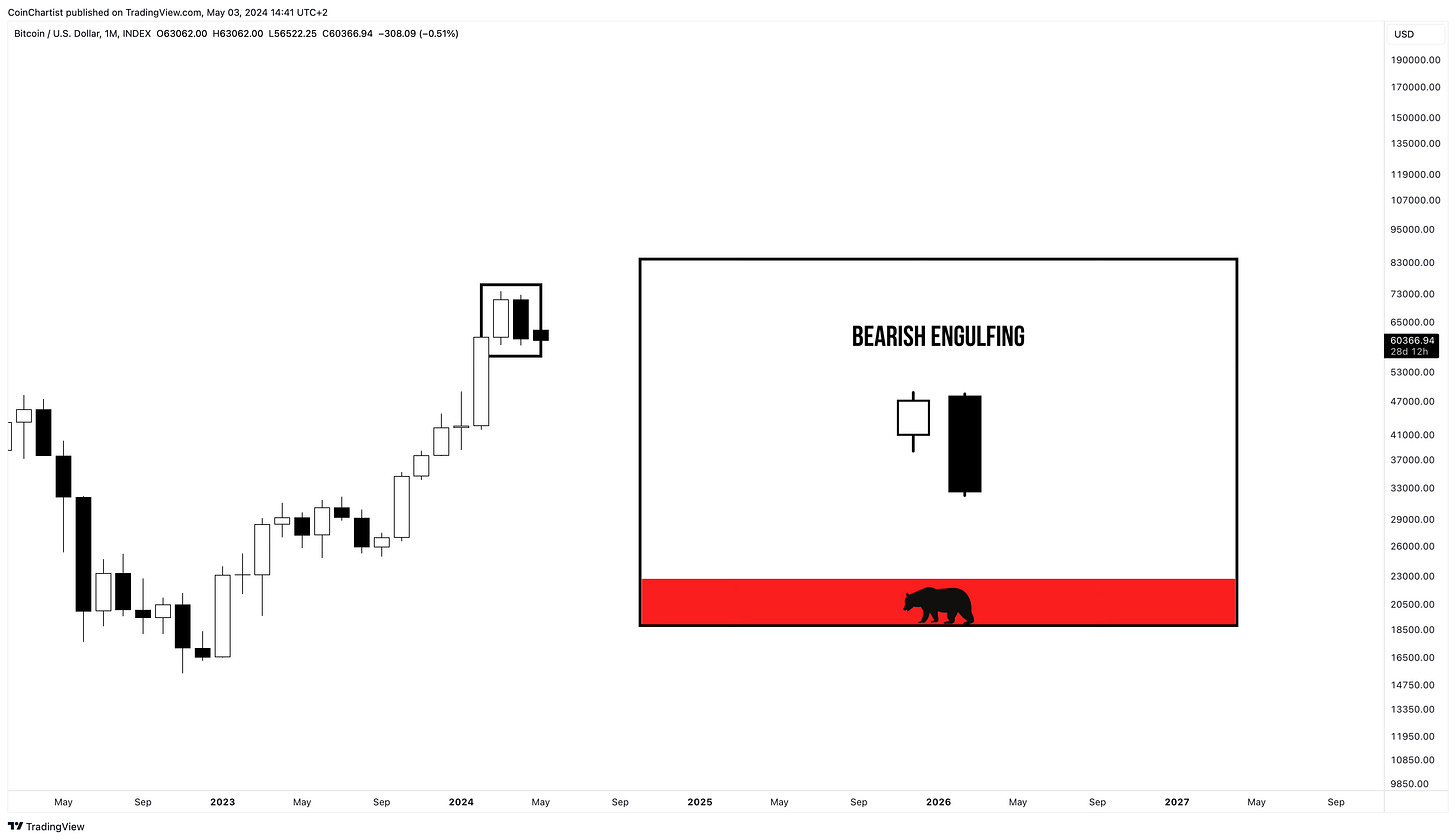
This week, Bitcoin suffered a larger correction down to as low as $56,500. Doing so caused April 2024’s monthly candle to close as a Bearish Engulfing. Worse yet, the potential bearish reversal pattern was accompanied by several topping signals in Bitcoin on higher timeframes. This issue explores the variety of bearish signals, provides some bullish counters, and the goal is to help you make decisions for yourself as to what might unfold in the next several months.
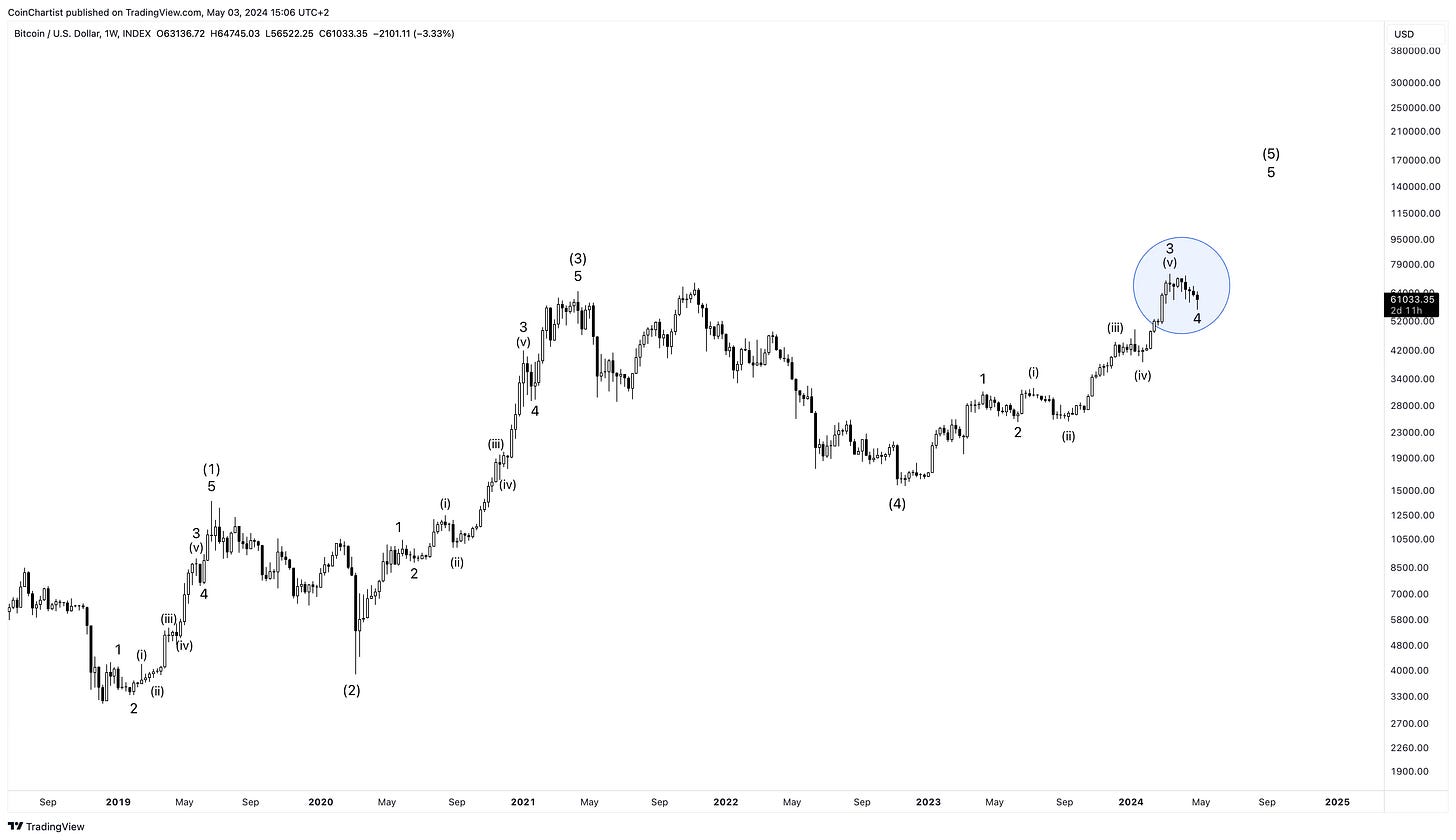
To begin this issue, let’s recap the topic from last week’s issue: Wave 4. As was discussed, Wave 4 is a “surprising disappointment” and there’s no denying that market sentiment reflects this. Usually at market tops, there is euphoria and enthusiasm that blinds investors to the major correction that is about to occur. I don’t think we saw that, so as an Elliott Wave Principle practitioner, I still believe the above is valid and we’ll see wave 5 of (5) play out in the next few months, causing the cyclical peak in Bitcoin.
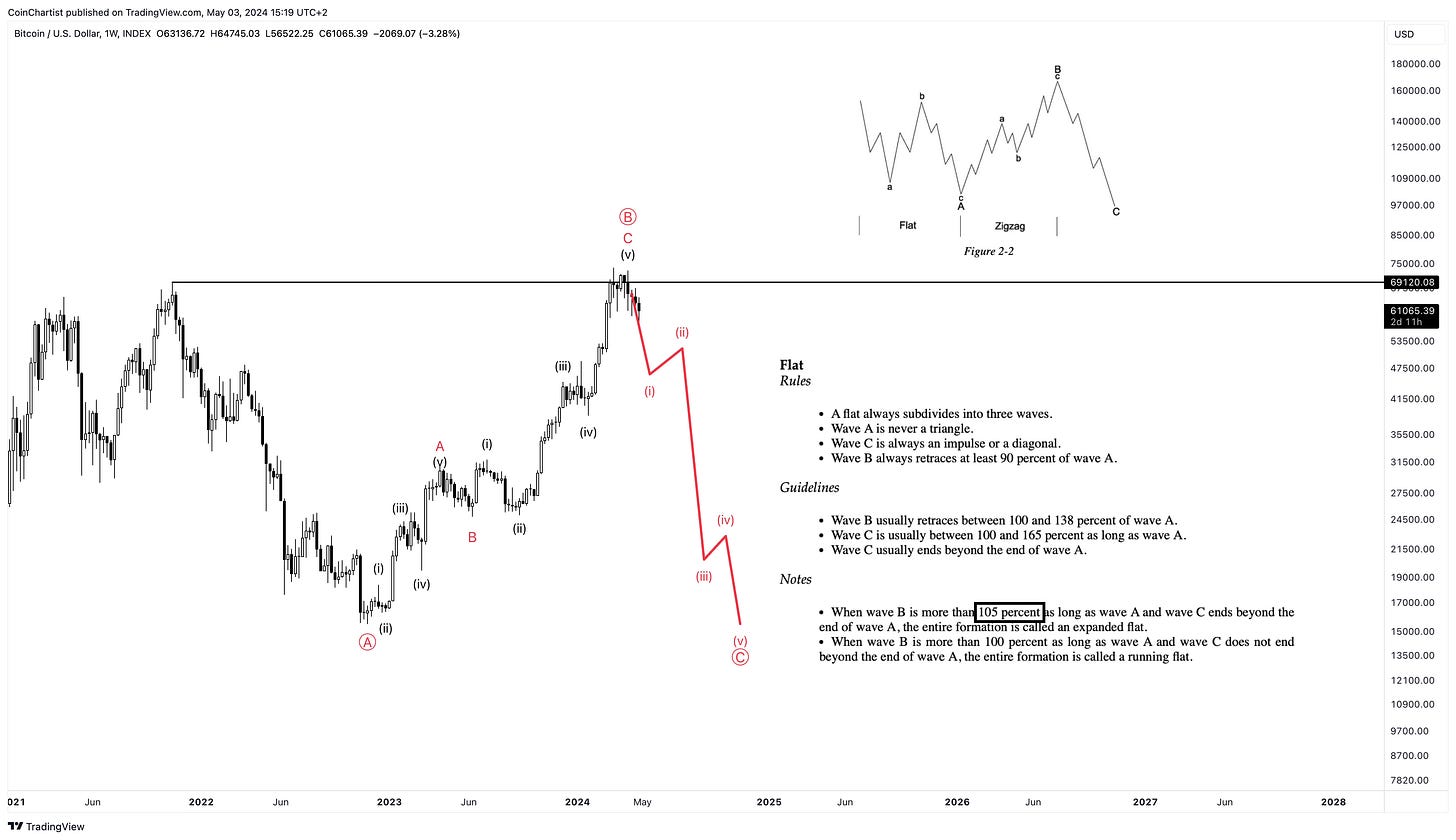
Because of what is to follow in the rest of this issue, I am sounding the alarm on what a bearish alternative count could look like. There are many bearish signals firing on the higher timeframes, which caused me to look more closely at bearish wave counts. Bitcoin price recently reached a 2024 high of $73,747. Back in November 2021, the high was set at $69,120. Simple math tells us that the current 2024 high is 106% that of the 2021 high. This is the part that strikes me as significant. If you look closely at the notes of an Expanded Flat pattern, Wave B typically exceeds 105%. We have 106%. If Bitcoin doesn’t make a new high in 2024, expect a possible revisit to lows around $18,000, if not even lower around $14,000. This feels extreme from a fundamental perspective, however. Matching the wave counts with Figure 2-2 in the upper area of the chart gives us a pattern that looks frighteningly close to what BTCUSD is doing now.
In conclusion, if Bitcoin fails to move into a Wave 5 and make a new higher high in 2024, there’s at least some likelihood that the crypto market moves into another, sharper downtrend. Currently, I give the bullish scenario around a 70% probability, while the bearish scenario gets a 30% probability. You must be ready for both scenarios.
Moving along to the bearish signals I referenced to start this issue. The most significant is a Bearish Engulfing on the monthly. Part of why I was primarily leaning bullish was due to higher timeframe signals being bullish. But this Japanese candlestick pattern is a clear interruption of the bullish streak we've seen for the last seven months. A Bearish Engulfing is a bearish reversal pattern.
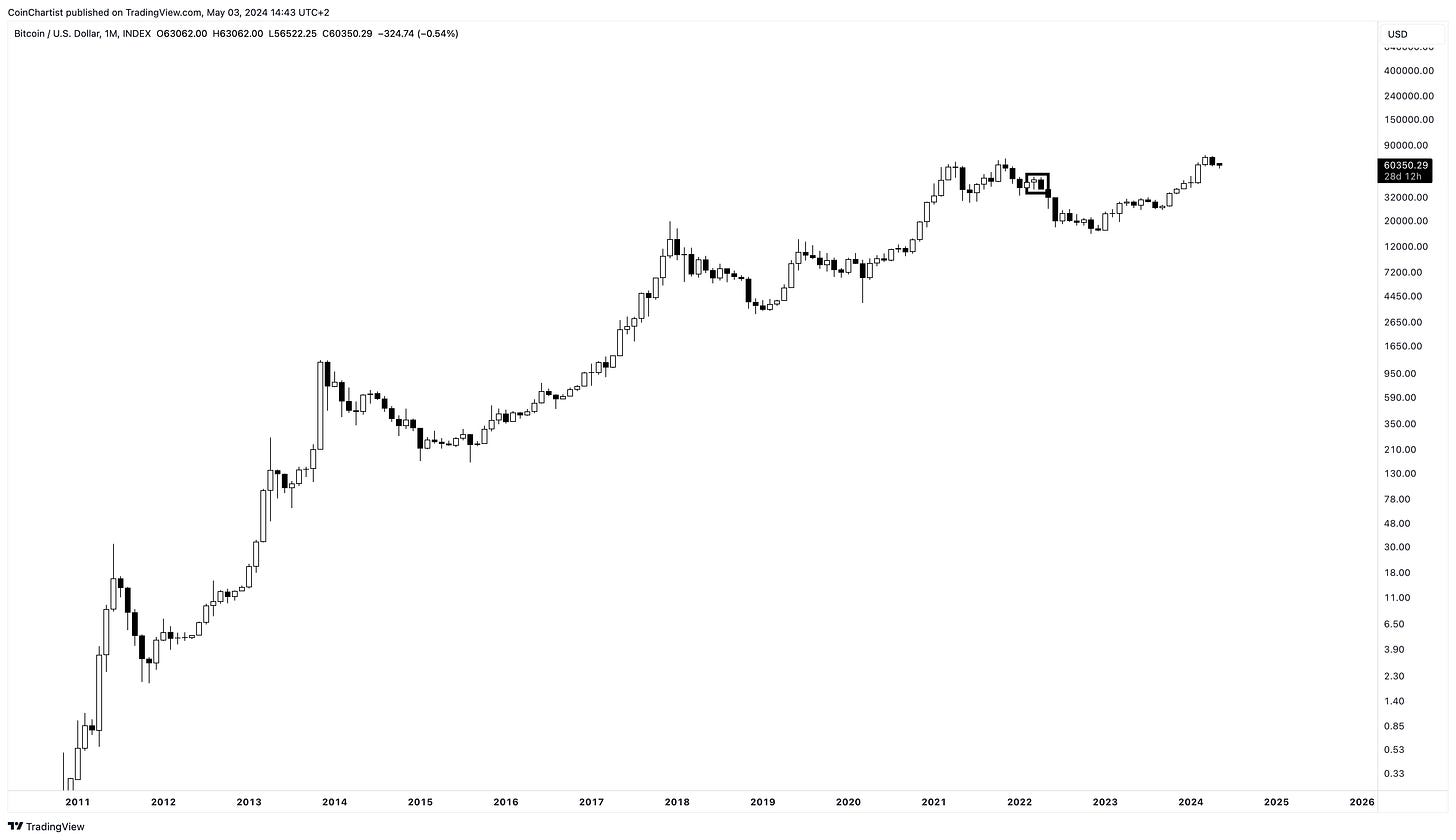
Looking at over 160 months of BTCUSD price action, this month is the only Bearish Engulfing candlestick I could find. Highlighted in the tiny box, April 2022 may have been a Bearish Engulfing pattern, but it isn’t as clean as what we’re seeing in April 2024. Although a Bearish Engulfing is a potential reversal pattern, what comes next in May is even more important and telling. If bulls can put in a bullish candlestick next, the bearish reversal might have failed. It is also worth noting that such a bearish reversal signal can arrive early, warning of a potential reversal over the next several candlesticks. Finally, a Bearish Engulfing, or any candlestick signal for that matter, has more weight when combined with technical indicators.
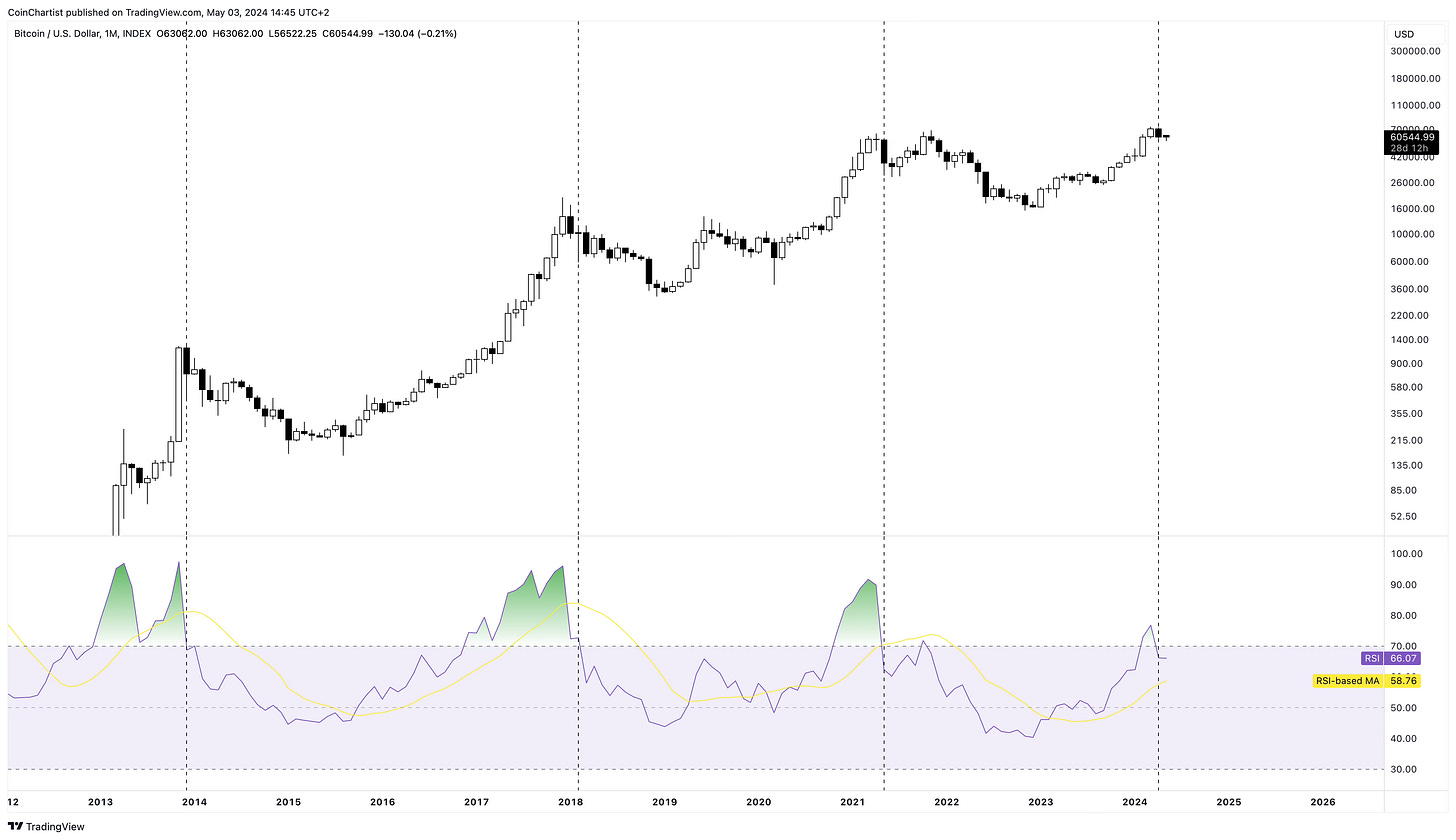
But this also isn’t a positive for Bitcoin and is overall a mixed bag. Covered two issues ago, the monthly Relative Strength Index has fallen back below 70 after April’s nasty close. In all previous instances, dropping below 70 has caused a bear market in Bitcoin. This time would have to be different to avoid a continued downtrend from here.
Keep reading with a 7-day free trial
Subscribe to CoinChartist to keep reading this post and get 7 days of free access to the full post archives.


