Issue #9 | A Wake Up Call For Crypto
Bitcoin begins to move, plus a morning star pattern forms in altcoins.
Welcome to issue #9 of CoinChartist (VIP). This week’s drop includes:
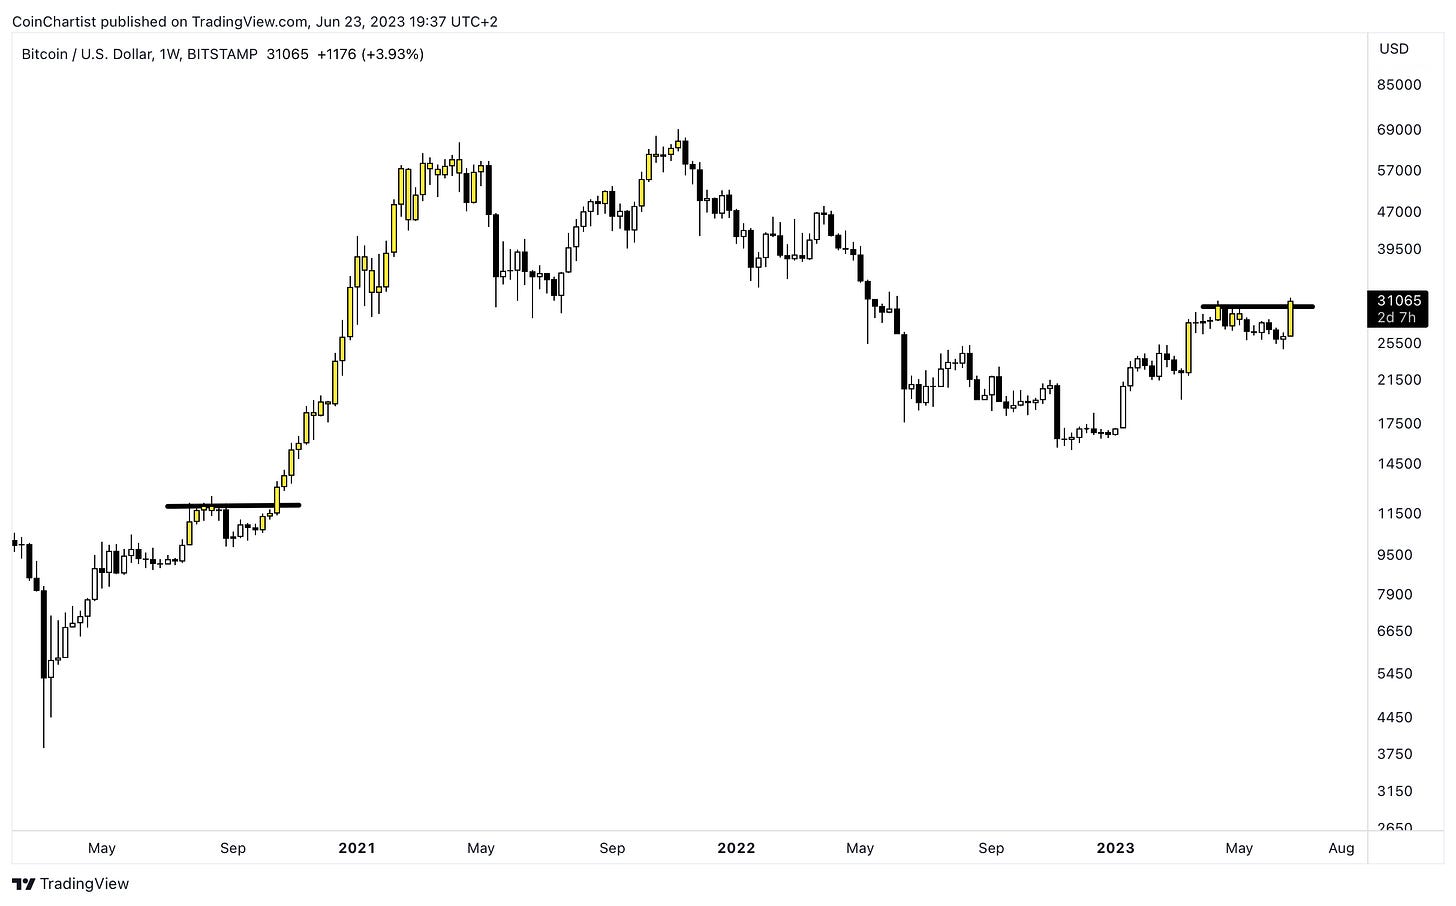
Bitcoin makes a big move, and why momentum should continue
An update on CoinChartist (VIP) technical indicators
Macro charts putting Bitcoin against gold, the dollar, and US Interest Rates
Wave counts and when to expect new ATHs in Bitcoin
Have altcoins bottomed? Signals to consider
A lesson on the morning star reversal pattern
Please subscribe for premium and support CoinChartist.io, or share CoinChartist (VIP) with friends and family. You can also follow CoinChartist on YouTube and Twitter. Don’t forget to also like and comment to let us know how we’re doing.
Bitcoin made a roughly 17% move this week, along with a higher high on daily timeframes and a new 2023 record.
The chart above represents BTCUSD on various timeframes, including 1D, 3D, 1W, 2W, 3W, and 1M. On each of these, Bitcoin is crossed bullish on the LMACD. Everything but the monthly shows the LMACD at or above the zero line. As the lagging indicator pushes above the zero line it signals strengthening momentum— and momentum tends to persist.
Learn more about the LMACD.
The monthly Ichimoku is also a notable mention. BTCUSD appears to be narrowly evading a close through the cloud, instead using the spans as support. Another noteworthy aspect of this chart is that the Tenkan-sen and Kijun-sen remain crossed bullish unlike past cycles.
Learn more about the Ichimoku.
BTCUSD has reclaimed and begun moving away from the 50-month moving average, after retesting it as support. Although historically it held as a bottom, it was lost for the first time in June 2022 and spent eight months below it. One year later, there is a strong chance price doesn’t trade below there again before the next major cycle peak.
The next several charts feature the monthly Bollinger Bands, starting with BTCUSD. Bitcoin is currently above the basis line — a 20-period SMA. When price passes through it from below, the upper Bollinger Band is tagged in the months that follow. There is roughly a week left before the June monthly closes, which is necessary to confirm the signal. The upper band is currently located at $52,000.
The next series of macro charts put BTCUSD up against other assets to seek further confirmation of bullish behavior in Bitcoin.
The above chart might look like an inverted BTCUSD chart, but rather it is the XAUBTC ratio, putting Gold up against Bitcoin. A confirmed close of the monthly below the mid-BB has always led to tapping the lower Bollinger Band. In this case, this move would represent a new ATH in Bitcoin priced in Gold, or a new ATL on the XAUBTC chart.
Learn more about Bollinger Bands.
No, you aren’t seeing double, and I haven’t made a mistake. Upon closer inspection you’ll see some unique facts about the DXY/BTCUSD chart compared to Gold above. In Gold, Bitcoin is just now pushing beyond the mid-BB. In contrast, the DXY version has retested the basis for several months and it has held. Three full months above or below the basis tends to confirm the signal with further confidence. This chart was first featured in Issue #3.
The above chart is an unusual one, putting BTCUSD against US Interest Rates. After COVID, Interest Rates spiked, skewing the chart. The sharp Interest Rate increases by the US Fed sent price action back down to both diagonal uptrend and horizontal support. After several months holding, this chart has started to move back upward just as the Fed has paused hikes for the first time since hiking began.
Here is a quick update on CoinChartist (VIP) technical indicators, which are proving to work as advertised.
The Raging Bull signal is back, signaling that the recent correction may have ended and suggests Bitcoin could move fast and furious to new highs
Ethereum has formed two bullish reversal signals each time the Trend Wrangler was retested. Also note how it acted as resistance ahead of a large crash. It’s possible to see something similar to the upside.
Remember: You can unlock these tools by upgrading to a premium membership below.
That’s it for this week’s free content. Behind-the-paywall content includes:
Wave counts and when to expect new ATHs in Bitcoin
Have altcoins bottomed? Signals to consider
A lesson on the morning star reversal pattern
Please subscribe for premium and support CoinChartist.io, or share CoinChartist (VIP) with friends and family. You can also follow CoinChartist on YouTube and Twitter. Don’t forget to also like and comment to let us know how we’re doing.
Keep reading with a 7-day free trial
Subscribe to CoinChartist to keep reading this post and get 7 days of free access to the full post archives.


